 Chantle R. Edillor
 Brian W. Parks
 Margarete Mehrabian3
 Aldons J. Lusis
 Matteo Pellegrini
- 1Department of Human Genetics, University of California, Los Angeles, Los Angeles, CA, United States
- 2Department of Nutritional Sciences, University of Wisconsin-Madison, Madison, WI, United States
- 3Department of Medicine/Division of Cardiology and Department of Human Genetics, University of California, Los Angeles, Los Angeles, CA, United States
- 4Department of Molecular, Cell, and Developmental Biology, University of California, Los Angeles, Los Angeles, CA, United States
Responses to a high fat, high sucrose (HFHS) diet vary greatly among inbred strains of mice. We sought to examine the epigenetic (DNA methylation) changes underlying these differences as well as variation in weight loss when switched to a low-fat chow diet. We surveyed DNA methylation from livers of 45 inbred mouse strains fed a HFHS diet for 8 weeks using reduced-representation bisulfite sequencing (RRBS). We observed a total of 1,045,665 CpGs of which 83 candidate sites were significantly associated with HFHS diet. Many of these CpGs correlated strongly with gene expression or clinical traits such as body fat percentage and plasma glucose. Five inbred strains were then studied in the context of weight loss to test for evidence of epigenetic “memory.” The mice were first fed a HFHS diet for 6 weeks followed by a low-fat chow diet for 4 weeks. Four of the five strains returned to initial levels of body fat while one strain, A/J, retained almost 50% of the fat gained. A total of 36 of the HFHS diet responsive CpGs exhibited evidence of persistent epigenetic modifications following weight normalization, including CpGs near the genes Scd1 and Cdk1. Our study identifies DNA methylation changes in response to a HFHS diet challenge that revert more slowly than overall body fat percentage in weight loss and provides evidence for epigenetic mediated “memory.”
Introduction
Epigenetic regulation, such as DNA methylation, was hypothesized and recently confirmed to play a role in the development of obesity in humans and rodents (1). The interactions between diet, genetic background, and epigenetic regulation are becoming better understood, with evidence suggesting that DNA methylation can be a causal factor in obesity (2). In rodents (where the effect of environment is more controlled), studies have identified specific DNA methylation changes in the liver at genes involved in metabolism (Scd1, GK/glycerol kinase, L-PK/L-pyruvate kinase, Mttp) as well as cell-cycle regulation (Cdkn1a) (3–6). Additional evidence suggests that human DNA methylation changed by as hepatic insulin resistance. Caloric restriction in humans and mice protects against aging associated pathologies like type 2 diabetes, heart disease, and hepatocellular carcinoma, while obesity increases this susceptibility (7–9). These changes are known to be mediated in part by DNA methylation, a biomarker reproducibly associated with chronological aging. These variable epigenetic loci are often used to fit tissue-specific biological clocks of “epigenetic aging” in association with biometrics like body mass index (BMI) (10). Obesity-associated DNA methylation changes have been also been observed to accelerate “epigenetic aging” in the liver and are not acutely reversible by interventions like bariatric surgery (10–12).
A clinically relevant aspect of such studies relates to the context of weight loss and whether the effects of dietary challenge and obesity remain. In human surveys of DNA methylation during weight loss, it was observed that modest but widespread changes to DNA methylation were found near known obesity and diabetes genes in liver and adipose (13). Other studies identified DNA methylation differences near known obesity genes predicting high or low responses to therapies like caloric restriction, exercise, or surgical interventions (14–21). It has been hypothesized that these methylation changes may be involved in a “memory” mechanism of weight-regain or persistent accelerated epigenetic aging after weight loss (22). Studying chromatin accessibility using FAIRE-seq in a mouse model of diet-induced obesity, Leung and colleagues observed strain specific evidence for “memory” using a weight loss study design (23). On the other hand, Siersbaek and colleagues found no evidence for epigenetic memory following 8 weeks of weight loss as assessed by H3K27Ac marks (24).
Here, we surveyed a large panel of genetically diverse inbred strains of mice previously shown to vary in response to a high-fat, high-sucrose (HFHS) diet using reduced-representation bisulfite sequencing (RRBS). We previously profiled the methylomes of over 100 strains on a chow diet to identify genetic variation influencing liver DNA methylation (25). To study the effect of diet on liver methylation patterns, we performed RRBS in a subset of strains after 8 weeks of obesity. The liver is a relevant tissue in obesity studies as it coordinates with adipose tissue to regulate glucose, insulin, and lipid levels. In human studies of epigenetic aging across various tissues, only the liver showed a significant correlation between accelerated epigenetic aging and BMI (10). Our analysis resulted in the identification of 83 CpGs corresponding to 62 loci exhibiting significant changes in methylation in a majority of strains in response to diet. We then asked how these sites respond to a reversion to a low fat chow diet and whether they maintain the “memory” of the HFHS diet state despite weight loss.
Materials and Methods
Animals and Experimental Design
A genetic study of diet-induced obesity was previously reported, where 100 diverse inbred mouse strains of both sexes were fed a high-fat (32.5% kcal from corn oil and butter), high-sucrose (25% kcal) diet for 8 weeks (26). We refer to this collection of strains as the Hybrid Mouse Diversity Panel (HMDP). A subset of 45 strains from this study were selected based on the availability of age-matched males of the same strain fed a chow-only (18% kcal from fats) diet for 8 weeks. All mice were obtained from the Jackson Laboratory and the animal protocol for the study was approved by the Institutional Care and Use Committee (IACUC) at University of California, Los Angeles. The HFHS diet was purchased from Research Diets (D12266B).
A subset of 5 HMDP strains (A/J, BALB/cJ, C3H/HeJ, C57BL/6J, and DBA/2J) was used as a validation and weight loss discovery cohort. These strains were selected in order to study the variability in weight loss phenotypes based on their body fat responses to HFHS diet. BALB/cJ was found to be a low responding strain in terms of body fat gain, A/J, C57BL/6J, and C3H/HeJ responding moderately, and DBA/2J animals with the greatest response to 8 weeks of HFHS diet (26). Animals from all 5 strains were fed either HFHS (n = 16/strain) or chow (n = 8/strain) diets for 6 weeks. Half of the HFHS group was then returned to chow for 4 weeks and treated as a weight loss phenotype (n = 8/strain), while the remaining animals remained on chow- or HFHS-only diets. In both the obesity and weight loss studies, body composition was measured bi-weekly throughout the course of the diet via NMR. At the time of sacrifice, metabolic phenotypes such as glucose tolerance, serum insulin, and lipids were measured. The log-value of these clinical measurements were used for correlation analyses with methylation changes.
Liver Methylome Profiling and Differential Methylation Analysis
We isolated genomic DNA from 30 to 50 mg of whole liver from 16-week old animals fed chow or HFHS diet. For each of the 45 strains, DNA from 2 to 3 males per strain was pooled for library preparation, producing epigenetic profiles that represent the aggregate methylation profiles for a strain. Genomic DNA was isolated using the Qiagen AllPrep DNA/RNA Mini Kit. When anatomy of the frozen tissue was discernible, 30–50 mg samples were cut from the middle of the left caudate lobe. Tissues were homogenized in RLT Plus Buffer in a Qiagen TissueLyser at 50 Hz for 2 min. DNA concentrations were measured using the Qubit fluorometer with the DS DNA kit. RRBS libraries were prepared according to previously published protocols (8). We initially combined and sequenced the genomic DNA of 2–3 animals for the initial set of 45 HMDP libraries and sequenced 3 individual animals per diet in the weight loss cohort. One-hundred ng of genomic DNA was digested with the methylation-insensitive restriction enzyme MspI, and fragments of length from 50 to 400 bp were selected. We sequenced each library to an average depth of 20 million reads per sample on the Illumina HiSeq4000 platform. Sequencing reads were mapped to mouse genome build mm 10 using an RRBS specific aligner, BSSeeker2 (27). We observed 45% mappability across all samples. CpGs on opposite strands were not merged and maintained as separate sites. We filtered the cytosines based on CG context, coverage, and representation across all samples. This yielded >1 million CpGs with 10x coverage across at least 70% of samples. CG-SNPs, where one allele of a genetic variant is also a CpG site, were removed. CG-SNPs were identified by cross referencing profiled CpGs with HMDP SNPs imputed by Bennett et al. (28). For each remaining CpG site with 10x or greater coverage, the methylation level was calculated by computing the ratio of methylated to unmethylated reads at each site. This proportion represents the percentage of cells in the sampled tissue with a methylated cytosine. We removed CpGs with low variance (row variance <0.01) across all strains and diets. For each CpG site in the dataset we first calculated the intra-strain change in methylation between HFHS and chow diets. We compared the means at each site between diets using a two-tailed paired T-test. To account for multiple comparisons, we calculated a Benjamini-Hochberg corrected FDR-adjusted p-value. FDR-significant sites had a differential FDR <0.1 which corresponded to an unadjusted p-value of 5E-5. We permuted the diet labels and performed 1,000 permutations at every analyzed CpG.
Genomic and Functional Annotation
Significant CpGs were annotated to nearby genes using GREAT (29). Annotated regions correspond to 1,000 kb surrounding a gene's TSS. Once annotated, GREAT performs pathway enrichment using GO and KEGG terms. A set of 100,000 randomly selected CpGs were selected from the data as background for enrichment.
Statistical Analyses
All statistical analyses were performed using the Python 3.0 packages Pandas and NumPy for processing DataFrames, and Scipy Stats for statistical test functions like t-tests, FDR corrections, permutation, and calculating correlation coefficients values reported are Pearson's coefficient. Phenotypes are log-normalized.
Results
Diet-Responsive Methylation Changes in a Subset of the HMDP
We first identified CpGs that change methylation levels in response to a high-fat, high-sucrose (HFHS) diet. The obesogenic response is highly variable among the subset of strains selected, with some strains responding with low percentage of body fat gain and some high (Figure 1A). We performed reduced representation bisulfite sequencing (RRBS) on DNA isolated from liver and observed a total of 1,045,665 CpGs with 10x coverage across at least 70% of samples. A majority of CpGs measured did not vary between strains, as they tended to be ubiquitously unmethylated in all samples and were excluded from the analysis. We performed paired sample t-tests on the methylation levels at 161,742 variable CpGs between chow and HFHS groups composed of 45 HMDP strains (Figure 1B). This analysis identified 83 CpGs that significantly change in response to HFHS diet group with an FDR <10% (Table 1 and Supplementary Figure 1). There were 32 CpGs with decreased methylation levels in the HFHS group (−7 to −25.5%) and 51 CpGs that increased in methylation (+5 to +19%) in the HFHS group. We ran 1,000 permutations of the t-test by randomizing the diet label to identify the false positive rate. The average number of CpGs where the permutation p-value was less than the FDR cut-off, <5E-5, was 25.22 (95%CI = 24.81–25.64), suggesting that the inferred FDR rate may be closer to 30%.
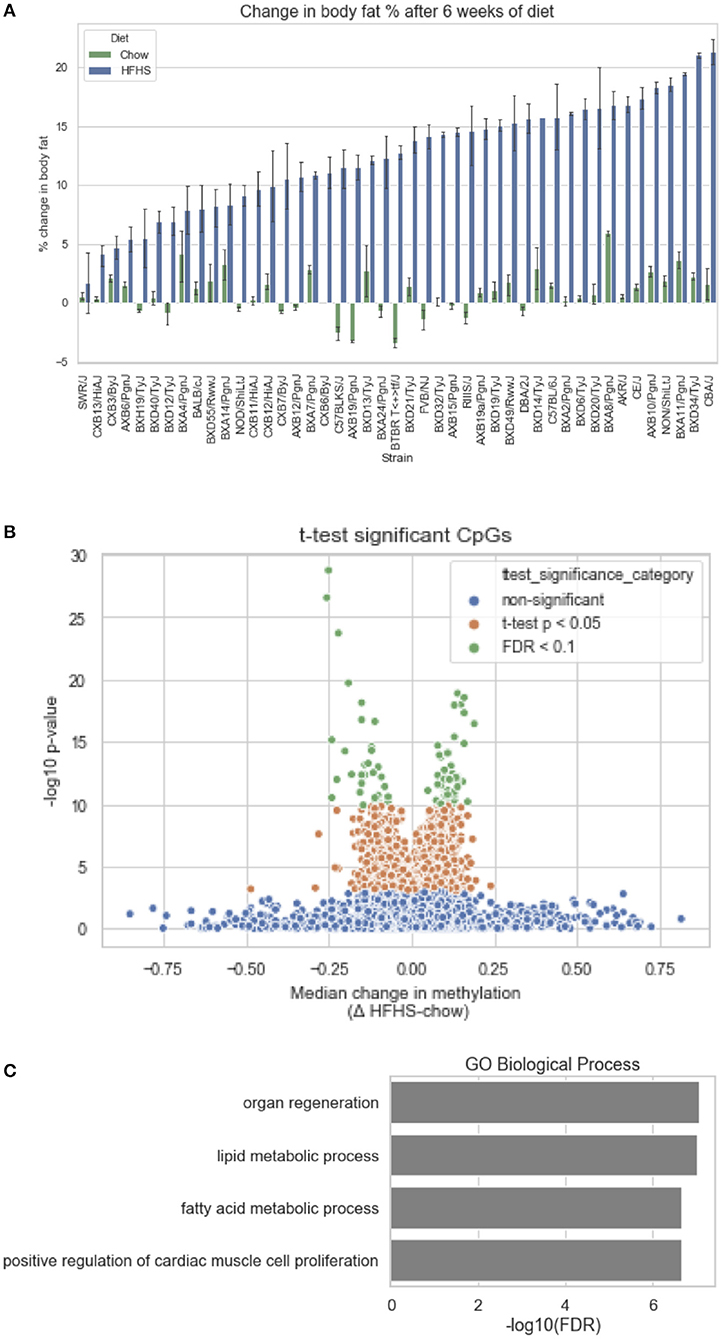
Figure 1. Differential methylation of CpGs in response to HFHS diet. Forty-five genetically diverse mouse strains were fed an obesifying high-fat, high-sucrose (HFHS) or chow diet for 8 weeks. (A) Shows the strain-specific body fat changes after 6 weeks of diet. Such strains such as DBA/2J and C57BL/6J are high responders to HFHS diet and increase adiposity 15% after 6 weeks compared to chow diet, while other stains like BALB/cJ gain much less. Data shown are mean ± SD (n = 2–3 mice/strain and diet). (B) Differential analysis identifies 83 significant (10% FDR) CpGs out of 161,742 variable CpGs. Out of 1,045,665 CpGs identified by RRBS, only a subset varied between samples. (C) Annotation of significant CpGs to nearby genets and GO Term Pathway enrichment, x axis values represent -log10(FDR) values of term enrichment.
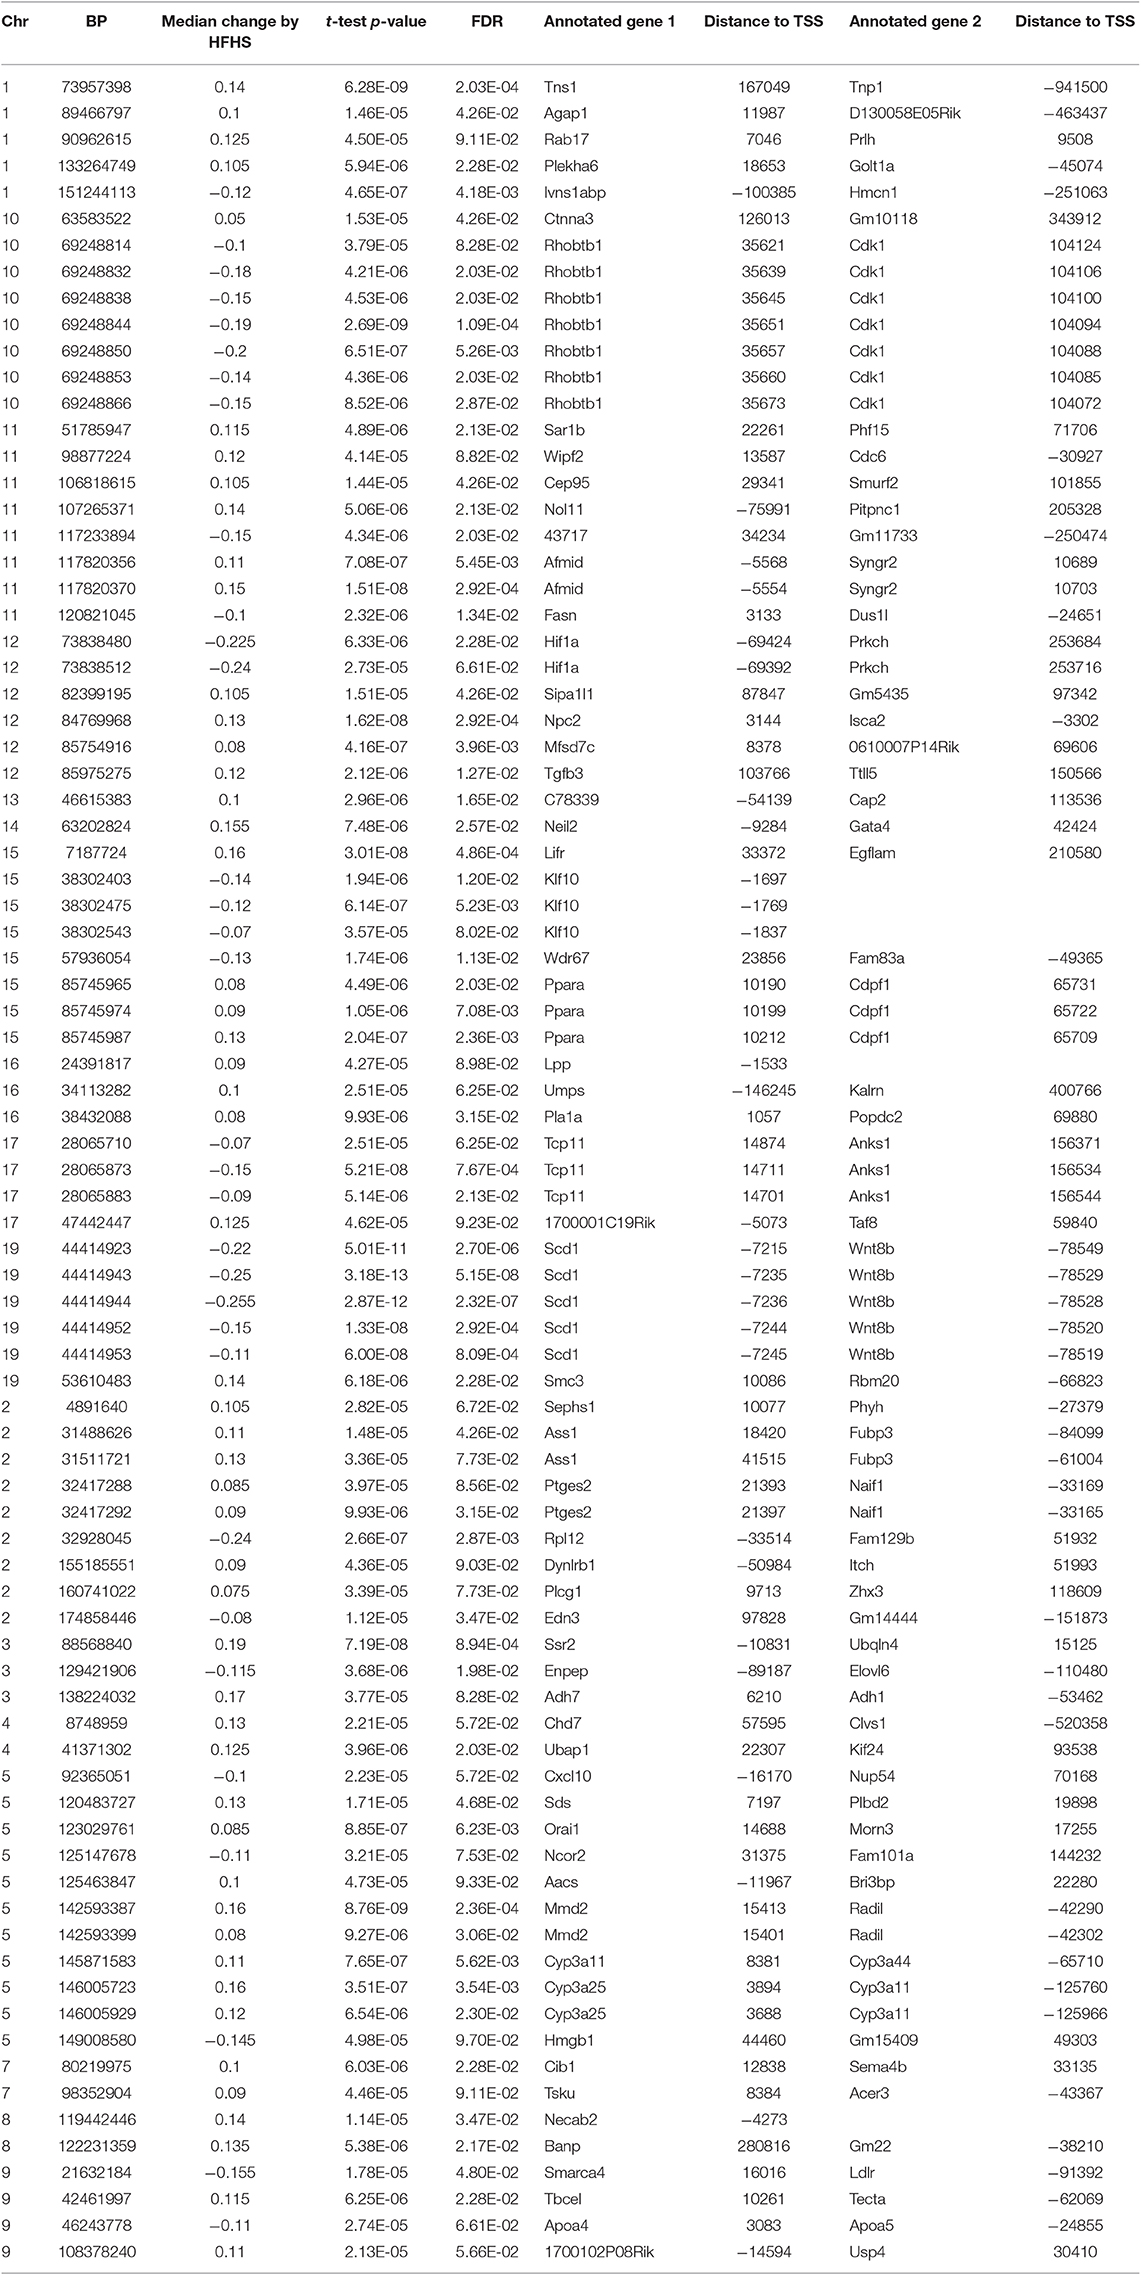
Table 1. FDR significant CpGs changed by HFHS diet in 45 strains of mice.
DNA methylation regulates gene expression at the promoters of genes but also at more distal enhancers, so we used the annotation tool GREAT, which assigns non-coding regulatory regions to nearby genes within 1 Mbp. This annotation identified 118 genes associated with the 83 HFHS diet-responsive CpGs. GO Term analysis of the annotated genes revealed significant enrichment for genes involved lipid metabolism and cellular replication (Figure 1C). Among lipid metabolism genes that were near the differentially methylated CpGs were Ldlr, Elovl6, Fasn, Ppara, and Scd1. Several of the 83 CpGs are proximal to the same genes, including Cdk1, cyclin dependent kinase 1, a mitosis checkpoint gene, and Scd1, a fatty acid biosynthesis gene.
Global liver gene expression from the obesity HMDP was previously quantified using Affymetrix HT_MG430A arrays (26). Expression values represent the average normalized probe intensity of 1-2 mice per strain, but not necessarily from the same animals pooled for RRBS. Thirty seven of the 45 HMDP strains had previously measured liver expression on both diets. Of the genes present on the array that were annotated to one of the 83 diet-responsive CpGs, 83 CpG methylation-transcript level correlations were significant with a p-value <0.05 (Table 2). This suggests that the diet-responsive methylation changes are likely associated with changes in nearby gene expression. Sixteen CpGs out of the 83 significant CpG-transcript correlations fell within <10 kbp of the gene's TSS and 53 of 85 CpGs were located within 50 kbp. In addition to gene expression, many CpGs correlate with clinical traits. Average methylation of the 5 CpGs annotated to Scd1 inversely correlated with Scd1 expression, body fat percentage, plasma glucose, and plasma HDL levels (Figure 2).
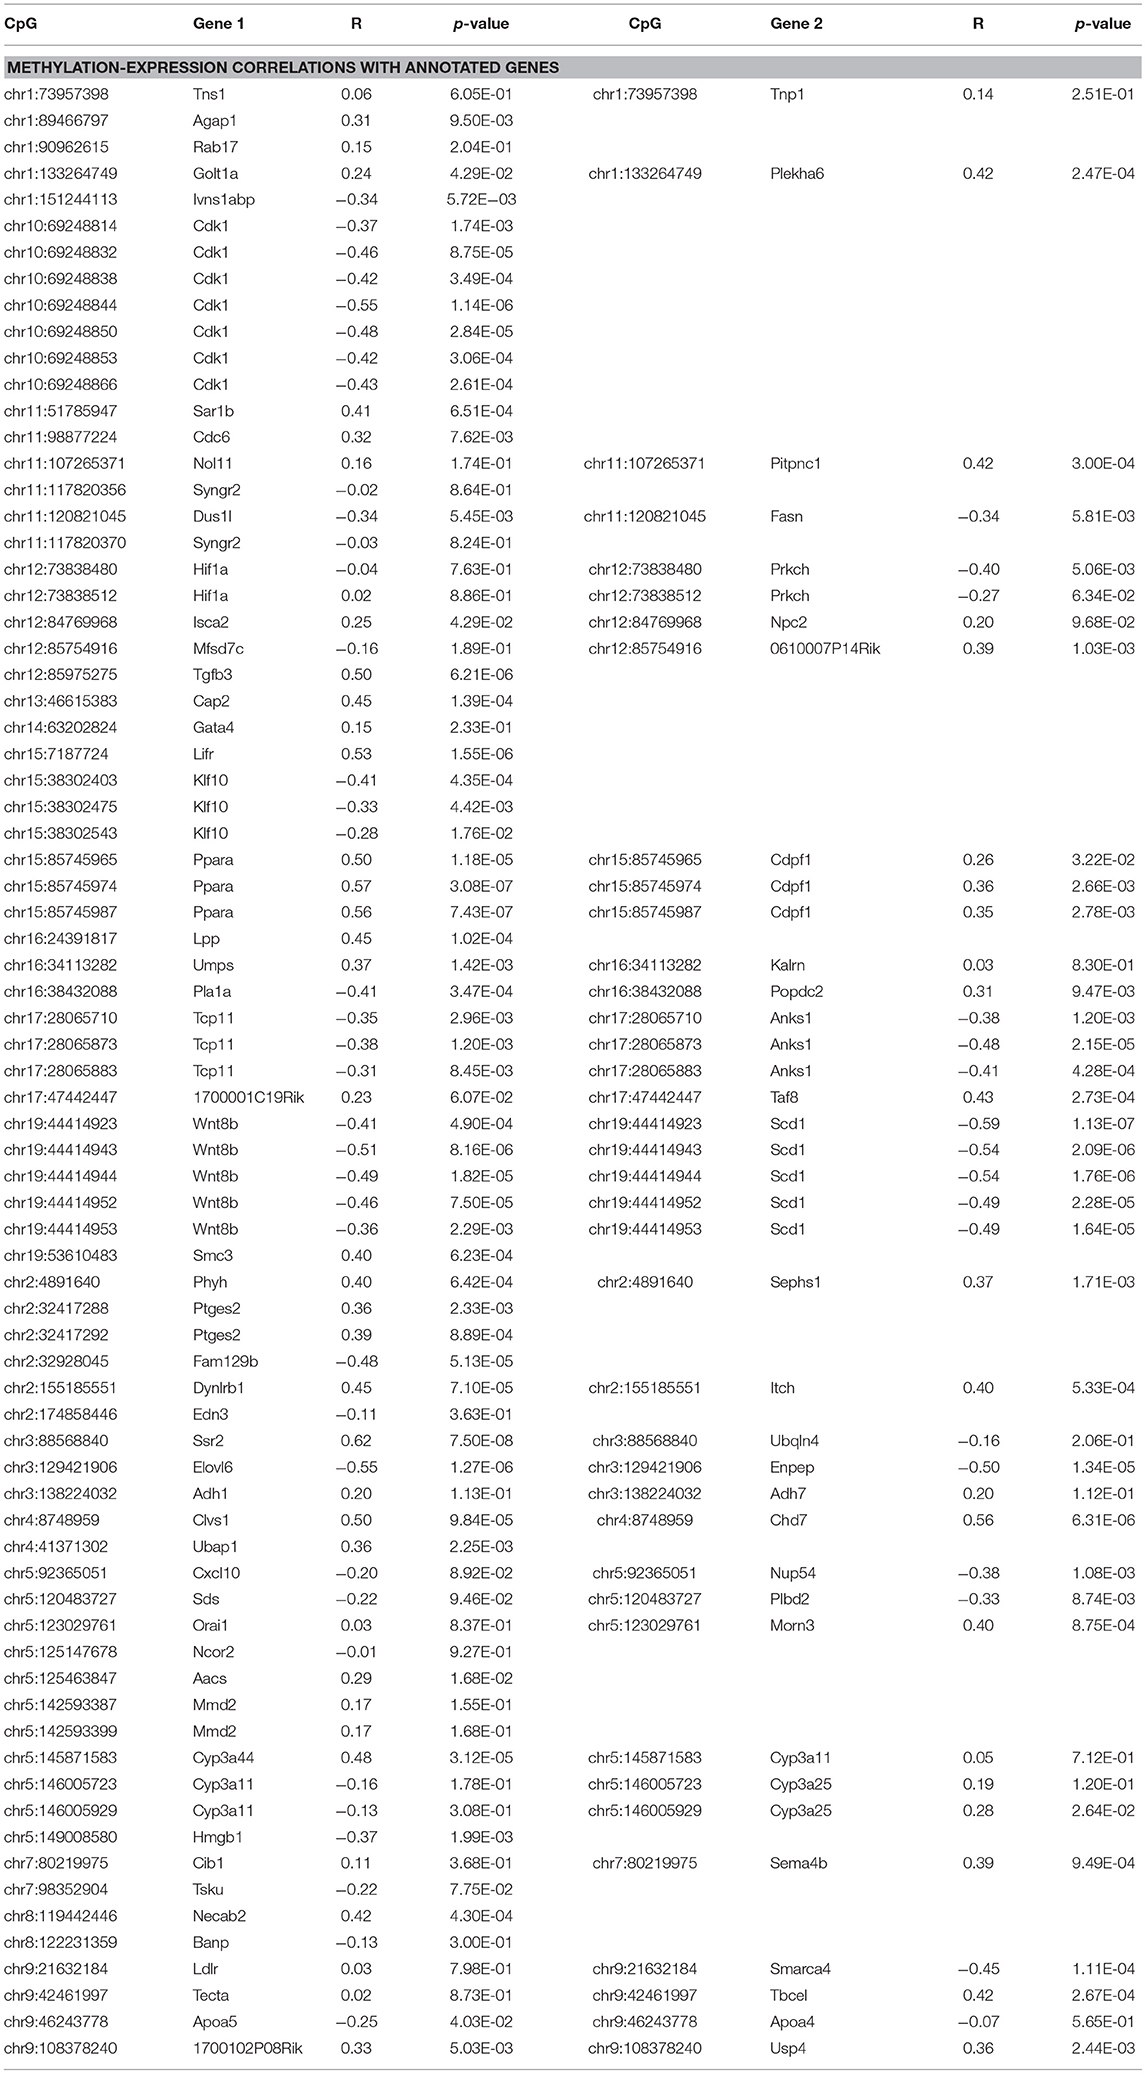
Table 2. Correlation of diet responsive CpG methylation levels with expression of nearby genes.
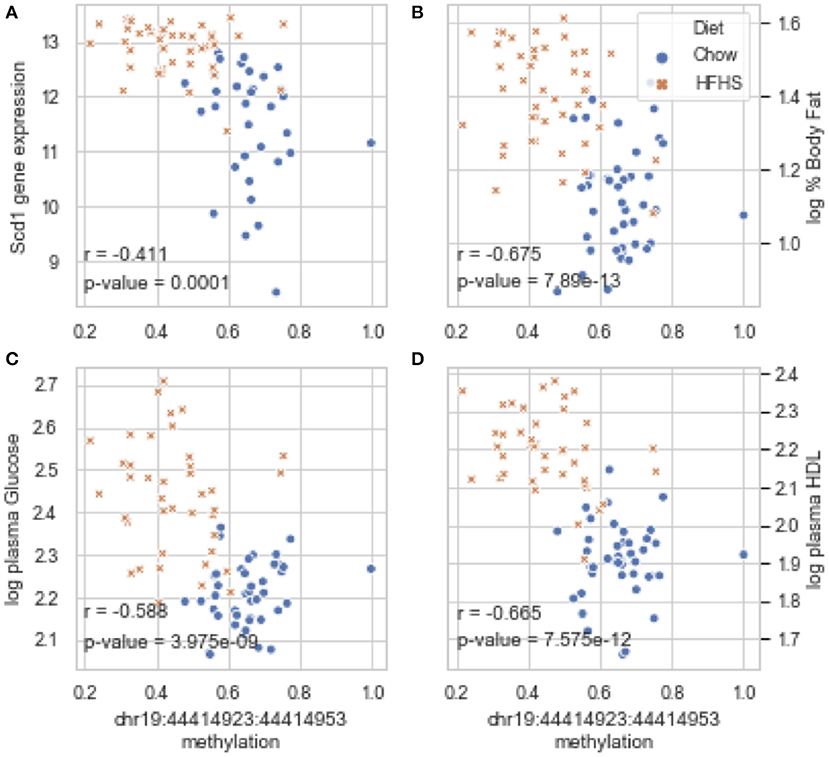
Figure 2. Diet-induced changes in methylation correlate with cis-regulated gene expression and clinical traits. (A–D) Show correlation plots between the average methylation levels of 5 correlated CpGs on chr19 and microarray transcript levels, body fat measured by NMR, and plasma glucose and HDL in 37 strains from the obesity HMDP. The blue dots represent the average methylation and trait measurements of a strain fed chow diet, and the orange crosses show data from the same strains fed HFHS diet.
Diet-Responsive Methylation Changes in a 5 Strain Model of Weight Loss
These 83 diet-responsive CpGs were further examined in a 5-strain study of diet-induced obesity followed by weight loss. The inbred strains were selected based on the variable responses to HFHS identified by Parks et al. (26). We fed mice HFHS for 6 weeks, then placed a subset back to chow for a diet-induced weight loss arm for an additional 4 weeks. At the end of 10 weeks, animals were sacrificed, and tissues collected for methylation profiling.
We observed strain specific changes in adiposity after 6 weeks of HFHS feeding, with BALB/cJ gaining the least and DBA/2J the most (Figure 3A). After reversion to weight loss diet for 4 weeks, four strains, A/J, C3H/HeJ, C57BL/6J, and DBA/2J, reverted to their chow adiposities and no longer had significantly more body fat than animals fed chow diet-only for 10 weeks (Figure 3B). When we examined DNA methylation changes by HFHS diet exposure, we confirmed that the diet-induced changes were robust across experiments. Three strains, BALB/cJ, C57BL/6J and DBA/2J, were present in both studies. We calculated the average change in methylation within each of the strains after HFHS diet in both studies then correlated the effects. The direction and magnitude of change in DNA methylation at HFHS-variable sites was highly reproducible between experiments (Supplementary Figure 2A). When correlated with body fat in each diet group, methylation specifically at the Scd1 locus correlated the least with body fat in weight loss compared to chow or HFHS-only (Supplementary Figure 2B).
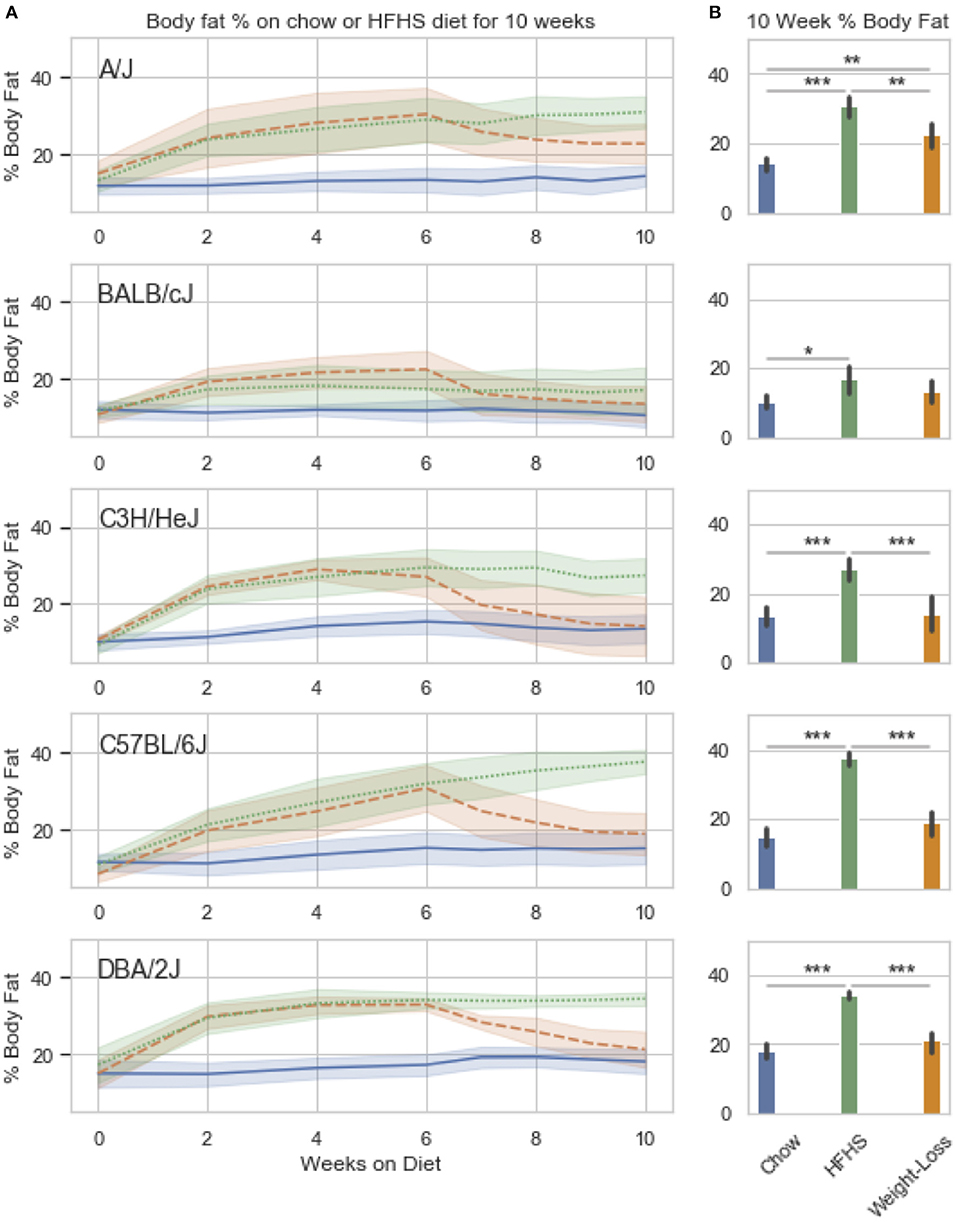
Figure 3. Weight loss and replication study. Five classical inbred strains (A/J, BALB/cJ, C3H/HeJ, C57BL/6J, and DBA/2J) were chosen based on a variable response to HFHS diet in previous studies. Twenty four 8 week old male mice were placed on HFHS (n = 16) or chow (n = 8) for 6 weeks, after which, a subset of 8 mice were placed back to chow (weight loss) for 4 weeks. Body fat percentage measured by NMR is shown over the course of 10 weeks in (A). Data is mean ± SD. T-test comparisons of body weight and total adiposity at the end of the 10 week study show that only the A/J strain has not resolved diet-induced obesity after 4 weeks of diet (B).
We performed a two-way ANOVA on methylation levels at 81 of the diet-responsive CpGs between diet groups and strain variables. We identified 44 CpGs with a p-value <0.05 for the diet term. When we performed differential analysis by t-test in the weight loss group compared to chow-only animals, many of the diet-induced changes were non-significant, but a fraction of the sites remained differentially methylated (p < 0.05) (Figure 4). Thirty-six of 81 diet-induced CpGs examined in the second cohort did not revert to chow-only levels of methylation across all strains. Although significantly differentially methylated after 6 weeks, it should be noted that most of methylation differences in the weight loss group began to revert to chow-only levels. There were 14 persistently hypermethylated and 22 hypomethylated CpGs. All persistent hypomethylated CpGs were also significant by ANOVA (p < 0.05) across all 3 diet groups, and 11 of 14 persistently hypermethylated CpGs were significant. The genes associated with weight loss-persistent CpGs are listed in Table 3. CpGs associated with Scd1 and Cdk1 remain significantly hypomethylated following 4 weeks of weight loss.
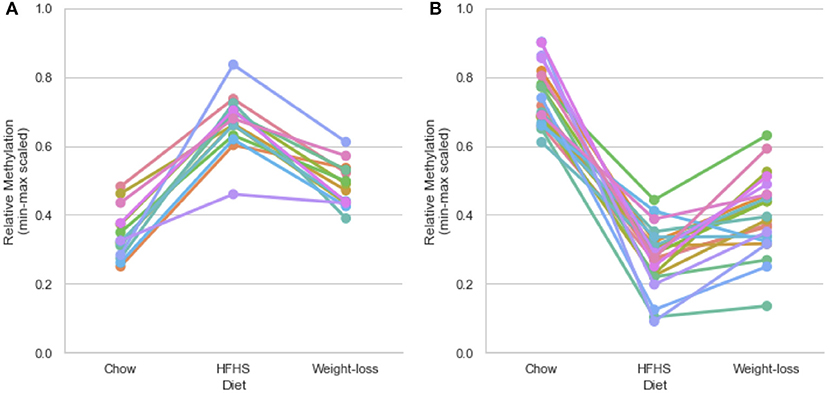
Figure 4. Persistently differentially methylated CpGs after weight loss. Thirty-six of 81 diet-responsive CpGs maintained a significant difference in methylation following 6 weeks of weight loss. Colored lines represent the average scaled methylation values of all 5 strains at singular diet-responsive CpGs (n = 15). Y-axis values are min-max scaled, which represents the absolute methylation percentage determined by RRBS relatively scaled to the minimum and maximum measurements of the same CpG across all strains and diets. (Measured methylation-minimum)/(maximum – minimum). (A) Shows examples of 14 persistently hypermethylated CpGs, and (B) shows examples of 22 hypomethylated CpGs.
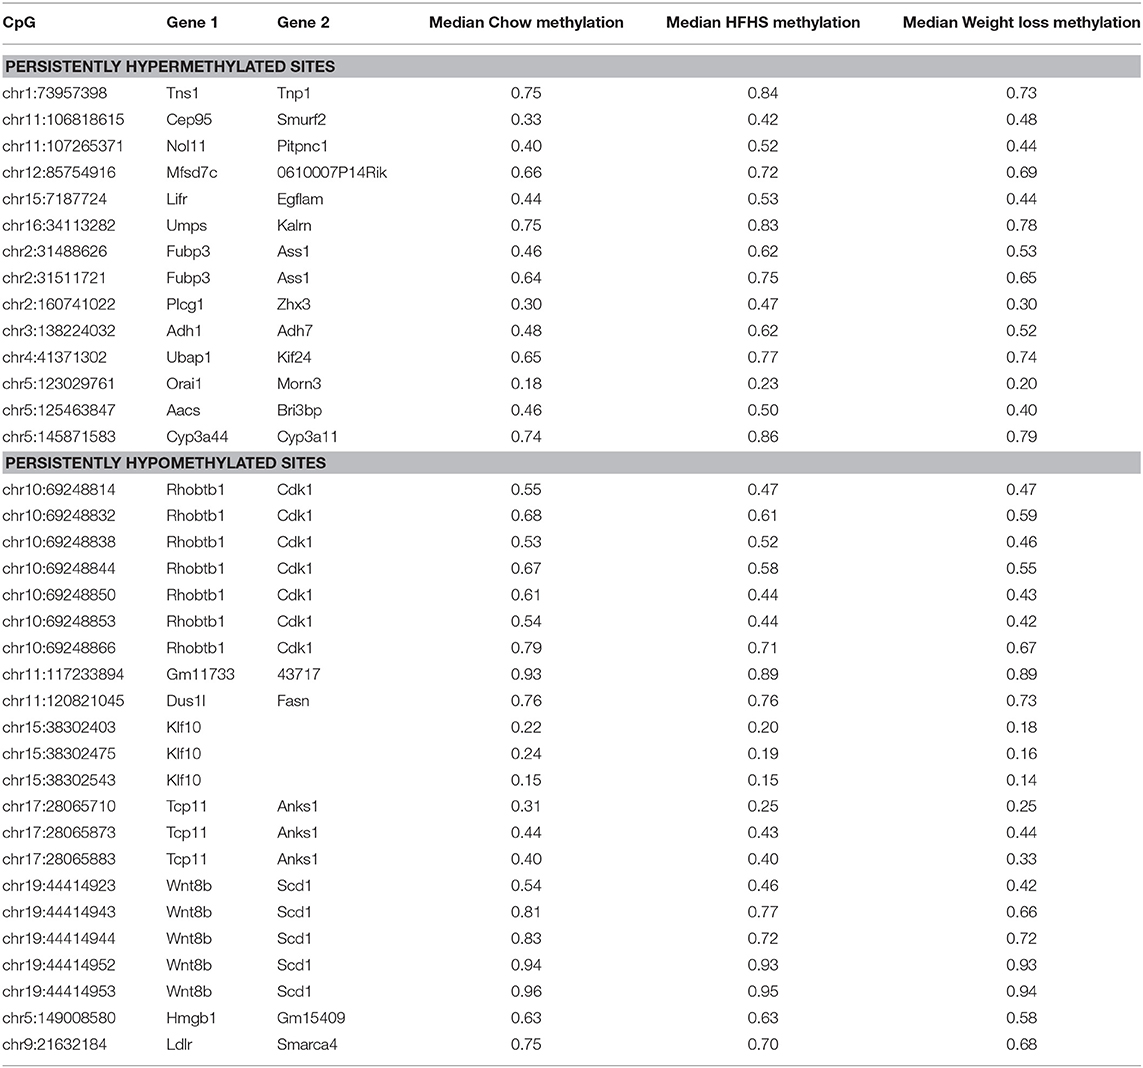
Table 3. Diet responsive CpGs with incomplete methylation reversal following 4 weeks of weight loss.
Discussion
In this study we asked a fundamental question regarding the epigenetic responses to different diets: what happens to DNA methylation changes in liver in response to a HFHS diet challenge and are these changes reversible when mice are fed a low-fat, weight loss diet? By identifying epigenetic changes and profiling weight loss phenotypes in a panel of genetically diverse mouse strains, we were able to evaluate this question in the context of variable gene-by-environment responses. Mouse studies of obesity often overlook genetic and phenotypic variability when discovering epigenetic mechanisms. By identifying diet-responsive CpGs across 45 strains, we were able to identify candidate methylation changes associated with a common response to overnutrition in liver. These changes could be used as a future metric for HFHS exposure agnostic of genetic background. The genes regulated by diet-responsive CpGs in this study are known to be involved in energy homeostasis. Once identified, we investigated the status of these diet-responsive CpGs in the livers of animals that were exposed to HFHS but returned to chow-diet and subsequently reduced their adiposity. We observed a strain-specific phenotype in weight loss, as only one strain of the five, A/J, did not return to chow-only levels of body fat after 4 weeks. And although most strains successfully lost enough body fat to be comparable to age matched, chow-only controls, a large fraction of diet-induced methylation changes remained significantly differentially methylated. This suggests that epigenetic changes revert more slowly than physiological changes, like adiposity.
One of the genes associated with the greatest number of diet-responsive CpGs and persistently differentially methylated after weight loss was Cdk1. The CpGs at the Chr10 region annotated only to Cdk1 and no other nearby gene. Methylation at this locus was also significantly correlated with Cdk1 expression. Cdk1 is a gene for a kinase involved in cell entry into mitosis. Cdk1 inhibition was recently discovered to enhance glucose sensing in pancreatic beta cells by regulating mitochondrial bioenergetics (30). Epigenetic regulation of Cdk1 has not previously been implicated in a hepatic response to overnutrition and increased adiposity. Another prominent gene near diet-responsive CpGs was Scd1. Scd1 is a well-studied gene involved in the biosynthesis of monounsaturated fatty acids, critical signaling molecules in energy homeostasis (3). A clinical study examining methylation at the promoter of SCD1 in humans identified hypomethylation in obese individuals but an increase in methylation levels following Roux-en-Y Gastric Bypass surgery (31). The delayed reversal of obesity-induced methylation at Scd1 in mice could be either due to the length of weight loss time observed in this study or an effect of rapid weight loss due to surgery in humans.
In this study, 4 weeks of chow diet reversal was sufficient to significantly restore body fat to previous levels in 4 of 5 strains studied. To date, there are few published weight loss studies in mice that use >2 genetically diverse strains to interrogate this phenotype. Leung et al. compared the hepatic chromatin states of C57BL/6J and A/J in the context of diet-induced obesity and weight loss for 16 weeks (23). The authors identified an obesity resistant and easily reverted phenotype in A/J compared to C57BL/6J animals fed the same obesogenic diet used in these studies. In alignment with this resistant phenotype, the authors identified less persistently accessible regions in A/J compared to C57BL/6J. We did not observe this pattern of epigenetic and body composition plasticity in the A/J strain over the course of our 10 week study, as the A/J strain behaved more similarly to the C57BL/6J cohort from Leung et al. Weight loss studies performed in C57BL/6J animals have also been inconclusive with regard to the reversibility of obesity induced changes, suggesting subtle differences in environment and experimental design may affect the reversion phenotype (24, 32).
In our study we observed that weight loss occurs more rapidly than DNA methylation changes. It is possible that some sites may eventually revert back to their chow state, but the time scale for this can be significantly longer than those for weight loss itself. With respect to the kinetics of epigenetic change, DNA methylation is considered to be the most stable epigenetic mark. Compared to chromatin remodeling mechanisms such as histone deacetylases and demethylases, DNMT3A the de novo DNA methylation enzyme, confers more persistent epigenetic changes by silencing gene expression with the slowest kinetics (33). This suggests that changes to DNA methylation during weight loss are less likely to be reversed within the same period of time as histone modifications or DNA accessibility. As a whole, most strains examined in this study efficiently reversed the obesity phenotype following reversion to a chow diet. However, methylation changes induced by the initial state of obesity are not quickly reversed at loci involved in energy homeostasis, even after adiposity is reversed.
The discordant dynamic between physiological and epigenetic plasticity observed in our study is reminiscent of persistent epigenetic aging acceleration in human obesity. The “epigenetic clock” model, developed by Horvath et al., associates the level of DNA methylation at dozens of CpGs with chronological age (10). This clock is often used to evaluate the effect of disease states and environmental exposures on tissue physiology by observing the changes in epigenetic age acceleration. Epigenetic age acceleration is a biomarker that is hypothesized to represent age-associated decline in tissue function (34). Obesity increases the acceleration of epigenetic aging in the liver, and this acceleration is not reversed following bariatric surgery (10). The accelerated clock markers in humans were enriched for CpGs in close proximity to genes involved in mitochondrial function and oxidative stress. These physiological processes are involved in insulin resistance, a prevalent phenotype in aged individuals that may play a role in the prolonged physiological reversal of obesity (35). Studies of diet induced obesity in mice identified persistent insulin resistance following short-term weight loss (22, 36, 37). Persistent epigenetic alterations have also previously been proposed as a “molecular memory” mechanism in gluconormalized diabetics with an increased risk for retinopathy and additional microvascular complications (38, 39). Taken together, these studies and our present work suggest that obesity-induced changes to DNA methylation at loci associated with energy homeostasis may be involved in unresolved metabolic adaptation, or epigenetic “memory” following weight loss. This adaptation has potential implications for predicting the success of weight loss, and subsequent risk of future weight regain.
Data Availability Statement
The datasets generated for this study can be found in the Genome Expression Omnibus (GEO) GSE64770.
Ethics Statement
The animal study was reviewed and approved by Institutional Care and Use Committee (IACUC) at University of California, Los Angeles.
Author Contributions
BP, MM, and CE conceived the original ideas. BP and MM carried out the mouse experiments. CE performed sequencing and data analysis. AL and MP helped supervise the project. CE wrote the manuscript with support from AL and MP.
Conflict of Interest
The authors declare that the research was conducted in the absence of any commercial or financial relationships that could be construed as a potential conflict of interest.
Supplementary Material
The Supplementary Material for this article can be found online at: https://www.frontiersin.org/articles/10.3389/fendo.2019.00882/full#supplementary-material
Supplementary Figure 1. Examples of diet-induced methylation changes in all 45 HMDP strains at individual CpGs (n = 45). Each line represents the change in methylation by HFHS within a single strain. The CpGs on chromosome 15 and 19 are examples of a CpGs that trend toward hypomethylation after HFHS.
Supplementary Figure 2. (A) Shows the correlation of HFHS diet-induced changes between replicate experiments. Three strains, BALB/cJ, C57BL/6J, and DBA/2J were included in both analyses of HFHS diet-induced methylation changes. Data shown are 81 HFHS-responsive CpGs (as identified in the 45 strain study) shared across both studies in all 3 strains. X axis values represent the delta methylation by HFHS in the 45 strain cohort (exp. 1) and the Y axis values represent the delta methylation between strain averages in the 5 strain cohort (exp. 2). (B) Shows the correlation of Scd1 fragment methylation with body fat across each diet group in weight loss cohort. Pearson correlation coefficients between log body fat percentage and methylation level at chromosome 19 locus identifies a decrease in the fraction of body-fat variation explained by methylation after weight loss.
References
1. Xu X, Su S, Barnes VA, De Miguel C, Pollock J, Ownby D, et al. A genome-wide methylation study on obesity: differential variability and differential methylation. Epigenetics. (2013) 8:522–33. doi: 10.4161/epi.24506
2. Wahl S, Drong A, Lehne B, Loh M, Scott WR, Kunze S, et al. Epigenome-wide association study of body mass index, and the adverse outcomes of adiposity. Nature. (2017) 541:81–6. doi: 10.1038/nature20784
3. Schwenk RW, Jonas W, Ernst SB, Kammel A, Jähnert M, Schürmann A. Diet-dependent alterations of hepatic Scd1 expression are accompanied by differences in promoter methylation. Horm Metab Res. (2013) 45:786–94. doi: 10.1055/s-0033-1348263
4. Jiang M, Zhang Y, Liu M, Lan MS, Fei J, Fan W, et al. Hypermethylation of hepatic glucokinase and L-type pyruvate kinase promoters in high-fat diet-induced obese rats. Endocrinology. (2011) 152:1284–9. doi: 10.1210/en.2010-1162
5. Chang X, Yan H, Fei J, Jiang M, Zhu H, Lu D, et al. Berberine reduces methylation of the MTTP promoter and alleviates fatty liver induced by a high-fat diet in rats. J Lipid Res. (2010) 51:2504–15. doi: 10.1194/jlr.M001958
6. Dudley KJ, Sloboda DM, Connor KL, Beltrand J, Vickers MH. Offspring of mothers fed a high fat diet display hepatic cell cycle inhibition and associated changes in gene expression and DNA methylation. PLoS ONE. (2011) 6:e21662. doi: 10.1371/journal.pone.0021662
7. Fontana L, Partridge L, Longo VD. Extending healthy life span—from yeast to humans. Science. (2010) 328:321–6. doi: 10.1126/science.1172539
8. Feng W, Dong Z, He B, Wang K. Analysis method of epigenetic DNA methylation to dynamically investigate the functional activity of transcription factors in gene expression. BMC Genom. (2012) 13:532. doi: 10.1186/1471-2164-13-532
9. Cole JJ, Robertson NA, Rather MI, Thomson JP, McBryan T, Sproul D, et al. Diverse interventions that extend mouse lifespan suppress shared age-associated epigenetic changes at critical gene regulatory regions. Genome Biol. (2017) 18:58. doi: 10.1186/s13059-017-1185-3
10. Horvath S, Erhart W, Brosch M, Ammerpohl O, von Schönfels W, Ahrens M, et al. Obesity accelerates epigenetic aging of human liver. Proc Natl Acad Sci USA. (2014) 111:15538–43. doi: 10.1073/pnas.1412759111
11. Barres R, Kirchner H, Rasmussen M, Yan J, Kantor FR, Krook A, et al. Weight loss after gastric bypass surgery in human obesity remodels promoter methylation. Cell Rep. (2013) 3:1020–7. doi: 10.1016/j.celrep.2013.03.018
12. Stubbs TM, Bonder MJ, Stark AK, Krueger F, BI Ageing Clock Team, von Meyenn F, et al. Multi-tissue DNA methylation age predictor in mouse. Genome Biol. (2017) 18:68. doi: 10.1186/s13059-017-1203-5
13. Aronica L, Levine AJ, Brennan K, Mi J, Gardner C, Haile RW, et al. A systematic review of studies of DNA methylation in the context of a weight loss intervention. Epigenomics. (2017) 9:769–87. doi: 10.2217/epi-2016-0182
14. Cordero P, Campion J, Milagro FI, Goyenechea E, Steemburgo T, Javierre BM, et al. Leptin and TNF-alpha promoter methylation levels measured by MSP could predict the response to a low-calorie diet. Journal of physiology and biochemistry. (2011) 67:463–70. doi: 10.1007/s13105-011-0084-4
15. Crujeiras AB, Campion J, Díaz-Lagares A, Milagro FI, Goyenechea E, Abete I, et al. Association of weight regain with specific methylation levels in the NPY and POMC promoters in leukocytes of obese men: a translational study. Regul Peptid. (2013) 186:1–6. doi: 10.1016/j.regpep.2013.06.012
16. Lopez-Legarrea P, Mansego ML, Zulet MA, Martinez JA. SERPINE1, PAI-1 protein coding gene, methylation levels and epigenetic relationships with adiposity changes in obese subjects with metabolic syndrome features under dietary restriction. J Clin Biochem Nutr. (2013) 53:139–44. doi: 10.3164/jcbn.13-54
17. Milagro FI, Campión J, Cordero P, Goyenechea E, Gómez-Uriz AM, Abete I, et al. A dual epigenomic approach for the search of obesity biomarkers: DNA methylation in relation to diet-induced weight loss. Faseb J. (2011) 25:1378–89. doi: 10.1096/fj.10-170365
18. Perez-Cornago A, Mansego ML, Zulet MA, Martinez JA. DNA hypermethylation of the serotonin receptor type-2A gene is associated with a worse response to a weight loss intervention in subjects with metabolic syndrome. Nutrients. (2014) 6:2387–403. doi: 10.3390/nu6062387
19. Nicoletti CF, Nonino CB, de Oliveira BA, Pinhel MA, Mansego ML, Milagro FI, et al. DNA methylation and hydroxymethylation levels in relation to two weight loss strategies: energy-restricted diet or bariatric surgery. Obes Surg. (2016) 26:603–11. doi: 10.1007/s11695-015-1802-8
20. Bouchard L, Rabasa-Lhoret R, Faraj M, Lavoie ME, Mill J, Pérusse L, et al. Differential epigenomic and transcriptomic responses in subcutaneous adipose tissue between low and high responders to caloric restriction. Am J Clin Nutr. (2009) 91:309–20. doi: 10.3945/ajcn.2009.28085
21. Moleres A, Campión J, Milagro FI, Marcos A, Campoy C, Garagorri JM, et al. Differential DNA methylation patterns between high and low responders to a weight loss intervention in overweight or obese adolescents: the EVASYON study. FASEB J. (2013) 27:2504–12. doi: 10.1096/fj.12-215566
22. Schmitz J, Evers N, Awazawa M, Nicholls HT, Brönneke HS, Dietrich A, et al. Obesogenic memory can confer long-term increases in adipose tissue but not liver inflammation and insulin resistance after weight loss. Mol Metab. (2016) 5:328–39. doi: 10.1016/j.molmet.2015.12.001
23. Leung A, Trac C, Du J, Natarajan R, Schones DE. Persistent chromatin modifications induced by high fat diet. J Biol Chem. (2016) 291:10446–55. doi: 10.1074/jbc.M115.711028
24. Siersbæk M, Varticovski L, Yang S, Baek S, Nielsen R, Mandrup S, et al. High fat diet-induced changes of mouse hepatic transcription and enhancer activity can be reversed by subsequent weight loss. Sci Rep. (2017) 7:40220. doi: 10.1038/srep40220
25. Orozco LD, Morselli M, Rubbi L, Guo W, Go J, Shi H, et al. Epigenome-wide association of liver methylation patterns and complex metabolic traits in mice. Cell Metab. (2015) 21:905–17. doi: 10.1016/j.cmet.2015.04.025
26. Parks BW, Nam E, Org E, Kostem E, Norheim F, Hui ST, et al. Genetic control of obesity and gut microbiota composition in response to high-fat, high-sucrose diet in mice. Cell Metab. (2013) 17:141–52. doi: 10.1016/j.cmet.2012.12.007
27. Guo W, Fiziev P, Yan W, Cokus S, Sun X, Zhang MQ, et al. BS-Seeker2: a versatile aligning pipeline for bisulfite sequencing data. BMC Genom. (2013) 14:774. doi: 10.1186/1471-2164-14-774
28. Bennett BJ, Farber CR, Orozco L, Kang HM, Ghazalpour A, Siemers N, et al. A high-resolution association mapping panel for the dissection of complex traits in mice. Genome Res. (2010) 20:281–90. doi: 10.1101/gr.099234.109
29. McLean CY, Bristor D, Hiller M, Clarke SL, Schaar BT, Lowe CB, et al. GREAT improves functional interpretation of cis-regulatory regions. Nat Biotechnol. (2010) 28:495–501. doi: 10.1038/nbt.1630
30. Gregg T, Sdao SM, Dhillon RS, Rensvold JW, Lewandowski SL, Pagliarini DJ, et al. Obesity-dependent CDK1 signaling stimulates mitochondrial respiration at complex I in pancreatic β-cells. J Biol Chem. (2019) 294:4656–66. doi: 10.1074/jbc.RA118.006085
31. Morcillo S, Martín-Núñez GM, García-Serrano S, Gutierrez-Repiso C, Rodriguez-Pacheco F, Valdes S, et al. Changes in SCD gene DNA methylation after bariatric surgery in morbidly obese patients are associated with free fatty acids. Sci Rep. (2017) 7:46292. doi: 10.1038/srep46292
32. Guo J, Jou W, Gavrilova O, Hall KD. Persistent diet-induced obesity in male C57BL/6 mice resulting from temporary obesigenic diets. PLoS ONE. (2009) 4:e5370. doi: 10.1371/journal.pone.0005370
33. Bintu L, Yong J, Antebi YE, McCue K, Kazuki Y, Uno N, et al. Dynamics of epigenetic regulation at the single-cell level. Science. (2016) 351:720–4. doi: 10.1126/science.aab2956
34. Horvath S. DNA methylation age of human tissues and cell types. Genome Biol. (2013) 14. doi: 10.1186/gb-2013-14-10-r115
35. Short KR, Bigelow ML, Kahl J, Singh R, Coenen-Schimke J, Raghavakaimal S, et al. Decline in skeletal muscle mitochondrial function with aging in humans. Proc Natl Acad Sci USA. (2005) 102:5618–23. doi: 10.1073/pnas.0501559102
36. Miao F, Chen Z, Genuth S, Paterson A, Zhang L, Wu X, et al. Evaluating the role of epigenetic histone modifications in the metabolic memory of type 1 diabetes. Diabetes. (2014) 63:1748–62. doi: 10.2337/db13-1251
37. Chen Z, Miao F, Paterson AD, Lachin JM, Zhang L, Schones DE, et al. Epigenomic profiling reveals an association between persistence of DNA methylation and metabolic memory in the DCCT/EDIC type 1 diabetes cohort. Proc Natl Acad Sci USAA. (2016) 113:E3002–11. doi: 10.1073/pnas.1603712113
38. Reddy MA, Zhang E, Natarajan R. Epigenetic mechanisms in diabetic complications and metabolic memory. Diabetologia. (2015) 58:443–55. doi: 10.1007/s00125-014-3462-y
Keywords: obesity, mouse strains, DNA methylation, weight loss, liver
Citation: Edillor CR, Parks BW, Mehrabian M, Lusis AJ and Pellegrini M (2019) DNA Methylation Changes More Slowly Than Physiological States in Response to Weight Loss in Genetically Diverse Mouse Strains. Front. Endocrinol. 10:882. doi: 10.3389/fendo.2019.00882
Received: 24 July 2019; Accepted: 03 December 2019;
Published: 20 December 2019.
Edited by:
María M. Malagón, Instituto Maimonides de Investigación Biomédica de Cordoba (IMIBIC), SpainReviewed by:
Peter L. Molloy, Commonwealth Scientific and Industrial Research Organisation (CSIRO), AustraliaAna B. Crujeiras, Complejo Hospitalario Universitario de Santiago, Spain
Copyright © 2019 Edillor, Parks, Mehrabian, Lusis and Pellegrini. This is an open-access article distributed under the terms of the Creative Commons Attribution License (CC BY). The use, distribution or reproduction in other forums is permitted, provided the original author(s) and the copyright owner(s) are credited and that the original publication in this journal is cited, in accordance with accepted academic practice. No use, distribution or reproduction is permitted which does not comply with these terms.
*Correspondence: Matteo Pellegrini, matteop@mcdb.ucla.edu