 Yu Xia
 Haifeng Zhang
 Heng Wang
 Qiufei Wang
 Pengfei Zhu
 Ye Gu
Ye Gu Huilin Yang
 Dechun Geng
- 1Department of Orthopedics, The First Affiliated Hospital of Soochow University, Suzhou, China
- 2Department of Orthopedics, Changshu Hospital Affiliated to Soochow University, First People’s Hospital of Changshu City, Changshu, China
Primary osteoporosis has long been underdiagnosed and undertreated. Currently, ferroptosis may be a promising research direction in the prevention and treatment of primary osteoporosis. However, the specific mechanism of ferroptosis in primary osteoporosis remains a mystery. Differentially expressed genes (DEGs) were identified in bone mesenchymal stromal cells (BMSCs) of primary osteoporosis and heathy patients from the GEO databases with the help of bioinformatics analysis. Then, we intersected these DEGs with the ferroptosis dataset and obtained 80 Ferr-DEGs. Several bioinformatics algorithms (PCA, RLE, Limma, BC, MCC, etc.) were adopted to integrate the results. Additionally, we explored the potential functional roles of the Ferr-DEGs via GO and KEGG. Protein–protein interactions (PPI) were used to predict potential interactive networks. Finally, 80 Ferr-DEGs and 5 key Ferr-DEGs were calculated. The 5 key Ferr-DEGs were further verified in the OVX mouse model. In conclusion, through a variety of bioinformatics methods, our research successfully identified 5 key Ferr-DEGs associated with primary osteoporosis and ferroptosis, namely, sirtuin 1(SIRT1), heat shock protein family A (Hsp70) member 5 (HSPA5), mechanistic target of rapamycin kinase (MTOR), hypoxia inducible factor 1 subunit alpha (HIF1A) and beclin 1 (BECN1), which were verified in an animal model.
Introduction
As a complex bone metabolism disorder mainly characterized by bone loss and bone microstructure changes, primary osteoporosis has long been underdiagnosed and undertreated (1–4). Approximately 40% of postmenopausal white women are affected by osteoporosis. The aging population will exacerbate the medical and socioeconomic effects of osteoporosis. A patient with osteoporosis has a 40% lifetime fracture risk, and most of them occur in the spine, hip or wrist (5). Osteoporotic fractures affect 8.9 million people around the world per year. It is expected that osteoporotic hip fractures among elderly men will increase by 310% and 240% in women by 2050 (6, 7). Osteoporosis and its complications have become a worldwide health crisis.
As a recently identified regulated cell death (RCD), ferroptosis differs from apoptosis (8), necrosis (9), autophagy (10), pyroptosis (11), etc. The main characteristics of ferroptosis are iron-dependent lipid peroxidation and reactive oxygen species (ROS) accumulation (12, 13). It involves multiple signaling pathways and their regulators (14) and has been extensively studied in the treatment of cancers, such as renal carcinoma and leukemia (15, 16) and hepatocellular carcinoma (17). Ferroptosis has been observed to be associated with various noncancer diseases, such as neurological diseases (18, 19), viral infection, ischemia and reperfusion injury, and atherosclerosis (20). Interestingly, a number of studies have suggested that ferroptosis may be a promising research direction in the prevention and treatment of osteoporosis (21–23).
Bone mesenchymal stromal cells (BMSCs) are pluripotent mesenchymal cells that can differentiate into different lineages, such as osteoblasts and adipocytes (24). BMSCs play an important role in maintaining bone homeostasis. As a result, osteoporosis is always accompanied by the low osteogenic potential of circulating BMSCs (25), the two form a vicious cycle, exacerbating the progression of osteoporosis. The delicate balance between osteogenic and lipogenic differentiation of BMSCs will be disrupted during the onset of osteoporosis (26). Under certain conditions, ferroptosis can also occur during the process of directional differentiation of BMSCs (27). At present, some researchers have also studied the mechanisms related to ferroptosis and several signaling pathways had been confirmed to play a role in the process of ferroptosis related osteoporosis (28). It is the existing basic research that provides inspiration and guidance for this study. Despite this, the specific mechanisms and related signaling pathways of ferroptosis remain mysterious in osteoporosis.
Bioinformatics analysis of ferroptosis genes in primary osteoporosis has not been reported to date. Thus, we identified DEGs in BMSCs of primary osteoporosis and healthy patients from the GEO databases with the help of bioinformatics analysis. By intersecting these DEGs with the ferroptosis dataset, ferroptosis DEGs (Ferr-DEGs) were obtained. After that, protein–protein interactions (PPI) were used to predict potential interactive networks. Then, the key Ferr-DEGs we obtained were further verified by an experimental OVX model. We have discovered the potential functional role of ferroptosis in BMSCs for the first time and have laid a possible foundation for understanding the pathological mechanism of primary osteoporosis.
Materials and methods
Microarray data collection
Information on primary osteoporosis patients was downloaded from the Gene Expression Omnibus (GEO; http://www.ncbi.nlm.nih.gov/geo), a public database that collects gene sequencing results (29). We downloaded the raw data of GSE35958 uploaded by Benisch from GEO (30). Five samples of primary osteoporosis (GSM878104, GSM878105, GSM878106, GSM878107, GSM878108; op group) and four controls (GSM878100, GSM878101, GSM878102, GSM878103; ctrl group) in GSE35958 were collected. A detailed table of patients’ parameters can be seen in Supplementary Table S1.
Datasets analysis
Bioconductor was used to download the annotated R 4.0.3 package, and R was used to convert the microarray probes to symbols. When multiple probes corresponded to one gene ID, the average value was taken for analysis. Principal component analysis (PCA) was used to determine the significant difference dimensions with a P value < 0.05 (31). Relative log expression (RLE) was used for quality control (32). We used Limma to identify the DEGs. P-Value <0.05 and |log2-fold change (FC)| >1 were considered statistically significant (33). In addition, the Ferroptosis Database (FerrDb; http://www.zhounan.org/ferrdb) provided us with a dataset containing 259 genes (34). Then, we intersected it with the DEGs of GSE35958 to obtain ferroptosis DEGs (Ferr-DEGs).
Functional enrichment analysis and visualization
Metascape (http://metascape.org) was used to determine gene functions (35). Biological process (BP), cellular component (CC) and molecular function (MF) are the three major components of gene ontology (GO), which are used to describe gene functions and interactions (36).. The Kyoto Encyclopedia of Genes and Genomes (KEGG) Pathway Database is an extensive database for mapping pathway annotation results (37, 38). GO and KEGG analyses were performed to explore the functional roles of the Ferr-DEGs via Metascape, and Cytoscape (V3.7.2) was used for visualization (39, 40). We then chose molecular complex detection (MCODE) to identify the interconnected central genes. Different colors are used to represent each MCODE network and the close interactions between molecules. During the interaction enrichment analysis, the minimum and maximum sizes of the selection network were 3 and 500, respectively.
Protein–protein interaction network analysis
Then, Ferr-DEGs were uploaded to STRING (https://string-db.org/) to predict and construct PPI networks with a confidence level of >0.4 (41, 42). The node degree of proteins analyzed by STRING was used for ranking. Cytoscape was used to visualize the network. Nodes represent genes, and edges represent connections between genes. Genes were ranked by size according to the betweenness centrality (BC) score analyzed by the CytoNCA plugin. The cytoHubba plugin was used to rank genes by depth of the color corresponding to the weighted score based upon maximal clique centrality (MCC) algorithms (43, 44).
Identification of key Ferr-DEGs
Protein and gene expression profiles at the tissue level (high, medium, low, NA) were obtained from the Human Protein Atlas database (HPA, https://www.proteinatlas.org). After calculation, we regarded the top ranked genes of each algorithm as hub genes and then took the trend of tissue expression and intersected most of those algorithms as the 5 most likely key Ferr-DEGs.
OVX model construction and cell culture
We selected twelve eight-week-old female C57BL/6 mice (provided by the Experimental Animal Center of Soochow University) for osteoporosis induction experiments (45). Mice were randomly divided into two groups: the ovariectomy (OVX) and sham groups. Eight weeks after surgery, all the specimens of the left femurs were removed for microCT and histological experiments. The right femurs were removed for BMSCs collection. Blood was collected by eyeballs removing, and the serum was separated by centrifugation at 2,000 r/m for 20 min and frozen at -80°C for future analysis. All procedures and experiments were approved by the Animal Ethics Committee of the First Affiliated Hospital of Soochow University.
BMSCs were obtained from the right femurs according to the protocol (46). Cells were seeded in a 10-cm2 dish and incubated in a 37°C incubator with 5% CO2. BMSCs after three passages were used for subsequent experiments.
Micro-CT analysis
Left femur samples were scanned with a SkyScan 1176 micro-CT (Aartselaar, Belgium) (n = 6/group) after fixation in 10% buffered formalin for 48 h. Three-dimensional (3D) histomorphometric images were constructed by using NRecon software (SkyScan micro-CT, Aartselaar, Belgium). Bone mineral density (BMD), bone volume (BV), trabecular number (Tb. N), bone volume per tissue volume (BV/TV) and trabecular separation (Tb.sp) were used to evaluate bone mass. The region of interest (ROI) began with 100 pieces below the femur growth plate, and 200 pieces (6 µm each) were read per sample.
RT–PCR
Total cellular RNA was obtained from BMSCs using TRIzol reagent (Beyotime, China), reverse transcription and amplification were performed using qRT supermix and SYBR qPCR master mix (Vazyme, China) according to the protocol. RT–PCR was performed in a CFX96™ thermal cycler (Bio-Rad Laboratories, USA). GAPDH was used as an internal reference to calculate the relative mRNA expression level. The primers are listed below: forward 5′-3′: GGTTGTCTCCTGCGACTTCA, reverse 5′-3′: TGGTCCAGGGTTTCTTACTCC for Gapdh. Forward 5′-3′: CGCTGTGGCAGATTGTTATTAA, reverse 5′-3′: TTGATCTGAAGTCAGGAATCCC for Sirt1. Forward 5′-3′: ATGATGAAGTTCACTGTGGTGG, reverse 5′-3′: CTGATCGTTGGCTATGATCTCC for Hspa5. Forward 5′-3′: CTGATCCTCAACGAGCTAGTTC, reverse 5′-3′: GGTCTTTGCAGTACTTGTCATG, for Mtor. Forward 5′-3′: GAATGAAGTGCACCCTAACAAG, reverse 5′-3′: GAGGAATGGGTTCACAAATCAG for Hif1a. Forward 5′-3′: TAATAGCTTCACTCTGATCGGG, reverse 5′-3′: CAAACAGCGTTTGTAGTTCTGA for Becn1.
Lipid peroxidation assay
A Lipid Peroxidation Malondialdehyde (MDA) Assay Kit (Beyotime, China) was used to measure lipid peroxidation levels. Serum can be used directly for MDA detection. Cells were homogenized on ice in cell lysis buffer (Beyotime, China). After homogenization followed by centrifugation at 12,000×g for 10 minutes, the supernatant was collected for MDA assays. A 100 μl sample was added to each vial containing 200 μl of MDA detection working solution. The samples were mixed and incubated at 100°C for 15 mins. The samples were cooled to room temperature in a water bath and centrifuged at 1000×g for 10 minutes at room temperature. Then, 200 μl supernatant from each sample was pipetted into a 96-well plate, and the absorbance was measured at 532 nm with a microplate reader. MDA content was determined according to the standard curve.
Iron assay
Serum and cellular iron levels were measured by an iron Content Assay Kit (Solarbio, China). Serum can be used directly for iron assay. 100μl serum was mixed with 250 μl of working solution and incubated at 100°C for 5 mins. The samples were cooled to room temperature in a water bath, mixed with 62 μl chloroform, and centrifuged at 10000×g for 10 minutes at room temperature. Then, 210 μl supernatant from each sample was pipetted into a 96-well plate, and the absorbance was measured at 520 nm. BMSCs were homogenized on ice in cell lysis buffer (Beyotime, China). After homogenization followed by centrifugation at 12,000×g for 10 minutes, 20 μl supernatant was collected and mixed with 180 μl working buffer at 25°C for 10 min, and then the absorbance was measured at 510 nm. A standard curve was simultaneously generated according to the manufacturer’s instructions.
Immunofluorescence staining
We used immunofluorescence (IF) staining to detect the expression of Ferr-DEGs between the two groups. Antigen repair of the sections was performed, and the sections were blocked with horse serum. Finally, the primary antibody was incubated at 4°C overnight, and fluorescent-labeled secondary antibodies (ab150079, abcam, UK) were incubated at room temperature for 1 hour. The localization and protein expression level of Becn1 (A7353, ABclonal, China) were observed by IF staining under an AxioCam HRC microscope (Carl Zeiss, Germany).
Statistical analysis
The quantitative data are presented as the mean ± SD. Student’s t test was used to compare the differences between two groups. Each assay condition was performed in triplicate for all quantitative assays. A P value <0.05 was defined as statistically significant.
Results
Data quality control and identification of Ferr-DEGs
A schematic diagram of this study and the main findings is shown in Figure 1. Samples from GEO were divided into two groups [primary osteoporosis (OP) group versus control (Ctrl) group]. PCA and RLE analysis were performed to determine available dimensions and screen correlated samples according to quality control standards and the normalization of raw data. PCA demonstrated significant differences between the op group and the ctrl group (Supplementary Figure S1A). The RLE plots showed that the normalization was acceptable (Supplementary Figure S1B).
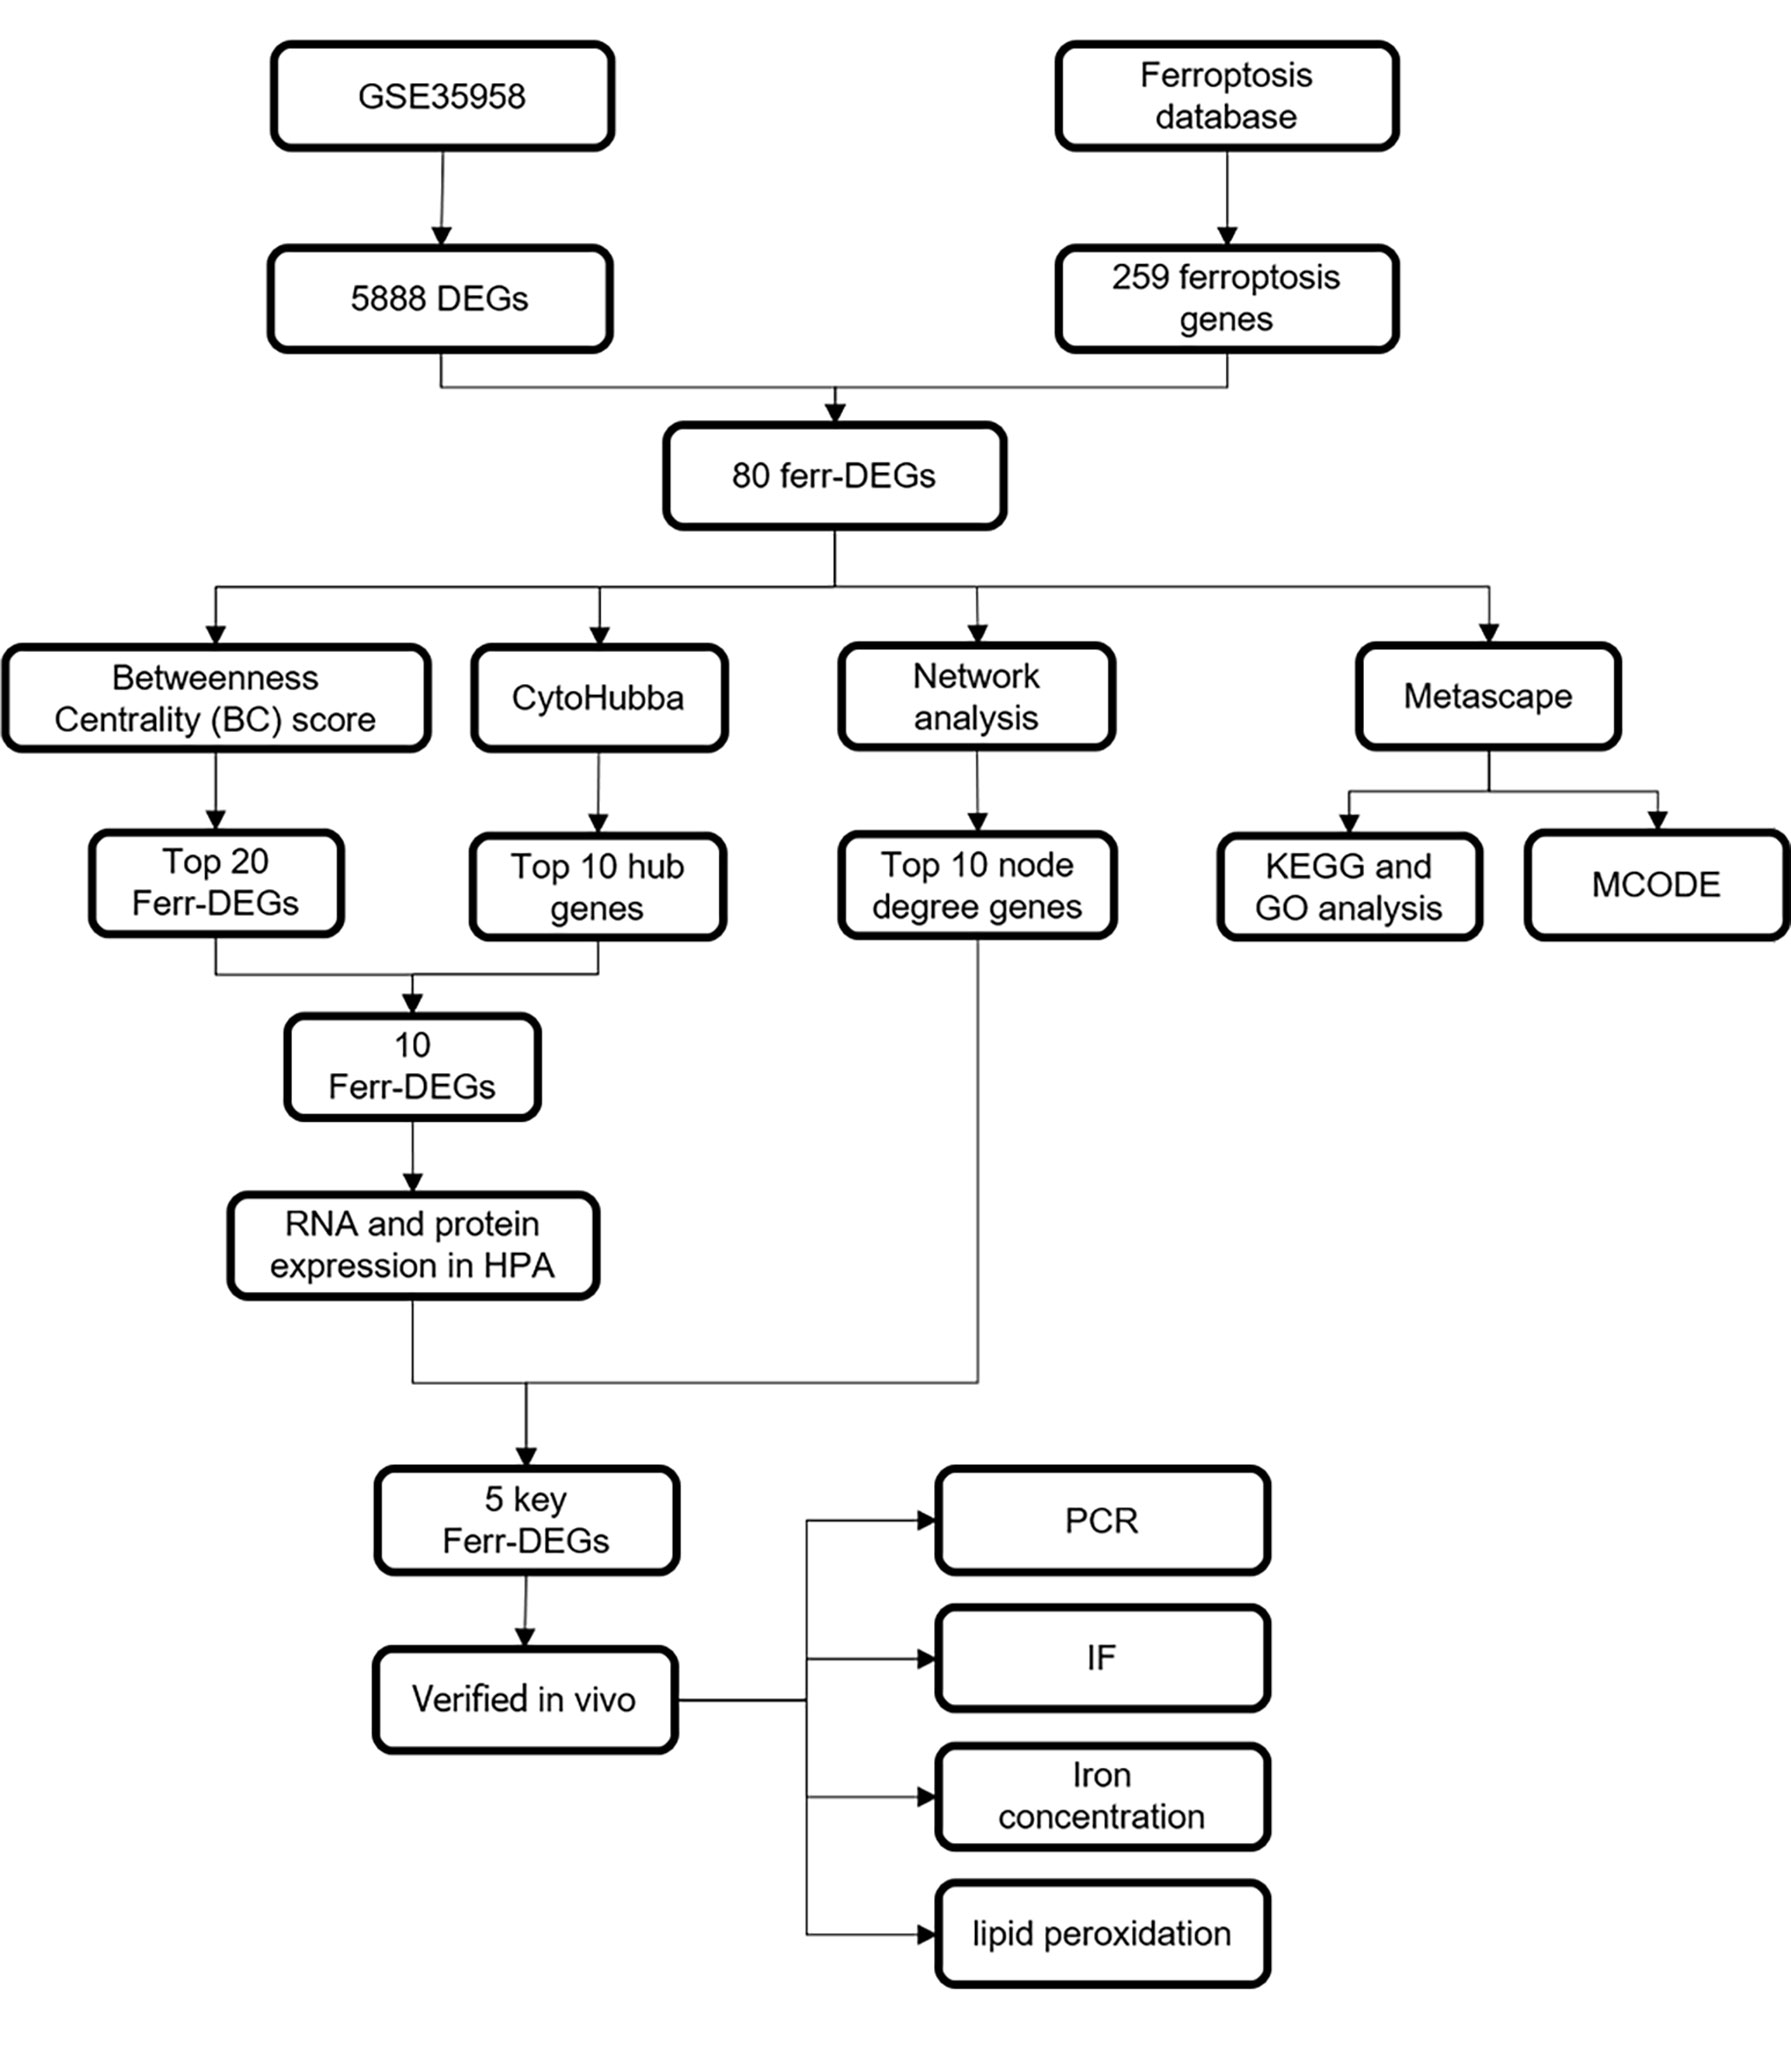
Figure 1 Schematic diagram showing the study design.
We first analyzed the DEGs of GSE35958 by using the “Limma” package and presented it in a volcano plot (Figure 2B) and heatmap (Supplementary Figure S2). Then, we obtained a gene set including 259 genes from FerrDb and intersected them with the DEGs of GSE35958 to identify Ferr-DEGs. Eighty Ferr-DEGs were found and are shown in a heatmap and Venn diagram (Figures 2A, C). The Ferr-DEGs were further divided into driver, suppressor and marker according to FerrDb (Table 1).
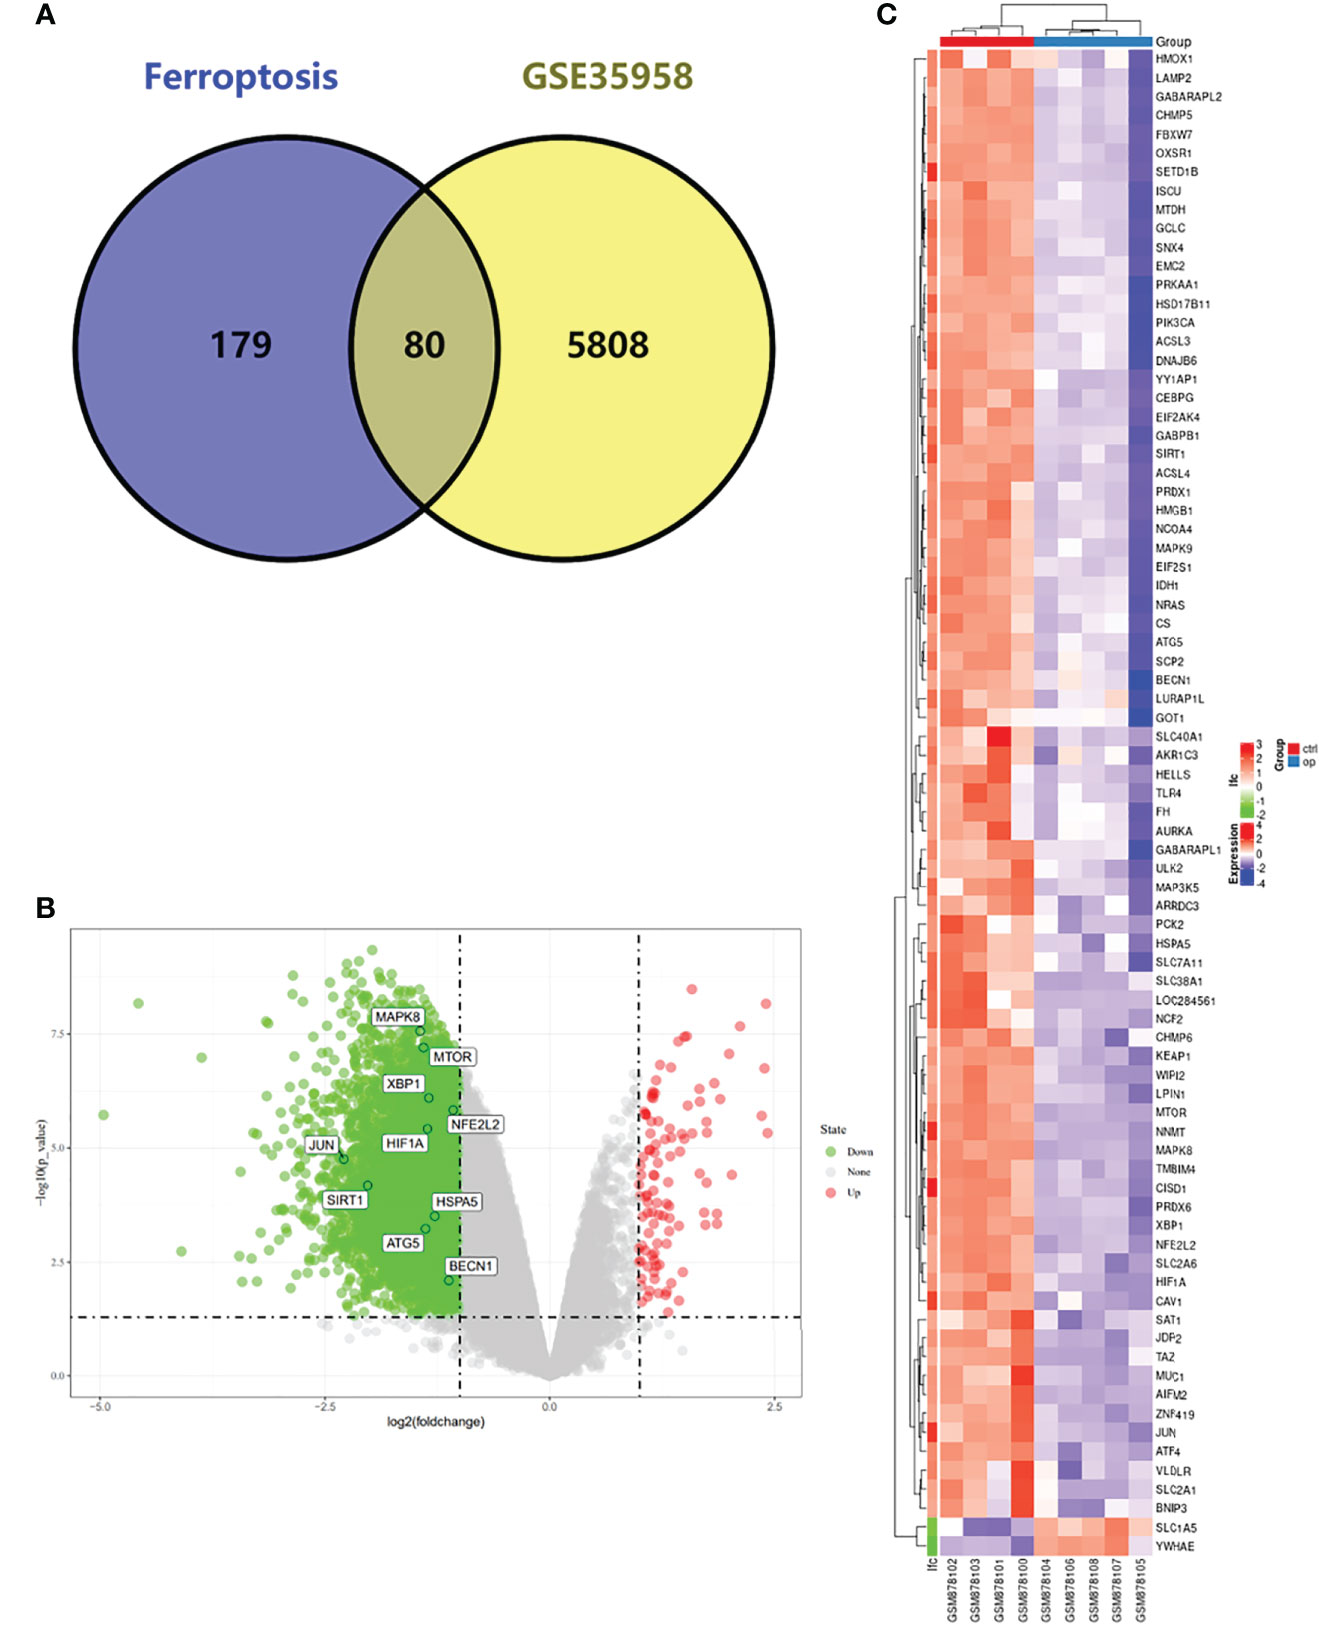
Figure 2 Detection of differentially expressed genes (DEGs) in the GSE35958 and Identification of shared DEGs with ferroptosis. (A) Venn diagram of DEGs in ferroptosis and GSE35958. (B) Volcano map of GSE35958, red represent up-regulated genes and green represent down-regulated genes, The top 10 genes identified by CytoHubba were marked in the diagram. (C) An expression heat map of the 80 Ferr-DEGs in GSE35958 dataset.
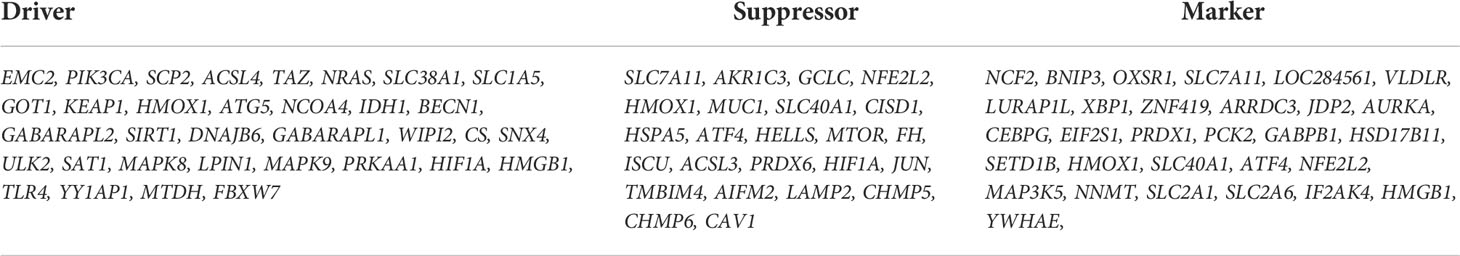
Table 1 Summary of the Ferr-DEGs.
Enrichment analysis of Ferr-DEGs
Gene Ontology (GO) enrichment and Kyoto Encyclopedia of Genes and Genomes (KEGG) Pathway Database were used to analyze the biological classification of Ferr-DEGs by using Meyascape. The respective results of BP, CC, MF and KEGG are shown in detail (Supplementary Figure S3). The results showed that the significantly enriched genes were involved in the cellular response to stress, response to starvation, ferroptosis, autophagy, response to iron ion, etc. To further understand the relationships between different terms, we visualized it as a network plot (Figures 3A, B). Details of the top 20 terms are listed in the table (Figure 3C).
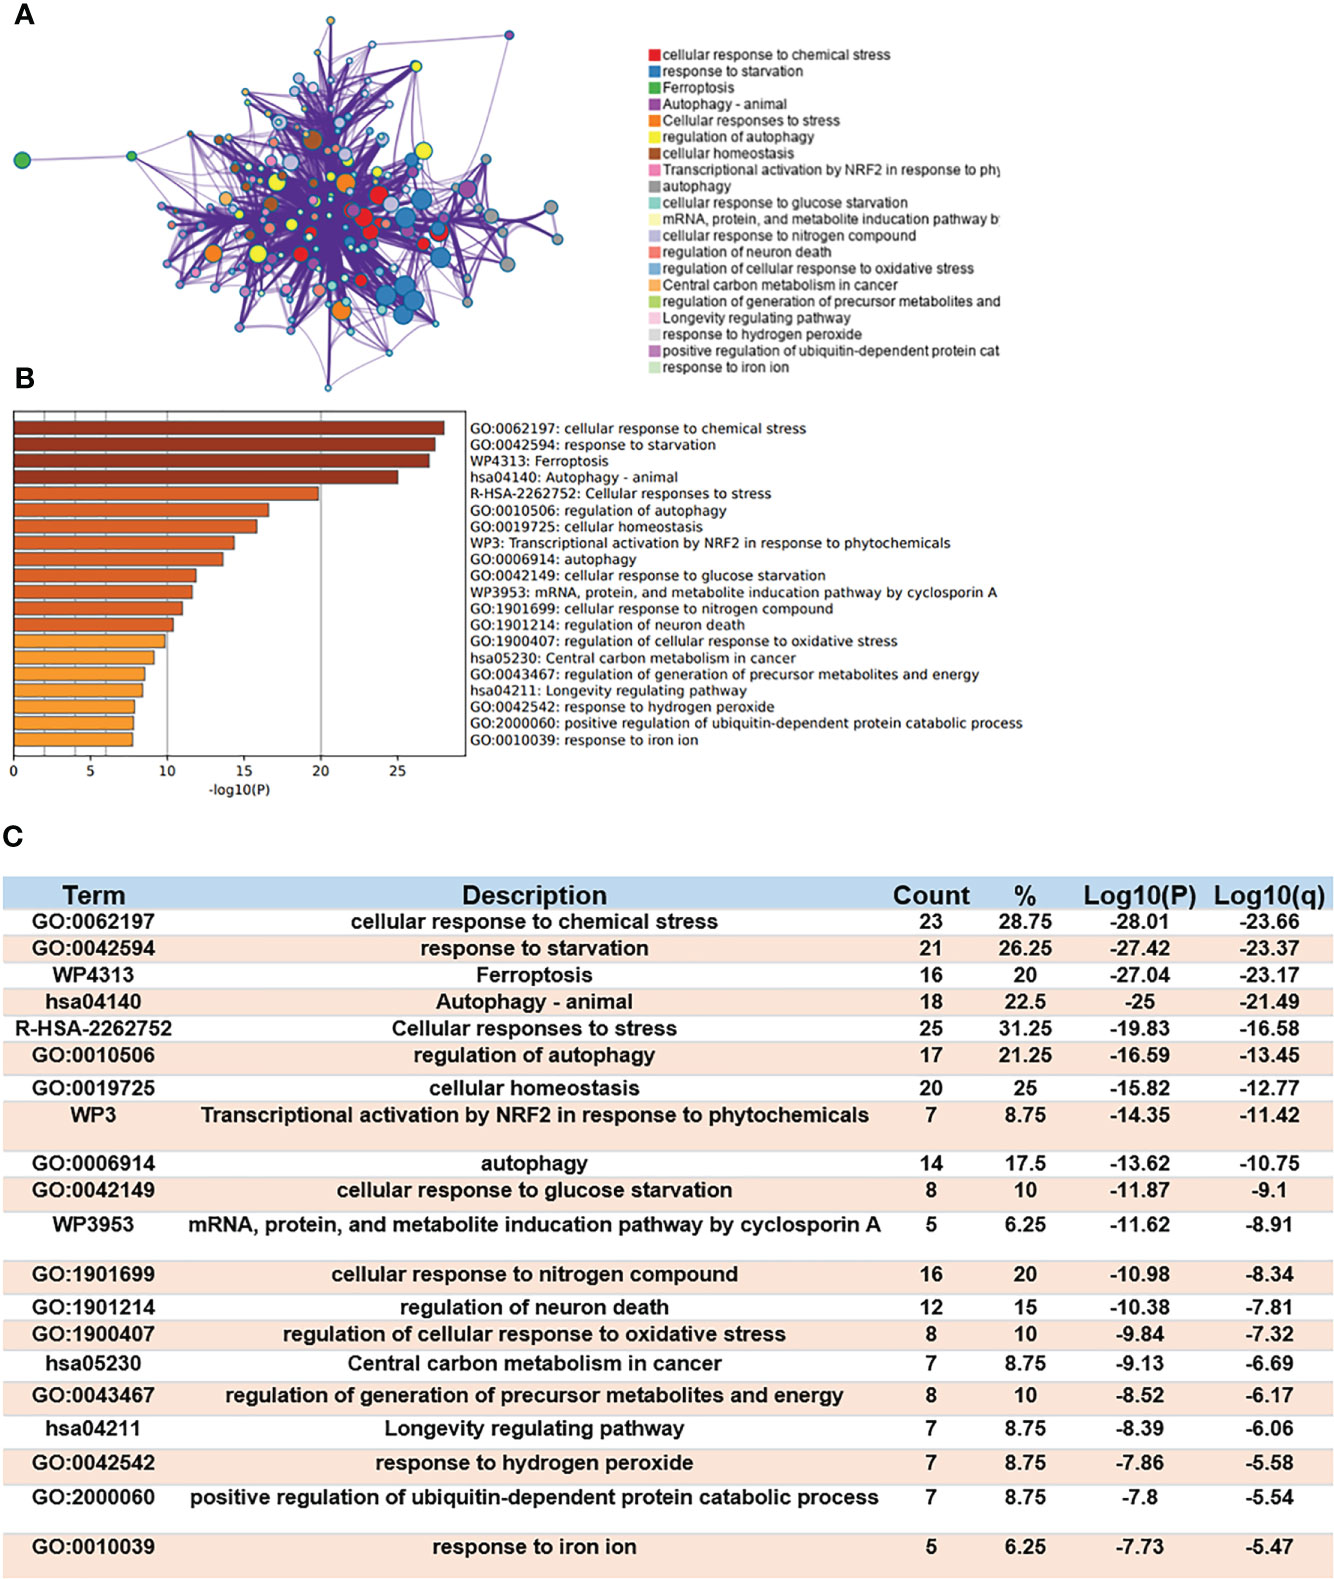
Figure 3 Functional enrichment analysis of DEGs. (A) Network of enriched terms. (B) A bar chart of top 20 biological pathways based on the P-value and the percentage of genes. (C) Details of top 20 biological pathways were listed in table.
The MCODE algorithm was applied to explore those highly connected modules, and three of them were found (Figures 4A–D), The genes in Module 1 were associated with nongenomic actions of 1,25 dihydroxyvitamin D3, transcriptional activation by NFE2 like bZIP transcription factor 2(NFE2L2) in response to phytochemicals and regulation of protein transport. The genes in Module 2 were associated with autophagy and the response to starvation. The genes in Module 3 were related to protein processing and cellular responses to stress (Figure 4E).
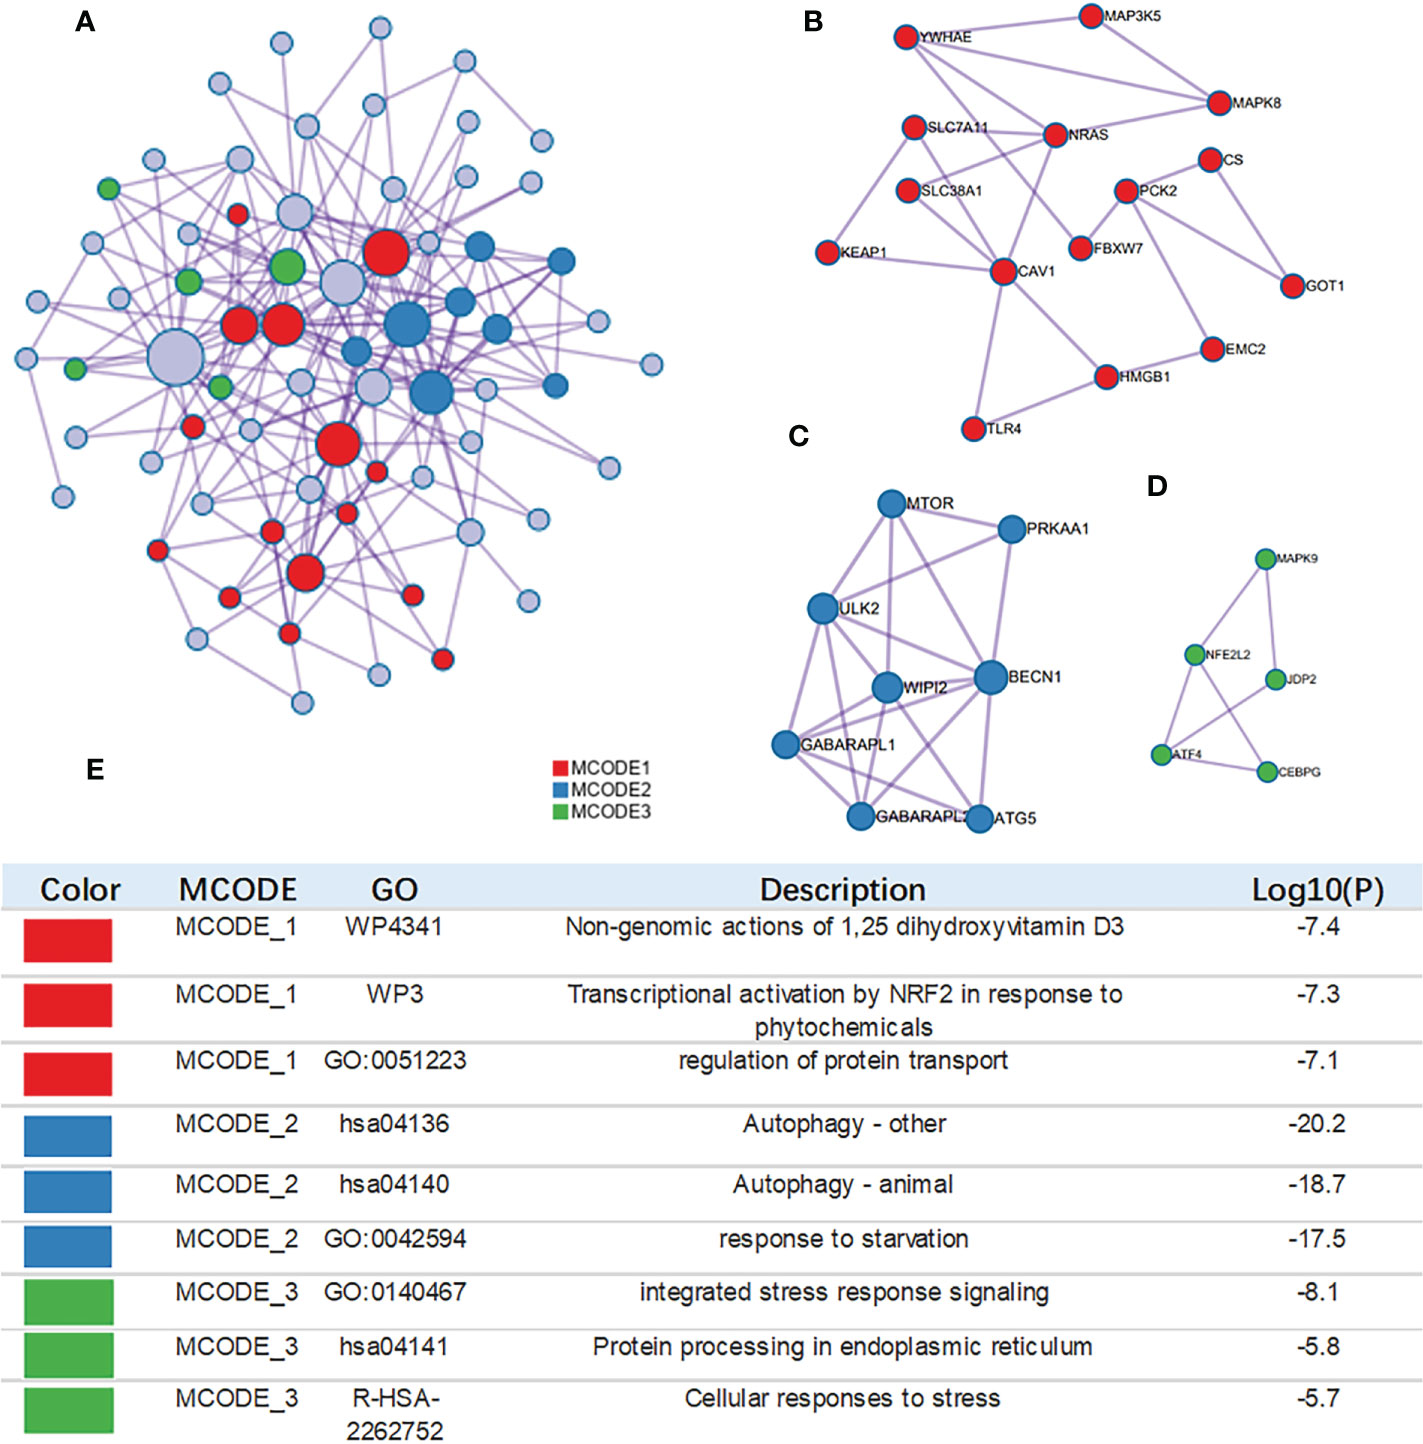
Figure 4 Construction of interactive network. (A) GO enrichment analysis was applied to each MCODE network. The same color nodes represent an interactive network and perform similar biological functions. (B–D) Three MCODE components were constructed with the screened hub genes. (E) Details of the 3 clusters were shown in table.
PPI network analysis and construction of Ferr-DEGs
Because one of the 80 genes was not related to other molecules and did not form a molecular network, we obtained a PPI network containing 79 nodes and 348 edges. Node degree of proteins analyzed by STRING was used to rank, and the top 10 genes were mechanistic target of rapamycin kinase (MTOR), hypoxia inducible factor 1 subunit alpha (HIF1A), beclin 1 (BECN1), sirtuin 1(SIRT1), heat shock protein family A (Hsp70) member 5 (HSPA5), Jun proto-oncogene (JUN), NFE2L2, kelch like ECH associated protein 1(KEAP1), autophagy related 5 (ATG5) and heme oxygenase 1 (HMOX1) (details in Supplementary Table S2). Then, Cytoscape was used to visualize the network. The Ferr-DEG PPI network was constructed by CytoNCA. The top 20 genes are shown inside the circle, and the genes were ranked by size according to the betweenness centrality (BC) score (Figure 5A). Furthermore, we obtained the top 10 hub genes with the highest degree values by using CytoHubba (Figure 5B). Their descriptions and functions are shown in the table (Figure 5C).
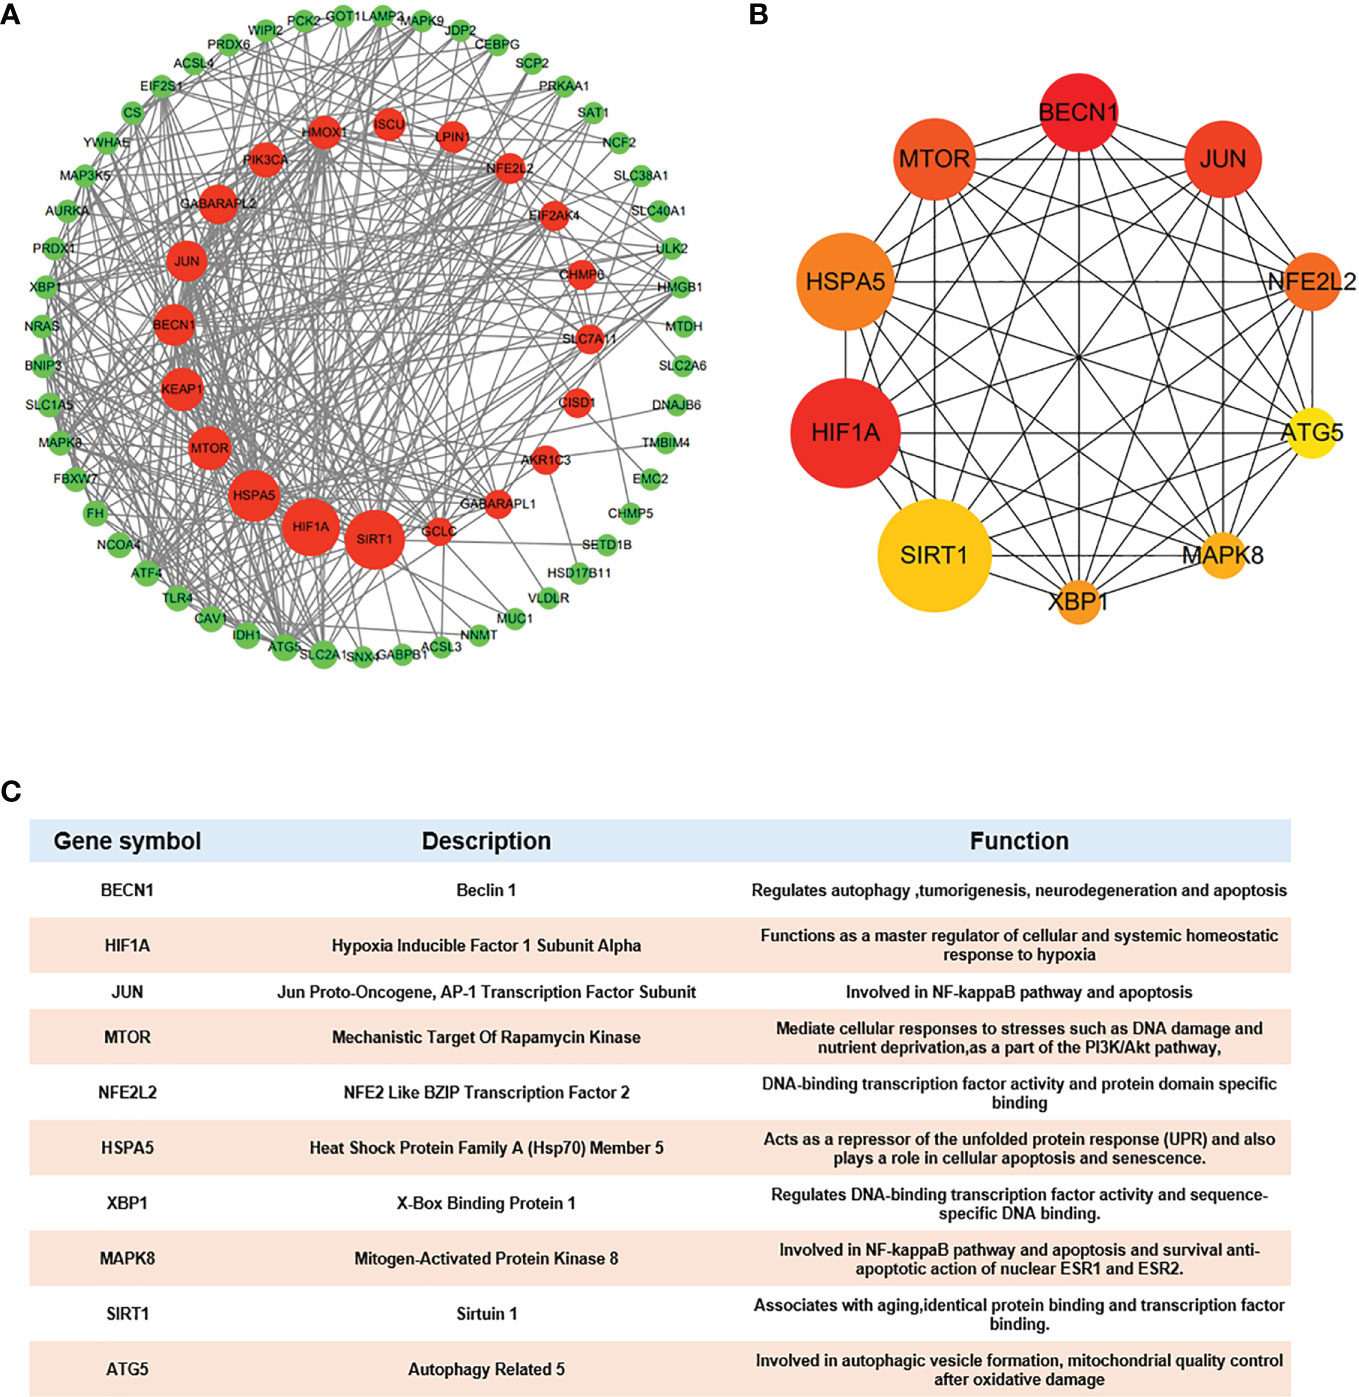
Figure 5 Hub gene identification (A) DEG PPI network constructed using Cytoscape, top 20 genes were shown inside the circle, genes were ranked by size according to Betweenness Centrality (BC) score. (B) Top 10 genes with the highest degree values were identified using CytoHubba and the depth of the color correspond to the weighted score. (C) The description and function of 10 hub genes were shown in table.
Selection and analysis of key Ferr-DEGs
We took the top gene in each algorithm as hub genes of different algorithms. After calculation, 10 Ferr-DEGs were obtained for further research. According to the literature, BMSCs tend to differentiate into adipogenic cells rather than osteogenic cells in osteoporosis patients. Therefore, protein and gene expression profiles at the tissue level (high, medium, low, NA) were obtained from HPA. We used the differences in their expression levels in adipose and bone marrow tissues as a preliminary reference for key Ferr-DEGs (Supplementary Figure S4). At the protein level, the expression of SIRT1, MAPK8(Mitogen-activated protein kinase 8), NFE2L2, HIF1A and BECN1 in bone marrow was higher than that in adipose tissues. In contrast, the expression of ATG5 was higher in adipose tissues, and the expression level of HSPA5 was the same, while XBP1(X-box binding protein 1) and JUN were not detected in either tissue. At the gene level, the expression of SIRT1, MAPK8, XBP1, HSPA5, HIF1A and BECN1 in bone marrow was higher than that in adipose tissues, and in contrast, the expression of ATG5, NFE2L2, MTOR and JUN was higher in adipose tissues. Finally, we considered the trends of protein level and gene expression in tissues and intersected most of those algorithms as the 5 most likely key Ferr-DEGs, including SIRT1, HSPA5, MTOR, HIF1A and BECN1 (Figures 6A, B).

Figure 6 The expression analysis of hub genes in human tissues according to Human Protein Atlas data base. (A) Summary of RNA expression (fold change). (B) Summary of protein expression. H: high; M: medium; L: low; N: not detected.
Validation of the key Ferr-DEGs in vivo
To verify the key Ferr-DEGs in vivo, an OVX mouse model was used for validation. The OVX model was successfully established in C57BL/6 mice 8 weeks after surgery. The microCT results showed that the BMD, BV, BV/TV and Tb. N of the OVX group were decreased, while Tb.sp was increased (Figure 7). Meanwhile, the mRNAs of BMSCs isolated from the femurs were used to detect the expression of those 5 key Ferr-DEGs. The results showed that the relative mRNA expression levels of Sirt1, Hspa5, Mtor, Hif1a and Becn1 in the OVX group were significantly lower than those in the sham group (Figures 8A–E). To further validate the expression of these five differentially expressed genes in vivo, we chose Becn1 as the representative target, and IF staining was used for evaluation. The results showed that BECN1 was significantly more highly expressed in the sham group than in the OVX group (Figures 8F, G).
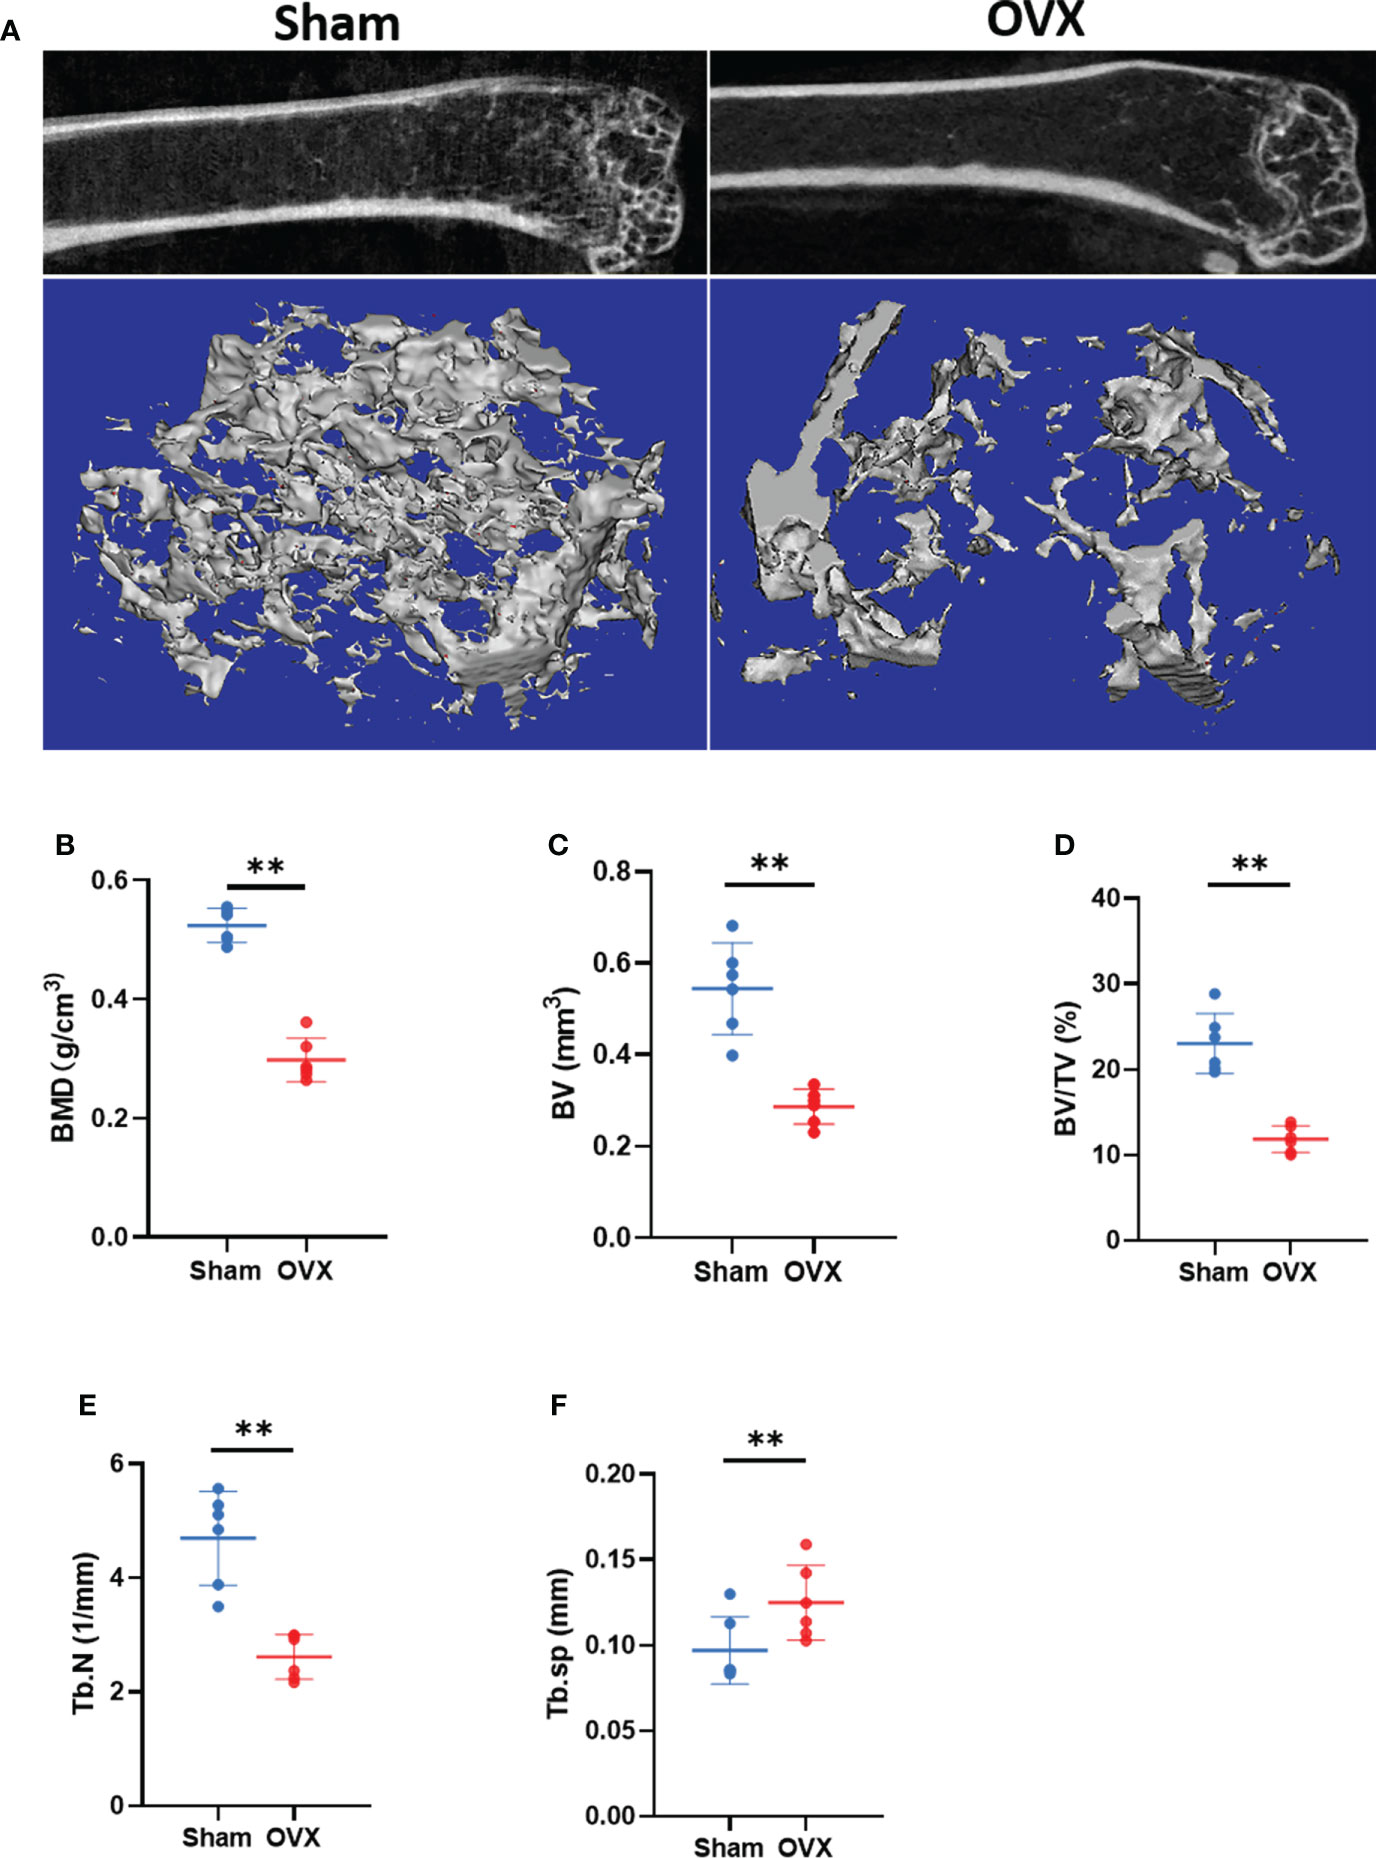
Figure 7 Micro CT results and analysis. (A) Representative 3D micro-CT reconstruction images of Sham and OVX group. (B–F) Quantitative analysis of bone parameters. (The data are expressed as the mean ± sd **P < 0.01).
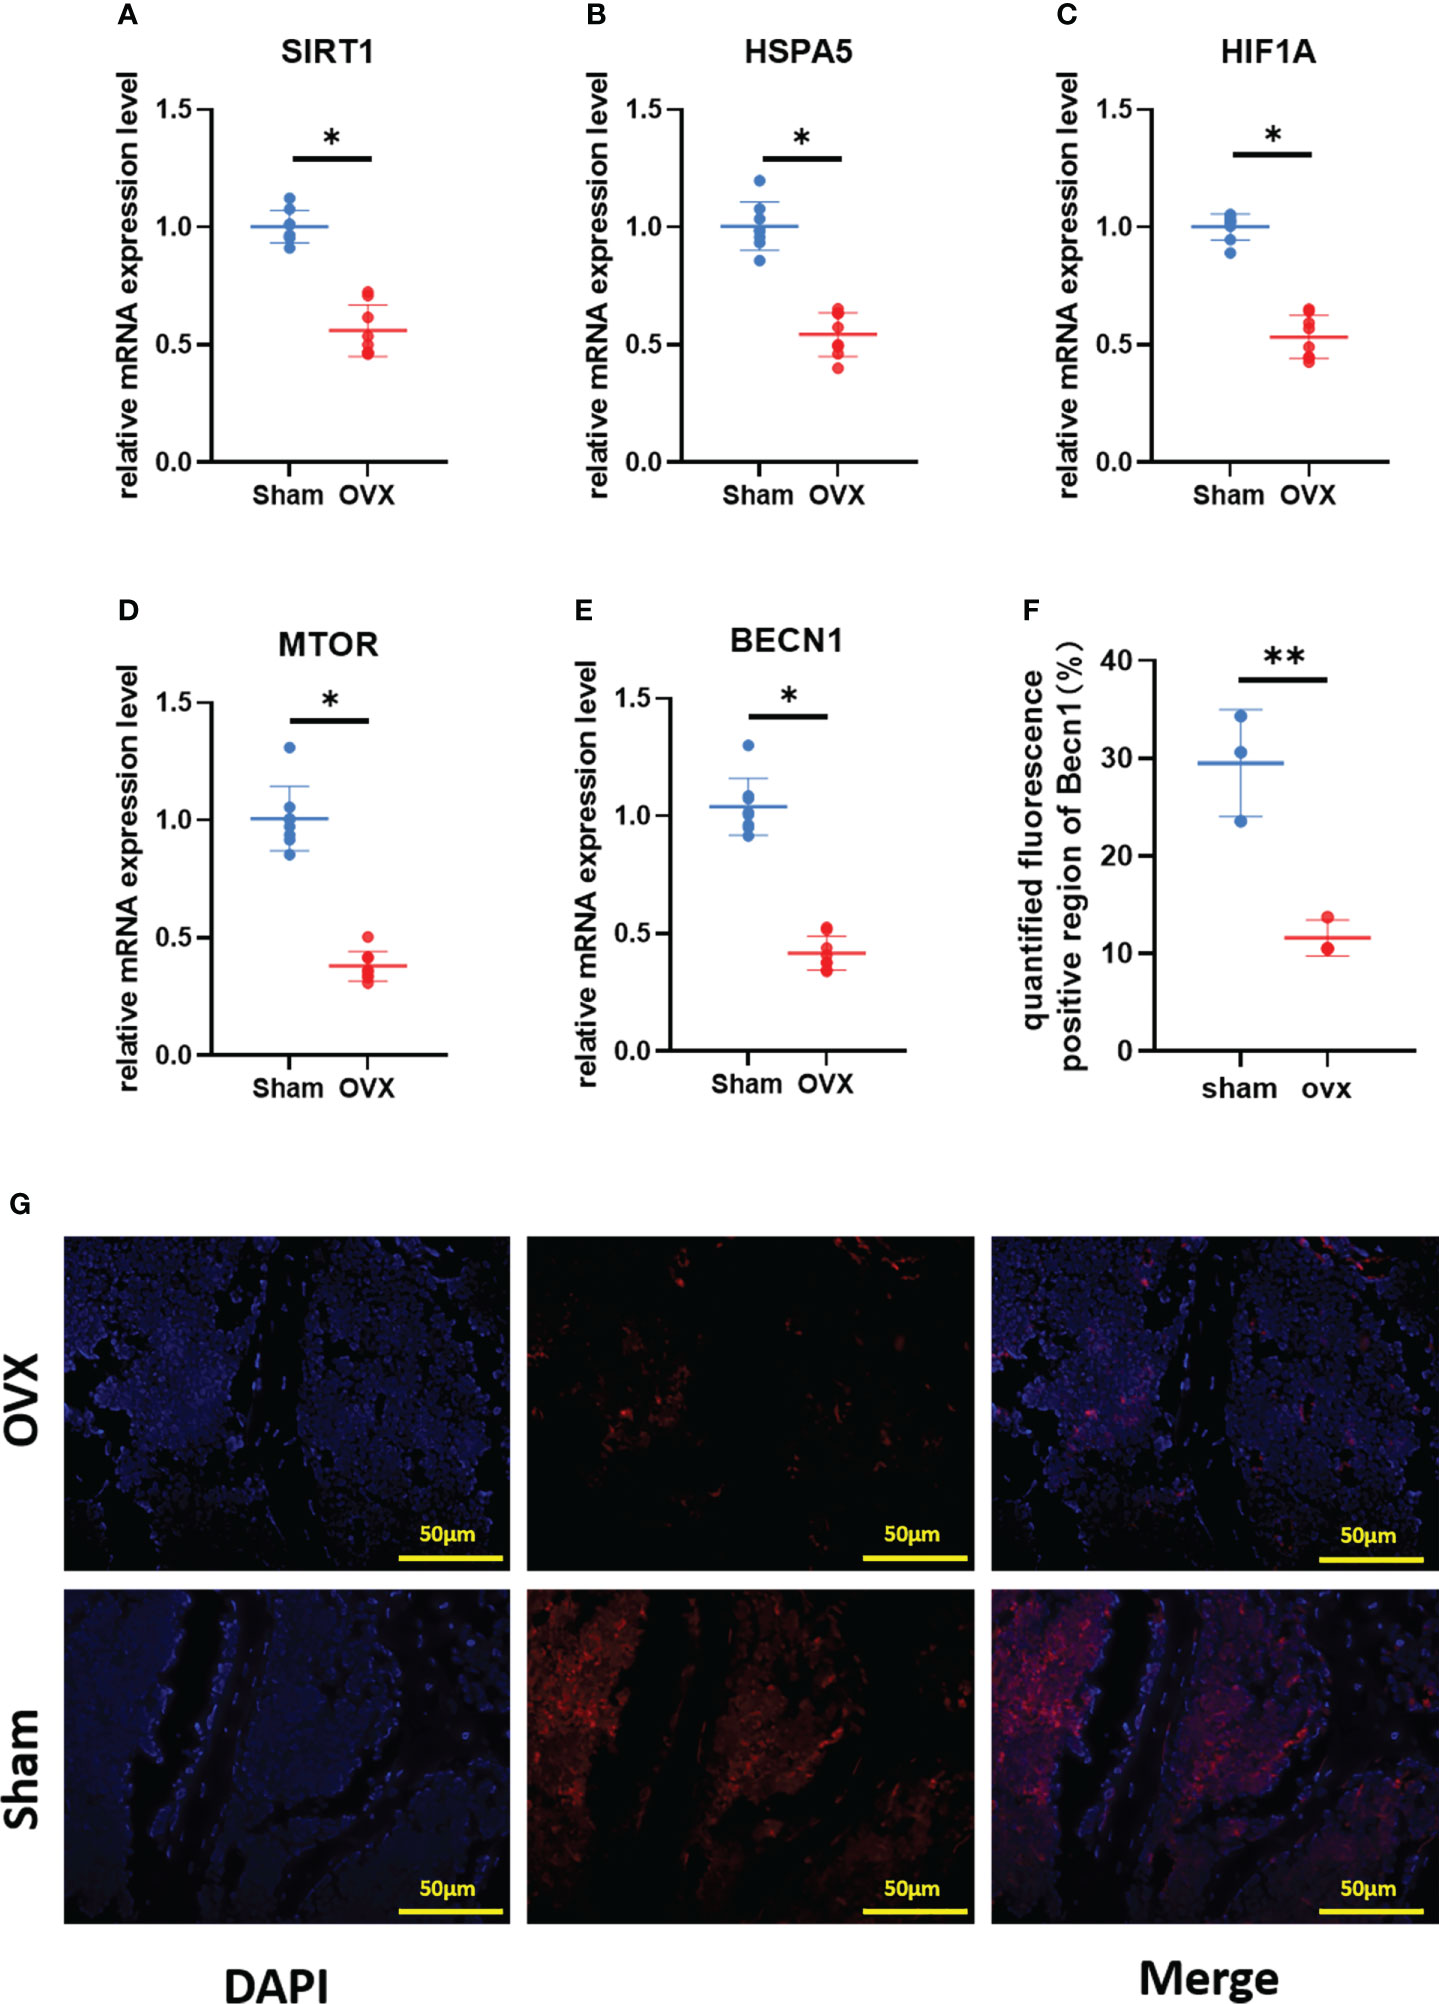
Figure 8 Validation of key Ferr-DEGs in vivo. (A–E) The mRNA expression level of Ferr-DEGs (Sirt1, Hspa5, Mtor, Hif1a and Becn1) in Sham and OVX group. (F) Quantitative analysis of fluorescence intensity. (G) Immunofluorescence staining of BECN1. (The data are expressed as the mean ± sd *P < 0.05, **P < 0.01).
To further demonstrate the involvement of ferroptosis in the development of osteoporosis, lipid peroxidation levels and iron concentrations in serum and BMSCs from OVX mice were measured. The results showed that MDA levels and iron concentrations were significantly increased both in serum and BMSCs from OVX group (Figures 9A–D). Lipid peroxidation and iron overload are the characteristic manifestations of ferroptosis.
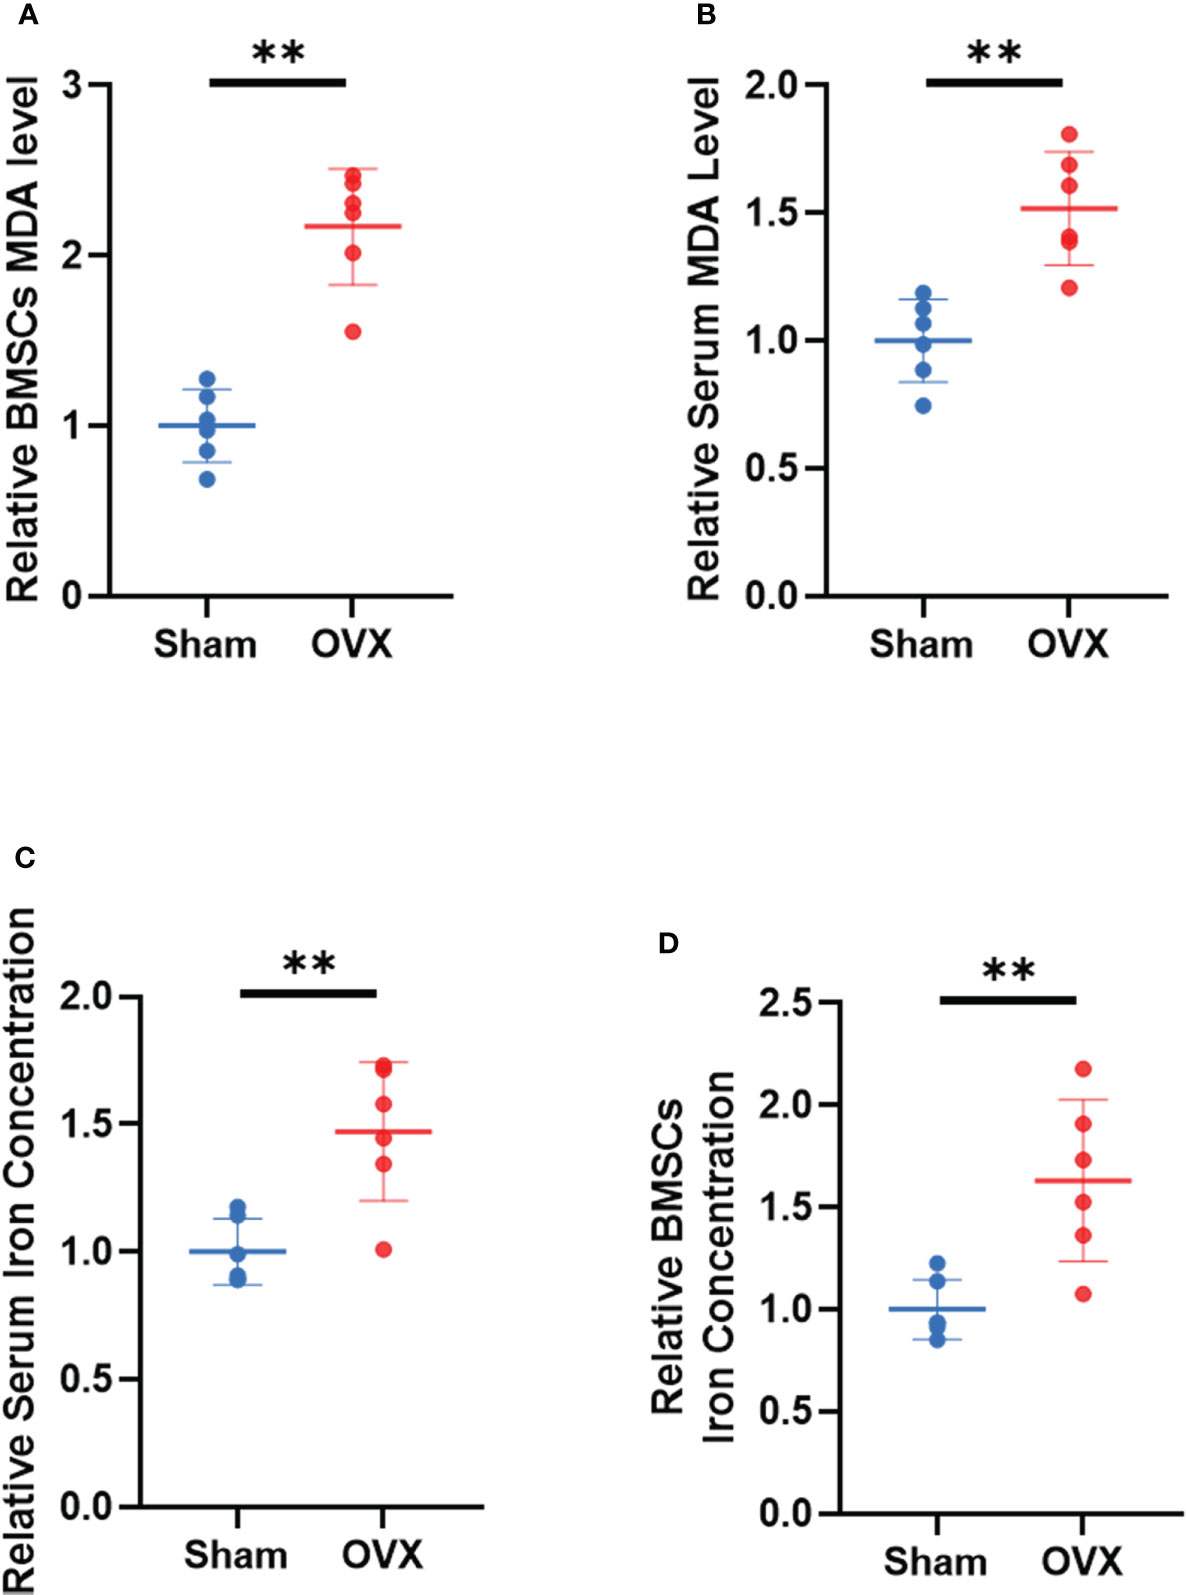
Figure 9 Validation of lipid peroxidation and iron level in vivo. (A, B) Relative expression of MDA in serum and BMSCs. (C, D) relative iron concentrations in serum and BMSCs. (The data are expressed as the mean ± sd **P < 0.01).
In summary, these in vivo results are consistent with the bioinformatics analysis, demonstrating that there is a high correlation between ferroptosis genes and the progression of osteoporosis in a mouse model. However, the exact mechanism needs to be further elucidated.
Discussion
Different types of osteoporosis, such as diabetic osteoporosis, glucocorticoid-induced osteoporosis, and postmenopausal osteoporosis, were confirmed to be associated with ferroptosis (22, 47–50). However, the specific mechanisms and signaling pathways of ferroptosis involved in osteoporosis remain a mystery. We first intersected microarrays on primary osteoporosis patients in GEO with FerrDb, especially the detection and analysis of BMSCs, which has not been reported in previous studies. We aimed to identify the key genes of ferroptosis and explore its mechanisms in primary osteoporosis. Therefore, we compared the gene expression of primary osteoporosis patients with controls. To be more statistically persuasive, several bioinformatics algorithms (PCA, RLE, Limma, BC, MCC, etc.) were adopted to integrate the results. Additionally, PPI network construction, GO and KEGG were performed to explore the potential functional roles of the Ferr-DEGs. Finally, 80 Ferr-DEGs and 5 key Ferr-DEGs were calculated for further study.
As a newly discovered form of RCD, ferroptosis is accompanied by iron overload, lipid peroxidation and oxidative stress and is regulated by manifold genes. There appears to be a synergistic or antagonistic effect between ferroptosis and other RCDs because they have cross regulators in some pathways (51–53). Interestingly, according to our findings in this research, autophagy was regarded as the most crucial biological process after ferroptosis. Autophagy is an intracellular degradation system that maintains the stability of the intracellular environment (54, 55). Including three subtypes: microautophagy, macroautophagy and chaperone-mediated autophagy (CMA) (56–58). Several stress-related proteins were reported to be important regulators of autophagy-dependent ferroptosis in cancer therapy (59). New evidence suggests that abnormal levels of autophagy and mitochondrial autophagy disrupt the balance of bone metabolism. Osteoporotic BMSCs exhibit impaired osteogenic and increased adipogenic differentiation due to decreased autophagy (60, 61). Our results indicate that ferroptosis is involved in the process of osteoporosis and that autophagy is also involved. This conclusion was further supported by the MCODE results, which suggested that the Ferr-DEGs in different modules were connected with nongenomic actions of 1,25-dihydroxyvitamin D3, autophagy, and response to starvation and stress. We verified the potential connection between ferroptosis and autophagy in osteoporosis via various bioinformatics methods. The interaction between ferroptosis and autophagy deserves further study.
As a group of cells with the potential for multidirectional differentiation, BMSCs can differentiate into osteoblasts, chondrocytes and adipocytes. There is an opposite relationship between the differentiation of BMSCs into osteoblasts and adipocytes (62, 63). When osteoporosis occurs, BMSCs tend to differentiate into adipocytes rather than osteoblasts (64, 65). To test and verify our hypothesis, based on the HPA database, we compared the protein and gene expression levels of 10 hub genes between human bone marrow and adipose tissue. We considered the trends of protein and gene expression in tissues and intersected most of those algorithms as the 5 most likely key Ferr-DEGs, including SIRT1, HSPA5, MTOR, HIF1A and BECN1. Ultimately, these 5 key Ferr-DEGs were considered to be a preliminary reference for determining whether they are differentially expressed when osteoporosis occurs.
SIRT1 is an important regulator of bone homeostasis. The results of HPA showed that the expression level of SIRT1 in adipose tissue is NA, which is not entirely consistent with what is known thus far as SIRT1 is a potential regulator in adipose tissue inflammation and metabolism. The conflicting results may be due to delays in updating the site. However, the relative expression levels of SIRT1 in adipose tissue and bone marrow tissue were consistent, which did not affect the conclusion of this study. Sirt1 KO mice presented with osteoporosis characterized by decreased osteogenesis and increased adipogenesis in BMSCs (66). In contrast, BMSCs overexpressing Sirt1 repressed the increased expression of superoxide dismutase 2 (Sod2) and forkhead box O3A (Foxo3a), which promoted the differentiation of BMSCs into osteoblasts and delayed senescence (67). A study in head and neck cancer cells showed that silencing SIRT1 expression can inhibit epithelial-mesenchymal transition and decrease ferroptosis, while SIRT1 agonists can promote ferroptosis (68). SIRT1 was also reported to be associated with mitophagy (69). HSPA5 is a chaperone protein mainly expressed in the Endoplasmic reticulum (ER) that maintains the stability of glutathione peroxidase 4 (GPX4) by forming the HSPA5-GPX4 complex, thereby causing resistance to ferroptosis (70, 71). There seems to be no current research on the potential role of HSPA5 in osteoporosis, which would be an interesting direction. HIF1A degradation, circadian rhythm and lipid peroxidation play a role in the regulation of ferroptosis, and HIF1A is a key factor (72). Feng et al. reported that ferroptosis might enhance diabetic nephropathy and damage renal tubules in diabetic mouse models (73). In orthopedic-related fields, it has been reported that Hif1a-dependent Bcl2 interacting protein 3 (Bnip3) expression is increased and participates in hypoxia-induced autophagy activation, ultimately leading to osteoclastogenesis (74). The Hif1a-specific inhibitor 2ME2 can prevent osteoporosis in OVX mice, and the induction of ferroptosis by targeting Hif1a in osteoclasts may be a novel approach for the treatment of osteoporosis (50). Most studies on BECN1 in ferroptosis are based on autophagy. AMPK-mediated BECN1 phosphorylation can promote ferroptosis (75). The process of ferroptosis after erastin treatment was blocked by knockdown of BECN1, suggesting that ferroptosis may be a type of autophagy-dependent RCD (76). The osteogenic capability of an osteoblastic cell line was significantly reduced after knockdown of autophagy related 7 (Atg7) and Becn1 (77). Our previous study also found that tet methylcytosine dioxygenase 2(Tet2) promoted bone loss in OVX mice. It positively regulates BECN1-dependent autophagy by inhibiting BCL2 expression and promoting osteoclast differentiation (78). However, whether BECN1 is involved in ferroptosis during BMSCs differentiation is still unclear and will be further researched. Acts as a central regulator of the cellular response to growth stimulation, MTOR can inhibit autophagy-dependent ferroptosis. In cancer cells, interactions between MTOR and GPX4 can regulate autophagy-dependent ferroptosis by inhibiting CMA (79), and MTOR inhibitors may promote GPX4 degradation by activating the CMA pathway. MTOR also has a protective effect on ferroptosis in BMSCs, and autophagy mediated by the MTOR pathway can regulate the regeneration function of BMSCs, thereby influencing the occurrence and development of osteoporosis in postmenopausal women (61). Collectively, there are few studies about the specific functions and related mechanisms of these 5 key Ferr-DEGs in ferroptosis during osteoporosis progression. Our results provide a very meaningful direction for future research.
To further verify our conclusions, an osteoporotic model was successfully established in OVX mice. We found that the expression of Sirt1, Hspa5, Mtor, Hif1a and Becn1 in BMSCs from the OVX group was lower than that in BMSCs from the control group, which is consistent with our bioinformatic analysis results. The results of immunofluorescence staining were also consistent with our expectations. Detection of lipid peroxidation and iron levels at serum and cellular levels also confirmed that ferroptosis may be involved in the development of primary osteoporosis. These outcomes suggest that ferroptosis of BMSCs may be involved in the pathological process of primary osteoporosis. Finally, we believe that our results will offer new insight into the role of ferroptosis in primary osteoporosis and identify the 5 key Ferr-DEGs as potential biomarkers for primary osteoporosis diagnosis and treatment.
Conclusion
In summary, through a variety of bioinformatics methods, our research successfully identified 5 key Ferr-DEGs associated with primary osteoporosis and ferroptosis, namely, SIRT1, HSPA5, MTOR, HIF1A and BECN1. In addition, autophagy may also be involved in ferroptosis-related primary osteoporosis. In the future, we intend to collect enough bone tissues from patients with primary osteoporosis for further research. We aimed to clarify the regulatory roles of these genes to explore the differentiation mechanisms of BMSCs.
Data availability statement
The datasets presented in this study can be found in online repositories. The names of the repository/repositories and accession number(s) can be found in the article/Supplementary Material.
Ethics statement
The animal study was reviewed and approved by Animal Ethics Committee of the First Affiliated Hospital of Soochow University.
Author contributions
YX and HZ: conception and design. HW and PZ: Acquisition and analysis of data. Investigation and software operation: QW. Validation: YX and YG. Writing and revising: YX and DG. Funding: DG and HY. All authors contributed to the article and approved the submitted version.
Funding
This study was supported by grants from the National Natural Science Foundation of China (Nos. 82072425, 82072498, 81873991, 81873990, 81672238 and 81472077), the Young Medical Talents of Jiangsu Province (No. QNRC2016751), the Natural Science Foundation of Jiangsu Province (Nos. BK20180001 and BE2021650), and the Priority Academic Program Development of Jiangsu Higher Education Institutions (PAPD) and Special Project of Diagnosis and Treatment Technology for Key Clinical Diseases in Suzhou (LCZX202003).
Conflict of interest
The authors declare that the research was conducted in the absence of any commercial or financial relationships that could be construed as a potential conflict of interest.
Publisher’s note
All claims expressed in this article are solely those of the authors and do not necessarily represent those of their affiliated organizations, or those of the publisher, the editors and the reviewers. Any product that may be evaluated in this article, or claim that may be made by its manufacturer, is not guaranteed or endorsed by the publisher.
Supplementary material
The Supplementary Material for this article can be found online at: https://www.frontiersin.org/articles/10.3389/fendo.2022.980867/full#supplementary-material
Supplementary Figure 1 | Principal component analysis (PCA) and Relative log expression (RLE) plots of gene chips (A) PCA plot of GSE35958. Red and blue spots represent samples from op group and ctrl group respectively. (B) RLE plots of GSE35958.
Supplementary Figure 2 | expression heat map of DEGs in GSE35958 dataset.
Supplementary Figure 3 | GO and KEGG enrichment analysis. (A–C) A histogram of GO enrichment analysis of DEGs, included biological process, cellular component and molecular function. (D) Enrichment KEGG pathways.
Supplementary Figure 4 | RNA and protein expression of top 10 hub genes in different human tissues. (A) Relative Rna expression level. (B) Summary of protein expression (H: high; M: medium; L: low; N: not detected)
Abbreviations
BC, Betweenness Centrality; BP, Biological Process; BMSCs, Bone Mesenchymal Stromal Cells; BMD, Bone Mineral Density; BV, Bone Volume; BV/TV, Bone Volume Per Tissue Volume; CC, Cellular Component; CMA, Chaperone-Mediated Autophagy; DEGs, Differentially Expressed Genes; ER, Endoplasmic Reticulum; Ferr-DEGs, Ferroptosis DEGs; GEO, Gene Expression Omnibus; GO, Gene Ontology; HPA, Human Protein Atlas Database; IF, Immunofluorescence; KEGG, Kyoto Encyclopedia of Genes and Genomes; MCC, Maximal Clique Centrality; MCODE, Molecular Complex Detection; MF, Molecular Function; OVX, Ovariectomy; PCA, Principal Component Analysis; PPI, Protein–Protein Interactions; ROS, Reactive Oxygen Species; ROI, Region of Interest; RCD, Regulated Cell Death; RLE, Relative Log Expression; Tb. N, Trabecular Number; Tb.Sp, Trabecular Separation.
References
1. Compston JE, McClung MR, Leslie WD. Osteoporosis. Lancet (2019) 393(10169):364–76. doi: 10.1016/s0140-6736(18)32112-3
2. Lomholt LB, Dahl AJ. Treatment of osteoporosis: Unmet needs and emerging solutions. J Bone Metab (2018) 25(3):133. doi: 10.11005/jbm.2018.25.3.133
3. NIH Consensus Development Panel on Osteoporosis Prevention, Diagnosis, Therapy. Osteoporosis prevention, diagnosis and therapy. JAMA (2001) 285(6):785–95. doi: 10.1001/jama.285.6.785
4. Khosla S, Shane E. A crisis in the treatment of osteoporosis. J Bone Mineral Res (2016) 31(8):1485–7. doi: 10.1002/jbmr.2888
5. Rachner TD, Khosla S, Hofbauer LC. New horizons in osteoporosis. Lancet (2011) 377(9773):1276. doi: 10.1016/S0140-6736(10)62349-5
6. Hernlund E, Svedbom A, Ivergård M, Compston J, Cooper C, Stenmark J, et al. Osteoporosis in the European union: Medical management, epidemiology and economic burden. a report prepared in collaboration with the international osteoporosis foundation (Iof) and the European federation of pharmaceutical industry associations (Efpia). Arch Osteoporosis (2013) 8(1):136. doi: 10.1007/s11657-013-0136-1
7. Bass MA, Sharma A, Nahar VK, Chelf S, Zeller B, Pham L, et al. Bone mineral density among men and women aged 35 to 50 years. J Am Osteopathic Assoc (2019) 119(6):357–63. doi: 10.7556/jaoa.2019.064
8. Mirzayans R, Murray D. Do tunel and other apoptosis assays detect cell death in preclinical studies? Int J Mol Sci (2020) 21(23):9090. doi: 10.3390/ijms21239090
9. Wu J, Ye J, Kong W, Zhang S, Zheng Y. Programmed cell death pathways in hearing loss: A review of apoptosis, autophagy and programmed necrosis. Cell Prolif (2020) 53(11):e12915. doi: 10.1111/cpr.12915
10. Galluzzi L, Baehrecke EH, Ballabio A, Boya P, Bravo-San Pedro JM, Cecconi F, et al. Molecular definitions of autophagy and related processes. EMBO J (2017) 36(13):1811–36. doi: 10.15252/embj.201796697
11. Liu P, Zhang Z, Li Y. Relevance of the pyroptosis-related inflammasome pathway in the pathogenesis of diabetic kidney disease. Front Immunol (2021) 12:603416. doi: 10.3389/fimmu.2021.603416
12. Xie Y, Hou W, Song X, Yu Y, Huang J, Sun X, et al. Ferroptosis: Process and function. Cell Death Differ (2016) 23(3):369–79. doi: 10.1038/cdd.2015.158
13. Dixon SJ, Lemberg KM, Lamprecht MR, Skouta R, Zaitsev EM, Gleason CE, et al. Ferroptosis: An iron-dependent form of nonapoptotic cell death. Cell (2012) 149(5):1060–72. doi: 10.1016/j.cell.2012.03.042
14. Liu P, Wang W, Li Z, Li Y, Yu X, Tu J, et al. Ferroptosis: A new regulatory mechanism in osteoporosis. Oxid Med Cell Longevity (2022) 2022:2634431. doi: 10.1155/2022/2634431
15. Yang WS, SriRamaratnam R, Welsch ME, Shimada K, Skouta R, Viswanathan VS, et al. Regulation of ferroptotic cancer cell death by Gpx4. Cell (2014) 156(1-2):317–31. doi: 10.1016/j.cell.2013.12.010
16. Yu Y, Xie Y, Cao L, Yang L, Yang M, Lotze MT, et al. The ferroptosis inducer erastin enhances sensitivity of acute myeloid leukemia cells to chemotherapeutic agents. Mol Cell Oncol (2015) 2(4):e1054549. doi: 10.1080/23723556.2015.1054549
17. Sun X, Ou Z, Chen R, Niu X, Chen D, Kang R, et al. Activation of the P62-Keap1-Nrf2 pathway protects against ferroptosis in hepatocellular carcinoma cells. Hepatol (Baltimore Md) (2016) 63(1):173–84. doi: 10.1002/hep.28251
18. Bao WD, Zhou XT, Zhou LT, Wang F, Yin X, Lu Y, et al. Targeting mir-124/Ferroportin signaling ameliorated neuronal cell death through inhibiting apoptosis and ferroptosis in aged intracerebral hemorrhage murine model. Aging Cell (2020) 19(11):e13235. doi: 10.1111/acel.13235
19. Wen S, Aki T, Unuma K, Uemura K. Chemically induced models of parkinson's disease: History and perspectives for the involvement of ferroptosis. Front Cell Neurosci (2020) 14:581191. doi: 10.3389/fncel.2020.581191
20. Le Y, Zhang Z, Wang C, Lu D. Ferroptotic cell death: New regulatory mechanisms for metabolic diseases. Endocr Metab Immune Disord Drug Targets (2021) 21(5):785–800. doi: 10.2174/1871530320666200731175328
21. Zhang J. The osteoprotective effects of artemisinin compounds and the possible mechanisms associated with intracellular iron: A review of in vivo and in vitro studies. Environ Toxicol Pharmacol (2020) 76:103358. doi: 10.1016/j.etap.2020.103358
22. Yang RZ, Xu WN, Zheng HL, Zheng XF, Li B, Jiang LS, et al. Exosomes derived from vascular endothelial cells antagonize glucocorticoid-induced osteoporosis by inhibiting ferritinophagy with resultant limited ferroptosis of osteoblasts. J Cell Physiol (2021) 236(9):6691–705. doi: 10.1002/jcp.30331
23. Ma H, Wang X, Zhang W, Li H, Zhao W, Sun J, et al. Melatonin suppresses ferroptosis induced by high glucose Via activation of the Nrf2/Ho-1 signaling pathway in type 2 diabetic osteoporosis. Oxid Med Cell Longevity (2020) 2020:9067610. doi: 10.1155/2020/9067610
24. Chamberlain G, Fox J, Ashton B, Middleton J. Concise review: Mesenchymal stem cells: Their phenotype, differentiation capacity, immunological features, and potential for homing. Stem Cells (Dayton Ohio) (2007) 25(11):2739–49. doi: 10.1634/stemcells.2007-0197
25. Dalle Carbonare L, Valenti MT, Zanatta M, Donatelli L, Lo Cascio V. Circulating mesenchymal stem cells with abnormal osteogenic differentiation in patients with osteoporosis. Arthritis Rheum (2009) 60(11):3356–65. doi: 10.1002/art.24884
26. Wang QL, Li HF, Wang DP, Liu ZY, Xiao WW, Xu LL, et al. Effect of ggcx on the differentiation function of osteoporosis bone marrow mesenchymal stem cells through regulating Tgfβ/Smad signaling pathway. Eur Rev Med Pharmacol Sci (2019) 23(17):7224–31. doi: 10.26355/eurrev_201909_18825
27. Song X, Xie Y, Kang R, Hou W, Sun X, Epperly MW, et al. Fancd2 protects against bone marrow injury from ferroptosis. Biochem Biophys Res Commun (2016) 480(3):443–9. doi: 10.1016/j.bbrc.2016.10.068
28. Luo C, Xu W, Tang X, Liu X, Cheng Y, Wu Y, et al. Canonical wnt signaling works downstream of iron overload to prevent ferroptosis from damaging osteoblast differentiation. Free Radical Biol Med (2022) 188:337–50. doi: 10.1016/j.freeradbiomed.2022.06.236
29. Patra BG, Maroufy V, Soltanalizadeh B, Deng N, Zheng WJ, Roberts K, et al. A content-based literature recommendation system for datasets to improve data reusability - a case study on gene expression omnibus (Geo) datasets. J Biomed Inf (2020) 104:103399. doi: 10.1016/j.jbi.2020.103399
30. Benisch P, Schilling T, Klein-Hitpass L, Frey SP, Seefried L, Raaijmakers N, et al. The transcriptional profile of mesenchymal stem cell populations in primary osteoporosis is distinct and shows overexpression of osteogenic inhibitors. PloS One (2012) 7(9):e45142. doi: 10.1371/journal.pone.0045142
31. Ma S, Dai Y. Principal component analysis based methods in bioinformatics studies. Briefings Bioinf (2011) 12(6):714–22. doi: 10.1093/bib/bbq090
32. Brettschneider J, Collin F, Bolstad BM, Speed TP. Quality assessment for short oligonucleotide microarray data. Technometrics (2008) 50(3):241–64. doi: 10.1198/004017008000000334
33. Ritchie ME, Phipson B, Wu D, Hu Y, Law CW, Shi W, et al. Limma powers differential expression analyses for rna-sequencing and microarray studies. Nucleic Acids Res (2015) 43(7):e47. doi: 10.1093/nar/gkv007
34. Zhou N, Bao J. Ferrdb: A manually curated resource for regulators and markers of ferroptosis and ferroptosis-disease associations. Database (2020) 2020:baaa021. doi: 10.1093/database/baaa021
35. Zhou Y, Zhou B, Pache L, Chang M, Khodabakhshi AH, Tanaseichuk O, et al. Metascape provides a biologist-oriented resource for the analysis of systems-level datasets. Nat Commun (2019) 10(1):1523. doi: 10.1038/s41467-019-09234-6
36. Pomaznoy M, Ha B, Peters B. Gonet: A tool for interactive gene ontology analysis. BMC Bioinf (2018) 19(1):470. doi: 10.1186/s12859-018-2533-3
37. Kanehisa M, Sato Y, Kawashima M, Furumichi M, Tanabe M. Kegg as a reference resource for gene and protein annotation. Nucleic Acids Res (2016) 44(D1):D457–62. doi: 10.1093/nar/gkv1070
38. Kanehisa M, Furumichi M, Tanabe M, Sato Y, Morishima K. Kegg: New perspectives on genomes, pathways, diseases and drugs. Nucleic Acids Res (2017) 45(D1):D353–d61. doi: 10.1093/nar/gkw1092
39. Shannon P, Markiel A, Ozier O, Baliga NS, Wang JT, Ramage D, et al. Cytoscape: A software environment for integrated models of biomolecular interaction networks. Genome Res (2003) 13(11):2498–504. doi: 10.1101/gr.1239303
40. Saito R, Smoot ME, Ono K, Ruscheinski J, Wang PL, Lotia S, et al. A travel guide to cytoscape plugins. Nat Methods (2012) 9(11):1069–76. doi: 10.1038/nmeth.2212
41. Szklarczyk D, Gable AL, Lyon D, Junge A, Wyder S, Huerta-Cepas J, et al. String V11: Protein-protein association networks with increased coverage, supporting functional discovery in genome-wide experimental datasets. Nucleic Acids Res (2019) 47(D1):D607–13. doi: 10.1093/nar/gky1131
42. Szklarczyk D, Morris JH, Cook H, Kuhn M, Wyder S, Simonovic M, et al. The string database in 2017: Quality-controlled protein-protein association networks, made broadly accessible. Nucleic Acids Res (2017) 45(D1):D362–8. doi: 10.1093/nar/gkw937
43. Chin CH, Chen SH, Wu HH, Ho CW, Ko MT, Lin CY. Cytohubba: Identifying hub objects and Sub-networks from complex interactome. BMC Syst Biol (2014) 8 Suppl 4(Suppl 4):S11. doi: 10.1186/1752-0509-8-s4-s11
44. Tang Y, Li M, Wang J, Pan Y, Wu FX. Cytonca: A cytoscape plugin for centrality analysis and evaluation of protein interaction networks. Bio Syst (2015) 127:67–72. doi: 10.1016/j.biosystems.2014.11.005
45. Jee WS, Yao W. Overview: Animal models of osteopenia and osteoporosis. J Musculoskeletal Neuronal Interact (2001) 1(3):193–207.
46. Zhu H, Guo ZK, Jiang XX, Li H, Wang XY, Yao HY, et al. A protocol for isolation and culture of mesenchymal stem cells from mouse compact bone. Nat Protoc (2010) 5(3):550–60. doi: 10.1038/nprot.2009.238
47. Anagnostis P, Paschou SA, Gkekas NN, Artzouchaltzi AM, Christou K, Stogiannou D, et al. Efficacy of anti-osteoporotic medications in patients with type 1 and 2 diabetes mellitus: A systematic review. Endocrine (2018) 60(3):373–83. doi: 10.1007/s12020-018-1548-x
48. Lu J, Yang J, Zheng Y, Chen X, Fang S. Extracellular vesicles from endothelial progenitor cells prevent steroid-induced osteoporosis by suppressing the ferroptotic pathway in mouse osteoblasts based on bioinformatics evidence. Sci Rep (2019) 9(1):16130. doi: 10.1038/s41598-019-52513-x
49. D'Amelio P, Cristofaro MA, Tamone C, Morra E, Di Bella S, Isaia G, et al. Role of iron metabolism and oxidative damage in postmenopausal bone loss. Bone (2008) 43(6):1010–5. doi: 10.1016/j.bone.2008.08.107
50. Ni S, Yuan Y, Qian Z, Zhong Z, Lv T, Kuang Y, et al. Hypoxia inhibits rankl-induced ferritinophagy and protects osteoclasts from ferroptosis. Free Radical Biol Med (2021) 169:271–82. doi: 10.1016/j.freeradbiomed.2021.04.027
51. Duan JY, Lin X, Xu F, Shan SK, Guo B, Li FX, et al. Ferroptosis and its potential role in metabolic diseases: A curse or revitalization? Front Cell Dev Biol (2021) 9:701788. doi: 10.3389/fcell.2021.701788
52. Chen X, Li J, Kang R, Klionsky DJ, Tang D. Ferroptosis: Machinery and regulation. Autophagy (2021) 17(9):2054–81. doi: 10.1080/15548627.2020.1810918
53. Zheng J, Conrad M. The metabolic underpinnings of ferroptosis. Cell Metab (2020) 32(6):920–37. doi: 10.1016/j.cmet.2020.10.011
54. Mizushima N, Levine B, Cuervo AM, Klionsky DJ. Autophagy fights disease through cellular self-digestion. Nature (2008) 451(7182):1069–75. doi: 10.1038/nature06639
55. Klionsky DJ, Emr SD. Autophagy as a regulated pathway of cellular degradation. Sci (New York NY) (2000) 290(5497):1717–21. doi: 10.1126/science.290.5497.1717
56. Glick D, Barth S, Macleod KF. Autophagy: Cellular and molecular mechanisms. J Pathol (2010) 221(1):3–12. doi: 10.1002/path.2697
57. Mizushima N, Komatsu M. Autophagy: Renovation of cells and tissues. Cell (2011) 147(4):728–41. doi: 10.1016/j.cell.2011.10.026
58. Parzych KR, Klionsky DJ. An overview of autophagy: Morphology, mechanism, and regulation. Antioxid Redox Signaling (2014) 20(3):460–73. doi: 10.1089/ars.2013.5371
59. Li C, Zhang Y, Liu J, Kang R, Klionsky DJ, Tang D. Mitochondrial DNA stress triggers autophagy-dependent ferroptotic death. Autophagy (2021) 17(4):948–60. doi: 10.1080/15548627.2020.1739447
60. Wang Z, Liu N, Liu K, Zhou G, Gan J, Wang Z, et al. Autophagy mediated cocrmo particle-induced peri-implant osteolysis by promoting osteoblast apoptosis. Autophagy (2015) 11(12):2358–69. doi: 10.1080/15548627.2015.1106779
61. Qi M, Zhang L, Ma Y, Shuai Y, Li L, Luo K, et al. Autophagy maintains the function of bone marrow mesenchymal stem cells to prevent estrogen deficiency-induced osteoporosis. Theranostics (2017) 7(18):4498–516. doi: 10.7150/thno.17949
62. Beresford JN, Bennett JH, Devlin C, Leboy PS, Owen ME. Evidence for an inverse relationship between the differentiation of adipocytic and osteogenic cells in rat marrow stromal cell cultures. J Cell Sci (1992) 102(Pt 2):341–51. doi: 10.1242/jcs.102.2.341
63. Abdallah BM, Jafari A, Zaher W, Qiu W, Kassem M. Skeletal (Stromal) stem cells: An update on intracellular signaling pathways controlling osteoblast differentiation. Bone (2015) 70:28–36. doi: 10.1016/j.bone.2014.07.028
64. Taipaleenmäki H, Abdallah BM, AlDahmash A, Säämänen AM, Kassem M. Wnt signalling mediates the cross-talk between bone marrow derived pre-adipocytic and pre-osteoblastic cell populations. Exp Cell Res (2011) 317(6):745–56. doi: 10.1016/j.yexcr.2010.12.015
65. Justesen J, Stenderup K, Ebbesen EN, Mosekilde L, Steiniche T, Kassem M. Adipocyte tissue volume in bone marrow is increased with aging and in patients with osteoporosis. Biogerontology (2001) 2(3):165–71. doi: 10.1023/a:1011513223894
66. Cohen-Kfir E, Artsi H, Levin A, Abramowitz E, Bajayo A, Gurt I, et al. Sirt1 is a regulator of bone mass and a repressor of sost encoding for sclerostin, a bone formation inhibitor. Endocrinology (2011) 152(12):4514–24. doi: 10.1210/en.2011-1128
67. Sun W, Qiao W, Zhou B, Hu Z, Yan Q, Wu J, et al. Overexpression of Sirt1 in mesenchymal stem cells protects against bone loss in mice by Foxo3a deacetylation and oxidative stress inhibition. Metab: Clin Exp (2018) 88:61–71. doi: 10.1016/j.metabol.2018.06.006
68. Lee J, You JH, Kim MS, Roh JL. Epigenetic reprogramming of epithelial-mesenchymal transition promotes ferroptosis of head and neck cancer. Redox Biol (2020) 37:101697. doi: 10.1016/j.redox.2020.101697
69. Yoshii SR, Mizushima N. Autophagy machinery in the context of mammalian mitophagy. Biochim Biophys Acta (2015) 1853(10 Pt B):2797–801. doi: 10.1016/j.bbamcr.2015.01.013
70. Zhu S, Zhang Q, Sun X, Zeh HJ 3rd, Lotze MT, Kang R, et al. Hspa5 regulates ferroptotic cell death in cancer cells. Cancer Res (2017) 77(8):2064–77. doi: 10.1158/0008-5472.Can-16-1979
71. Chen C, Wang D, Yu Y, Zhao T, Min N, Wu Y, et al. Legumain promotes tubular ferroptosis by facilitating chaperone-mediated autophagy of Gpx4 in aki. Cell Death Dis (2021) 12(1):65. doi: 10.1038/s41419-020-03362-4
72. Yang M, Chen P, Liu J, Zhu S, Kroemer G, Klionsky DJ, et al. Clockophagy is a novel selective autophagy process favoring ferroptosis. Sci Adv (2019) 5(7):eaaw2238. doi: 10.1126/sciadv.aaw2238
73. Feng X, Wang S, Sun Z, Dong H, Yu H, Huang M, et al. Ferroptosis enhanced diabetic renal tubular injury Via hif-1α/Ho-1 pathway in Db/Db mice. Front Endocrinol (2021) 12:626390. doi: 10.3389/fendo.2021.626390
74. Zhao Y, Chen G, Zhang W, Xu N, Zhu JY, Jia J, et al. Autophagy regulates hypoxia-induced osteoclastogenesis through the hif-1α/Bnip3 signaling pathway. J Cell Physiol (2012) 227(2):639–48. doi: 10.1002/jcp.22768
75. Song X, Zhu S, Chen P, Hou W, Wen Q, Liu J, et al. Ampk-mediated Becn1 phosphorylation promotes ferroptosis by directly blocking system X(C)(-) activity. Curr Biol CB (2018) 28(15):2388–99.e5. doi: 10.1016/j.cub.2018.05.094
76. Park E, Chung SW. Ros-mediated autophagy increases intracellular iron levels and ferroptosis by ferritin and transferrin receptor regulation. Cell Death Dis (2019) 10(11):822. doi: 10.1038/s41419-019-2064-5
77. Nollet M, Santucci-Darmanin S, Breuil V, Al-Sahlanee R, Cros C, Topi M, et al. Autophagy in osteoblasts is involved in mineralization and bone homeostasis. Autophagy (2014) 10(11):1965–77. doi: 10.4161/auto.36182
78. Yang C, Tao H, Zhang H, Xia Y, Bai J, Ge G, et al. Tet2 regulates osteoclastogenesis by modulating autophagy in ovx-induced bone loss. Autophagy (2022), 1–13. doi: 10.1080/15548627.2022.2048432
Keywords: primary osteoporosis, ferroptosis, bioinformatics, bone mesenchymal stromal cells (BMSCs), autophagy
Citation: Xia Y, Zhang H, Wang H, Wang Q, Zhu P, Gu Y, Yang H and Geng D (2022) Identification and validation of ferroptosis key genes in bone mesenchymal stromal cells of primary osteoporosis based on bioinformatics analysis. Front. Endocrinol. 13:980867. doi: 10.3389/fendo.2022.980867
Received: 29 June 2022; Accepted: 12 August 2022;
Published: 25 August 2022.
Edited by:
Michela Rossi, Bambino Gesù Children’s Hospital, (IRCCS), ItalyReviewed by:
Yufei Zhou, Fudan University, ChinaElizabeth Rendina-Ruedy, Vanderbilt University Medical Center, United States
Guotian Luo, Université de Paris, France
Copyright © 2022 Xia, Zhang, Wang, Wang, Zhu, Gu, Yang and Geng. This is an open-access article distributed under the terms of the Creative Commons Attribution License (CC BY). The use, distribution or reproduction in other forums is permitted, provided the original author(s) and the copyright owner(s) are credited and that the original publication in this journal is cited, in accordance with accepted academic practice. No use, distribution or reproduction is permitted which does not comply with these terms.
*Correspondence: Huilin Yang, suzhouspine@163.com; Dechun Geng, szgengdc@suda.edu.cn
†These authors have contributed equally to this work and share first authorship