Installed Hydropower Capacity and Carbon Emission Reduction Efficiency Based on the EBM Method in China
 Dong Liang1,2
  Fangrong Ren
- 1Business School, Hohai University, Nanjing, China
- 2School of Economics and Trade, Changzhou Vocational Institute of Textile and Garment, Changzhou, China
- 3Business School, Xi'an Innovation College of Yan'an University, Xi'an, China
This study employs 29 provincial-level administrative regions in China from 2013 to 2017 to evaluate the overall efficiency score of hydropower electricity generation in the three main regions of China. The EBM (Epsilon-based Measure) model with the DEA (Data Envelopment Analysis) method uses installed capacity data, labor force data, and equipment utilization hours as input indicators and electricity generation and CO2 emission reduction as output indicators. By comparing the efficiency values of the two indices of installed capacity and CO2 emission reduction, we are able to analyze the differences between installed hydropower electricity generation capacity efficiency and carbon emission reduction efficiency in various provinces and cities. The findings show that the western region is the best, followed by the central region and then the eastern region in terms of the input-output index level, total efficiency score of hydropower, and comparison of installed capacity-carbon emission reduction efficiency. Natural water resources and geographical advantages have a great positive effect on hydropower efficiency, while economic development has little effect on it. China should promote the sustainable development of hydropower according to local conditions and formulate and adopt countermeasures in line with the different circumstances between regions.
Introduction
As the global economy grows and the international community attaches increasing importance to sustainable development, a common consensus has formed over issues such as energy security, ecological environment, and climate change that are accelerating the development of renewable energy utilization and improving energy efficiency. Hydropower is the conversion of water energy into electricity. As a form of clean energy, it is inexhaustible, renewable, pollution-free, convenient to carry out peak regulation of electricity, conducive to improving the utilization rate of resources, and has comprehensive economic and social benefits and low operating costs. Hydropower is presently the most mature technology and offers the most stable supply of renewable clean energy.
China is rich in hydropower resources, ranking first in the world both in terms of the amount of proven hydropower resources and those that can be developed. In 2018, China's hydropower electricity generation reached 6.8 trillion kilowatt-hours, up 6.8% year-on-year and accounting for 25.49% of the global total. China's hydropower has a total installed capacity of about 350 million kilowatts, making its installed capacity, and electricity generation the highest in the world. Affected by climate, topography, and other factors, China's water resources have the prominent characteristics of steep rivers and huge drops, which are very beneficial to the development of hydropower.
In China, hydropower is the second largest power resource after coal. As a form of clean energy, its development can save coal resources, reduce the emissions of greenhouse gases and various pollutants, and play an important role in the rise of low-carbon and sustainable development. The China government has targeted hydropower resources as an active extension of its energy strategy and energy security. Therefore, quantitative research on hydropower energy efficiency can help optimize its domestic energy structure, reduce greenhouse gas emissions, prevent and mitigate floods, and disasters, achieve energy conservation and emission reduction targets, and promote sustainable development.
Compared with developed countries, China's degree of hydropower development leaves still a lot of room for improvement in the future. Specifically, the degree of hydropower development in Switzerland, France, and Italy exceeds 80%, and the degree of hydropower development in Germany, Japan, and the United States is over 67%, whereas for China it is only 37% (by generating capacity),1 which is only slightly higher than the global average level. This study thus takes installed capacity data, labor force data, and equipment utilization hours of 29 provincial-level administrative regions in China from 2013 to 2017 as input indicators and electricity generation and CO2 emission reduction as output indicators. Via the EBM (Epsilon-based Measure) model, we divide these 29 provincial-level administrative areas of China into 3 regions and compute their overall efficiency score and 5 years of hydropower investment capacity and output of carbon emission reduction. We then compare two index efficiency values in order to offer a more precise and effective policy for hydropower development in China and to put forward useful suggestions.
Many scholars have made fruitful achievements in the research field of energy efficiency related to hydropower, with five major directions. First, many scholars have focused on the area of renewable energy development, trying to find how it is affected by other factors within a specific area, such as Ohler and Fetters (2014), Xu et al. (2019), and Wang et al. (2020). Second, studies have looked at what drives or influences the efficiency of carbon emissions in an area, such as Kim et al. (2015), Cheng et al. (2018), Harlan (2018), Xian et al. (2018), Wang et al. (2019), and Zhao et al. (2020). The third strand looks into the comprehensive utilization of renewable energy from the perspective of the constraints of climate and other objective environments on hydropower, such as Ehrbar et al. (2018), Koch et al. (2018), Li et al. (2018), Mosquera-Lopez et al. (2018), Ranzani et al. (2018), and Zapata et al. (2018). The fourth channel covers a comparative study and method innovation of renewable energy efficiency—for example, Scheel (2001), Fare et al. (2007), Sozen et al. (2010), Sueyoshi and Goto (2011), Zanella et al. (2015), and Calabria et al. (2018). The fifth area is the comprehensive analysis and research on carbon emission reduction potential, low-carbon technology, and electricity energy production—for example, Ang et al. (2011), Zhou et al. (2012), Zhou et al. (2014), Viebahn et al. (2015), Herrera-Estrada et al. (2018), Fernandes et al. (2019), Firth et al. (2019), Severnini (2019), and Kumar et al. (2019).
Most of the above research results focus on the positive impact of hydropower as a form of clean energy on the economy, society, and the environment, such as conducting a comprehensive analysis from the perspective of power policy and renewable energy structure. At present, research on energy efficiency and its quantification level only takes hydropower stations or power plants as the sample. Moreover, CO2 emission reduction efficiency is not included in the evaluation of clean energy in the above literature, but rather traditional radial data envelopment analysis (DEA) is the main method used therein.
The main innovation of this paper has the following three aspects. Firstly, taking specific provinces of China as units and according to their economic and geographical factors, we divide the country into the east, central, and west regions and include CO2 emissions as an important output. This helps to measure the contribution of hydropower as an important clean energy source to CO2 emissions reduction. Secondly, the EBM model is able to overcome the double defects in which the traditional radial DEA model ignores non-radial relaxation and non-radial DEA ignores the proportional relationship with radial DEA. Thirdly, the analysis of the factors affecting the efficiency of hydropower in China adopts the comparison of economic conditions and geographical location. It can help regions and provinces to rely on objective conditions based on their active development of hydropower, to efficiently improve the equipment utilization rate of their resources.
Literature Review
Hydropower electricity generation is one of the most mature and cleanest forms of renewable energy power with large-scale development conditions and commercial prospects for related industries. Ever since the world's first hydropower station was built in France in 1878, hydropower has gradually become the second largest power source after thermal power generation. With the wave of sustainable, green, and low-carbon development in recent years, countries are now shifting their focus to hydropower. As such, many scholars have also shown strong interest in the efficiency of the power industry, focusing on five aspects below.
(1) Many scholars have targeted the area of renewable energy development, trying to find how it is affected by other factors within a specific area, such as Wang et al. (2020), who carried out a comprehensive evaluation on regional renewable energy development in China, concluding that better economic conditions help renewable energy development in a region to exhibit good performance, such as Beijing, Shanghai, and Guangdong. Xu et al. (2019) divided the world into seven regions and proposed a comprehensive prediction model to analyze the situation of renewable energy from the political, technical, economic, and social perspectives. Ohler and Fetters (2014) examined the causal relationship between economic growth and renewable energy generation in 20 OECD (Organization for Economic Cooperation and Development) countries between 1990 and 2008, finding that increases of endogenous substances and wastes in the short term have a negative impact on GDP, while renewable energy and hydropower electricity generation are beneficial to GDP growth.
(2) Some scholars have narrowed their research to analyze what drives or influences the efficiency of carbon emissions in an area. For example, Wang et al. (2019) used the panel Tobit model to analyze the negative correlation between the abundance of natural resources and emission efficiency. Economic scale indirectly affects carbon emission efficiency via emission reduction potential. These findings suggest that resource-based regions should make improving emission efficiency and exploring emission reduction potential the top priorities of any low-carbon transformation actions and promote industrial restructuring to reap double dividends in sustainable development and carbon efficiency.
Resource endowment, economic scale, and other external factors such as policies and technologies all impact a region's carbon emission reduction. Zhao et al. (2020) found that the decline in carbon intensity of electricity (CIE) generation is concentrated in three provinces: those with a large economic scale, strong policy support, and strong clean energy implementation. Xian et al. (2018) presented that regional technology heterogeneity exists in the process of electricity generation and related CO2 emission reduction, which means it is necessary to formulate more differentiated regulations and policies on emission reduction and inter-regional technology transfer in the various regions of China.
Government policies can affect the energy mix and energy efficiency domestically, which in turn influence the efficiency of carbon reduction. Kim et al. (2015) took the DEA method to evaluate the investment efficiency of three new electricity-generating sources in South Korea: wind power generation, photovoltaic power generation, and fuel cell. In terms of government investment, wind power is the most efficient renewable energy source there. Cheng et al. (2018) pointed out that China's Yunnan Province, as a pilot market for power reform, provides a reference for future market reforms and renewable energy policies in the country as well as other regions through its integration and experience in low-carbon construction, inter-provincial competition, power grid security, and development goals. Harlan (2018) analyzed the policies that promote the transformation of small hydropower (SHP) in China and believed that SHP's transformation into a privatized low-carbon industry would make it easier to industrialize.
(3) Some scholars also analyzed the comprehensive utilization of renewable energy from the perspective of the constraints of climate and other objective environments on hydropower. Zapata et al. (2018) took Colombia as an example and analyzed the scenario of 100% renewable energy supply via a simulation model, concluding that both energy efficiency improvement and supply security can be achieved through a gradual adjustment and transformation of energy structure. Li et al. (2018) employed the world's largest hydropower photovoltaic hybrid power system, the Longyangxia project in China, as a case study and proposed a multi-objective optimization model of a hydropower system that considers both power generation and energy consumption. Mosquera-Lopez et al. (2018) mentioned that below freezing temperatures in cold weather force hydropower systems to cease operations, and so more renewable energy should be included in countries dependent on hydropower to eliminate price spikes. Koch et al. (2018) established a model system for simulating wind power electricity generation and hydroelectric power electricity generation and analyzed their complementarity based on climate change. Ranzani et al. (2018) proposed that climate change is changing the seasonality and exploitable capacity of hydropower. Ehrbar et al. (2018) set up an evaluation matrix for the systematic analysis of 16 economic, environmental, and social criteria for hydropower potential in the glacial edges of the Swiss Alps.
(4) Power production efficiency evaluation and method innovation research is noteworthy. Sozen et al. (2010) analyzed the electricity generation efficiency of China's state-owned thermal power plants with two DEA models: returns to scale (RTS or CCR) and various returns scale (VRS or BCC). Zanella et al. (2015) offered a new comprehensive index model based on the directional distance function to improve the shortcomings of traditional data envelopment analysis (DEA) and the directional distance function model. Calabria et al. (2018) constructed a new method based on the composite index of the directional distance function model to evaluate the efficiency of hydropower stations in Brazil, presenting underperforming hydropower stations and quantifying their improvement potential. Wang et al. (2018) proposed a new meta-frontier framework for measuring the heterogeneity of technology, which may provide help for investigating the heterogeneity among regions.
For application research of efficiency methods, Scheel (2001) discussed various methods to deal with unsatisfactory output under the DEA framework and compared the effective frontier generated from this. Fare et al. (2007) calculated the technical efficiency and pollution emission reduction cost by using data of coal-fired power plants, providing an empirical basis for the comparison of the environmental production function and the environmental direction distance function. Sueyoshi and Goto (2011) included input separation (dividing the input into energy and non-energy parts) in the calculation framework of DEA non-radial measurement as well as output separation (ideal and non-ideal outputs).
(5) Some studies have focused on carbon emission reduction potential, low carbon technology, and integrated research of electricity generation. Using data from 2005 for 129 countries and their total CO2 intensity of electric power production, production efficiencies of coal, oil, and natural gas, and non-fossil fuels' electricity share as five national-level performance indicators, Ang et al. (2011) studied the potential for reducing global energy-related CO2 emissions from electricity production through simple benchmarking. Zhou et al. (2014) analyzed the energy efficiency and carbon dioxide emission reduction of thermal power electricity generation in China's seven regional power grids from 2004 to 2010 through the logarithmic average decomposition index (LMDI). They determined that energy intensity and energy combination have positive impacts on CO2 emission reduction, but the influences of structure and CO2 emission factors are not significant.
Using a kind of radial direction distance function on more than 100 countries in the process of generating energy and CO2 emissions, Zhou et al. (2012) found OECD countries have better carbon emission and comprehensive energy-carbon performances in electricity generation than non-OECD countries, but there is no significant difference of energy performance between them. Firth et al. (2019) noted that the modification of carbon capture and storage in power plants can reduce the radiation force of carbon dioxide. Viebahn et al. (2015) used a comprehensive evaluation method covering five evaluation dimensions to evaluate carbon capture and storage (CCS) technology, proving that the economic, ecological, and social feasibilities of CCS in a low-carbon policy environment may be completely effective. Fernandes et al. (2019) combined field sampling and gas chromatography with geostatistics and remote sensing methods, proposing that hydropower reservoirs promote the greenhouse effect in the atmosphere through the emissions of methane and carbon dioxide and suggesting more measurements and observations.
Due to environmental constraints on hydropower development, Severnini (2019) showed that each additional megawatt of fossil-fuel electricity generation capacity adds about 1,400 tons of carbon dioxide emissions per year. Kumar et al. (2019) collected data from 12 hydropower reservoirs in China and input them into the GHG risk assessment tool model to predict the long-term greenhouse gas (CO2 & CH4) risk of hydropower reservoirs and their related life cycle, concluding that the Three Gorges reservoir is currently at high-risk CH4 and medium-risk CO2 levels. Herrera-Estrada et al. (2018) used multiple linear regressions to study the impact of droughts on electricity generation and found that they positively correlate with the increase of natural gas electricity generation in California, Idaho, Oregon, and Washington.
Based on the above literature, one can see that hydropower is mainly used as an auxiliary object in the research of energy structure or renewable energy electricity generation, so as to understand the positive impact of hydropower as a form of clean energy on the economy, society, and the environment. There are few regional comparative studies targeting hydropower efficiency, especially from the perspective of inter-provincial differences. Therefore, this paper aims to solve how to subjectively and efficiently develop a hydropower industry in a region or province based on objective conditions, uses the EBM model to evaluate the energy efficiency of the hydropower industry among provinces in China, and makes a comparative analysis of regional differences, focusing on the installed capacity and CO2 emission reduction efficiencies of various regions.
Research Method
Both CCR (A. Charnes & W. W. Cooper & E. Rhodes) and BCC (Banker & Charnes & Cooper) are radial DEA models that ignore non-radial slacks when evaluating efficiency values. While SBM (Slacks-Based Measure) is a non-radial DEA model, it fails to consider the radial characteristics; that is, it ignores those characteristics that have the same radial proportions. To address and resolve the shortcomings in both the radial and non-radial models, Tone and Tsutsui (2010) proposed the Epsilou-Based Measure (EBM) DEA model, which is input-oriented, output-oriented, and non-oriented.
Since the EBM model which considers both radial and non-radial factors is more in line with the actual situation of China's hydropower input and output, and the conclusion obtained will be more objective and accurate in evaluating China's hydropower efficiency. So, this paper thus uses Tone and Tsutsui (2010) EBM Non-oriented DEA to calculate and evaluate the overall efficiency score of hydropower electricity generation in three main regions of China, including east, central, and west. The non-oriented EBM DEA description for the basic model and solution goes as follows.
Non-oriented EBM
With n DMU, where DMUj = (DMU1, DMU2, ……, DMUk, ……, DMUn), m kinds of inputs Xj = (X1j, X2j, ……, Xmj), and soutputs Yj = (Y1j, Y2j, ……, Ysj), the efficiency value of a DMU is:
Subject to
λ1 + λ2 + … + λn = 1
λ ≥ 0, S− ≥ 0, S+ ≥ 0.
Y: DMU output,
X: DMU input,
S−: slack variable,
S+: surplus variable,
W−: weight of input I, ,
W+: weight of output S,,
: set of radial θ and non-radial slack,
: set of radial η and non-radial slack.
If DMU0 K* = 1 is the best efficiency for a non-oriented EBM, and if an inefficient DMU wants to achieve an appropriate efficiency goal, then the following adjustments are needed:
Generating Equipment Availability Hour, Installed Capacity, Electricity Generation, and CO2 Emission Reduction Production Efficiency Indices
This research uses the total-factor energy efficiency index to overcome any possible bias in the traditional energy efficiency indicators. For each specific evaluated municipality or province, the generating equipment availability hour (GEAH), installed capacity, electricity generation and CO2 emission reduction (CO2 ER) are calculated using Equations (4)–(7):
If the target GEAH and installed capacity input equal the actual input, then GEAH and installed capacity efficiencies equal 1, indicating overall efficiency. If the target GEAH and installed capacity input are less than the actual input, then their efficiencies are <1, indicating overall inefficiency.
If the target electricity generation and CO2 ER desirable output are equal to the actual electricity generation and CO2 ER desirable output, then electricity generation and CO2 ER efficiencies equal 1, indicating overall efficiency. If the actual electricity generation and CO2 ER desirable output are less than the target electricity generation and CO2 ER desirable output, then electricity generation and CO2 ER efficiencies are <1, indicating overall inefficiency.
Data Sources and Description
This study utilizes panel data from 29 municipalities/provinces in the most developed areas of China spanning 2013–2017. The labor data are from the Chinese Statistical Yearbooks and the Demographics and Employment Statistical Yearbook of China. Electricity data come from the China Energy Administration annual report and China Electric Power yearbook. As the 29 municipalities/provinces have different populations, industries, natural resources, meteorological conditions, and geographical positions, they are fairly representative of the status quo, efficiency, and contribution of hydropower in China for examining carbon dioxide reduction. The input indicator variables used in this study are labor, generating equipment availability hour, and installed capacity, while the output indicators are electricity generation and CO2 emission reduction (Table 1).
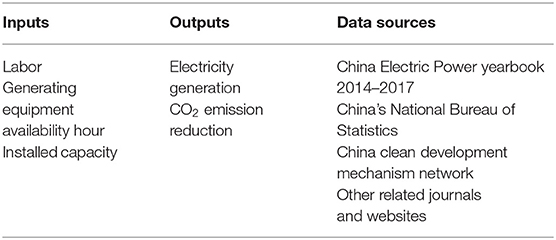
Table 1. Input and output variables.
Input Variables
Labor input (lab): Employees. Since there are no separate statistics on the number of employees in the hydropower industry, we instead use the employment of urban units in the production and supply industries of electricity, gas, and water. This study takes the number of employees in each municipality/province at the end of each year. Unit = 10,000 people.
Generating equipment availability hour: the number of operating hours, calculated by dividing the generating capacity of the reporting period by equipment capacity. Unit = hours.
Installed capacity: the sum of the rated effective electricity of the generator set actually installed. Unit = MKW.
Output Variables
Electricity generation: the amount of electrical energy produced by a generator through energy conversion. Unit: KWH.
CO2 emission reduction: Hydropower is clean because it produces electricity without the need for conventional energy (unless the small number of ancillary equipment). In this paper, the contribution of hydropower to CO2 emission reduction is calculated by using the standard coal consumption required for the same power generation. Based on CO2 generated by thermal electricity under the same generating capacity, this capacity is converted into standard coal, where one degree of electricity consumes 360 grams of standard coal; 1 ton of raw coal = 0.714 tons of standard coal. The carbon dioxide emission coefficient per ton of raw coal is 1.9003 kg-co2/kg. Therefore, the formula is CO2 emission reduction = electricity generation* 0.36/0.714*1.9003/10. Unit: Mt.
Empirical Analyses
Statistical Analysis of Input-Output Indicators
This paper divides 29 provincial-level administrative regions into the east, central, and west. The eastern coastal areas include Beijing, Hebei, Liaoning, Jiangsu, Zhejiang, Fujian, Shandong, Guangdong, and Hainan. The central inland includes Shanxi, Inner Mongolia, Jilin, Heilongjiang, Anhui, Jiangxi, Henan, Hubei, Hunan, and Guangxi. The western frontier includes Sichuan, Guizhou, Yunnan, Tibet, Shaanxi, Gansu, Qinghai, Ningxia, Xinjiang, and Chongqing. In order to compare the energy efficiency and hydropower environment of these three regions, we analyze their efficiency indices. In Table 2 we see from 2013 to 2017 that there is a small difference in the amount of hydropower employment in the eastern and central regions, while the western region has the lowest amount.
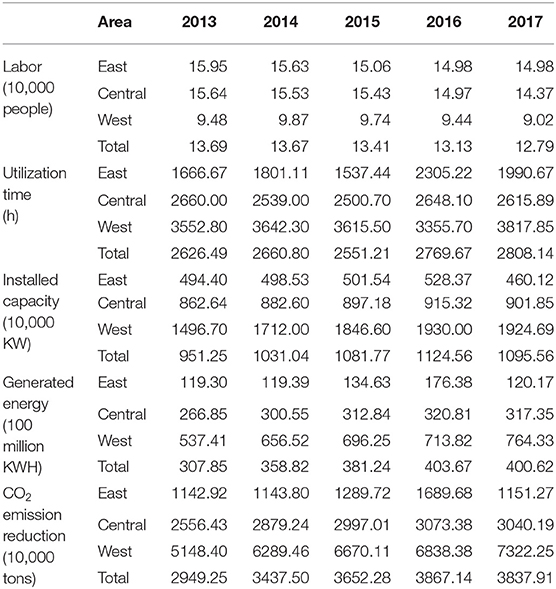
Table 2. Average situation of each indicator by region from 2013 to 2017.
Figure 1 shows the index level and its change trend for the 5 years in each area. In regard to the input index of installed capacity, the eastern, central, western, and national trends have the same change, growing steadily from 2013 to 2016 and falling back in 2017, whereas the hydropower installed electricity capacity of the western region is more than twice that of the eastern region.
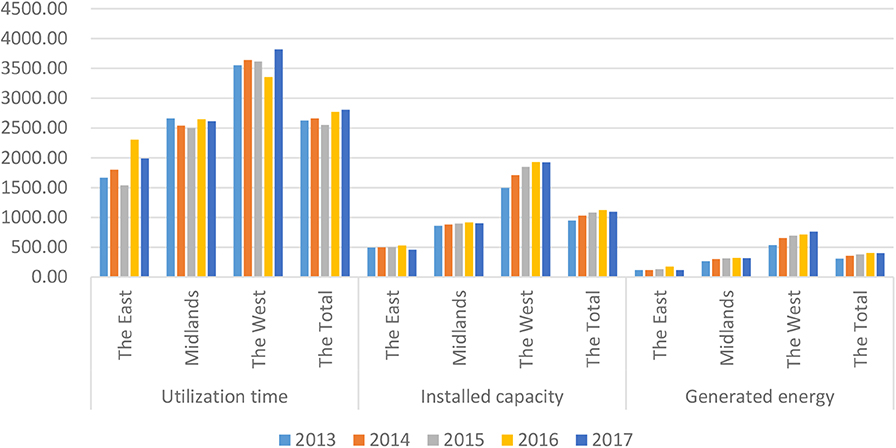
Figure 1. Comparison of the average situation of each indicator by region from 2013 to 2017.
In terms of utilization time, the level and change in trend of the three regions are different. The change in trend of the central region is relatively gentle, while the change in trend of the eastern and western regions is unstable, rising and falling at random. In terms of output index and electricity generation, the western region is at a high level, which is about 4 times and 2 times that of the eastern and central regions, respectively, and it has been continuously increasing in the past 5 years. However, hydropower electricity generation in the eastern and central regions is basically unchanged and declined in 2017. Generally speaking, the development momentum of the hydropower industry in various regions of China has slowed down in recent years. Moreover, hydropower development has not reached any standard, which may relate to the difficulty of such development and poor consumption of hydropower.
Total Efficiency Score and Ranking Analysis
Table 3 exhibits the total efficiency score and ranking in different regions. The western region as a whole performed significantly better, while the eastern and central regions rarely had the most efficient provinces. For example, Sichuan and Yunnan both have a total efficiency score of 1, and their energy efficiency of hydropower is 1 from 2013 to 2017. Fujian, Hubei, Gansu, and Shaanxi have a total efficiency value ranging from 0.8 to 1.0.
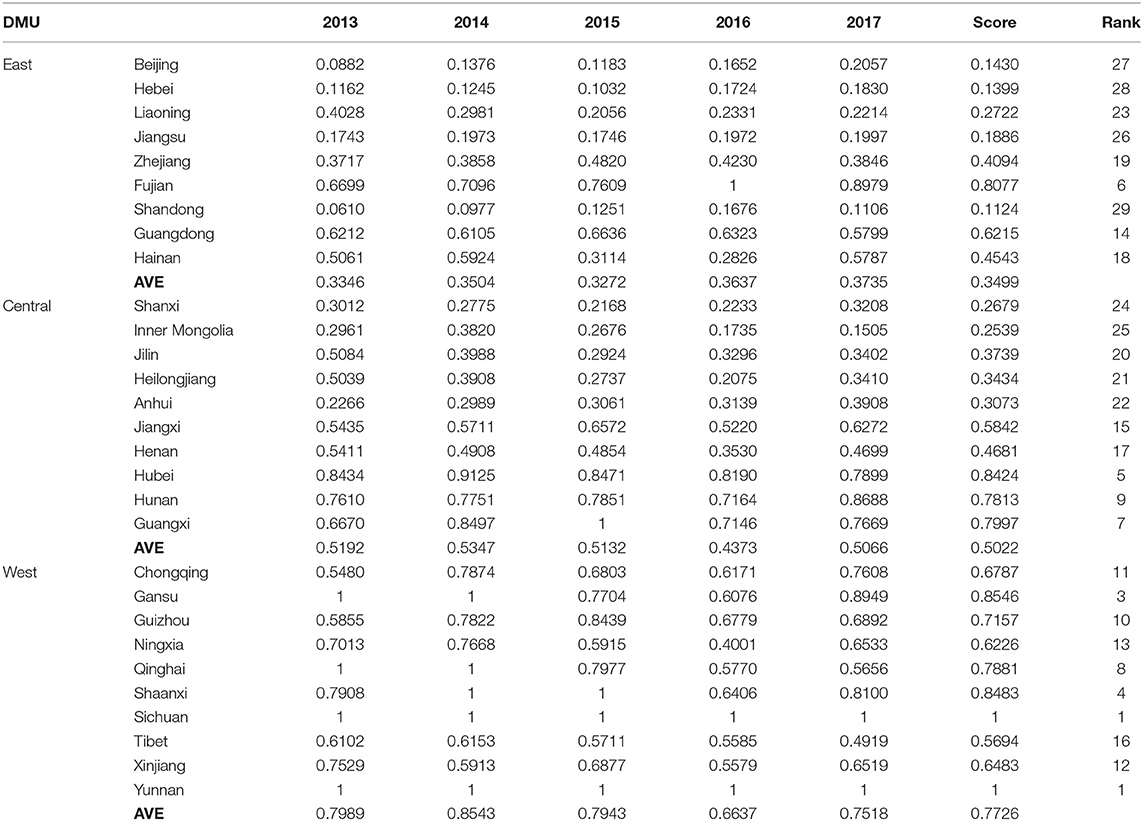
Table 3. The total efficiency score and ranking in different regions.
As seen from Figure 2, the total efficiency of hydropower is west > central > east from high to low overall. The ratio of the number of top-10 provinces in the three regions is 1:3:6, while 13 cities with a total efficiency value <0.5 are distributed in the eastern and central regions, indicating that hydropower energy efficiency in these two regions is far below that of the western region.
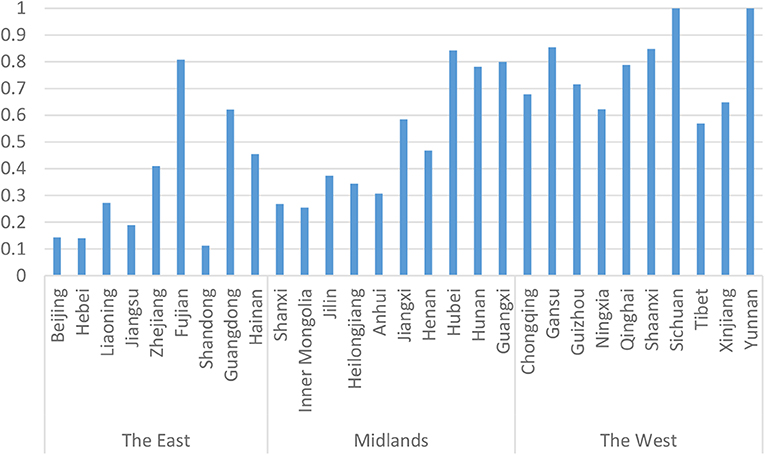
Figure 2. Total efficiency scores among provinces by region from 2013 to 2017.
From Figure 3 we can see the geographical distribution in the three regions. In terms of the whole country, the hydropower efficiency of the southwest region is obviously better than that of northeast. There is still much room for hydropower efficiency improvement in the central and eastern regions.
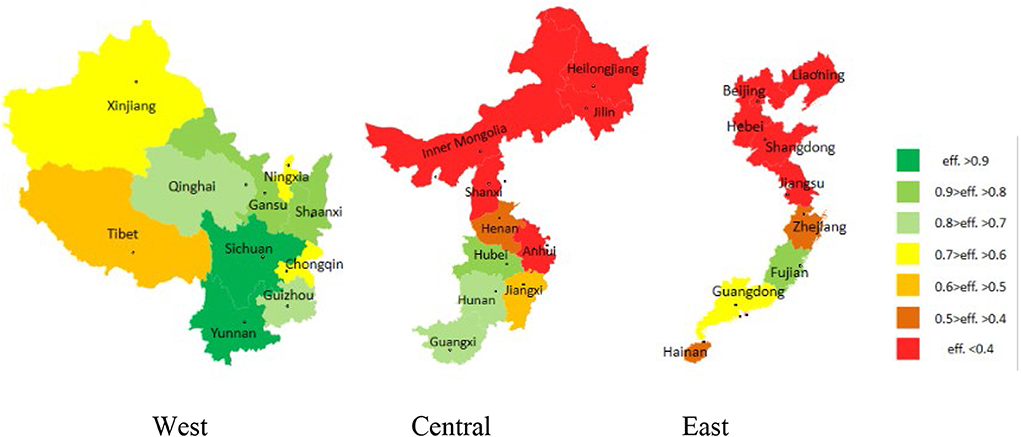
Figure 3. Map of regional total efficiency.
Under multiple factors and from regional differences in hydropower energy efficiency, further analysis concludes that the level of economic development has a weaker influence on hydropower energy efficiency, and that the level of this efficiency is more likely to depend on the resource endowment of a region. Moreover, policy support also plays a significant role to a certain extent, because with the development of clean energy in recent years, the government is more and more encouraging the western region with its rich water resources to exploit hydropower in order to improve its energy structure and achieve carbon reduction benefits. Under a multilateral support policy, hydropower enterprises in the western region have accumulated rich experience and advanced technology, and so regions with hydropower energy efficiency are more efficient than other areas.
It is obvious from Figure 4 that, first, the total efficiency of hydropower energy varies greatly in the three regions, with the highest in western remote areas, followed by central inland areas, and the lowest in eastern coastal areas. Second, the trend of hydropower energy efficiency in the three regions varies from time to time. The western and central regions both increased in 2017, while the eastern region declined slightly. Compared to 2013, the hydropower energy efficiency in western China decreased slightly in 2017, which is the key region for hydropower development and includes many large hydropower complexes. In recent years, China has invested heavily in the development and construction of hydropower, but the expected effect has not been achieved. Generally speaking, the economic effects of hydropower development are fading. Thus, the government should identify the bottleneck problems of hydropower development in various regions as soon as possible, measure the long-term and short-term costs and benefits of hydropower development, formulate more effective targeted policies, and attain environmental and economic double benefits by replacing traditional fossil energy with clean energy.
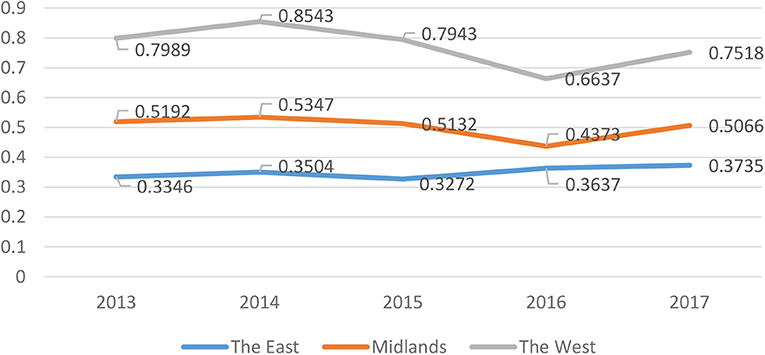
Figure 4. Variation trend of total efficiency by regions from 2013 to 2017.
Comparison of Installed Electricity Capacity and Carbon Emission Reduction Efficiencies
From Table 4, the efficiency score of installed electricity capacity is generally lower than that of the CO2 emission reduction index. This shows that installed electricity capacity in many areas is underutilized and there is redundant investment, especially in the eastern coastal areas. The number of provinces with installed electricity capacity and CO2 emission reduction efficiency close to the production frontier (above 0.9) is 1, 3, and 6 for the east, central and west regions, respectively. These provinces have achieved better carbon emission reduction benefits from hydropower. The efficiency value is divided into three gradients: Above 0.85, 0.45–0.85, and below 0.45. The ratio of the number of provinces whose efficiency value of hydropower installed electricity capacity is distributed in the same three gradients is 14:11:4. Beijing, Hebei, Jiangsu, and Shandong have an efficiency value lower than 0.45, indicating that their hydropower electricity capacity is weak, and they are all located in eastern coastal areas. Provinces with more electricity generation have a greater contribution to CO2 emission reduction, whereas provinces whose efficiency of CO2 emission reduction is >0.9 are also outstanding at generating electricity. Thus, most areas with resource endowment can exert their advantages and vigorously develop clean energy; these areas are mostly in the west. The eastern coastal region has had rapid economic development, but needs to improve its hydropower industry efficiency for the reduction of carbon emissions.
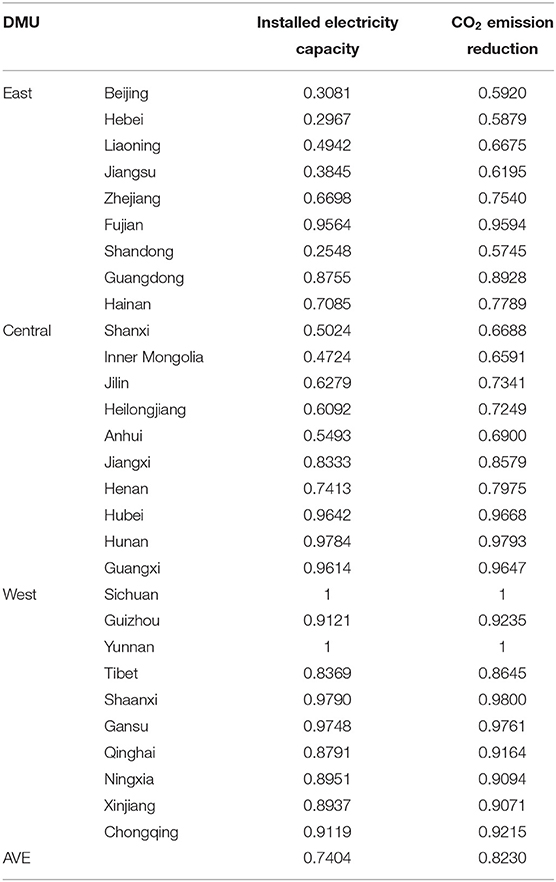
Table 4. Average score of installed electricity capacity and CO2 emission reduction efficiency.
From the contrast analysis of the two indicators' efficiency value in Figure 5, Fujian, Sichuan, and Yunnan have the same efficiency score for the two indices. In the other provinces, their installed capacity efficiency scores are lower than the values of CO2 emission reduction efficiency. Shandong, Hebei, Jiangsu, and Shanxi have bigger differences amongst themselves. While the input efficiency of the four provinces is low, they perform relatively well at carbon emission reduction, and so improving installed electricity capacity efficiency is not an ideal way to increase carbon reduction efficiency.
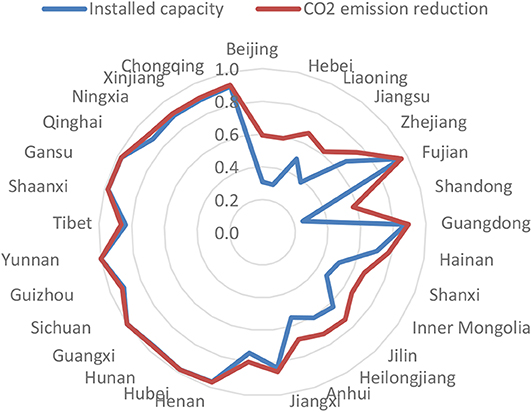
Figure 5. Radar contrast chart of installed capacity and CO2 emission reduction.
We can divide those provinces with smaller difference between the two indices above into two categories. The first one covers those with a high efficiency value, whereby both efficiencies of installed electricity capacity and CO2 emissions reduction are close to the frontier. From the radar contrast chart, they are mostly distributed in the western region, and their room for improvement of installed electricity capacity and carbon emission reduction efficiencies is not large. The second category is provinces with relatively low efficiency values, which are all located in the eastern and central regions. These regions need to focus on improving the efficiency of installed electricity capacity or the hours of equipment utilization to indirectly promote the growth of carbon emission reduction efficiency.
There are large inter-provincial differences in the efficiency values of the two indices in the eastern and central regions, especially for installed electricity capacity. The curves of the efficiency values of installed electricity capacity and CO2 emission reduction are basically in line with each other and very close to the production frontier in the western region, which also reflects the mature development of hydropower in this region. The differences in central China are moderate. The curves of the efficiency values of installed electricity capacity and CO2 emission reduction there exhibit a high degree of agreement, being close to the production frontier for Guangdong, Hunan, and Hubei. In the eastern region, the difference is more obvious. Except for Fujian and Guangdong, the provinces here have low installed electricity capacity and low investment efficiencies. In fact, most places in the eastern region have flat terrain and scarce water energy resources, and so governments have invested in the construction of many pumped-storage hydropower stations. Although such hydropower stations have a high number of hours of equipment utilization, the initial investment is large, and the machinery and equipment in the production process release carbon dioxide, leading to insufficient contribution of hydropower to carbon emission reduction. Hence, local governments in the eastern region could consider developing other clean energy sources, such as photovoltaic, wind, and tidal power to reach carbon reduction targets.
Cause Analysis of Efficiency Difference
Clean energy development in China is affected by the withdrawal of the United States from the Paris agreement and the expansion of fossil energy exports. Moreover, in China the current shortage of clean energy consumption and the long overdue and widening gap of renewable energy subsidies are restricting the future development of its clean energy industry.
In China the eastern and western regions have key roles in the country's hydropower development. The eastern region has a high level of economic development, which can provide many convenient conditions for the development of the hydropower industry. The western region has the natural advantages of hydropower development, rich resources, and sparse population, which is suitable for the establishment of large- and medium-sized hydropower facilities. The inefficiency factors of the western region mainly come from its fragile ecological environment, poor traffic conditions, long electricity transmission distance, high costs of engineering construction and electricity transmission, and increasing resettlement and ecological environmental protection investment. In addition, the demand for comprehensive utilization of hydropower is becoming greater, and insufficient investment subsidies and allocation mechanisms have increased the economic burden and construction cost of hydropower. In recent years, the growth rate of electricity consumption has decreased, and the supply in the electricity market has exceeded demand, leading to the problem of “abandoning water” (the amount of water used to generate electricity under the generating capacity of a hydropower station that is not actually used for generating electricity due to various reasons) in western China.
The high proportion of pumped storage electricity stations in east and central China leads to a low utilization rate of hydropower equipment. Moreover, hydropower projects in the eastern region are mostly saturated, and to some extent they rely on the “west-east gas transmission” for electricity supply, resulting in additional electricity costs and poor efficiency. The input-output efficiency scores of various indices are lower in the central regions than in the western region due to geographical location and non-disadvantages of water energy resources.
It is therefore recommended that the central government establish a “dynamic comprehensive hydropower cost evaluation system” to understand the significance of developing the clean energy hydropower industry from the four dimensions of energy, environment, economy, and social benefits. China should complete an investment subsidy mechanism as soon as possible and vigorously support the development of hydropower in the western region.
Table 5 shows the Wilcoxon test score for the average technology gap. In 2013–2017, the average total efficiency of the three regions passes the significance test.
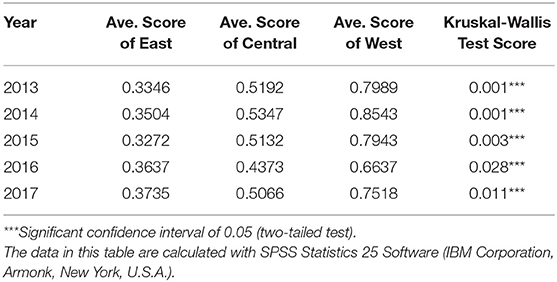
Table 5. Kruskal-Wallis test score of total efficiency.
Conclusions and Policy Recommendations
Conclusions
This study divides 29 provincial-level administrative areas in China into eastern, central, and western regions. We then evaluate and analyze their hydropower energy efficiency, inter-provincial differences, and improvement space in 2013–2017 in order to discuss the level of hydropower efficiency, influencing factors, and improvement direction of each region. The empirical results are as follows.
(1) In terms of the level of input and output indicators, the western region is higher than the central region, and the eastern region is at the bottom. In terms of the change in trend over the past 5 years, many indicators in most provinces and cities have fallen back. Generally speaking, the development momentum of the hydropower industry in China has slowed down in recent years.
(2) The total energy efficiency of hydropower in order from high to low is west, central, and east. The ratio of the top-ten provinces among the three regions of east, central, and west is 1:3:6. Moreover, the provinces and cities whose total efficiency value is <0.5 are all distributed in the eastern and central regions, indicating that the hydropower energy efficiency of these two regions is far away from that of the western region.
(3) From a comparison of installed electricity capacity efficiency and carbon emission reduction efficiency, the performance of the three regions is consistent with the order of the total efficiency score, no matter for the efficiency value or inter-provincial difference. The overall levels of installed electricity capacity and CO2 emission reduction efficiencies in the east are significantly lower, and inter-provincial differences are large. The curves of installed electricity capacity efficiency and CO2 emission reduction efficiency in the west are basically identical and very close to the production frontier. The differences in the central region are between these two regions.
(4) In terms of the energy efficiency of hydropower, we conclude that the western region is the best, followed by the central region and then the eastern region. Moreover, natural water resources and geographical advantages have a great positive effect on hydropower efficiency, while economic development has little effect on it.
This shows that in China, the improvement of hydropower efficiency mainly depends on the more economical and rational use of hydropower resources. It is an effective measure to make full use of water head, reasonable operation of reservoirs and reasonable number of power stations in the western region to ensure the operation of hydropower in the high-efficiency area. With the rapid development of economy and the increasing energy shortage, small hydropower and pumped storage power stations can become the important channels for hydropower development in eastern China. On the one hand, small hydropower and pumped storage power stations can overcome the weak natural conditions of hydropower in the eastern region. On the other hand, they can meet the elastic needs of peak adjustment, frequency modulation and phase adjustment of power grid in the developed eastern region.
Policy Recommendations
With the development of technology and the concept of ecological and environmental protection, China should consolidate its leading position as a powerful hydropower country in the world, actively promote the concept and innovation of hydropower development, and attach equal importance to development, protection, construction, and management. Based on the above conclusions, provinces, cities, and regions should solve their problems according to local conditions and formulate and adopt strategies and countermeasures in line with their own actual circumstances.
Eastern Coastal Area
(1) The basic development of hydropower resources is complete, but there is still room for improvement in their installed electricity capacity. In particular, the efficiency of equipment utilization hours should be improved, which requires the region to increase investment in hydropower construction, make full use of existing equipment, and increase its contribution to carbon emission reduction.
(2) This region should cultivate and rationalize the allocation of relevant human resources, reduce waste, and improve efficiency in the number of employees.
Central Inland Area
(1) This region should target deeper development, control the growth of small- and medium-sized hydropower stations, and realize the optimal allocation of resources. Hydropower development here is at the top level, yet some provinces and cities in the region are similar to the western region, while others are only slightly better than the eastern region. A “one-to-one” pull coordinated development within the region can be adopted to achieve centralized control and optimized operations, so as to drive the provinces and cities at the bottom of the rankings to keep pace with the western region.
(2) By integrating the experiences and measures of the eastern and western regions, learning from each other, and complementing each other, this region can pay equal attention to both construction and operation management and combine project development with personnel training. Relying on the construction of large-scale hydropower projects can help cultivate various hydropower construction talents and teams with leading professional levels and outstanding scientific and technological innovation abilities.
Western Outlying Area
(1) Some provinces and cities still have great development potential and continue to expand the scale of “west-to-east electricity transmission.” On the one hand, the energy potential of the western electricity supply area can be fully developed; on the other hand, the range of hydropower consumption can be effectively expanded to solve the problem of water abandonment here.
(2) As for the constraints of hydropower development in the western region, authorities can help strengthen infrastructure construction, promote ecological restoration of small- and medium-sized river basins, improve external traffic conditions, reduce construction difficulties, continually enhance the technical level of hydropower construction and the manufacturing capacity of mechanical and electrical equipment, and target technological innovation.
(3) This region can also increase investment in hydropower, promote poverty alleviation, improve the land acquisition mechanism, and reduce development costs. Each province should boost hydropower investment subsidies and the hydropower station compensation mechanism, strengthen the coordination of departments, meet the demand for hydropower construction land, and improve the work of land applications and approvals. Governments here can do a better job at compensation and resettlement of land expropriated for hydropower construction, earnestly safeguard the rights and interests of farmers whose land is expropriated, and implement “land in advance” to ensure timely construction of hydropower projects.
Data Availability Statement
All datasets generated for this study are included in the article/supplementary material.
Author Contributions
ZT and DL: conceptualization. FR: writing—original, writing—review, and editing, methodology and formal analysis. ZT: software, data curation, draft preparation, project administration, and funding acquisition. DL: validation, resources, and visualization. JP: investigation and supervision.
Funding
This study was supported by the Project of Basic Scientific Research Expense of the Central University (2019B35814), Research on Philosophy and Social Science in Jiangsu Universities (2019SJA1153), Jiangsu Province Social Science Applied Research Project (19SYB-122), and special project of humanities and social sciences of Shaanxi Provincial Education Department (18JK1215).
Conflict of Interest
The authors declare that the research was conducted in the absence of any commercial or financial relationships that could be construed as a potential conflict of interest.
Footnote
1. ^International clean energy industry development report (2018).
References
Ang, B. W., Zhou, P., and Tay, L. P. (2011). Potential for reducing global carbon emissions from electricity production-A benchmarking analysis. Energy Policy 39, 2482–2489. doi: 10.1016/j.enpol.2011.02.013
Calabria, F. A., Camanho, A. S., and Zanella, A. (2018). The use of composite indicators to evaluate the performance of Brazilian hydropower plants. Int. 0Transact. Operat. Res. 25, 1323–1343. doi: 10.1111/itor.12277
Cheng, C., Chen, F., and Li, G. (2018). Reform and renewables in China: the architecture of Yunnan's hydropower dominated electricity market. Renew. Sustain. Energy Rev. 94, 682–693. doi: 10.1016/j.rser.2018.06.033
Ehrbar, D., Schmocker, L., and Vetsch, D. F. (2018). Hydropower potential in the periglacial environment of switzerland under climate change. Sustainability 10:2794. doi: 10.3390/su10082794
Fare, R., Grosskopf, S., and Pasurka, C. A. (2007). Environmental production functions and environmental directional distance functions. Energy 32, 1055–1066. doi: 10.1016/j.energy.2006.09.005
Fernandes, G., Lima Gomes, L., and Teixeira Brandão, L. E. (2019). Mitigating hydrological risk with energy derivatives. Energy Econ. 81, 528–535. doi: 10.1016/j.eneco.2019.05.001
Firth, A., Zhang, B., and Yang, A. (2019). Quantification of global waste heat and its environmental effects. Appl. Energy 235, 1314–1334. doi: 10.1016/j.apenergy.2018.10.102
Harlan, T. (2018). Rural utility to low-carbon industry: small hydropower and the industrialization of renewable energy in China. Geoforum 95, 59–69. doi: 10.1016/j.geoforum.2018.06.025
Herrera-Estrada, J. E., Diffenbaugh, N. S., and Wagner, F. (2018). Response of electricity sector air pollution emissions to drought conditions in the western United States. Environ. Res. Lett. 13:124032. doi: 10.1088/1748-9326/aaf07b
Kim, K.-T., Lee, D. J., and Park, S.-J. (2015). Measuring the efficiency of the investment for renewable energy in Korea using data envelopment analysis. Renew. Sustain. Energy Rev. 47, 694–702. doi: 10.1016/j.rser.2015.03.034
Koch, H., Chaves Silva, A. L., and Goncalves de Azevedo, J. R. (2018). Integrated hydro-and wind power generation: a game changer towards environmental flow in the Sub-middle and Lower Sao Francisco River Basin? Regional Environ. Change 18, 1927–1942. doi: 10.1007/s10113-018-1301-2
Kumar, A., Yang, T., and Sharma, M. P. (2019). Long-term prediction of greenhouse gas risk to the Chinese hydropower reservoirs. Sci. Total Environ. 646, 300–308. doi: 10.1016/j.scitotenv.2018.07.314
Li, F.-F., Qiu, J., and Wei, J.-H. (2018). Multobjective optimization for hydro- photovoltaic hybrid power system considering both energy generation and energy consumption. Energy Sci. Eng. 6, 362–370. doi: 10.1002/ese3.202
Mosquera-Lopez, S., Uribe, J. M., and Manotas-Duque, D. F. (2018). Effect of stopping hydroelectric power generation on the dynamics of electricity prices: an event study approach. Renew. Sustain. Energy Rev. 94, 456–467. doi: 10.1016/j.rser.2018.06.021
Ohler, A., and Fetters, I. (2014). The causal relationship between renewable electricity generation and GDP growth: a study of energy sources. Energy Economics 43, 125–139. doi: 10.1016/j.eneco.2014.02.009
Ranzani, A., Bonato, M., and Patro, E. R. (2018). Hydropower future: between climate change, renewable deployment, carbon and fuel prices. Water 10:1197. doi: 10.3390/w10091197
Scheel, H. (2001). Undesirable outputs in efficiency valuations. Eur. J. Operational Res. 132, 400–410. doi: 10.1016/S0377-2217(00)00160-0
Severnini, E. (2019). The unintended impact of ecosystem preservation on greenhouse gas emissions: Evidence from environmental constraints on hydropower development in the United States. PLoS ONE 14:10483. doi: 10.1371/journal.pone.0210483
Sozen, A., Alp, I., and Ozdemir, A. (2010). Assessment of operational and environmental performance of the thermal power plants in Turkey by using data envelopment analysis. Energy Policy 38, 6194–6203. doi: 10.1016/j.enpol.2010.06.005
Sueyoshi, T., and Goto, M. (2011). DEA approach for unified efficiency measurement: assessment of Japanese fossil fuel power generation. Energy Economics 33, 292–303. doi: 10.1016/j.eneco.2010.07.008
Tone, K., and Tsutsui, M. (2010). An epsilon-based measure of efficiency in DEA - A third pole of technical efficiency. Euro. J. Oper. Res. 207, 1554–1563. doi: 10.1016/j.ejor.2010.07.014
Viebahn, P., Vallentin, D., and Hoeller, S. (2015). Prospects of carbon capture and storage (CCS) in China's power sector - An integrated assessment. Appl. Energy 157, 229–244. doi: 10.1016/j.apenergy.2015.07.023
Wang, K., Wu, M., Sun, Y., Shi, X., Sun, A., and Zhang, P. (2019). Resource abundance, industrial structure, and regional carbon emissions efficiency in China. Resourc. Policy 60, 203–214. doi: 10.1016/j.resourpol.2019.01.001
Wang, N., Chen, J., Yao, S., and Chang, Y.-C. (2018). A meta-frontier DEA approach to efficiency comparison of carbon reduction technologies on project level. Renew. Sustain. Energy Rev. 82, 2606–2612. doi: 10.1016/j.rser.2017.09.088
Wang, Y., Zhang, D.-Y., Ji, Q., and Shi, X.-P. (2020). Regional renewable energy development in China: a multidimensional assessment. Renew. Sustain. Energy Rev. 124:109797. doi: 10.1016/j.rser.2020.109797
Xian, Y., Wang, K., Shi, X., Zhang, T., Wei, Y., and Huang, Z. (2018). Carbon emissions intensity reduction target for China's power industry: an efficiency and productivity perspective. J. Cleaner Product. 197, 1022–1034. doi: 10.1016/j.jclepro.2018.06.272
Xu, X.-F., Wei, Z.-F., Ji, Q., Wang, C.-, l., and Gao, G.-W. (2019). Global renewable energy development: influencing factors, trend predictions and countermeasures. Resources Policy 63:101470. doi: 10.1016/j.resourpol.2019.101470
Zanella, A., Camanho, A. S., and Dias, T. G. (2015). Undesirable outputs and weighting schemes in composite indicators based on data envelopment analysis. Eur. J. Operational Res. 245, 517–530. doi: 10.1016/j.ejor.2015.03.036
Zapata, S., Castaneda, M., and Jimenez, M. (2018). Long-term effects of 100% renewable generation on the Colombian power market. Sustain. Energy Tech. Assess. 30, 183–191. doi: 10.1016/j.seta.2018.10.008
Zhao, Y., Cao, Y., Shi, X., Li, H., Shi, Q., and Zhang, Z. (2020). How China's electricity generation sector can achieve its carbon intensity reduction targets? Sci. Total Environ. 706:135689. doi: 10.1016/j.scitotenv.2019.135689
Zhou, G., Chung, W., and Zhang, Y. (2014). Carbon dioxide emissions and energy efficiency analysis of China's regional thermal electricity generation. J. Cleaner Produc. 83, 173–184. doi: 10.1016/j.jclepro.2014.06.047
Keywords: EBM model, efficiency, hydropower in China, renewable energy, CO2 emission reduction
Citation: Liang D, Tian Z, Ren F and Pan J (2020) Installed Hydropower Capacity and Carbon Emission Reduction Efficiency Based on the EBM Method in China. Front. Energy Res. 8:82. doi: 10.3389/fenrg.2020.00082
Received: 14 February 2020; Accepted: 22 April 2020;
Published: 14 May 2020.
Edited by:
Xunpeng Shi, University of Technology Sydney, AustraliaReviewed by:
Qunwei Wang, Nanjing University of Aeronautics and Astronautics, ChinaHong Liu, Loughborough University, United Kingdom
Teng Xiangyu, Changzhou Institute of Mechatronic Technology, China
Copyright © 2020 Liang, Tian, Ren and Pan. This is an open-access article distributed under the terms of the Creative Commons Attribution License (CC BY). The use, distribution or reproduction in other forums is permitted, provided the original author(s) and the copyright owner(s) are credited and that the original publication in this journal is cited, in accordance with accepted academic practice. No use, distribution or reproduction is permitted which does not comply with these terms.
*Correspondence: Fangrong Ren, 383886990@qq.com