Conservative or Aggressive? The Dynamic Adjustment of the Feed-in Tariff Policy for Photovoltaic Power Generation in China
 Yi Fu
Yi Fu Chang-hao Hu
 Dong-xiao Yang
- 1School of Business, Central South University, Changsha, China
- 2Collage of Economics and Trade, Hunan University of Technology and Business, Changsha, China
With the technological progress of photovoltaic (PV) enterprises, the subsidy standard of PV power generation in China is declining. However, the conservative adjustment of feed-in tariff (FIT) policy is considered to increase the financial burden of the government, while the aggressive adjustment will have a serious impact on the PV enterprises and may reduce the research and development (R&D) investment of them. By constructing a game model between the government and PV enterprises, this article analyzes the relationship between the adjustment of government subsidy policy and R&D investment of PV enterprises. The evolution path and strategic stability of the system have been studied through evolutionary analysis and numerical simulation. Results show that three strategies may become the evolutionary stability strategy (ESS) of the system under certain conditions. Firstly, the investigation of these conditions reveals the strategy that the government chooses conservative adjustment and enterprises choose to increase R&D investment is more likely to be an ESS. Secondly, the initial preference of the government and enterprises cannot change the final result of system evolution, but only changes the speed of reaching it. Finally, the research on the interaction between government and enterprises illustrates that when the degree of influence is small, the ESS is that the government chooses aggressive adjustment and enterprises choose to increase R&D investment. But when the degree of influence is large enough, the government is more inclined to choose conservative adjustment and enterprises choose to increase R&D investment. The decision-making of the government should be focused on the interaction between the government and enterprises. The encouraging cooperation among PV enterprises, universities, and research institutions can promote the technological progress of the PV industry, so as to achieve the purpose of subsidy policies more effectively.
Introduction
The shortage of fossil energy and greenhouse gas emissions caused by fossil energy combustion are increasingly a concern for people all over the world (Wei et al., 2019). Hence, renewable energy (RE) resources, such as wind, solar, biomass, and geothermal, have been developed vigorously under the promotion of technology and government support in recent decades (Chen et al., 2018). China has already been strengthening the development and utilization of RE, which can reduce the level of carbon emissions effectively (Ming et al., 2013). Through the efforts made during the past decade, solar energy development, and its utilization in China have been in the forefront of the world, with the cumulative installed capacity of photovoltaic (PV) enterprises and annual newly installed capacity ranking first in the world. The successful development of the PV industry has greatly improved. The energy structure in China has reduced an enormous number of greenhouse gas emissions. At the same time, the implementation of subsidy policies such as feed-in tariff (FIT) has achieved good economic benefits (Ling-zhi et al., 2018). Therefore, the Chinese government has set the sustainable development goal of achieving peak of carbon emissions by 2030 and carbon emissions neutrality by 2060 (NDRC, 2017).
It is undeniable that the government's support and promotion has played an important role in the development of the PV industry (Lo, 2014; Yang D. et al., 2019). To promote the healthy development of the PV industry, the United States, Japan, Germany, China, and many other countries have formulated policies, such as FIT and renewable portfolio standard (RPS), and have adopted government subsidies, tax relief, policy support, and other methods (Chen et al., 2017). However, as the scale of the PV industry continues to expand, technology continues to improve, unit power generation cost (UPGC) continues to decline, and government subsidies need to decline. Thus, some countries implement a subsidy scheme that decreases year by year for PV projects, while some countries offer different subsidy standards for new projects in different years. In China, long-term constant FIT has not been able to adapt to the decline in the cost of PV equipment, and very broad regional pricing will hinder the development of PV generation to some extent (Yang and Ge, 2018). In 2013, the State Council of China promulgated Several opinions on promoting the healthy development of photovoltaic industry (NDRC, 2013a), which clearly proposed that “the policy of subsidizing distributed PV power generation according to electricity quantity” and “the implementation period of on grid electricity price and subsidy is 20 years in principle” (MF, 2013; NDRC, 2013b). In fact, the Chinese government plans to adopt a low or no subsidy policy mechanism on the RE power development in the future (Zhang et al., 2020). One of the purposes of government subsidies is to push the connection to the grid at an equal price to be achieved sooner. At present, the main PV subsidy policy in China is the regionally differentiated FIT policy. Specifically, the government divides PV projects into distributed PV (DPV) projects and concentrated PV projects and divides the country into three zones (Zone I, Zone II, and Zone III, see Figure 1) according to solar resources.
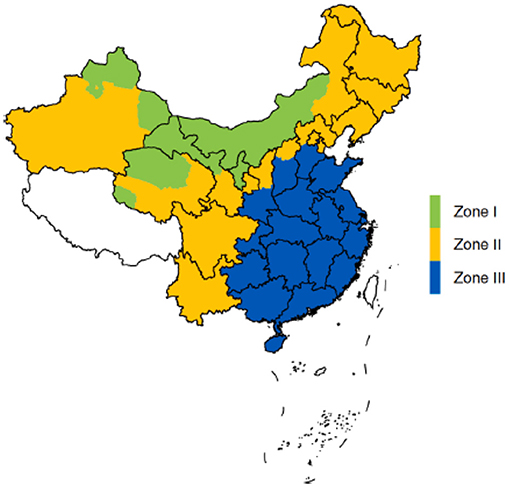
Figure 1. The Chinese zonal feed-in tariff policy. Tibet was not included in the FIT policy of China (Dong et al., 2021).
For each zone, the government promises to provide a certain amount of subsidy for the future electricity generated by PV projects, and the subsidy standard is usually different in different zones. Moreover, the subsidy standard is designed to be lowered once a year to adapt to the decline of PV power generation cost and the development of the PV industry (NDRC, 2016). In January 2019, the National Development and Reform Committee (NDRC) released The Notice on Work Related to Wind Power and Photovoltaic Power Generation Connected to Grid without Subsidy (NDRC, 2019). This Notice expresses the intention of the government to promote a low or no subsidy policy mechanism on the RE power development in the future. To achieve this goal, the current FIT price should be readjusted and redistributed (Zhang et al., 2020). Figure 2 shows the adjustment of the PV power subsidy of China since 2013. In the past 8 years, it has been reduced eight times, with an average decrease of 60%.
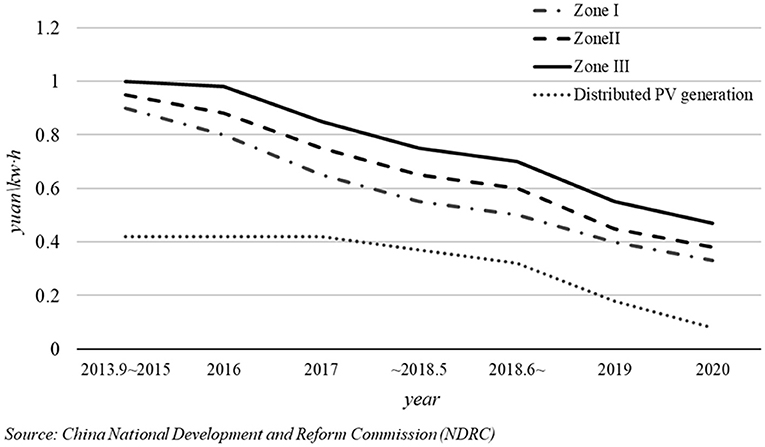
Figure 2. Overview of photovoltaic subsidy (FIT) adjustment of China.
Although the adjustment of government subsidy refers to the decrease of PV power generation cost and newly installed capacity, the enterprises and society have different opinions on the adjustment (Zhang and He, 2013). The actual situation shows that if the frequency and timing of subsidy decrease are unreasonable, it may have a serious impact on the profit and research and development (R&D) investment of an enterprise. For example, The notice on matters related to photovoltaic power generation in 2018 (531 policy) (NEA, 2018) issued by NEA in May 2018 is considered by many PV enterprise operators that the adjustment of subsidies is too radical and will have a serious impact on the development of the enterprises. Many PV enterprises require the government to give a buffer period for policy implementation and suggest that the subsidy should not be reduced too much. This phenomenon shows that it is often difficult for the government to effectively regulate the subsidy standard. The government is not clear about the impact of the policy, resulting in the deviation between the expected goal of the government and the actual implementation effect of the policy.
Therefore, the relationship between the adjustment of government subsidies and the development of PV enterprises has become an important issue for the government to consider. How to adjust the subsidy policy to promote enterprises to increase investment in technological innovation, improve operating efficiency, and ultimately achieve the stable and healthy development of the PV industry? What factors need to be considered in the adjustment of subsidy policy? This article constructs an evolutionary game model between the Chinese government and PV companies, and investigates the evolutionary stability strategy (ESS) of the system through numerical simulation, so as to provide a certain reference for answering the above questions. The following section discusses the literature review, introducing the relevant research on the FIT policy and PV subsidy policy of China. The “Assumptions” section consists of the hypothesis of the game model. The “Evolutionary game model” section constructs an evolutionary game model between the government and PV companies. The evolution analysis of the game model is discussed in the “Evolutionary analysis of game model” section. The “Numerical analysis” section is a numerical simulation, focusing on the influence of some important parameters on ESSs. The “Conclusion” section concludes.
Literature Review
Using various government subsidies to support the development of the PV industry is a common practice among countries. The FIT policies are implemented in more than 40 countries around the world. The successful development of the RE market in Germany, the United States, China, and other countries shows that the FIT policy is the most effective policy to encourage the rapid and sustainable deployment of RE (Couture and Gagnon, 2010). Therefore, a large number of studies have analyzed government subsidy policies for RE and evaluated the actual effects of them, mainly FIT and RPS (Hitaj and Löschel, 2019).
Some studies have shown that government subsidies have an important impact on the development of RE and renewable electricity generation. When the cost of RE production or the energy-negative coefficient is low, the subsidy policy generates a high electricity price (Yang and Nie, 2016). The Chinese FIT policy has played an important role in promoting the development of the PV industry. Some scholars studied the impact of the Chinese 531 policy on the PV industry through the empirical method and estimated the effect of the Chinese FIT policy on PV-installed PV capacity. Results reveal that an increase of ¥0.1 per kWh (~US$0.014 per kWh) in PV subsidies adds about 18 GW/year of installed capacity to the national PV market. The impact of PV subsidies on the development of PV deployment market is so great that some researchers even pointed out that if there are no subsidies, the PV industry of China would almost disappear (Dong et al., 2021). Similarly, Du and Takeuchi (2020) investigated the effectiveness of regionally differentiated FITs for the development of RE in China. A small difference in the tariff rate leads to statistically significant differences in outcome indicators among regions. Smith and Urpelainen (2014) studied the FIT policy of the United States, demonstrating that the FIT is an effective way to increase renewable electricity generation. The study finds that increasing the FIT by US$0.01 (2,000 constant prices) per kWh increases the percentage change in the share of renewable electricity of the total by 0.11% points. In the study of Italian FIT policy on the PV market, Antonelli and Desideri (2014b) also pointed out that the PV industry of Italy has developed rapidly due to adequate FIT subsidies. The overall cost of PV station construction is on the decline, which is more determined by the tariffs than by the market development and structure. But the research provided an interesting conclusion that the distribution of PV installations on the territory is not a function of solar radiation (Antonelli and Desideri, 2014a).
The influence of government subsidies on R&D input and cost reduction has also been studied by a large number of scholars. The government support policies such as subsidies and tariffs can effectively expand the market share of domestic new energy vehicles with less technology (Yang D.-X. et al., 2019). Moreover, FIT is more efficient than RPS to increase the quantity of RE (installed capacity) and to stimulate the R&D input to reduce costs (Sun and Nie, 2015). Böhringer et al. (2017) also found that the innovation impact of the German FIT scheme over the last two decades supports the positive innovation hypothesis. Zhang Y. et al. (2020) analyzed the development of dispersed wind power (DWP) and DPV in China from the perspective of technology and institutional economy. The authors believed that the subsidy policy has effectively promoted the innovation and development of new energy companies. In addition, some scholars have attempted to optimize the FIT policy. To simulate the performance of the FIT program in different situations, Kim and Lee (2012) combined cost modeling, option valuation, and consumer choice. The study tried to make recommendations for policymakers who want to expand the RE market and control the total burden of ratepayers.
However, the government subsidy standard often needs to be adjusted according to the actual situation, and the reduction of power generation cost is one of the factors that the government needs to consider. For instance, Yang et al. (2016) found that the optimal subsidy for RE enterprises positively correlates with its cost under complete information. From the perspective of the development of the PV industry in various countries, it is true that both government subsidies and enterprise costs have declined. Xu and Ma (2021) studied FIT and tax-rebate regulation from the perspective of the members in the whole solar PV supply chain. The authors also investigated a non-linear dynamic system to study the long-term operation strategies, the stability of the equilibrium, and how the conservative and aggressive strategies impact the system. Selinger-Lutz et al. (2020) introduced a two-step tariff for the feed-in electricity with dynamic tariff switching times. From the perspective of RE enterprises, how much revenue can be obtained per kWh is one of the most important issues.
Research on FIT policy mainly includes policy effect evaluation, the relationship between the government subsidies and power generation costs, and the relationship between government subsidies and enterprise innovation input. However, there are few studies on optimizing subsidy policies from the perspective of dynamic adjustment. To provide more references for the Chinese government to rationally adjust FIT policies, this study constructs an evolutionary game model between the government and PV companies. By numerical simulation to investagate the evolution and stability strategy of the model, we obtain the conditions that should be met. The main innovation of this study is to examine the relationship between FIT policy adjustment and enterprise R&D investment from the perspective of the game between the government and PV enterprises and analyze the main factors that should be considered in policy adjustment. This research makes a certain marginal contribution to existing research.
Assumptions
In China, the main PV subsidy policy is the regionally differentiated FIT policy. With the continuous advancement of PV technology and the decline of UPGC, subsidy standards are bound to be adjusted accordingly. At the same time, the decline in government subsidies also promotes enterprises to reduce the cost of PV power generation through technological innovation to a certain extent. Therefore, there exists an interaction mechanism between the decline of government subsidies and enterprise technological innovation (Requate, 2014). The government hopes to subsidize within a certain amount to improve the industrial technology level and PV-installed capacity, while the main goal of the company is to make a profit, and upgrading its technology will help companies reduce power generation costs and gain greater market share. Therefore, the following assumptions of the evolutionary game model are proposed:
(1) The government decides the adjustment of the subsidy policy. The decrease of the subsidy may lead to the acceleration of investment and construction of PV projects, and also the reduction of enterprise profits, thus reducing the investment of the PV projects. The interest goals of the government and enterprises are not completely consistent.
(2) The adjustment intensity of FIT policy has a direct impact on the future revenue expectation of enterprises, while the power generation cost of enterprises has a direct impact on the adjustment of the government subsidies for the next period and the overall expenditure level of the government.
(3) The game is a complete information game; the decision-making behavior of both sides is knowable; and the future income of a single participant can be predicted according to the behavior of the other one.
(4) The two strategies of enterprises are increasing innovation investment and reducing innovation investment. The two strategies of the government are to reduce the subsidies conservatively and aggressively.
(5) Increasing investment in innovation will reduce construction costs, assuming that the annual average reduction rate of generation cost per kWh is g, and the average annual decline rate of the government subsidies per kWh is h. When h ∈ [0, δ▪g], the adjustment of the government is called conservative, otherwise the government subsidy adjustment is called aggressive. The value of δ needs to be further determined by empirical research but estimated according to the actual situation, and this study assumes that δ = 150%.
Evolutionary Game Model
Under the influence of the continuous reduction of the government subsidies, the technological innovation of PV enterprises may not increase the profits of enterprises, and radical policy adjustment is more likely to affect the innovation enthusiasm of enterprises. Conservative adjustment has less impact on the overall income of enterprises, but it also increases the financial burden of the government to a certain extent. There are four circumstances of the game between government and enterprise are as follows:
(1) The government chooses conservative adjustment and enterprises increase R&D investment. At this time, the government gains economic benefits R1 from promoting the development of the PV industry. Technological innovation of enterprises makes the government gain political achievements E1. The cost of power generation of enterprises is reduced, which in turn reduces the government expenditure αS1(α is the extent of the impact of PV generation costs on the government expenditures,0 ≤ α ≤ 1). The cost of the government when the government adjusts conservatively is CG1. For enterprises, the subsidy they receive from the government is R2, and the innovation incentive for enterprises is CE1. The enterprises pay the innovation cost S2, but obtain the economic benefit E2 through technological innovation. Therefore, the revenue of the government and PV enterprises are (R1 + E1 + αS1 – CG1, R2 + E2 – S2 + CE1).
(2) The government chooses conservative adjustment, and enterprises decrease R&D investment. At this time, due to the reduction of enterprise R&D investment, the government revenue also changes. The cost of technological innovation is reduced to βE2 (β represents the intensity of investment in technological innovation,0 ≤ β ≤ 1). W2 is the market disadvantage caused by insufficient technological innovation. Therefore, the revenues of the government and PV enterprises are (βR1 + α S1 – CG1, R2 – βS2 + E2 – W2).
(3) The government chooses aggressive adjustment and enterprises increase R&D investment. Under this circumstance, the government cost is CG2 (CG2 > CG1) and the innovation incentive for enterprises is CE2 (CE2 < CE1). Since the subsidy has fallen sharply, which has an impact on PV companies and incurs additional costs, the company subsidy is reduced to γR2 (γ represents the extent of the impact of reduction of the subsidies on enterprises,0 ≤ γ ≤ 1). Hence, the revenues of the government and PV enterprises are (R1 + α S1 + αE1-CG2, γR2-S2 + CE2).
(4) The government chooses aggressive adjustment and enterprises decrease R&D investment. The economic benefits of the government from promoting the development of the PV industry are reduced to βR1. Not only the subsidies received by enterprises are reduced to γR2, but also the cost of technological innovation and market disadvantages are declined. Hence, the revenues of the government and PV enterprises are (βR1 – CG2, γR2 – βS2 – γW2).
Suppose that the preferences of the government for choosing conservative adjustment and aggressive adjustment are xand 1−x, respectively, and the preferences of the enterprise for increasing R&D investment and reducing R&D investment are yand 1−y, which 0 ≤ x, y ≤ 1. The payment matrix of the two participants is shown in Table 1, and notations and interpretations are shown in Table 2.
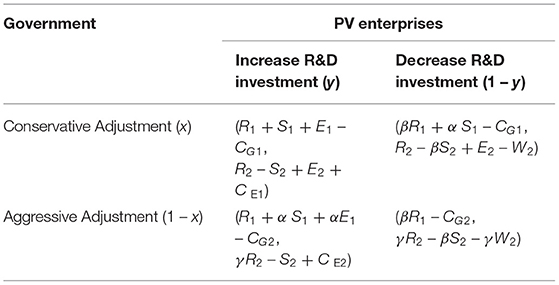
Table 1. Game payment matrix.
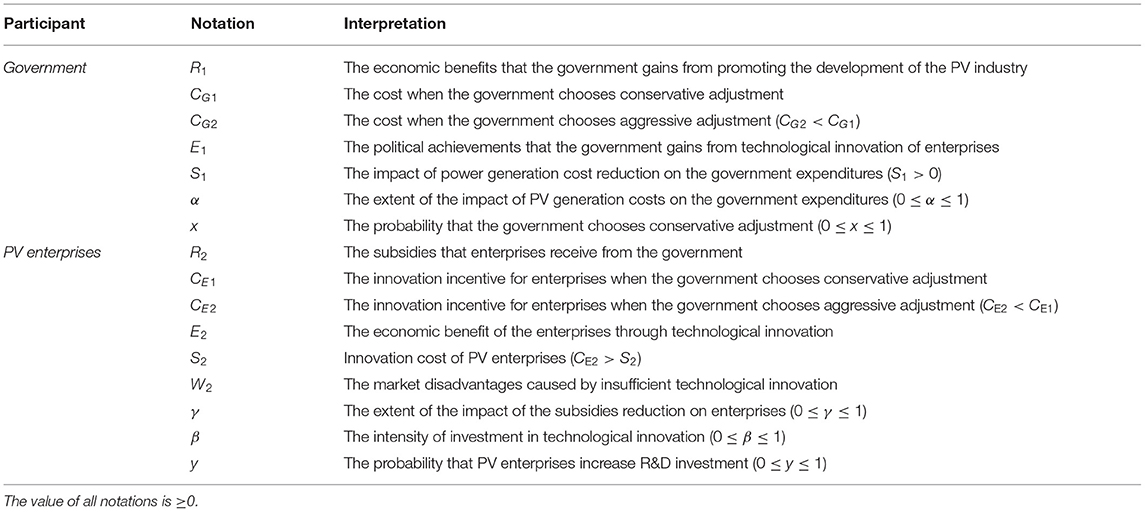
Table 2. Notations and interpretations.
Therefore, the benefits (m1, m2) of conservative and aggressive strategies adopted by the government can be calculated. is the average benefit.
For PV enterprises, the benefits (n1, n2) of increasing and decreasing R&D investment can also be calculated. is the average benefit.
If , the probability that the government chooses a conservative adjustment strategy can bring above-average benefits, and thus the probabilityx = x(t)that the government chooses conservative adjustment will increase over time; on the contrary, if , the probability that the government chooses aggressive adjustment will increase over time. x = x(t) will evolve according to the trend determined by Equation (1).
If , the probability that enterprises increase R&D investment can bring above-average benefits, and the probability of increasing the level of technological innovation will increase with time, and anti y = y(t) will evolve according to the trend determined by Equation (2).
Evolutionary Analysis of the Game Model
Evolutionary Analysis of the Government Strategy
The above analysis illustrates that the probability of the government policy choice will evolve according to the path described by the dynamic differential Equation (1). Next, we will further examine the conditions for the government to achieve different ESSs.
According to F(x) = 0, we have . In the light of the stability principle of dynamic differential equation and the properties of ESS, when andF′(x) < 0, the value of x is ESS.
1. When , will be equal to 0. In addition, x will always be stable, which means the preference of enterprises to increase technological innovation reaches, and the government strategy is stable.
2. When , x* = 0 and x* = 1are stable state of x. Further suppose that if ,so F′(0) < 0, x* = 0 will be ESS, which means the preference of enterprises to increase technological innovation less than y*, the government will choose aggressive adjustment strategy.
3. When ,x* = 0 and x* = 1 are stable state of x. Further suppose that if , so, x* = 1 will be ESS, which means the preference of enterprises to increase technological innovation more than y*, the government will choose conservative adjustment strategy. The replication dynamic phase diagram of the above three cases is shown in Figure 3.
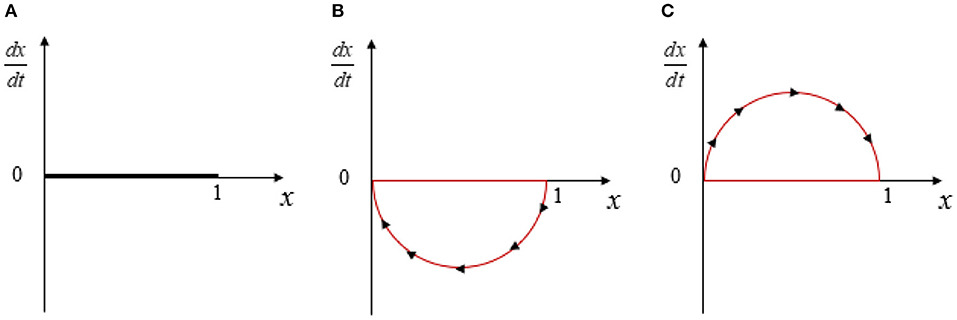
Figure 3. Replication dynamic phase diagram of the government strategy. (A) , (B) , and (C) .
Evolutionary Analysis of PV Enterprise Strategy
Similarly, the evolution path of PV enterprises is described by dynamic differential Equation (2). When G(y) = 0, we have. Whenand G′(x) < 0, the value of y is ESS.
1. When , will be equal to 0,And y will always be stable, which means the preference of the government chooses conservative adjustment strategy reaches x*, the enterprise strategy is stable.
2. When , y* = 0 and y* = 1 are stable state of y. Further suppose that if , so G′(1) < 0, y* = 1 will be ESS, which means the preference of the government chooses conservative adjustment strategy less than x*, the PV enterprise will increase R&D investment.
3. When and ,so G′(0) < 0, y* = 0will be ESS, which means the preference of the government chooses conservative adjustment strategy more than x*, the PV enterprise will decrease R&D investment.
Figure 4 is the replication dynamic phase diagram of PV enterprise strategy.
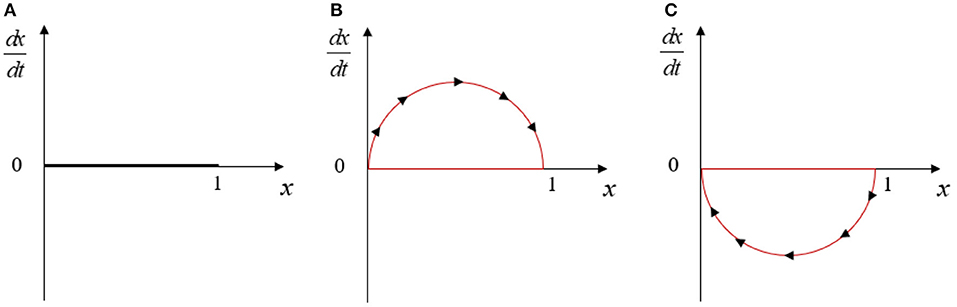
Figure 4. Replication dynamic phase diagram of enterprise strategy. (A) , (B) , and (C) .
Evolutionary Analysis of System Stability
When the system is in a stable state, the proportion of the government and the enterprise to choose their own strategies remain unchanged, and their stable values are. x* y*. The five possible equilibrium points in the system are. (x,y):(0,0),(0,1),(1,0),(1,1), Different from the analysis from the perspective of a single participant, the ESS of the system may have different results. The evolutionary strategy analysis of a single participant is based on the initial preference of another participant, while the ESS of the whole system considers the interaction between the government and enterprises. By analyzing the local stability of the Jacobian matrix of the equilibrium point (x, y), the stability of the system at the equilibrium point can be judged. The Jacobian matrix of the system is:
According to Lyapunov's first method, if a point is ESS, then this point corresponds to the optimal strategy of each participant under certain initial conditions. The local stability of five equilibrium points can be judged by analyzing the Jacobian matrix, as shown in Table 3.
(1) (1,0)
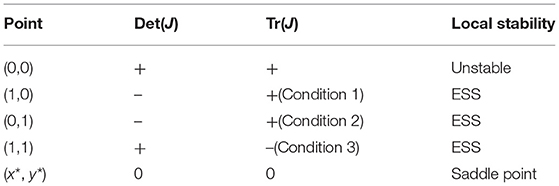
Table 3. Local stability of five points.
According to the assumptions, we can obtain (−1)[αS1−CG1+CG2] < 0 and W2+(β − 1)S2+CE1 > 0, so Det(J) < 0. If (Condition 1), then we can obtain Tr(J) > 0 and point (1,0) is an ESS.
(2) (0,1)
According to the assumptions, we can obtain (1−α)(S1+E1)−CG1+CG2 > 0 and (−1)[γW2+(β−1)S2+CE2] < 0, so Det(J) < 0. If (Condition 2), then we have Tr(J) > 0 and point (0,1) is an ESS.
(3) (1,1)
Similarly, we can obtain (−1)[(1 − α)(E1 + S1) − CG1 + CG2 < 0 and (−1)[γW2 + (β − 1)S2 + CE2] < 0, so Det(J) > 0. If (Condition 3), then we have Tr(J) < 0 and point (1,1) is an ESS. Moreover, if the condition W2 − (1 − β)S2 + CG2 − CG1 + CE1 > 0 is satisfied, Condition 3 will be satisfied as well. In this case, (1,1) is always an ESS.
In conclusion, the three equilibrium points (0,1), (1,0), (0,1) of the system have local stability under certain conditions, and (x*, y*) is a saddle point. Figure 5 shows the evolution of the system stable strategy.
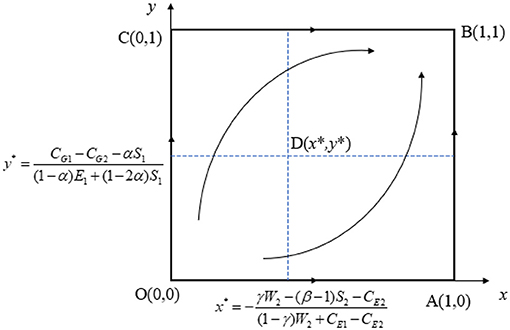
Figure 5. System replication dynamic phase diagram.
The above analysis shows that the equilibrium points (1,0), (0,1) and (1,1) may become the ESS of the system under general circumstances. However, by comparing each condition, it can be seen that Condition 3 is easier to meet, which means that point (1,1) is more likely to become an ESS point. The point (1,1) indicates that the government chooses a conservative adjustment strategy while the enterprise chooses to increase investment in technological innovation. In this case, the government strategy allows companies to have more time to innovate; a conservative adjustment policy also means that the government subsidizes more companies; and therefore companies may invest more in innovation. Although the choice of a conservative adjustment strategy of the government often means more expenditure than an aggressive strategy, the more adequate technological research and development of enterprises also bring relatively more economic benefits and performance benefits to the government, so the system shows a stable situation at point (1,1).
Numerical Analysis
The dynamic evolution process of the game under different initial states is simulated by numerical simulation for further analysis. First of all, it is necessary to discuss the values of parameters in the model. The cost of PV power generation is an important reference for the government to adjust the subsidy standard, so the impact of the decline of power generation cost on government expenditure (S1, α) should be greater. The technological innovation of enterprises mainly improves the profit of enterprises (so E2 is comparatively larger) while the government may get less benefit from the improvement of technological level (E1 is comparatively smaller). When the government chooses aggressive adjustment, it will have a greater impact on enterprises, resulting in more unexpected losses, so γaggressive > γconservative. In addition, the R&D investment of enterprises is often small, assuming that the innovation incentive of the government to the enterprises is greater than the cost of technological innovation, so CE2 > S2. The PV industry has relatively higher technical requirements, and the technological level of an enterprise largely determines the income of PV projects. The market disadvantage caused by the insufficient innovation makes the relative loss of the enterprise greater, so the impact of W2 cannot be ignored. Based on the above analysis and using numerical simulation, it is possible to more intuitively analyze the evolution trajectory of the strategies of the two participants in the game model under different assumptions.
The horizontal axis represents the evolution time t, the simulation period is set as 2 or 3, and the time step is set as 0.01 to reflect the evolution trajectory of the system more accurately. The vertical axis indicates the probability that the government chooses conservative adjustment strategy or the enterprise increases the investment of technological innovation, and the range is [0,1]. The values of parameters are strictly limited in the range of constraints. Assuming that S1 = 5, S2 = 1, E1 = 0.5, E2 = 2, CG1 = 10,CG2 = 6, CE2 = 2, CE1 = 4, α = 0.7, β = 0.5, γ = 0.5, W2 = 5, and initial preferences are x = 0.8, y = 0.2, and x = y = 0.5, then the evolution path obtained for the two participants is shown in Figure 6.
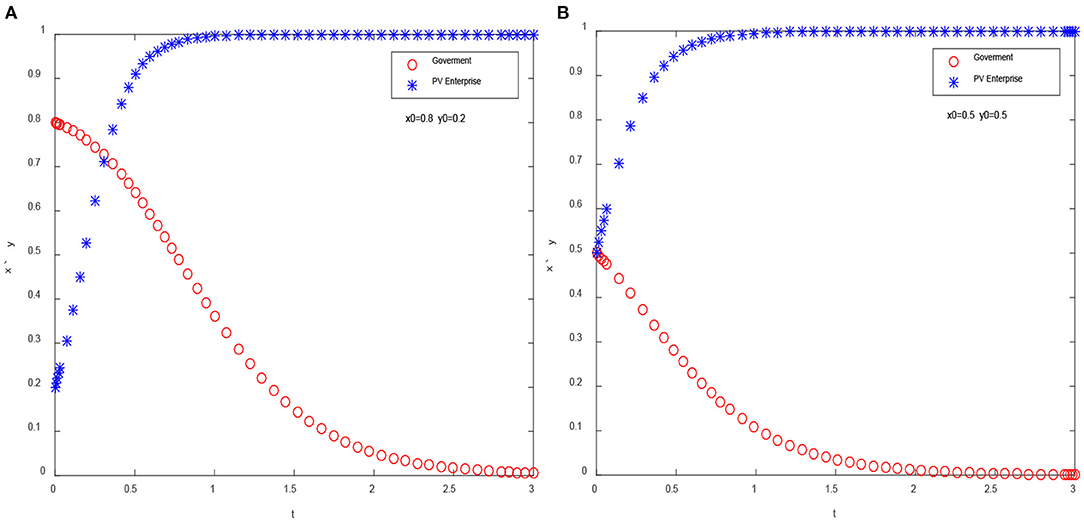
Figure 6. Evolution path of dual participant system. (A) Initial state: x = 0.8, y = 0.2 and (B) Initial state: x = 0.5, y = 0.5.
It can be obtained that under the assumption of the above parameters, the final stable strategy of the system is (0,1), which means that the government chooses an aggressive adjustment strategy while the enterprise chooses to increase R&D investment. When analyzing the ESS of the system, we have discussed the conditions of this situation. In fact, the purpose of an aggressive adjustment is to promote enterprises to accelerate R&D while reducing the burden of government subsidies. If the innovation level of enterprises cannot be effectively improved, and the government subsidies decline rapidly, the operation of enterprises will face serious difficulties. Therefore, the optimal strategy for enterprises is to increase the investment in innovation.
Evolution Analysis of the Strategy of a Single Participant
The initial value of the preference of a single participant is fixed, and the probability of the evolution of the preference of the other participant is investigated. Based on the above parameter assumption, Figures 7A,B show the evolution trajectory of x when y = 0.1 and y = 0.9, respectively; Figures 7C,D show the evolution trajectory of y when x = 0.1 and x = 0.9, respectively.
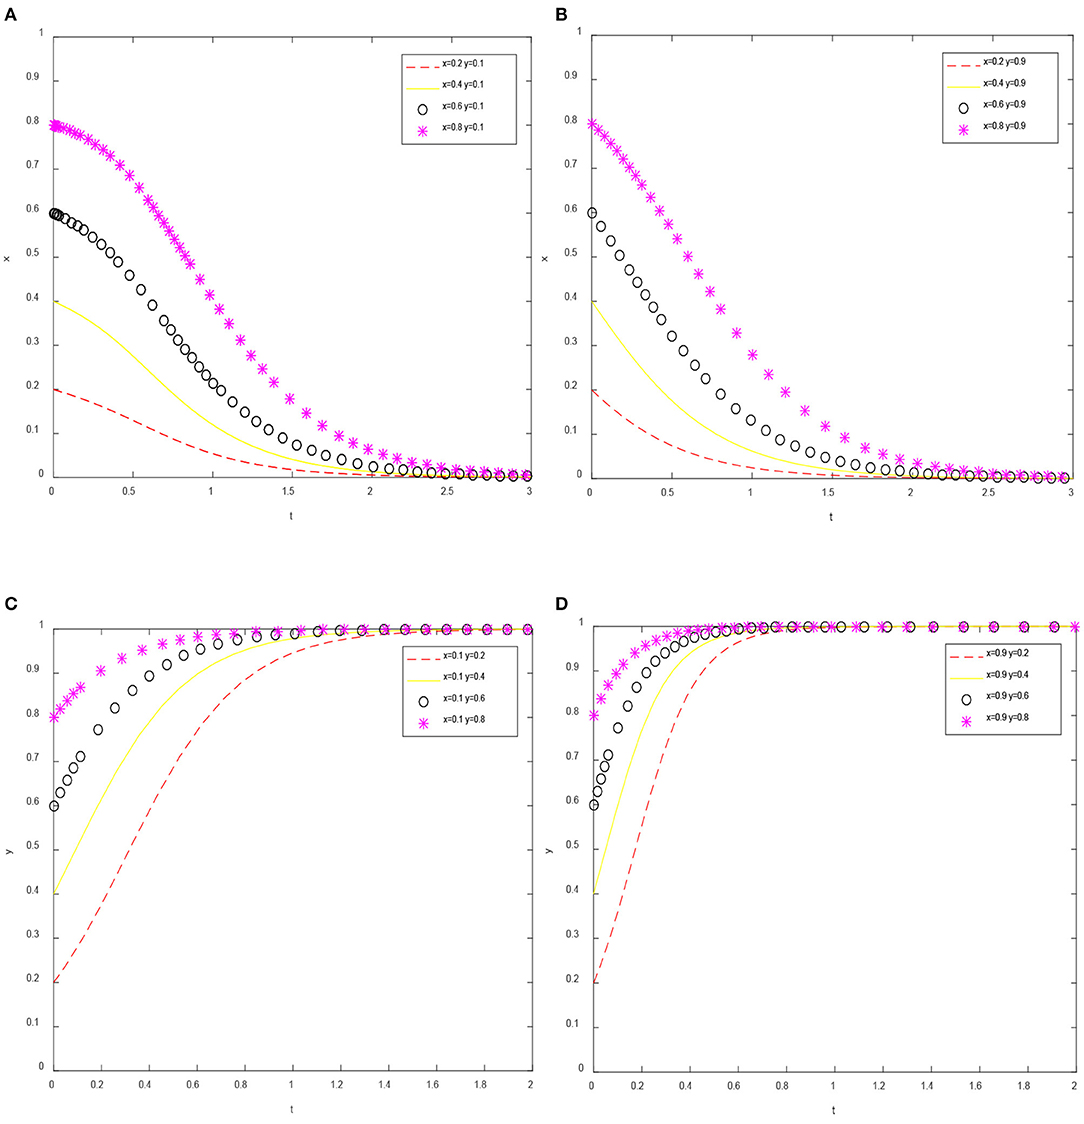
Figure 7. Evolution path of the strategy of a single participant. (A) y = 0.1, (B) y = 0.9, (C) x = 0.1, and (D) x = 0.9.
Figure 7 shows that the initial preference of the participants cannot change the ESS, but only change the speed of reaching it. For instance, when x0 = 0.1, y reaches a stable state (y = 1) approximately at t = 1.6. But when x0 = 0.9, y reaches ESS (y = 1) approximately at t = 1.8. It is worth noting that when analyzing the ESS of government strategy (see “Evolutionary analysis of the government strategy” section), we have proved that when and , y* = 1 will be the ESS of government strategy. But if , we can obtain y* = 1, ∀x ∈ [0, 1]. Therefore, there will be a situation that the initial preference (x0, y0) will not change the final ESS of the two game participants. The ESS of the system is mainly affected by the interaction between the two participants. It also shows that it is necessary to study the influence of the degree parameters (α, γ) of the interaction between the government and enterprises on the ESS.
The Influence of α and γ on ESS
In the evolutionary game model, α represents the extent of the impact of PV generation costs on government expenditures and γ represents the extent of the impact of subsidies reduction on enterprise. α and γ are the main parameters to measure the degree of interaction between the government and enterprises, so we examine the impact on the ESS. Assuming that α = 0.02, γ = 0.02; α = 0.1, γ = 0.1; α = 0.3, γ = 0.3; α = 0.6, γ = 0.6, respectively, then we can obtain the evolution path of the system (as shown in Figure 8).
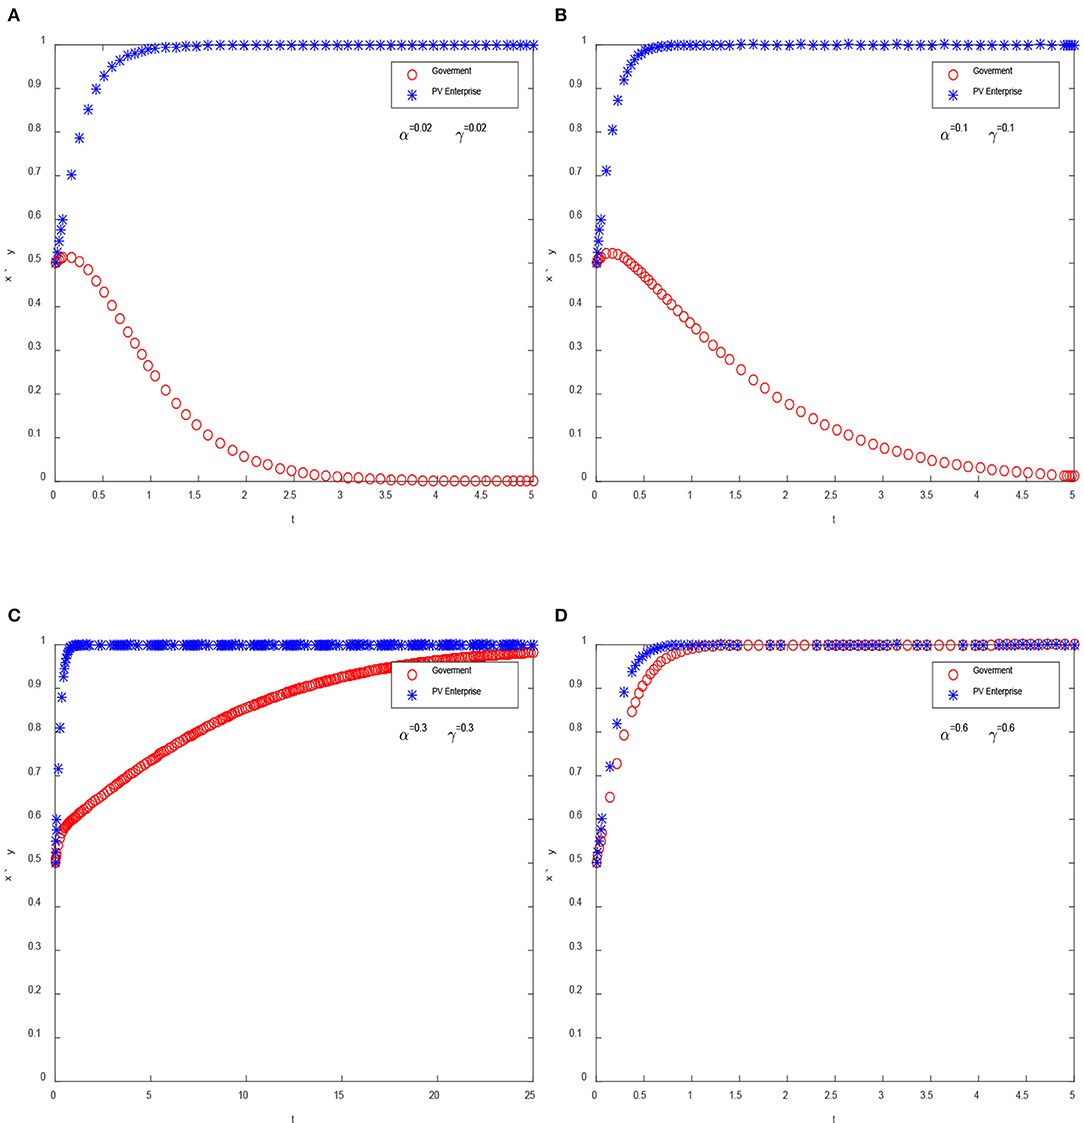
Figure 8. The influence of α and γ on ESS. (A) α = 0.02, γ = 0.02, (B) α = 0.1, γ = 0.1, (C) α = 0.3, γ = 0.3, and (D) α = 0.6, γ = 0.6.
From the above analysis, it can be concluded that the degree of influence between the enterprise and the government determines the final ESS of the system. When the influence degree is small (as shown in Figures 8A,B), the ESS of the system is (0,1). In addition, the speed of the government strategy to reach a stable state (aggressive strategy) decreases with the increase of α and γ, which means that the greater the influence between the government and enterprises, the slower the government strategy to reach a stable state. Otherwise, when the impact is large enough, the ESS of the system becomes (1,1) (as shown in Figures 8C,D). During this period, the government will choose the conservative adjustment strategy, and the enterprises will increase the investment in technological innovation. In fact, the ESS of (1,1) may be optimal for the government and enterprises. For the government, the conservative adjustment strategy makes the government spend more on subsidies and is more likely to cause overcapacity, but it may be more beneficial to the technological innovation of enterprises. The aggressive adjustment strategy has a serious impact on enterprises, which can be proved by the implementation of 531 policy. From the perspective of enterprises, the conservative adjustment strategy enables enterprises to have more time and funds for technological R&D, and the application scope of PV industry technology innovation will also be wider. All of these will promote the healthy development of PV enterprises and industries.
Conclusions
The development of the PV industry is often strongly supported by the government, and the Chinese government has formulated many subsidy policies to promote the development of the PV industry. However, with the development of the PV industry, the government subsidies are bound to continue to decline. The subsidy standard of Chinese FIT policy for PV power generation has been adjusted once a year. Therefore, the impact of the government subsidy adjustment on enterprises has become an important issue. By constructing an evolutionary game model between the government and PV enterprises, this article studies the relationship between the government subsidy adjustment and the R&D investment of PV enterprises, aiming to provide more suggestions for the government to adjust the subsidy standard reasonably.
The analysis of the ESS shows that (0,1), (1,0), and (1,1) could become the final ESS of the system, which is further proved by the simulation analysis. The initial preference of the government and enterprises (x0, y0) cannot change the ESS, but only change the speed of reaching it. Most importantly, this article focuses on the impact of the degree of interaction between the enterprises and the government (mainly expressed by α and γ) on the final ESS. Results show that when the influence degree is small, the ESS of the system is (0,1). But if the influence degree is large enough, the ESS of the system will become (1,1), which means that the government will choose a conservative adjustment strategy and the enterprises will increase R&D investment.
In China, the degree of interaction between government and enterprises is usually large, but it needs to be further confirmed by empirical research. The adjustment policies of the Chinese government will indeed have an important impact on the operation of PV enterprises and the development of the PV industry, which can be verified from the results of previous policy adjustments made by China. Under the influence of various factors, the choice of conservative adjustment strategy of the government and enterprises to increasing R&D investment is more likely to become the ESS of the game, which can also be considered as the optimal result. From the perspective of promoting the improvement of technology, the conservative adjustment policy enables enterprises to have more funds and time to R&D and fully reduce the PV power generation cost, while the reduction of cost makes it possible for the government to further reduce the subsidy standard. However, the government should carefully adjust the subsidy standard, and the value of h should not be too high relative to the value of g, otherwise, it may not be conducive to enterprises to improve the level of technological innovation. Based on the comprehensive consideration of technological progress and subsidy expenditure, the Chinese government needs to further improve the subsidy retrogression mechanism. The government and PV enterprises should also strengthen cooperation in the field of technological innovation, including promoting cooperation among enterprises, universities, and R&D institutions, so as to further improve the level of technological innovation.
However, there are still many issues that need to be studied. In this article, 150% × g (g is the annual average reduction rate of generation cost per kWh) is regarded as the dividing line between the conservative and aggressive adjustments. This is because the decline of the power generation cost is the main basis for the government to formulate policies. However, the specific value of δ needs to be further determined through empirical research. In addition, as the focus of this article, the specific values of α and γ should also be estimated through the actual data. Only after understanding the degree of influence between the government policies and R&D of PV enterprises, we can provide more valuable references for the government policy adjustments.
Data Availability Statement
Publicly available datasets were analyzed in this study. This data can be found at: https://www.ndrc.gov.cn/fgsj/.
Author Contributions
YF: formal analysis, writing—review and editing, and funding acquisition. CH: formal analysis, investigation, methodology, writing—review and editing, and software. DY: formal analysis, funding acquisition, and investigation. All authors contributed to the article and approved the submitted version.
Funding
This work was partially supported by Natural Science Foundation of Hunan Province (2020JJ5111), Project of Hunan Social Science Achievement Appraisal Committee (XSP20YBZ081), Young Teacher Innovation Drive Project of Hunan University Technology and Business (19QD04), and the Project of Humanities and Social Sciences (17YJC790035), an initiative of the Ministry of Education of the People's Republic of China.
Conflict of Interest
The authors declare that the research was conducted in the absence of any commercial or financial relationships that could be construed as a potential conflict of interest.
References
Antonelli, M., and Desideri, U. (2014a). Do feed-in tariffs drive PV cost or viceversa? Appl. Energy 135, 721–729. doi: 10.1016/j.apenergy.2014.06.059
Antonelli, M., and Desideri, U. (2014b). The doping effect of Italian feed-in tariffs on the PV market. Energy Policy 67, 583–594. doi: 10.1016/j.enpol.2013.12.025
Böhringer, C., Cuntz, A., Harhoff, D., and Asane-Otoo, E. (2017). The impact of the German feed-in tariff scheme on innovation: evidence based on patent filings in renewable energy technologies. Energy Econ. 67, 545–553. doi: 10.1016/j.eneco.2017.09.001
Chen, Y. H., Nie, P. Y., and Yang, Y. C. (2017). Energy management contract with subsidy. J. Renew. Sustain. Energy 9:055903. doi: 10.1063/1.5004549
Chen, Z. Y., Huang, Z. H., and Nie, P. Y. (2018). Industrial characteristics and consumption efficiency from a nexus perspective – based on Anhui's Empirical Statistics. Energy Policy 115, 281–290. doi: 10.1016/j.enpol.2018.01.031
Couture, T., and Gagnon, Y. (2010). An analysis of feed-in tariff remuneration models: Implications for renewable energy investment. Energy Policy 38, 955–965. doi: 10.1016/j.enpol.2009.10.047
Dong, C., Zhou, R., and Li, J. (2021). Rushing for subsidies: the impact of feed-in tariffs on solar photovoltaic capacity development in China. Appl. Energy 281:116007. doi: 10.1016/j.apenergy.2020.116007
Du, Y., and Takeuchi, K. (2020). Does a small difference make a difference? Impact of feed-in tariff on renewable power generation in China. Energy Econ. 87:104710. doi: 10.1016/j.eneco.2020.104710
Hitaj, C., and Löschel, A. (2019). The impact of a feed-in tariff on wind power development in Germany. Resour. Energy Econ. 57, 18–35. doi: 10.1016/j.reseneeco.2018.12.001
Kim, K.-K., and Lee, C.-G. (2012). Evaluation and optimization of feed-in tariffs. Energy Policy 49, 192–203. doi: 10.1016/j.enpol.2012.05.070
Ling-zhi, R., Xin-gang, Z., Yu-zhuo, Z., and Yan-bin, L. (2018). The economic performance of concentrated solar power industry in China. J. Clean. Product. 205, 799–813. doi: 10.1016/j.jclepro.2018.09.110
Lo, K. (2014). A critical review of China's rapidly developing renewable energy and energy efficiency policies. Renew. Sustain. Energy Rev. 29, 508–516. doi: 10.1016/j.rser.2013.09.006
MF (2013). Notice on Issues in the Exemption of the Government Funds and Surcharges for Self-Use of DPV (Beijing).
Ming, Z., Ximei, L., Na, L., and Song, X. (2013). Overall review of renewable energy tariff policy in China: evolution, implementation, problems and countermeasures. Renew. Sustain. Energy Rev. 25, 260–271. doi: 10.1016/j.rser.2013.04.026
NDRC (2013b). Notice on Promoting the Healthy Development of Photovoltaic Industry by Playing the Role of Price Leverage (Beijing).
NDRC (2017). National Carbon Emissions Trading Market Development Plan (Power Generation Industry) (Beijing), 1–7.
NDRC (2019). Notice on Work Related to Wind Power and Photovoltaic Power Generation Connected to Grid without Subsidy [WWW Document] (Beijing).
Requate, T. (2014). Green tradable certificates versus feed-in tariffs in the promotion of renewable energy shares. Environ. Econ. Policy Stud. 17, 211–239. doi: 10.1007/s10018-014-0096-8
Selinger-Lutz, O., Groß, A., Wille-Haussmann, B., and Wittwer, C. (2020). Dynamic feed-in tariffs with reduced complexity and their impact on the optimal operation of a combined heat and power plant. Int. J. Electr. Power Energy Syst. 118:1–9. doi: 10.1016/j.ijepes.2019.105770
Smith, M. G., and Urpelainen, J. (2014). The effect of feed-in tariffs on renewable electricity generation: an instrumental variables approach. Environ. Resour. Econ. 57, 367–392. doi: 10.1007/s10640-013-9684-5
Sun, P., and Nie, P.-Y. (2015). A comparative study of feed-in tariff and renewable portfolio standard policy in renewable energy industry. Renew. Energy 74, 255–262. doi: 10.1016/j.renene.2014.08.027
Wei, W., Zhao, Y., Wang, J., and Song, M. (2019). The environmental benefits and economic impacts of Fit-in-Tariff in China. Renewable Energy 133, 401–410. doi: 10.1016/j.renene.2018.10.064
Xu, T., and Ma, J. (2021). Feed-in tariff or tax-rebate regulation? Dynamic decision model for the solar photovoltaic supply chain. Appl. Math. Modell. 89, 1106–1123. doi: 10.1016/j.apm.2020.08.007
Yang, C., and Ge, Z. (2018). Dynamic feed-in tariff pricing model of distributed photovoltaic generation in China. Energy Proced. 152, 27–32. doi: 10.1016/j.egypro.2018.09.054
Yang, D., Jiang, M., Chen, Z., and Nie, P. (2019). Analysis on one-off subsidy for renewable energy projects based on time value of money. J. Renew. Sustain. Energy 11:025901. doi: 10.1063/1.5050059
Yang, D.-X., Chen, Z.-Y., and Nie, P.-Y. (2016). Output subsidy of renewable energy power industry under asymmetric information. Energy 117, 291–299. doi: 10.1016/j.energy.2016.10.089
Yang, D.-X., Qiu, L.-S., Yan, J.-J., Chen, Z.-Y., and Jiang, M. (2019). The government regulation and market behavior of the new energy automotive industry. J. Clean. Product. 210, 1281–1288. doi: 10.1016/j.jclepro.2018.11.124
Yang, D. X., and Nie, P. Y. (2016). Influence of optimal government subsidies for renewable energy enterprises. IET Renew. Power Generat. 10, 1413–1421. doi: 10.1049/iet-rpg.2015.0307
Zhang, R., Shimada, K., Ni, M., Shen, G. Q. P., and Wong, J. K. W. (2020). Low or No subsidy? Proposing a regional power grid based wind power feed-in tariff benchmark price mechanism in China. Energy Policy 146:111758. doi: 10.1016/j.enpol.2020.111758
Zhang, S., and He, Y. (2013). Analysis on the development and policy of solar PV power in China. Renew. Sustain. Energy Rev. 21, 393–401. doi: 10.1016/j.rser.2013.01.002
Keywords: dynamic adjustment, evolutionary game, PV power generation, R&D, fit-in tariff
Citation: Fu Y, Hu C and Yang D (2021) Conservative or Aggressive? The Dynamic Adjustment of the Feed-in Tariff Policy for Photovoltaic Power Generation in China. Front. Energy Res. 9:672920. doi: 10.3389/fenrg.2021.672920
Received: 26 February 2021; Accepted: 19 March 2021;
Published: 16 April 2021.
Edited by:
Chan Wang, Guangdong University of Finance and Economics, ChinaReviewed by:
Kun Wang, University College London, United KingdomZhang Haifeng, Guangxi Normal University, China
Copyright © 2021 Fu, Hu and Yang. This is an open-access article distributed under the terms of the Creative Commons Attribution License (CC BY). The use, distribution or reproduction in other forums is permitted, provided the original author(s) and the copyright owner(s) are credited and that the original publication in this journal is cited, in accordance with accepted academic practice. No use, distribution or reproduction is permitted which does not comply with these terms.
*Correspondence: Dong-xiao Yang, ydx622@hutb.edu.cn