Short-Term Power Load Forecasting Under COVID-19 Based on Graph Representation Learning With Heterogeneous Features
 Zhuowei Yu1
  Jiajun Yang
- 1The Affiliated High School of South China Normal University, Guangzhou, China
- 2School of Electric Power Engineering South China University of Technology, Guangzhou, China
- 3Guangdong Provincial Key Laboratory of Intelligent Measurement and Advanced Metering of Power Grid, Guangzhou, China
Since 2020, the COVID-19 has spread globally at an extremely rapid rate. The epidemic, vaccination, and quarantine policies have profoundly changed economic development and human activities worldwide. As many countries start to resume economic activities aiming at a “living with COVID” new normal, a short-term load forecasting technique incorporating the epidemic’s effects is of great significance to both power system operation and a smooth transition. In this context, this paper proposes a novel short-term load forecasting method under COVID-19 based on graph representation learning with heterogeneous features. Unlike existing methods that fit power load data to time series, this study encodes heterogeneous features relevant to electricity consumption and epidemic status into a load graph so that not only the features at each time moment but also the inherent correlations between the features can be exploited; Then, a residual graph convolutional network (ResGCN) is constructed to fit the non-linear mappings from load graph to future loads. Besides, a graph concatenation method for parallel training is introduced to improve the learning efficiency. Using practical data in Houston, the annual, monthly, and daily effects of the crisis on power load are analyzed, which uncovers the strong correlation between the pandemic and the changes in regional electricity utilization. Moreover, the forecasting performance of the load graph-based ResGCN is validated by comparing with other representative methods. Its performance on MAPE and RMSE increased by 1.3264 and 15.03%, respectively. Codes related to all the simulations are available on https://github.com/YoungY6/ResGCN-for-Short-term-power-load-forecasting-under-COVID-19.
1 Introduction
1.1 Background
The construction and operation of the electric power industry are of great importance to society. On the one hand, the power supply is indispensable to various industries. As reported by the Bureau of Energy Statistics, China’s total electricity consumption reached 71,508.20 billion kWh in 2020, increasing by 8.49% compared with 2019. The growth trend will continue with the development of China’s economy. On the other hand, electricity utilization is emission-free, making replacing fossil energy sources with electric energy an essential means to achieve the carbon neutrality pledge (Liu, 2015).
Short-term load forecasting for the future 24 h is one of the most critical techniques to ensure system stability, reliability, and economic efficiency. It affects power system operation in many aspects, including generation dispatch, power flow optimization (Chen et al.,; Meng et al., 2016), and energy bidding in the electricity market. Significant variabilities and uncertainties have been introduced by the diverse end-users and the ever-increasing shares of renewables (Li and Lu, 2020). As a result, accurate short-term load forecasting is a hard task in modern power systems.
Unfortunately, the outbreak of COVID-19 since early 2020 has posed extraordinary challenges on short-term load forecasting. As shown in Figure 1A, the virus has spread globally and in Figures 1B,C the cumulative number of confirmed diagnoses is increasing and in a rapid growth trend, with over two billion cumulative confirmed cases until August 25, 2021. It has been reported by (Ruan et al., 2020; Ruan et al., 2021) that the crisis has profoundly affected electricity unitization attributed to changes in people’s living habits and industrial production activities. Such effects vary spatially due to the differences in infection speed, vaccination coverage, and quarantine policies, resulting in additional variabilities and uncertainties in electricity consumption as (Figure 2).
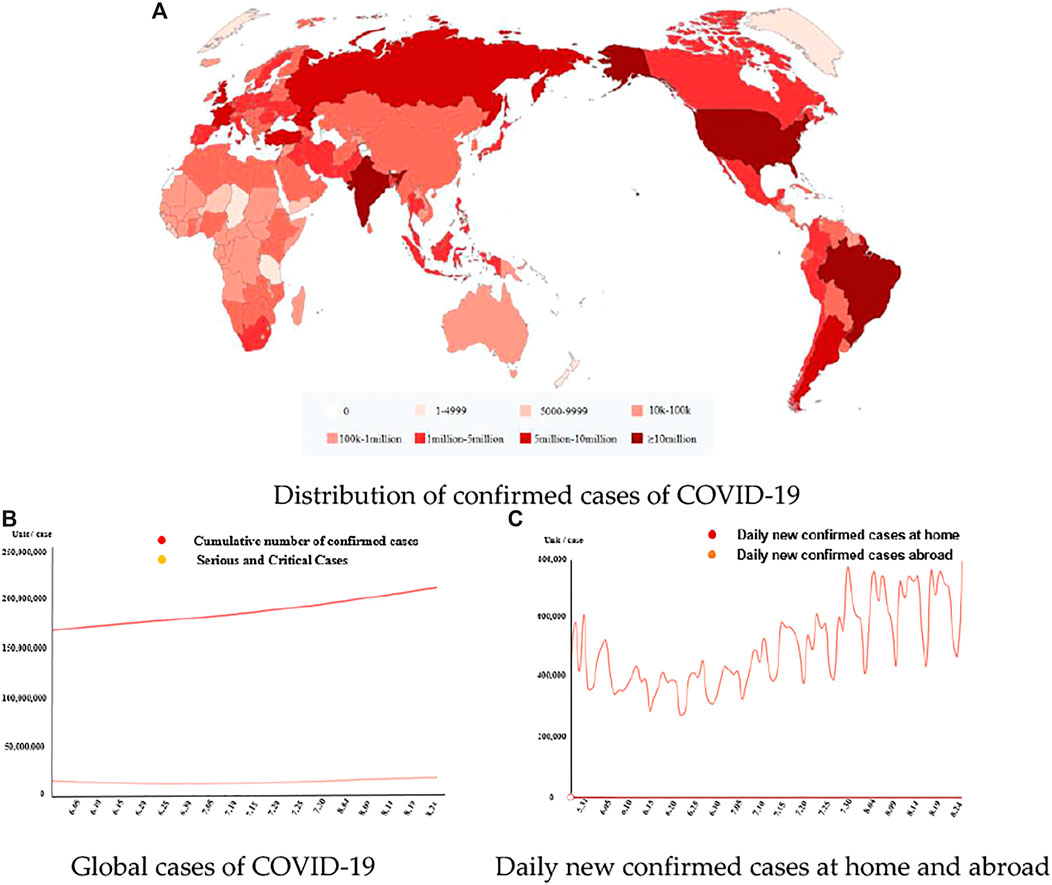
FIGURE 1. COVID-19 situation worldwide and in China (updated August 25, 2021). (A) Distribution of confirmed cases of COVID-19; (B) Global cases of COVID-19; (C) Daily new confirmed cases at home and abroad.
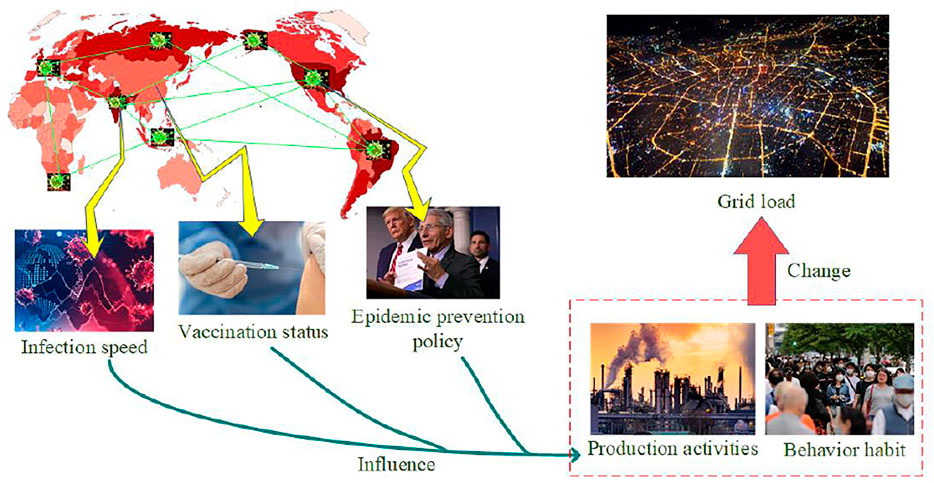
FIGURE 2. Schematic diagram of the impact of COVID-19 pandemic on power grid load.
However, the infection has seen fast growth in the past 3 months. According to the World Health Organization (WHO, 2020) and the most recent research (Huang et al., 2020), the fight against COVID-19 is far from over, and its effects will last. Instead of sticking to strict quarantine policies or aiming at a sustained zero infection level, many countries start to resume economic activities and incorporate disease prevention and control into the day-to-day operation of society. In this context, a short-term load forecasting technique incorporating the effects of COVID-19 is of great significance to both power system operation and economic development, facilitating a smooth transition to a “living with COVID” new normal.
1.2 Literature Review
The effects of the pandemic on domestic and international regional electricity consumption are highly uncertain, which vary with infection speed and quarantine policies. Some published reports have preliminarily drawn qualitative conclusions: “electricity consumption decreases during the pandemic, but the grid remains reliable” (Bui and Wolfers, 2020; Cicala, 2020). However, the epidemic’s effects are multifaced and cannot be summarized simply by load reduction (Agdas and Barooah, 2020; Werth et al., 2020). Although (Ruan et al., 2020) has shown significant deviations between the simulated forecasts and the actual loads if the crisis’ effects are omitted, explicitly describing the complex effects and incorporating them into load forecasting are still open questions.
The existing short-term load forecasting can be classified into traditional statistical methods and machine learning-based forecasting algorithms. The traditional statistical methods are simple and computationally efficient, such as multiple linear regression algorithm (Amral et al., 2007), sliding average forecasting algorithm (MAF), differential integrated autoregressive integrated moving average model, (ARIMA) (Gupta and Kumar, 2020), and exponential smoothing (ES) (Rendon-Sanchez and De Menezes, 2019). Although they have achieved desired performance in simple tasks under normal and stable conditions, their robustness declines dramatically when they are applied to power load forecasting, which involves non-linear and highly uncertain operation constraints (Kharin, 2013); By contrast, the machine learning-based forecasting algorithms are tasked to learning the non-linear mapping from exogenous information to the power load using historical data. For example, (Li et al., 2020) uses a fuzzy clustering approach to classify regional users and then builds respective random forest-based forecasting models for each class; Besides, (Li et al., 2021) and (Wang et al., 2020) make short-term load forecasts for heating load and electrical load, respectively, based on long short-term memory network (LSTM). However, the above three methods adopt equal weights for all the input features, which are correlated and exert different influences on power load. As a result, the equal-weight treatment cannot enable the model to learn efficiently. Therefore, (Zhu et al., 2021) introduces the attention mechanism into the LSTM to enable deep learning of correlated input features, which improves prediction accuracy. Although LSTM outperforms other methods in mining the intrinsic information of the time-series data, it cannot deal with multi-source information, making it less preferable for power load forecasting. Current research has shown that the fusion of multiple data can play an important role in artificial intelligence networks, (Zhang et al., 2021) has proved that with the coordinated control of electrolysis current, temperature, and charging/discharging of BES for H2 production, the electrolysis current fluctuation cost is largely reduced and the electrolysis efficiency can be improved. Therefore, considering multiple factors in load forecasting can improve accuracy.
As a graph representation learning method, graph convolution network (GCN) can dig deeper into the intrinsic relationship of heterogeneous data by defining Fourier transform and convolution on the graph. As pioneering attempts, (Han et al., 2021) has built a GCN to forecast nitride emissions from coal-fired power plants, while (Wang and He, 2021) has built a graph attention network (GAT) for fault location in distribution networks. Their results demonstrate that GCN is a promising tool with powerful learning ability and generalization capability.
1.3 Contributions
Based on the research gap in short-term load forecasting and the recent progress in GCN, this paper encodes heterogeneous features related to electricity consumption and status of COVID-19 into a load graph and build a graph representation learning model to fit the complex mapping between the present load states and the load forecasts for the future.
The contributions in this study can be summarized as follows:
(1) Load graph encoding heterogeneous features. Each node in the graph corresponds to one time moment, while the edge weights are defined to represent temporal correlations between the nodes. The node features are defined with electricity consumption and epidemic status information so that the heterogeneous features can be fused in a graph.
(2) ResGCN with parallel training to learn graph representations and to forecast future loads under COVID-19. By learning residual from the input, ResGCN prevents over-smoothing and fits the mapping from heterogeneous features to the future loads. Besides, a graph concatenation is proposed for parallel training so that the learning efficiency can be improved significantly. Based on this method, precise short-term power load forecasting under COVID-19 is realized, laying the foundation for the stable operation of the power system.
2 Short-Term Load Forecasting Based on ResGCN With Heterogeneous Features
2.1 Load Graph Encoding Heterogeneous Features
2.1.1 Feature Selection to Describe Epidemic Status
The COVID-19 crisis has had a significant impact on people’s living habits and industrial production activities and thus has led to changes in electricity consumption. To incorporate such effects into power load forecasting, it is important to identify the most representative features to describe the epidemic development status.
Herein, the COVID-EMDA + dataset is adopted, denoted as S, which has collected multi-source features from various sources in the United States since the epidemic, including weather temperature, human behavior, cell phone distribution, and so on. These features describe human activities from different aspects, while those showing similar extents of fluctuations as the epidemic develops are assumed to be more representative. Therefore, after data cleaning and normalization, the Pearson correlation coefficients between all the features in the dataset are computed. Then, the representativeness of each feature is assessed by the absolute value of its correlation coefficients with the others, as
where Fi and Fj denote features i and j, respectively.
Finally, the features with higher values of
2.1.2 Graph Representation of Electricity Consumption and Epidemic Status
The historical load reflects people’s electricity consumption habits which can occur similarly in the future so that it is an informative reference in load forecasting. However, in the face of COVID-19, load levels are associated not only with the historical states but also with the epidemic status, as discussed in the last section. The load profiles defined in Euclidean space cannot describe the correlations between the features. By contrast, graph data can be a promising alternative, which is defined in non-Euclidean space consisting of nodes and edges and can encode structural and correlation information(Figure 2).
Thus, this paper proposes to encode the multi-source features within time window Tk as a load graph, so that not only the features are contained at each time moment, but also the inherent correlations between the features can be considered. As shown in Figure 3, the load graph is fully connected and undirected, denoted as
(1) Node feature encoding heterogeneous information.
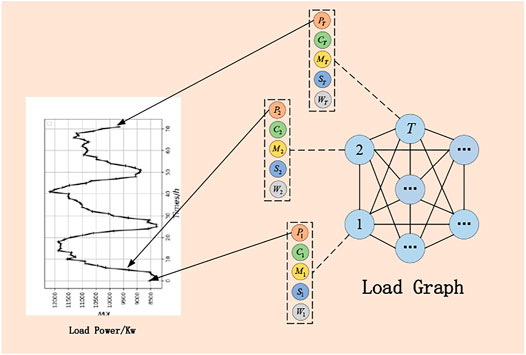
FIGURE 3. Graph representation of power load and epidemic status.
Each node corresponds to a time moment within Tk while the node feature vector encodes heterogeneous information essential to load forecasting. The feature vector of node i, whose transpose is the ith row of input feature matrix
where
(2) Edge weight describing the temporal correlation.
The edge weights are defined to represent the temporal correlations between the node, based on the assumption that features of closer time moments exhibit more inherent correlations. Herein, the Gaussian kernel function is selected to define the edge weight due to its monotonicity and localizability, as
where ti and tj denote time moments of nodes i and j, respectively. ξ is the scale parameter, which is essential to generalization performance. Finally, with training data in [0, TL] and sliding size n, this paper collects a total of
2.2 Load Forecasting Based on ResGCN
2.2.1 Problem Statement
Graph representation learning refers to the technique which extracts desired high-dimension features of a graph so that the representation can be easily used by downstream tasks (Xia et al., 2021). In this paper, the short-term load forecasting problem can be stated as: Given a set of load graphs
Although traditional convolutional neural networks perform well in text processing and image recognition, they can only process data in Euclidean space. To that end, there has been an increasing interest in generalizing convolutions to the graph domain (Jie and Gc, 2020). GCN is one of the most popular methods, which learns node representations by passing and aggregating messages between neighbor nodes while preserving the topological structure. However, an aggregation process with kth GCN layers makes use of information of k-order neighbors. As a result, GCN can over-smooth the representations when more GCN layers are stack. Therefore, inspired by the residual modeling, this paper designed a residual graph convolutional network (ResGCN) (Li et al., 2018).
2.2.2 Framework of ResGCN
As shown in Figure 4, the proposed ResGCN comprises the following components:
(1) Fully connected layer, which transforms the graph-structured representations into a sequence
(2) Residual graph convolutional network (ResGCN) blocks, each of which is tasked to learn an encoder
(3) LSTM layer, which extracts features from the input sequence
(4) Pooling layer with attention, which compresses the outputs by LSTM so that the redundant information can be removed. The pooling operation can be expressed as
where || denotes the concatenation of vectors.
(5) Fully connected layers integrating element-wise activation functions, which map the final graph representations to the forecasts of future 24-h load, as
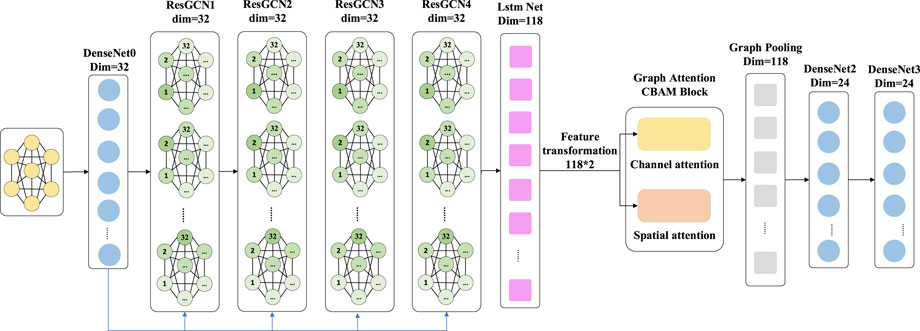
FIGURE 4. Framework of ResGCN for short-term load forecasting.
2.2.3 Construction of one ResGCN Block
Without loss of generality, denote the input of one ResGCN block as
As shown in Figure 5, the operation for
where
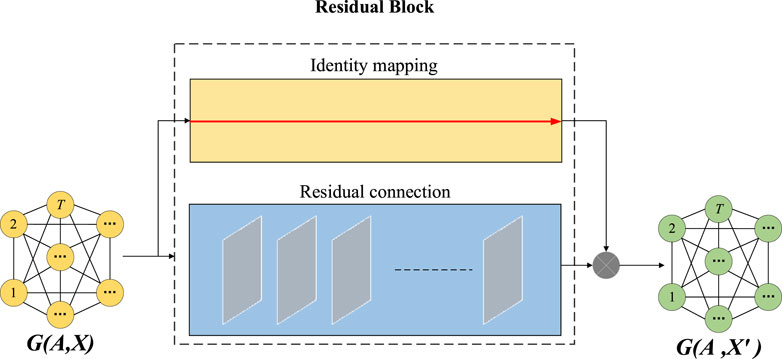
FIGURE 5. Configuration of a ResGCN block.
Herein, this paper make modifications of the traditional GCN to mapping the residual, as
where Θ is the learnable weight matrix while
2.2.4 Construction of one ResGCN Block
The proposed ResGCN based short-term load forecasting is a regression problem so that the loss function is defined by mean square error. Besides, the L2 regularization is adopted to prevent the model from overfitting and to enhance the generalization ability, as
where
With the loss function, ResGCN is trained by Adam, wherein the data are split into small batches that are used to calculate the loss function and update the coefficients. Besides, the EarlyStopping mechanism (Prechelt, 2012) is introduced to halt the training when the loss function stops to decrease for several iterations.
2.2.5 Parallel Training
The load graphs in one batch cannot simply be fed into the model simultaneously, which is not computationally efficient. Therefore, this paper proposes a graph concatenation method for parallel training. Specifically, the adjacency matrix
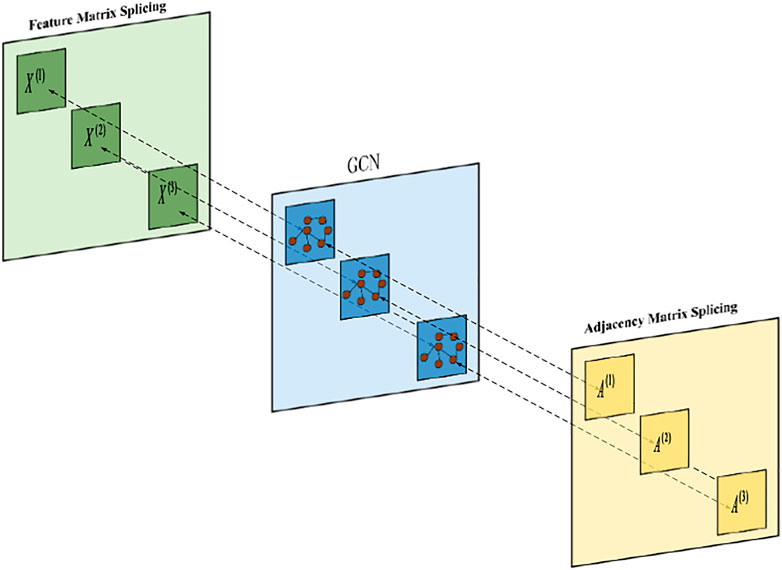
FIGURE 6. Graph concatenation for parallel training.
3 Case Studies
3.1 Implementation and Benchmark
Codes related to all the simulations are available on https://github.com/YoungY6/ResGCN-for-Short-term-power-load-forecasting-under-COVID-19 for the sake of repeatability.
The COVID-EMDA + dataset (Ruan et al., 2020) is adopted to validate the proposed method, which is developed by the group in Tsinghua university led by Prof. Haiwang Zhong, the primary supervisor of this study, in collaboration with other two famous groups in Texas A&M University and Massachusetts Institute of Technology, respectively. It integrates historical load information from major United States power markets such as CAISO, MISO, ISO-NE, and NYISO and other exogenous information such as epidemic status and population flows, which has won wide recognition and been published in Joule. The dataset integrates historical load information from major United States power markets such as CAISO, MISO, ISO-NE, and NYISO and other exogenous information such as epidemic status and population flows.
The distribution of confirmed COVID-19 cases in the United States until January 02, 2021, is shown in Figure 7. It can be observed that, as the most populous city in Texas, Houston has as many as 48,225 confirmed cases, ranking in the second place in the United States Besides, its GDP exceeded $512 billion prior to the outbreak of the pandemic, which was more than those of 37 states in the United States and accounted for 27.8% of that of Texas. Moreover, as the fourth largest city, it has annual electricity consumption of nearly 1.08 billion kWh in 2019. Therefore, the data of ERCOT-Houston from January 23, 2020, to November 23, 2020, were selected from COVID-EMDA + for training and testing since Houston is representative in terms of epidemic development, economic status, and electricity consumption load.
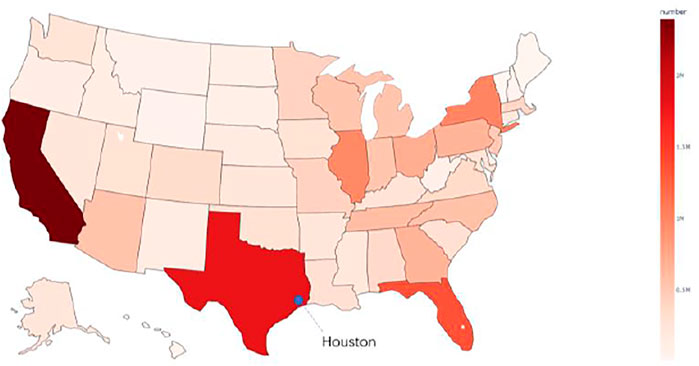
FIGURE 7. Distribution of cumulative confirmed cases in the United States
The data is divided into training set, validation set, and test set in the ratio of 8:1:1. The proposed method is compared with the other five classical algorithms, including traditional temporal prediction algorithms, namely ARIMA, MAF, ES, machine learning-based method, i.e., Random forests (RF), and long short-term memory deep neural networks (LSTM-DNN). The inputs and hyperparameters of the algorithms are shown in Table 1. Besides, two metrics are selected to assess their performance, namely mean absolute percentage error (MAPE) and root mean square error (RMSE), which are calculated as
where
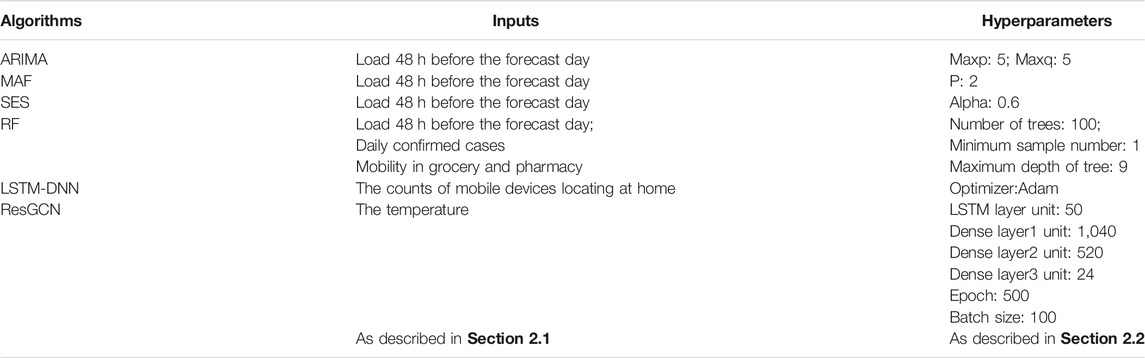
TABLE 1. Inputs and hyperparameters of compared algorithms.
3.2 Validation of ResGCN for Short-Term Load Forecasting
The results on all the test data are shown in Figure 8A while on 1 day are depicted in Figure 8B, which demonstrates that the prediction results of the proposed method are closer to the actual value compared with other algorithms. Besides, it can be observed from Table 2 that the performance of ARIMA, MAF, ES, and RF is not satisfactory for both MAPE and RMSE. Although LSTM-DNN outperforms the above four methods, its performance is still worse than those of the proposed method, with increases of MAPE and RMSE by 1.3264 and 15.03%, respectively. This justifies the superiority of the proposed method over other algorithms in short-term load forecasting.
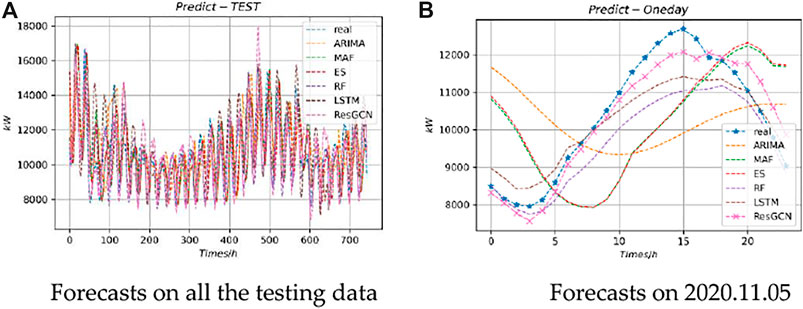
FIGURE 8. Forecasts by different methods. (A) Forecasts on all the testing data; (B) Forecasts on 2020.11.05.

TABLE 2. Performance metrics of different methods.
3.3 Validation of Changes in Electricity Consumption Under COVID-19
To validate our argument that the epidemic largely affects electricity utilization, the differences in power load in 2020 with and without the pandemic are compared. To that end, using historical data during 2017–2019, the load forecasts in 2020 by the well-acknowledged linear regression are assumed as a benchmark for the electricity utilization without the crisis.
Firstly, the differences in annual total electricity consumption and maximum load are analyzed, as shown in Figures 9A, B, respectively. According to the linear regression-based method, the total electricity consumption in 2020 should reach 110.142 million kWh. However, it was only 107.757 million kWh in reality, with a decrease by 2.3851 million kWh. By contrast, the actual maximum load was higher than the forecasts by 1,284 kW. The results by the linear regression are reasonable in the sense that Houston is still in a stage of high growth based on the trend of its load in the previous 2 years. However, there was a significant drop in electricity consumption and maximum load, which was clearly an anomaly likely caused by the changes in industrial production and economic activities under the epidemic.
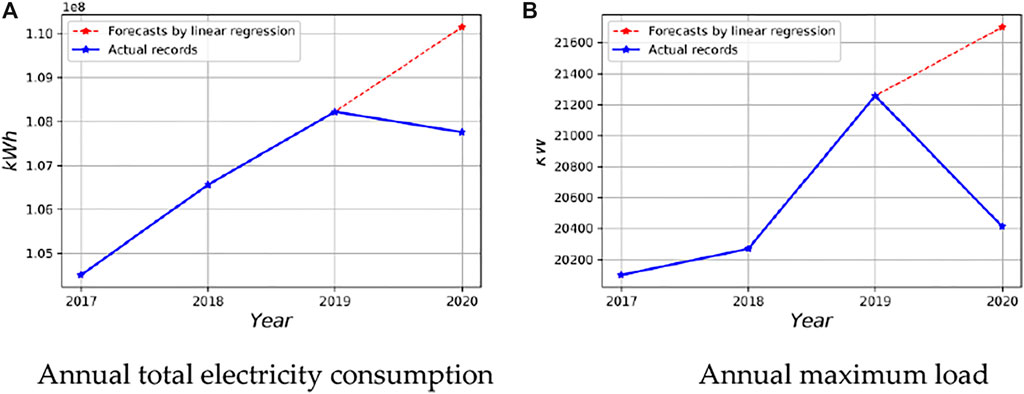
FIGURE 9. Comparison of annual total electricity consumption and maximum load with and without COVID-19. (A) Annual total electricity consumption; (B) Annual maximum load.
Secondly, the differences in daily and monthly total electricity consumption and maximum load are also compared, as shown in Figures 10A, B and Figures 11A, B, respectively. It can be seen that the forecasts by linear regression remain bigger than the actual values from March to October. Turning to the status of the epidemic and people's responses represented, this paper analyze the data of COVID-19 cases, infection rate and fatality rate, changes of working location as well as mobility in public places, which are depicted in Figures 12A-D respectively. It can be observed that there are similar trends involved in epidemic development and load changes: On March 13, 2020, then-President Trump declared a state of emergency in the United States, after which the ratio of the working-from-home population increased while the electricity consumption immediately drops; Besides, the number of confirmed cases started to increase in late March, resulting in less mobility in public places while the load level also kept at a lower level. Thus, it is safe to draw the conclusion that electricity consumption is strongly connected with COVID-19 cases and the level of social activities.
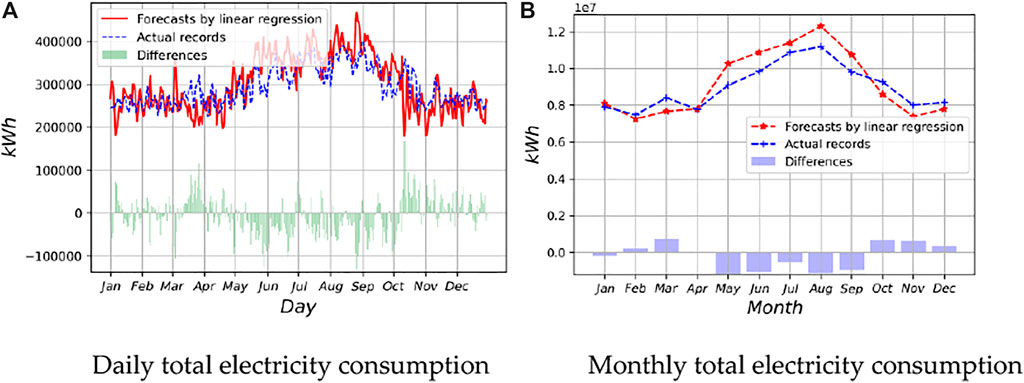
FIGURE 10. Comparison of monthly total electricity consumption and monthly total electricity consumption with and without COVID-19. (A) Daily total electricity consumption; (B) Monthly total electricity consumption.
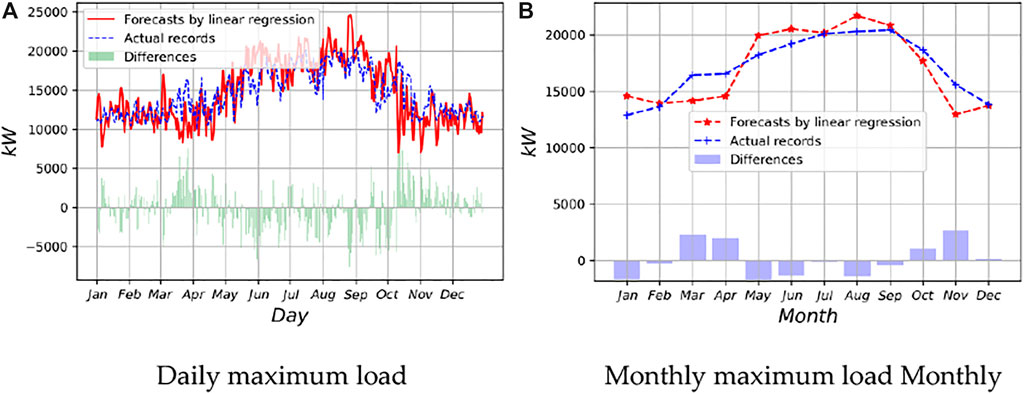
FIGURE 11. Comparison of daily and monthly maximum load with and without COVID-19. (A) Daily maximum load; (B) Monthly maximum load Monthly.
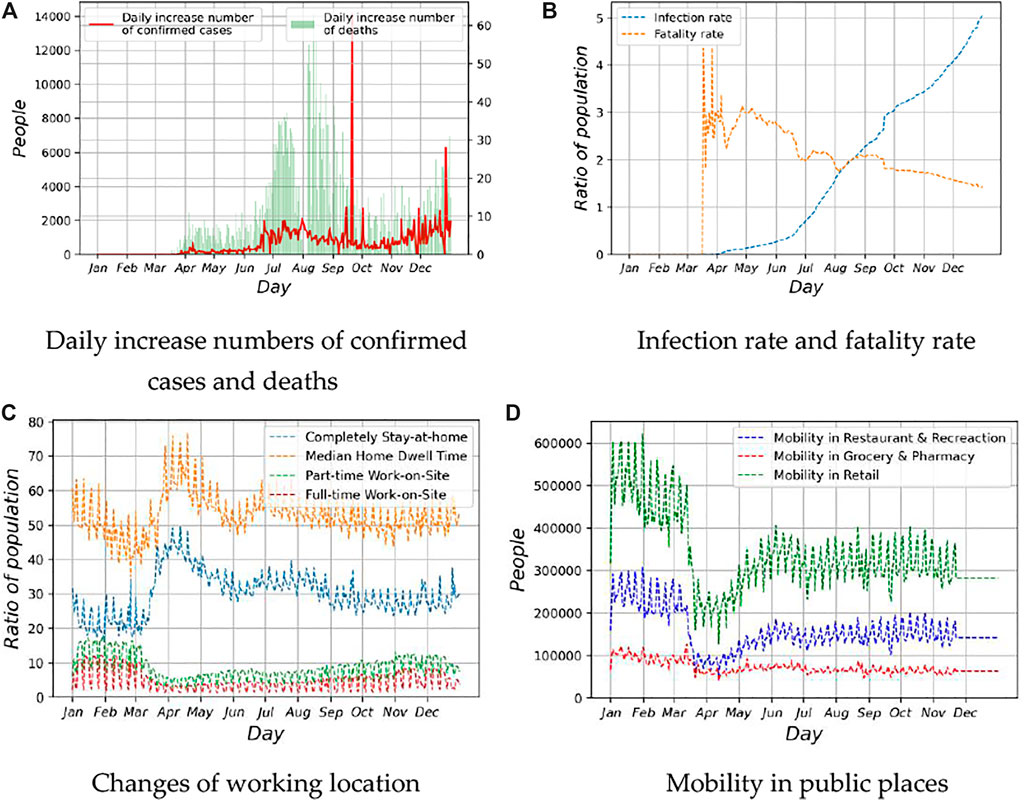
FIGURE 12. COVID-19 Status and people’ response in Houston. (A) Daily increase numbers of confirmed cases and deaths; (B) Infection rate and fatality rate; (C) Changes of working location; (D) Mobility in public places.
3.4 Validation of Load Graph-Based ResGCN in Short-Term Load Forecasting Under COVID-19
With the correlation between COVID-19 and electricity consumption changes in mind, it is apparent that the effects of the pandemic shall be incorporated into short-term load forecasting. To evaluate the proposed load graph encoding heterogeneous features, this paper compared the method to another graph that only encodes load and temperature information, termed naive load graph in the following. Then, the forecasting performance of ResGCN with the two kinds of graphs are analyzed in the scenarios with and without COVID-19.
It can be seen from Table 3 that the ResGCN with naïve load graph achieves a desired performance in load forecasting in the scenario of the Year 2019, with MAPE as small as 6.0021%. However, the performance declines after the outbreak of the pandemic, with an increase in MAPE by around 1.5%. By contrast, using load graph encoding heterogeneous features, the forecast performance of ResGCN is much more robust, as shown in Table 4. The superiority of the proposed method is further validated by Figure 13, where the forecasts with consideration of COVID-19 are far closer to the actual data. This again justifies that incorporating the epidemic’s effects can improve the accuracy of short-term load forecasting, which is of significant value for a new normal featured by living with COVID-19.
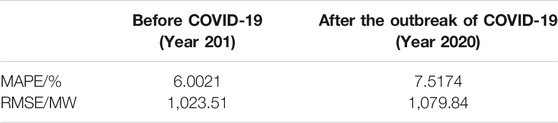
TABLE 3. Forecasting performance of ResGCN with naive load graph.
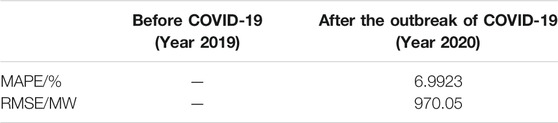
TABLE 4. Forecasting performance of ResGCN with load graph encoding heterogeneous features.
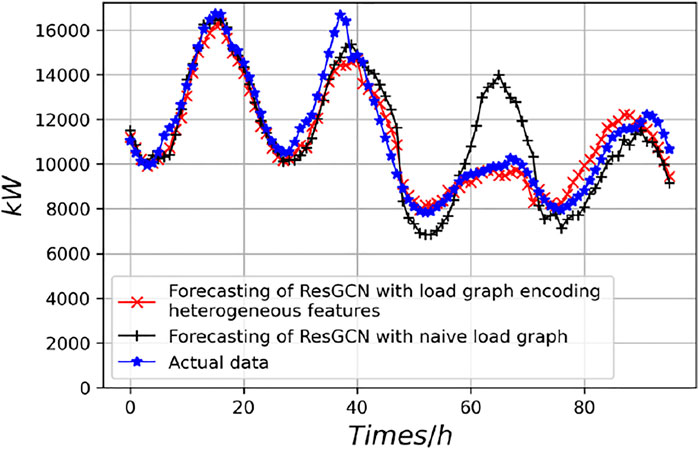
FIGURE 13. Short-term load forecasts with and without considering effects of COVID-19 (2020.10.23-2020.10.26).
4 Conclusion and Prospects
4.1 Conclusion
The fight against COVID-19 is far from over, while many countries start to resume economic development aiming at a “living with COVID” new normal. In this context, this paper proposes a novel short-term load forecasting method under COVID-19 based on graph representation learning with heterogeneous features. Unlike existing methods that fit power load data to time series, this study encodes heterogeneous features relevant to electricity consumption and epidemic status into a load graph, so that not only the features are contained at each time moment, but also the inherent correlations between the features can be exploited; Then, a residual graph convolutional network (ResGCN) is constructed to fit the non-linear mapping between load graph to future loads. Besides, a graph concatenation method for parallel training is proposed to improve the learning efficiency.
The following points can be concluded from the case study using practical data in Houston:
(1) There are strong correlations between the evolution of COVID-19 and changes in electricity utilization.
(2) The proposed load graph is capable of exploiting heterogeneous features, while the accuracy of load forecasting can be improved significantly by considering the effects of the pandemic.
(3) The ResGCN outperforms existing short-term load forecasting methods in accuracy, with a decrease of RMSE by 15.03% compared with LSTM-DNN.
4.2 Prospects
In the present forecasting methodology with load graph, features like vaccination rates have not been considered. As the epidemic develops and vaccination becomes more widespread, these characteristics will become a non-negligible part of the epidemic’s impact on the load. Therefore, it remains for us to refine the load graph as the situation evolves. In addition, the selected features encoding in the load graph only reflect partial impacts of the epidemic, while further research is still needed to grasp their relationships fully.
It is worth noting that the idea of representing load as a graph and using ResGCN to do the forecasting can be applied not only to the regional load forecasting under major social and health events such as epidemics but also to the forecasting tasks that also require the integration of heterogeneous information, e.g., renewable energy output forecasting, which will be the direction of our future research.
As for the impacts of the epidemic on load, as the paper concluded in the case study, they are complex and need to be studied with respect to local policies. The discussions in this paper are focused on Houston only. In fact, the responses of the government and the attitude of people to the epidemic vary significantly from country to country, so that the situation in a larger area shall be investigated in the future.
Data Availability Statement
Publicly available datasets were analyzed in this study. This data can be found here: https://github.com/tamu-engineering-research/COVID-EMDA.
Author Contributions
Conceptualization, ZY; Data curation, JY; Formal analysis, YW; Methodology, ZY; Project administration, ZY; Resources, JY; Visualization, YH; Writing, ZY, All authors contributed to the article and approved the submitted version.
Conflict of Interest
The authors declare that the research was conducted in the absence of any commercial or financial relationships that could be construed as a potential conflict of interest.
Publisher’s Note
All claims expressed in this article are solely those of the authors and do not necessarily represent those of their affiliated organizations, or those of the publisher, the editors and the reviewers. Any product that may be evaluated in this article, or claim that may be made by its manufacturer, is not guaranteed or endorsed by the publisher.
Acknowledgments
The authors gratefully acknowledge the support of The Natural Science Foundation of China- Smart Grid Joint Fund of State Grid Corporation of China (U2066212) and the Data provided by Haiwang Zhong.
References
Agdas, D., and Barooah, P. (2020). Impact of the COVID-19 Pandemic on the U.S. Electricity Demand and Supply: an Early View from Data[J]. IEEE Access 8, 1. doi:10.1109/ACCESS.2020.3016912
Amral, N., Ozveren, C. S., and King, D. (2007). Short Term Load Forecasting Using Multiple Linear Regression[C]//2007 42nd International Universities Power Engineering Conference Brighton IEEE.
Bui, Q., and Wolfers, J. (2020). “Another Way to See the Recession: Power Usage Is Way Down,” New York Times (Accessed May 6, 2020).
Chen, W., Xu, D., and Guo, R. (2020). A Study on the Influence Rule of Load Forecasting on Multi-Objective Optimal Dispatching of a New-Energy Grid [J]. Power Syst. Prot. Control. 48 (10), 46–51.
Cicala, S. Early Economic Impacts of COVID-19 in Europe: A View from the grid. Tech. Rep. Chicago, IL, USA: Univ. Chicago. Available at: https://home.uchicago.edu/scicala/papers/real_time_EU/real_time_EU.pdf (Accessed May 6, 2020).
Gupta, A., and Kumar, A. (2020). “Mid Term Daily Load Forecasting Using ARIMA, Wavelet ARIMA and Machine Learning[C],” in 2020 IEEE International Conference on Environment and Electrical Engineering and 2020 IEEE Industrial and Commercial Power Systems Europe (EEEIC/I&CPS Europe) (IEEE).
Han, L., Wang, Y., Li, X., and Yang, G. (2021). Prediction of NOx Emissions of Coal-Fired Power Plants Based on Mutual Information-Graph Convolutional Neural Network [J/OL]. Proc. CSEE 1. doi:10.13334/j.0258-8013.pcsee.202540
Huang, J., Zhang, L., and Liu, X. (2020). Global Prediction System for COVID-19 pandemic[J]. Bethesda: Science Bulletin.
Jie, Z. A., and Gc, A., (2020). Graph Neural Networks: A Review of Methods and Applications[J]. AI Open 1, 57–81. doi:10.1016/J.AIOPEN.2021.01.001
Li, B., and Lu, M. (2020). Short-term Load Forecasting Modeling of Regional Power Grid Considering Real-Time Meteorological Coupling Effect[J]. Automation Electric Power Syst. 44 (17), 60–68. (in Chinese). doi:10.7500/AEPS20200216001
Li, Q., Han, Z., and Wu, X. (2018). “Deeper Insights into Graph Convolutional Networks for Semi-supervised Learning[C]. in” 32nd AAAI Conference on Artificial Intelligence. New Orleans, LA, United states.
Li, X., Ma, L., and Zhao, X. (2021). Multi-time Scale Electric Heating Load Forecasting Based on Long Short-Term Memory Network. Proc. CSU-EPSA 33, 71. doi:10.19635/j.cnki.csu-epsa.000463
Li, Y., Jia, Y., and Li, L. (2020). Short Term Power Load Forecasting Based on a Stochastic forest Algorithm. [J].Power Syst. Prot. and Control 48 (21), 117–124. (in Chinese). doi:10.19783/j.cnki.pspc.191594
Liu, K. (2015). Development Path Exploration of Energy Internet [J]. Electric Power Construction 36 (10), 5–10. doi:10.3969/j.issn.1000-7229.2015.10.001
Meng, A., Hu, H., and Liu, X. (2016). Short-term Load Forecasting Using Neural Network Based on Wavelets and Crisscross Optimization Algorithm[J]. Power Syst. Prot. Control. 44 (7), 102–106.
WHO, (2020). Statement on the Fourth Meeting of the International Health Regulations Emergency Committee Regarding the Outbreak of Coronavirus Disease (COVID-19). Geneva, Switzerland.
Rendon-Sanchez, J. F., and De Menezes, L. M. (2019). Structural Combination of Seasonal Exponential Smoothing Forecasts Applied to Load Forecasting. [J].European J. Oper. Res. 275 (3), 916–924. doi:10.1016/j.ejor.2018.12.013
Ruan, G., Wu, J., Zhong, H., Xia, Q., and Xie, L. (2021). Quantitative Assessment of U.S. Bulk Power Systems and Market Operations during the COVID-19 Pandemic. Appl. Energ. 286 (2021), 116354. doi:10.1016/j.apenergy.2020.116354
Ruan, G., Wu, D., Zheng, X., Zhong, H., Kang, C., Dahleh, M. A., et al. (2020). A Cross-Domain Approach to Analyzing the Short-Run Impact of COVID-19 on the US Electricity Sector. Joule 4 (11), 2322–2337. doi:10.1016/j.joule.2020.08.017
Wang, J., Li. X., and He, J. (2021). Distribution Network Fault Location Based on Graph Attention Network[J]. Power Syst. Techn. 45 (6), 1. doi:10.13335/j.1000-3673.pst.2020.2222
Wang, Y., Liu, B., and Li, Y. (2020). Power Load Data Prediction Method Based on LSTM Neural Network Model[J]. Research Exploration Lab. 39, 41–45.
Werth, A., Gravino, P., and Prevedello, G. (2020). Impact Analysis of COVID-19 Responses on Energy Grid Dynamics in Europe. Applied Science Publishers, 281.
Zhang, K., Zhou, B., Or, S. W., Li, C., Chung, C. Y., and Voropai, N. I. (2021). Optimal Coordinated Control of Multi-Renewable-To-Hydrogen Production System for Hydrogen Fueling Stations. IEEE Trans. Ind. Applicat. 1. doi:10.1109/TIA.2021.3093841
Keywords: COVID-19, graph data modeling, graph representation learning, residual graph convolutional network, short-term load forecasting
Citation: Yu Z, Yang J, Wu Y and Huang Y (2021) Short-Term Power Load Forecasting Under COVID-19 Based on Graph Representation Learning With Heterogeneous Features. Front. Energy Res. 9:813617. doi: 10.3389/fenrg.2021.813617
Received: 12 November 2021; Accepted: 22 November 2021;
Published: 24 December 2021.
Edited by:
Bin Zhou, Hunan University, ChinaReviewed by:
Bo Yang, Kunming University of Science and Technology, ChinaXiaoshun Zhang, Shantou University, China
Copyright © 2021 Yu, Yang, Wu and Huang. This is an open-access article distributed under the terms of the Creative Commons Attribution License (CC BY). The use, distribution or reproduction in other forums is permitted, provided the original author(s) and the copyright owner(s) are credited and that the original publication in this journal is cited, in accordance with accepted academic practice. No use, distribution or reproduction is permitted which does not comply with these terms.
*Correspondence: Jiajun Yang, 1454582351@qq.com