Proton-conducting ceramics for water electrolysis and hydrogen production at elevated pressure
 C. Herradon1*
  L. Le2 C. Meisel3 J. Huang3 C. Chmura1 Y.D. Kim3 C. Cadigan1
  R. O’Hayre3
  N.P. Sullivan1*
- 1Mechanical Engineering Department, Colorado Fuel Cell Center, Colorado School of Mines, Golden, CO, United States
- 2Pacific Northwest National Laboratory, Richland, WA, United States
- 3Metallurgical and Materials Engineering Department, Colorado Center for Advanced Ceramics, Colorado School of Mines, Golden, CO, United States
Pressurized operation is advantageous for many electrolysis and electrosynthesis technologies. The effects of pressure have been studied extensively in conventional oxygen-ion conducting solid-oxide electrochemical cells. In constrast, very few studies have examined pressurized operation in proton-conducting electroceramics. Protonic ceramics offer high proton conductivity at intermediate temperatures (∼400–600°C) that are well-matched to many important thermochemical synthesis processes. Pressurized operation can bring significant additional benefits and/or provide access to synthetic pathways otherwise unavailable or thermodynamically disfavorable under ambient conditions and in higher- or lower-temperature electrochemical devices. Here we examine pressurized steam electrolysis in protonic-ceramic unit-cell stacks based on a BaCe0.4Zr0.4Y0.1Yb0.1O3−δ (BCZYYb4411) electrolyte, a Ni–BZCYYb4411 composite negatrode (fuel electrode) and a BaCo0.4Fe0.4Zr0.1Y0.1O3−δ (BCFZY) positrode (air-steam electrode). The cells are packaged within unit-cell stacks, including metallic interconnects, current collectors, sealing glasses and gaskets sealed by mechanical compression. The assembly is packaged within a stainless steel vessel for performance characterization at elevated pressure. Protonic-ceramic electrolyzer performance is analyzed at 550°C and pressures up to 12 bara. Increasing the operating pressure from 2.1 to 12.6 bara enables a 40% overall decrease in the over-potential required to drive electrolysis at 500 mA cm−2, with a 33% decrease in the cell ohmic resistance and a 60% decrease in the cell polarization resistance. Faradaic efficiency is also found to increase with operating pressure. These performance improvements are attributed to faster electrode kinetics, improved gas transport, and beneficial changes to the defect equilibria in the protonic-ceramic electrolyte, which more than compensate for the slight increase in Nernst potential brought by pressurized operation. Electrochemical impedance spectroscopy (EIS) coupled with distribution of relaxation time (DRT) analysis provides greater insight into the fundamental processes altered by pressurized operation.
Introduction
Protonic ceramics represent an emergent class of materials that have potential utility in a number of intermediate-temperature electrochemical applications, including the production of “green” hydrogen. As shown in Figure 1, renewable-derived electricity can be used to drive steam electrolysis to form H2 and O2 products in a protonic ceramic electrolysis cell (PCEC). Typically operating in the 400–600°C temperature range, H2O vapor carried by an air stream is fed into a gas channel adjacent to the air-steam electrode, or “positrode”. These gases diffuse through the porous positrode to the electrode-electrolyte interface, where H2O is electrochemically split to form protons (
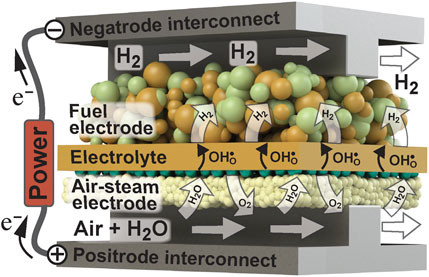
FIGURE 1. Illustration of proton-conducting ceramic electrolysis cell. Adapted from Le et al. (Le et al., 2022), with permission.
Protonic ceramics boast a low activation energy for proton transport (Kreuer, 1996; Kreuer et al., 2004; Duan et al., 2015). This enables high proton conductivity at operating temperatures that may be 200–300°C lower than more-mature oxygen-ion conducting (O2−) solid-oxide electrolysis cells (SOECs). These lower temperatures reduce thermally driven degradation processes, such as nickel agglomeration and coarsening, chromium poisoning, and creep of metallic stack components. Further, while the electrochemically produced H2 is diluted with water vapor in solid-oxide cells, necessitating downstream separation processes, PCECs provide a pure, dry hydrogen product stream. The 400–600°C operating temperatures is sufficiently high to promote facile chemical kinetics and thermal integration with high-value waste-heat sources, as well as significantly higher thermodynamic efficiency than low-temperature electrolysis technologies. Additionally, PCECs offer operational flexibility as they can potentially run effectively and efficiently across a range of steam concentrations. With these advantages, PCECs offer opportunities for large-scale hydrogen production.
Despite these benefits, reports of high-performance, high-efficiency PCECs are limited, and reports of pressurized operation are rarer still. Perhaps most significantly, PCECs can suffer from low Faradaic efficiency, usually attributed to electronic leakage across the electrolyte (Gan et al., 2012; Li and Licht, 2014; Gan et al., 2015; Li et al., 2015; Lei et al., 2017; Li et al., 2018; Zvonareva et al., 2022). Protonic ceramics are mixed proton, oxygen-ion and electron-hole conductors in which each charge carrier’s transference number is determined by the specifics of the electrolyte composition, operating conditions and polarization current density (Zhu et al., 2018a; Zhu et al., 2018b). During electrolysis, water and oxygen compete for absorption onto surface sites and into the oxygen vacancies present in the protonic ceramic membrane lattice. When H2O is incorporated to the membrane, the hydration reaction produces the desired charge defect and protons are transferred through the membrane (reaction 1). In parallel, molecular oxygen incorporation into a lattice vacancy generates electron holes via the membrane parasitic oxidation (reaction 2):
This reaction is associated with the observed p-type electronic leakage effect, thereby causing the lower Faradaic efficiencies commonly reported. High performance and stability have been observed with the chemically stable BaCe0.4Zr0.4Y0.1Yb0.1O3−δ (BCZYYb4411) perovskite (Choi et al., 2019). Compared to earlier BaZr1−xYxO3−δ based materials, the BCZYYb compositional family leads to reduced electronic leakage and can enable Faradaic efficiencies exceeding 95% (Duan et al., 2019).
Most electrolysis reports analyze ambient-pressure operation, with hydrogen compression and storage subsequently executed in further downstream processes. Direct high-pressure electrolysis has the potential to bring cost reduction and plant simplification by reducing or avoiding the need of subsequent hydrogen compression (Onda et al., 2004; Marangio et al., 2009). High-pressure operation can also in-part address the challenge posed by the electronic leakage issue in PCEC devices. As shown in Eq. 3 (Duan et al., 2020), the concentration of electron holes [h•] is dependent upon oxygen and steam partial pressures. While high-pressure operation increases the oxygen partial pressure, this effect is more than offset by the higher order tied to the H2O partial pressure. This leads to the potential for higher Faradaic efficiency with increasing pressure by decreasing the electron hole concentration in the electrolyte. Electrode activity can also be enhanced at higher pressures, enabling higher currents at lower driving voltages, and thus higher H2 production rates and a lower overall energy demand per mole of H2 produced.
A variety of theoretical and experimental studies on pressurized operation in conventional oxygen-ion conducting solid oxide cells provide insight for pressurized PCECs. Henke et al. (Henke et al., 2011) applied a two-dimensional elementary kinetic model to study the influence of pressure on the thermodynamics, reaction kinetics, porous electrode diffusion, channel transport and efficiency to predict the performance of a single solid oxide-fuel cell (SOFC) in the pressure range of 1–20 bar. The results revealed higher power density and efficiency upon pressurization with the strongest increase in the range between 1 and 5 bar.
According to Henke et al. (Henke et al., 2012) the positive effect of pressurized operation in SOFCs is tied to three primary reasons:
• Increase in open-circuit voltage (OCV) associated with a small Nerst potential pressure dependence.
• Improvement in reactant adsorption rates at both electrodes. Increasing gas-phase partial pressures boost adsorption rates and electrode surface coverage, thereby improving surface reaction kinetics, significantly reducing activation overpotentials.
• Change in diffusion mechanism and an increase in starting (inlet) reactant concentrations. At low pressures, the molecular mean free path is much larger than the pore dimensions. Molecule-pore surface interactions are predominant, as governed by the Knudsen diffusion mechanism, where the gas density gradient and pressure govern transport. At higher pressures the controlling mechanism is ordinary diffusion; molecule-molecule collisions prevail leading to a higher net transport of molecules from the high to the low concentration region compared to the Knudsen diffusion regime. Concentration overpotentials can therefore be significantly reduced by increasing pressure.
All three effects show a logarithmic behavior, with effects being more pronounced at pressures up to 5 bar and leveling off at higher pressures. Pressure effects become less powerful above 5 bar as reactant surface coverage leans toward saturation at higher pressures. These theoretically predicted trends have been experimentally confirmed in later experimental studies by the same author (Henke et al., 2012).
Solid-oxide electrolysis cells can achieve near 100% energy efficiency through careful balancing of the exothermic cell losses with the endothermic water-splitting reaction. SOEC internal resistances lead to overvoltages and energy loss in the form of Joule heating. The SOEC operating voltage can be set so that this Joule heating is equal to the thermal-energy demand of the electrolysis reaction. This operating point is known as the thermoneutral voltage, and corresponds to 100% electrolysis efficiency (Henke et al., 2014; Yang et al., 2021).
Increasing pressure leads to a modest boost in the theoretical Nernst potential required for electrolysis:
where n is the number of electrons, F is the Faraday constant (96500 C/mol), Δ g0 is the standard Gibbs energy, R is the ideal gas constant, νk is the stoichiometric coefficient, and pk is the partial pressure of each compound.
This increase brings a greater demand on the electric power required to drive the water-electrolysis reaction. In most oxygen-ion conducting cells, ohmic overvoltages are generally not influenced by pressure, as these are tied to the electrical and ionic resistances associated to the cell and stack components (e.g. electrolytes, electrodes, interconnects), and most oxygen-ion conducting electrolytes operate fully within the extrinsic electrolytic domain (i.e., pure ionic transport). In contrast, activation and concentration overvoltages are significantly reduced with increasing pressure. With the logarithmic pressure dependence shown in Eq. 4, the most-pronounced effects are found near ambient pressure for both SOFCs and SOECs.
Electrolysis at low current densities incurs relatively modest activation and concentration overvoltages. This enables high efficiency, but also means larger device sizes are needed to meet H2 production targets. Because the activation and concentration overvoltages at low current density are small to begin with, the improvements brought by pressurized operation can be obscured by the increase in Nernst potential, leading to modest, or even negative performance-pressure dependencies at lower current density.
In contrast, overvoltages are more pronounced at higher current densities. In this case, the increase in power requirements necessitated by the boost in Nernst potential due to pressurization is small in comparison to power required to overcome these higher overpotentials (Ni et al., 2007; Henke et al., 2014). Thus, the kinetic and mass-transport performance improvements brought by high-pressure operation are more impactful at these high-current-density conditions, as they can substantially decrease these large overvoltages. These phenomena have been theoretically and experimentally confirmed on anode-supported SOECs at 800°C (Ni et al., 2007; Henke et al., 2014; Bernadet et al., 2015; Sun et al., 2015).
Experimental performance analysis on a 16 cm2 fuel-electrode-supported planar solid-oxide cell showed that pressurization brought stronger performance improvements in fuel-cell mode than in electrolysis mode. In this work, Jensen et al. (Jensen et al., 2010) found pressurization to have minimal influence on electrolyzer performance. Internal resistance decreased around 20% as operating pressure increased from 1 to 10 bar. O’Brien et al. (O’Brien, 2012) found a similar trend in a 10-cell planar SOEC stack operating at 800°C. The slope of the polarization curves in electrolysis mode decreased with increasing pressure, indicating lower area-specific resistance (ASR) as the pressure was increased from 1 to 17 bar (O’Brien, 2012). Kato et al. (Momma et al., 2013) found steam diffusion to be limiting in an anode-supported SOEC at operating pressures between 0.1 and 3 bar, with performance compromises most pronounced at lower pressures. Electrochemical impedance measurements have also confirmed that the individual processes expected to be dependent on gas partial pressures were all enhanced by increasing the operation pressure from 1 to 3 bar (Sun et al., 2015).
In contrast to conventional oxygen-ion conducting cells, there are few studies on the effect of pressurization on protonic-ceramic cells. Vøllestad et al. (Vøllestad et al., 2019) demonstrated the positive effect of higher steam and total pressure on tubular PCECs based on barium-zirconate. Increasing pressure from 1.5 to 4 bar at 600°C brought a ∼10% increase in the current density for a driving voltage of ∼1.9 V. In addition, they observed a decrease in the operating voltage of 30–50 mV and lower polarization resistance (Rp) as assessed by electrochemical impedance spectroscopy (EIS). Malerød-Fjeld et al, (2017) showed the viability of using a BaZrO3-based proton-conducting electrolyte deposited as a dense film on a porous Ni–composite electrode as a protonic membrane reformer. The device achieved 99% conversion in steam methane reforming. Simultaneously, it produced high-purity hydrogen compressed electrochemically up to 50 bar.
In this paper, we expand on these limited high-pressure operation studies to further explore the electrochemical behavior of protonic-ceramic cells at elevated pressures. Fabrication and performance characterization protocols are subsequently described.
Experimental methods
Membrane electrode assembly fabrication
Materials compositions and stoichiometries for proton-conducting cells continue to be fine-tuned so that better electrochemical performance can be achieved during operation. Recently, low ohmic resistance and degradation rates have been observed using a highly conductive and chemically stable multi-doped perovskite BaCe0.4Zr0.4Y0.1Yb0.1O3−δ (BCZYYb4411) as an electrolyte (Choi et al., 2015; Le et al., 2021). In this study we work with a composite of Ni–BCZYYb4411 as the fuel electrode (negatrode), BCZYYb4411 as the electrolyte and BaCo0.4Fe0.4Zr0.1Y0.1O3−δ (BCFZY) as the air-steam electrode (positrode).
The negatrode and electrolyte layers of the membrane-electrode assemblies (MEA) used in this study are synthesized using the solid-state reactive sintering (SSRS) method. The SSRS method uses compacts comprised of multiphase oxide and carbonate precursors to form the negatrode and electrolyte layers, rather than starting from single-phase compacts. This approach combines phase formation, densification, and grain growth into a single high-temperature sintering step, simplifying the fabrication process (Nikodemski et al., 2013). SSRS provides a lower-cost alternative to cell fabrication in comparison to conventional methods (Duan et al., 2015; Dubois et al., 2017).
We use stoichiometric ratios of BaCO3, CeO2, ZrO2, Y2O3 and Yb2O3 to form the electrolyte phase of the composite negatrode (Alfa Aesar 14341, 11328, 230693, 111328, and 11191, respectively). We then add NiO and potato starch as pore former (Alfa Aesar 45094 and 11961, respectively) in the proportion 60 wt% NiO: 40 wt% BCZYYb +20 wt% starch based on percentage of oxides. The mixture of precursors is ball milled in isopropanol for 72 h and then dried in a low-temperature furnace. Finally, we dry ball mill these powders for 24 h to form a homogeneous powder. Once formed, 20 g of this negatrode powder is well mixed with 2 g of binder (10% polyvinyl alcohol 20,000 M.W. dissolved in water) and dry pressed in a 57-mm-diameter stainless steel die with a compression pressure of 34 MPa for 10 s to form the negatrode support pellet.
The BCZYYb electrolyte is spray-coated onto this negatrode support. To form the electrolyte slurry, we first mix stoichiometric ratios of BaCO3, CeO2, ZrO2, Y2O3 and Yb2O3, plus 1.0 wt% NiO following the same method as for the fuel electrode precursor powder. We mix the electrolyte powder with a homogeneous mixture of binder, plasticizer and dispersant (Heraeus V-006, Alfa Aesar PEG 400 B21992, and Alfa Aesar PVP 40000 J62417, respectively) to synthesize the electrolyte suspension. The mass fraction of the electrolyte solution is 13 wt% electrolyte precursor powder +1 wt% PEG +1 wt% PVP +2.5 wt% binder +2.5 wt% alpha terpineol (Alfa Aesar 16,285) + 80 wt% isopropanol. The suspension is suspended in a sonicator for 1.5 h before spraying.
This electrolyte slurry is spray-deposited onto the negatrode support using a low-cost commercial airbrush (Master S68); 12 ml of the electrolyte solution produces a 20 μm-thick electrolyte layer across the 57-mm-diameter negatrode disc. The distance between the air brush and the support during spray coating is held at approximately 20 cm. After spray-coating, the electrolyte-negatrode assemblies are then co-sintered in an atmospheric furnace (Deltech) at temperatures between 1450 and 1550°C for 15 h. The firing process includes an intermediate 5 h dwell at 450 °C to burn out the binder; heating and cooling ramps are held at 3°C min−1.
Following the high-temperature sintering, we apply the BCFZY air-steam positrode atop the electrolyte. The BCFZY material is prepared following the sol-gel method previously described by Duan et al, (2015). BCFZY powder is mixed with 20 wt% BCZYYb4411 in order to improve the adherence and increase the electrochemically active region. This composite material is transformed into an ink by mixing with binder (Heraeus V006-A) and dispersant (Solsperse 28,000) to form a paste, adjusted to the desired viscosity. This paste is then brush-painted onto the sintered electrolyte.
Finally, the full cell (negatrode-electrolyte assembly + brush-painted BCFZY positrode) is sintered at 900°C for 5 h. This positrode sintering temperature is sufficient to promote adherence between the air-steam electrode and the electrolyte while maintaining a nanoscale positrode structure with high surface area for maximum electrochemical activity. The result is an approximately 1 mm-thick, 39 mm-diameter membrane-electrode assembly with an active area of approximately 5 cm2.
Stack design and fabrication
The unit-cell stack design and fabrication are similar to that described in Le et al. (Le et al., 2021). Figure 2A shows a schematic drawing of the unit-cell stack, along with a photograph of its assembly. The protonic-ceramic membrane-electrode assembly is first bonded to a composite ceramic frame. Glass sealing powder (Mo-Sci 1745p) is mixed with distilled water to create a viscous paste that is carefully applied on both sides of the cell circumference in contact with the frame internal edges. The applied glass sealing is later cured at 750°C for 2 hours at a heating rate of 1 °C/min to form a smooth, crack-free seal. The non-conductive ceramic frame helps to prevent electrical shorting within the stack.
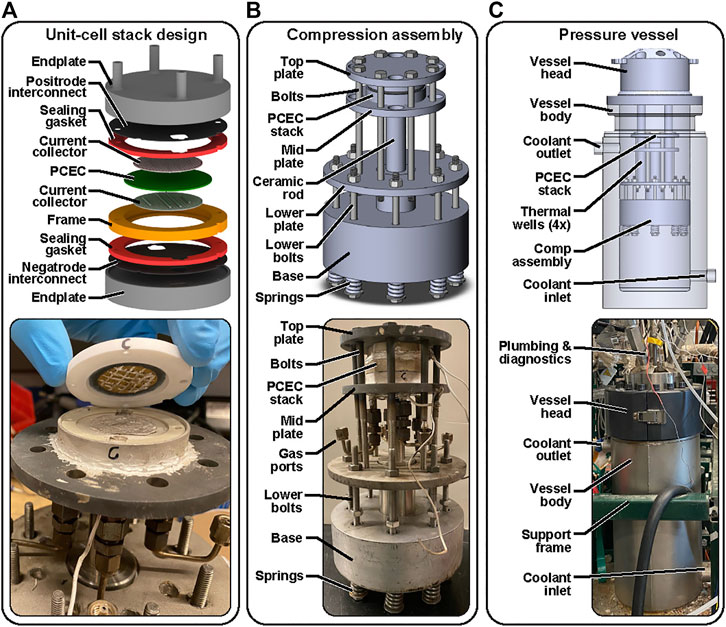
FIGURE 2. Designs and photographs of (A). unit-cell PCEC stack assembly; (B) stack-compression assembly; and (C) pressure vessel.
The MEA-frame assembly is then packaged between 4-mm-thick ferritic steel endplates (Crofer 22H, ThyssenKrupp). Thin sheet-steel interconnects are also placed between the MEA and the endplates. These interconnects have nano-scale cobalt and ceria coatings, as provided by the manufacturer (Sandvik SANERGY 441), to facilitate formation of the electrically conductive (Mn,Cr)3O4 scale (Le et al., 2021). The interconnects are pretreated through 30 h of continuous exposure to an air +10% H2O environment at 900°C, an adaptation of the work by Goebel et al, (2018) and Talic et al, (2018). These 0.4-mm-thick interconnects are bonded to the thick end plates using silver paste.
Two 1-mm-thick chemically exfoliated vermiculated gaskets (Thermiculite 870, Flexitallic) provide sealing between the ceramic frame and the interconnects. These gaskets require compression for hermeticity. Metallic-mesh current collectors coated in silver paste are used to connect the cell electrodes with the interconnects. Current and voltage are drawn from the outside of the endplates, which are electrically insulated from the compression system and test stand using two alumina support plates (not shown).
The unit-cell stack assembly is placed within a compression system that promotes sealing of reactive gases from the surrounding environment as shown in Figure 2B. The compression force is transferred to the endplates through an Inconel rod secured within bulk compression plates that are pre-stressed to 4 MPa using a set of eight stainless-steel springs, nuts, and bolts (Hastelloy C276). Initial sealing is validated by gas analysis. This design enables the compression force to be transferred through the endplates and the ceramic frame instead of the comparatively delicate MEA.
The loaded electrochemical stack is assembled within a stainless-steel pressure vessel (Parr Series 4674) (Figure 2C). The pressure vessel includes ports for plumbing the reactant and product flows. The pressure vessel also includes four thermal wells in which resistive heaters are placed to achieve target operating temperatures. It is noteworthy that compression springs are located outside of the vessel hot zone to minimize creep and maintain compression.
High-pressure mass flow controllers (Alicat MCQ series) regulate the flow rates of reactants fed to the negatrode and positrode. Additionally, an inert sweep gas flows through the pressure-vessel chamber into which the stack assembly is placed. A high-pressure isocratic pump (Teledyne, LS Class) accurately controls the water flow rate that is evaporated and carried with air to the positrode. Back-pressure regulators with feedback control (Equilibar ZF Zero Flow and QBS series) minimize pressure differentials between fuel, air and sweep gas to below 10 kPa. A data acquisition and control system (National Instruments) is used to operate the mass flow controllers and the electronic pressure regulator, while a PID unit powers the resistive heaters and controls the stack operating temperature (Parr 4838 Temperature Controller).
Stack electrochemical performance characterization
Electrolyzer performance is measured through polarization curves, electrochemical impedance spectroscopy, and galvanic operation at different pressures (Gamry, Reference 5000). Stack exhaust flow rates are continuously measured (DryCal Defender 530 Plus, Mesa Labs) and compared with inlet flow rates to confirm sealing, quantify hydrogen production, and calculate Faradaic efficiency.
The system is heated to 550°C at 1°C min−1 with no gas flow at ambient pressure. Once the target temperature is reached, we start flowing 100 sccm of a H2-N2 mixture to the negatrode and 200 sccm of air +3% steam on the positrode. We also flow 200 sccm of argon as sweep gas. We gradually increase the H2 concentration from 5 to 80% to reduce the NiO in the two-phase negatrode to metallic nickel; this process takes 3–4 h. Cell reduction is considered complete when the open-circuit voltage (OCV) is stable at around 1–1.1 V and EIS response is invariant with time. Then we set the standard gas compositions for experimental measurement: fuel side = 100 sccm (75% H2 - 25% N2), air side = 200 sccm of air (10–30% steam). The temperature is kept constant at 550°C. Operating pressure spans from 1 to 12 bar in 1-bar steps.
Results and discussion
Pressure effect on cell performance in electrolysis mode
The experiments in this work were conducted at a constant temperature of 550°C and fixed gas conditions of 75% H2 + 25% N2 fed to the negatrode and air +10%–30% H2O fed to the positrode. Higher water-vapor concentrations have been shown to improve electrolyzer electrochemical performance, but have also been tied to increased degradation rates (Le et al., 2022).
The expected boost in open-circuit voltage (OCV) with high pressure is evident in Figure 3A, consistent with the Nernst equation (Eq. 4). This higher OCV can increase electrolysis power demand. However the improved kinetic and mass transport characteristics brought by pressurized operation more than offset the OCV increase, as evidenced in the polarization curves shown in Figure 3B. Focusing on the 1.6 V operating potential, current density increases from 375 to 600 mA cm−2 as pressure rises from 2.1 to 12.6 bar, a 60% increase in performance (Figure 3C). However, at lower pressures (e.g., compare 2.1 bar vs 5.7 bar), the effect of pressure is far more modest.
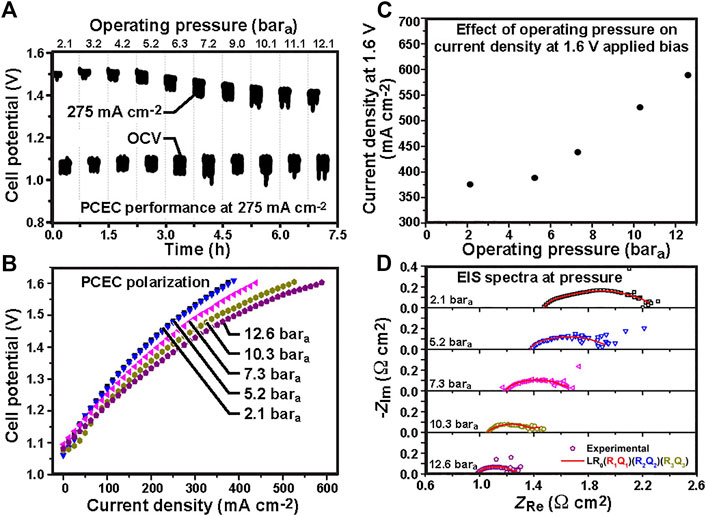
FIGURE 3. Protonic-ceramic electrolyzer performance from 2.1 to 12.1 bara: (A) open-circuit voltage and driving voltage at 275 mA cm−2 over 7.5 h; (B) polarization behavior; (C) current density at 1.6 V driving voltage; and (D) electrochemical impedance spectra.
As noted earlier, electrochemical performance studies at pressure from conventional oxygen-ion conducting solid-oxide electrolyzers show similar trends. For example, at lower current densities (
Electrochemical impedance spectra in Figure 3D are consistent with the polarization behavior in Figure 3B. Ohmic and polarization resistance both decrease with increasing pressure, e.g. by as much as 33% and 60% respectively when the pressure increases from 2.1 to 12.6 bara. This result is in contrast to what is seen in SOECs, where polarization resistance decreases with pressure but ohmic resistance stays almost constant (Jensen et al., 2010; Momma et al., 2013). This notable PCEC ohmic pressure response is attributed to the mixed-conduction behavior of the protonic ceramic electrolyte, specifically the dependence of the proton and hole conductivities on gas composition and concentration. As noted by Henke et al. (Henke et al., 2014), ohmic heating at higher current densities can also bring modest temperature increases to the electrolysis cell that can additionally contribute to the observed drop in ohmic resistance.
As presented by Le et al. (Le et al., 2022), electrochemical impedance spectra acquired from PCECs can be fitted to an equivalent-circuit model (ECM) in which each element can be generally associated to characteristic phenomena taking place in the cell. We found that a four-component ECM LR0 (RQ)1 (RQ)2 (RQ)3 effectively captures the impedance responses from our cells. The typical processes associated to each of these elements are consistent with previous studies (Jensen et al., 2007; Lu et al., 2019; Wang et al., 2020):
1) L represents the inductance resistance;
2) R0 represents the ohmic loss commonly associated with charge transport through the electrolyte;
3) R1Q1 represents charge transfer associated with a characteristic pseudo-capacitance of ∼ 10–4–10–3 (F cm2);
4) R2Q2 represents surface diffusion associated with a typical pseudo-capacitance of 10–3–10–2 (F cm2);
5) R3Q3 represents dissociative adsorption/dissociation of the gaseous species and/or mass transport processes within the electrode. The pseudo-capacitance of both phenomena is typically observed at 10–1–101 (F cm2).
Figure 4 quantify the influence of pressure on the elementary resistances. ASR2 is associated with surface diffusion within the BCFZY electrode and appears to be the most pressure-dependent process. The charge transfer process (ASR1) seems to be reduced as pressure increases up to 6 bar. After 6 bar the pressure effect on ASR1 is negligible. Finally the surface adsorption-desorption process (ASR3) is weakly affected by the operating pressure, specially after 5 bar.
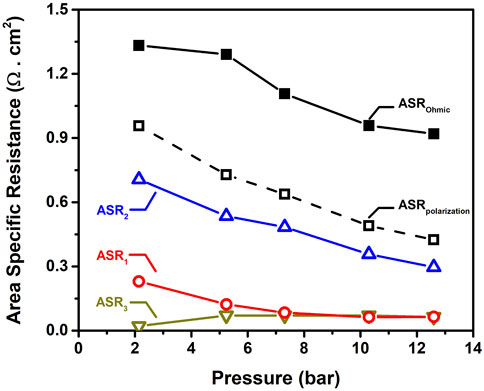
FIGURE 4. Effect of operating pressure on area-specific resistance.
Equivalent circuit modeling (ECM) of EIS is a valuable characterization tool to resolve transport and reaction pathways by their characteristic frequency dependencies. However, electrode physical processes like charge transfer and transport often overlap in the frequency domain. This can challenge the traditional ECM interpretation of EIS data. Recently, distribution of relaxation time (DRT) analysis has risen to prominence as an important tool to further identify and separate distinct relaxations in an impedance response that may be associated with specific electrochemical processes. DRT can also assist in identification of the most appropriate equivalent-circuit model(s) for a system under study (Dierickx et al., 2020; Huang et al., 2021). That said, interpretation of the characteristic DRT response of protonic ceramic devices is at an early stage compared to other electrochemical systems; the authors know of no reports presenting the impact of operating pressure on DRT response from a protonic ceramic cell.
We utilize a robust DRT fitting package recently developed by Huang et al, (2021), which employs a hierarchical Bayesian model, to fit and analyze our impedance spectra across the range of pressures. The package applies Bayesian inference to eliminate manual tuning and automatically identify corrupted data points, enabling robust fitting of noisy impedance data.
Figure 5 shows the obtained cell DRT response at pressures ranging between 1 and 9 bara. EIS measurements were taken under OCV conditions at the featured pressures. At 1 bara, we can observe major DRT peaks at three time constants: 10–4, 10–2 and 10–1 s, broadly consistent with the three RQ circuit elements present in our ECM. While some additional minor peaks may be present in the DRT, the level of noise present in spectra obtained at elevated pressure makes resolution of these peaks very challenging; thus, we focus our analysis on the impact of operating pressure on these three primary peaks.
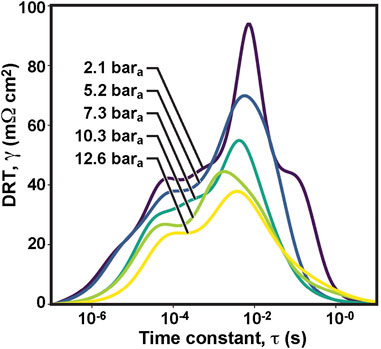
FIGURE 5. Effect of pressure on distribution of relaxation times in protonic-ceramic electrolyzer at open-circuit voltage.
The DRT peak at 10–1 s is quickly eliminated when pressure is increased from 2 to 4 bara. The peaks at 10–2 and 10–4 s decrease with increasing pressure, especially the peak at τ = 10–2 s. Gas diffusion is expected to be the most pressure-dependent process, typically manifesting at the lowest frequencies (Sumi et al., 2021). This suggests that the peak at 10–1 s is likely tied to this physical process as proposed by Le et al. (Le et al., 2022). The peak at 10–2 s seems more likely to be associated with the electrode surface diffussion which also improves at higher pressures; the resistance tied to this process decreases. Triple conductors oxides such as BCFZY are known to have large chemical capacitances which can push the time constants for electrode surface processes to longer timescales as observed in Figure 5.
It is noteworthy that pressure does not bring a significant shift in the magnitudes of the time constants, τ = R C. Peak resistances decrease with pressure, while τ remains nearly constant. Therefore, we can conclude that higher operating pressures boost the capacitance C. This would be consistent with greater surface coverage of charged adsorbates, an increase in the accessible electrochemically active surface area, and/or greater concentration of charge carriers in the near-surface region of the electrode, all of which could reasonably be induced by higher-pressure operation.
Galvanic performance at elevated pressure
Figure 6 further reveals the encouraging gains in electrolysis performance that can be achieved with increasing pressure. In this series of experiments, the operating pressure is increased in 1-bar steps from 2.1 to 12.6 bara. Operating conditions are held for 20 min at each condition. Operating temperature is held constant at 550°C, while reactant gas composition is fixed at 75% H2 + 25% N2 fed to the negatrode and 90% air +10% H2O fed to the positrode.
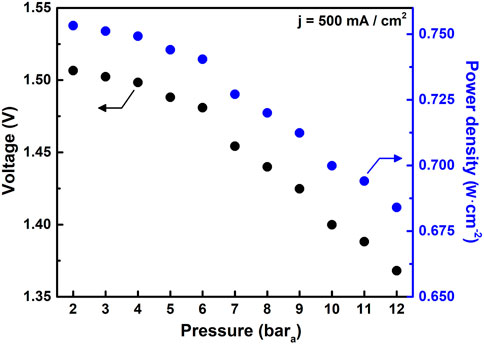
FIGURE 6. Impact of pressure on electrolysis driving voltage and power at a current density of 500 mA cm−2.
Over the course of the 6-h test, cell current density is alternated between 0 and 500 mA cm−2. The driving voltage needed to maintain the 500 mA cm−2 current density decreases from 1.5 to 1.35 V as pressure increases from 2.1 to 12.6 bara. We also note that the electrochemical performance of the cell shown in Figure 6 exceeds that of the cell shown in Figure 3. This is reflective of our challenges with process control and cell-to-cell repeatability in our academic laboratory setting.
Overall, pressurization reduces the power needed to drive electrolysis by 30% at 500 mA cm−2. These gains are consistent with, or greater than, those generally observed in previous studies using solid oxide electrolysis cells, and as previously noted, the benefits of pressurized electrolysis can be even more pronounced at higher current densities (Ni et al., 2007; Henke et al., 2014; Sun et al., 2015).
Pressure effect on faradaic efficiency
Electronic leakage compromises the efficiency of protonic-ceramic electrolyzers for producing pure, dry, green H2, and presents one of the largest technical challenges facing the technology.
Pressurized operation can increase proton concentration in the membrane and suppress electronic charge carriers to boost Faradaic efficiency. High steam concentrations at the positrode promote
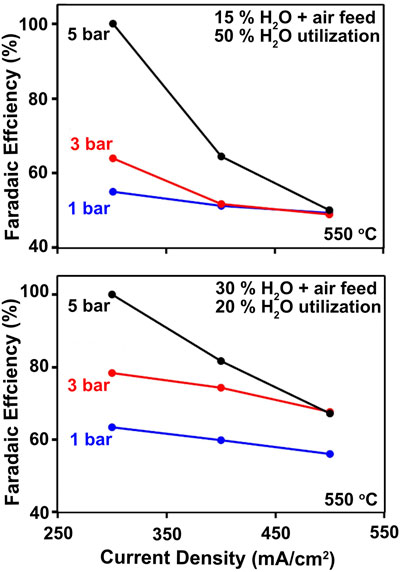
FIGURE 7. Illustration of pressure effect on Faradaic Efficiency at 50% (top) and 20% (bottom) steam utilization.
However, many button-cell and theoretical modeling studies show the opposite trend, where the internal short of electronic conduction is overwhelmed by the flux of driven protons at higher current densities, yielding higher efficiencies at higher loads (Zhu et al., 2022). Zhu et al, (2022) shows that Faradaic efficiency decreases drastically near open-circuit conditions, and can become negative at the lowest current densities. They found that at open circuit, the cell behaves as a concentration cell, driving protons from the negatrode to the positrode, resulting in a reverse proton flux. As the imposed current density increases the desired proton flux from the positrode to the negatrode eventually surpasses the reverse proton flux, increasing Faradaic efficiency. This model also suggests that unmeasured variations in operating conditions, such as local temperature increases with high current density or local reactant depletion/product accumulation effects can be the reason of the diminished Faradaic efficiencies observed in some of the published experimental work on larger-area PCECs. This remains an active area of investigation in the protonic-ceramic community.
Figure 7 further shows that increases in operating pressure are found to boost Faradaic efficiency at current densities below 500 mA cm−2, reaching nearly 100% at 5 bara and 300 mA cm−2. Still, FE remains modest at lower pressures, particularly at the 15% steam feed condition and 50% utilization, where hole generation by Reaction 2 may be pronounced. The higher steam feed concentration of 30% and lower steam utilization shown in Figure 7B enables higher Faradaic efficiency. While yet-higher steam feeds could be even more beneficial, such conditions have proven to be deleterious to the air-steam electrode (Le et al., 2022). This motivates the development of more-advanced, stable PCEC electrode materials.
Similar to our findings, Vøllestad et al, (2019) reported the positive effect of higher steam and total pressures on the polarization behavior and Faradaic efficiency of a BZCY-based tubular electrolysis cell. They observed a 30–50 mV decrease in the operating voltage when the steam pressure was increased from 1.5 to 4 bar, reflecting the increased proton conductivity in the electrolyte as lower ohmic resistance was also observed from EIS. By increasing the steam partial pressure, or the total pressure at a given steam concentration, the water oxidation equilibrium shifts towards lower electron-hole concentration, higher proton concentration, and higher ionic transport to provide higher Faradaic efficiencies (Vøllestad et al., 2019).
In summary, our results show that pressurized electrolysis in protonic ceramic cells favors higher Faradaic efficiencies by decreasing the total resistance of the cell as well as the electron-hole concentration in the electrolyte. Electrode activity and mass transport are also enhanced at higher pressures, enabling higher current densities at lower driving voltages. These effects more than compensate for the slight increase in Nernst potential (and the corresponding OCV increase) and therefore enable significantly higher total electric-to-hydrogen energy efficiencies under pressurized operation.
Conclusion
This work summarizes our observations on pressurized operation of planar protonic-ceramic electrolyzers. High-temperature, high-pressure operation brings novel design challenges. Sealing of reactive gases is more challenging at high pressures; adequate sealing is central to achieving high Faradaic efficiency. Further, pressurized operation can magnify small differences in operating pressure between the anode and cathode chambers that can lead to fracture of fairly delicate electroceramic membrane-electrode assemblies. This paper presents our approaches to meeting these challenges, and the benefits brought by pressurized electrolysis with protonic ceramics.
As pressure increased from 2.1 to 12.6 bar, we observed:
• The expected boost in OCV consistent with the Nernst equation.
• Ohmic and polarization resistances decreased by 33% and 60%, respectively, enabling higher current densities at lower driving voltages.
• A 60% performance increase confirmed at higher current densities; the improved kinetic and mass transport characteristics brought by pressurized operation more than offset the OCV increase.
• Faradaic efficiency increased, reaching 100% at 5 bar and 15% steam concentration.
These results confirm that pressurized electrolysis enhances electrode activity, improves the kinetic and mass-transport behavior, and lowers the power required for H2O electrolysis. The higher Faradaic efficiencies suggest that pressurized operation decreases the electron-hole concentration in the electrolyte and can serve as a solution to mitigate deleterious electronic leakage in protonic ceramic devices.
Data availability statement
The raw data supporting the conclusion of this article will be made available by the authors, without undue reservation.
Author contributions
CH: Lead researcher, Formal analysis, Writing and editing manuscript, Investigation. LL: Formal analysis, Methodology, Investigation. CM: Methodology, Investigation. JH: Implement EIS/DRT data analysis, Data curation, Validation. Christopher Chmura: Methodology. YK: Methodology. CC: Methodology. RO: Conceptualization, Visualization, Writing—review and editing, Funding acquisition. NS: Supervision, Conceptualization, Writing—review and editing final draft, Funding acquisition.
Funding
The information, data, or work presented herein was funded in part by the Advanced Research Projects Agency-Energy (ARPA-E), U.S. Department of Energy, under Award Number DE-AR0000808. The views and opinions of authors expressed herein do not necessarily state or reflect those of the United States Government or any agency thereof.
Conflict of interest
The authors declare that the research was conducted in the absence of any commercial or financial relationships that could be construed as a potential conflict of interest.
Publisher’s note
All claims expressed in this article are solely those of the authors and do not necessarily represent those of their affiliated organizations, or those of the publisher, the editors and the reviewers. Any product that may be evaluated in this article, or claim that may be made by its manufacturer, is not guaranteed or endorsed by the publisher.
Author disclaimer
The views and opinions of authors expressed herein do not necessarily state or reflect those of the United States Government or any agency thereof.
References
Bernadet, L., Gousseau, G., Chatroux, A., Laurencin, J., Mauvy, F., and Reytier, M. (2015). Influence of pressure on solid oxide electrolysis cells investigated by experimental and modeling approach. Int. J. Hydrogen Energy 40 (38), 12918–12928. doi:10.1016/j.ijhydene.2015.07.099
Choi, S., Davenport, T. C., and Haile, S. M. (2019). Protonic ceramic electrochemical cells for hydrogen production and electricity generation: exceptional reversibility, stability and demonstrated faradaic efficiency. Energy Environ. Sci. 12, 206–215. doi:10.1039/c8ee02865f
Dierickx, S., Weber, A., and Ivers-Tiffée, E. (2020). How the distribution of relaxation times enhances complex equivalent circuit models for fuel cells. Electrochim. Acta 355, 136764. doi:10.1016/j.electacta.2020.136764
Duan, C., Huang, J., Sullivan, N., and O’Hayre, R. (2020). Proton-conducting oxides for energy conversion and storage. Appl. Phys. Rev. 7 (1), 011314. doi:10.1063/1.5135319
Duan, C., Kee, R., Zhu, H., Sullivan, N., Zhu, L., Bian, L., et al. (2019). Highly efficient reversible protonic ceramic electrochemical cells for power generation and fuel production. Nat. Energy 4 (3), 230–240. doi:10.1038/s41560-019-0333-2
Duan, C., Tong, J., Shang, M., Nikodemski, S., Sanders, M., Ricote, S., et al. (2015). Readily processed protonic ceramic fuel cells with high performance at low temperatures. Science 349 (6254), 1321–1326. doi:10.1126/science.aab3987
Dubois, A., Ricote, S., and Braun, R. J. (2017). Benchmarking the expected stack manufacturing cost of next generation, intermediate-temperature protonic ceramic fuel cells with solid oxide fuel cell technology. J. Power Sources 369, 65–77. doi:10.1016/j.jpowsour.2017.09.024
Gan, L., Ye, L., Liu, M., Tao, S., and Xie, K. (2015). A scandium-doped manganate anode for a proton-conducting solid oxide steam electrolyzer. RSC Adv. 6 (1), 641–647. doi:10.1039/c5ra19844e
Gan, Y., Zhang, J., Li, Y., Li, S., Xie, K., and Irvine, J. T. S. (2012). Composite oxygen electrode based on LSCM for steam electrolysis in a proton conducting solid oxide electrolyzer. J. Electrochem. Soc. 159 (11), F763–F767. doi:10.1149/2.018212jes
Goebel, C., Alnegren, P., Faust, R., Svensson, J.-E., and Froitzheim, J. (2018). The effect of pre-oxidation parameters on the corrosion behavior of aisi 441 in dual atmosphere. Int. J. Hydrogen Energy 43 (31), 14665–14674. doi:10.1016/j.ijhydene.2018.05.165
Henke, M., Kallo, J., Friedrich, K. A., and Bessler, W. G. (2011). Andreas friedrich and wolfgang G. Bessler. Influence of pressurization on SOFC performance and durability: A theoretical study. Fuel Cells 11 (4), 581–591. doi:10.1002/fuce.201000098
Henke, M., Willich, C., Kallo, J., and Andreas Friedrich, K. (2014). Theoretical study on pressurized operation of solid oxide electrolysis cells. Int. J. Hydrogen Energy 39 (24), 12434–12439. doi:10.1016/j.ijhydene.2014.05.185
Henke, M., Willich, C., Westner, C., Leucht, F., Leibinger, R., Kallo, J., et al. (2012). Effect of pressure variation on power density and efficiency of solid oxide fuel cells. Electrochim. Acta 66, 158–163. doi:10.1016/j.electacta.2012.01.075
Huang, J., Papac, M., and O’Hayre, R. (2021). Towards robust autonomous impedance spectroscopy analysis: A calibrated hierarchical bayesian approach for electrochemical impedance spectroscopy (eis) inversion. Electrochim. Acta 367, 137493. doi:10.1016/j.electacta.2020.137493
Kreuer, K. D., Paddison, S. J., Spohr, E., and Schuster, M. (2004). Transport in proton conductors for fuel-cell applications: Simulations, elementary reactions, and phenomenology. Chem. Rev. 104 (10), 4637–4678. doi:10.1021/cr020715f
Kreuer, K. D. (1996). Proton conductivity: Materials and applications. Chem. Mat. 8 (3), 610–641. doi:10.1021/cm950192a
Onda, K., Kyakuno, T., Hattori, K., and Ito, K. (2004). Prediction of production power for high-pressure hydrogen by high-pressure water electrolysis. IEEJ Trans. Pe. 124 (4), 605–611. doi:10.1541/ieejpes.124.605
Lei, L., Tao, Z., Wang, X., Lemmon, J. P., and Chen, F. (2017). Intermediate-temperature solid oxide electrolysis cells with thin proton-conducting electrolyte and a robust air electrode. J. Mat. Chem. A 5 (44), 22945–22951. doi:10.1039/c7ta05841a
Li, F-F., and Licht, S. (2014). Advances in understanding the mechanism and improved stability of the synthesis of ammonia from air and water in hydroxide suspensions of nanoscale Fe2O3. Inorg. Chem. 53 (19), 10042–10044. doi:10.1021/ic5020048
Li, H., Chen, X., Chen, S., Wu, Y., and Xie, K. (2015). Composite manganate oxygen electrode enhanced with iron oxide nanocatalyst for high temperature steam electrolysis in a proton-conducting solid oxide electrolyzer. Int. J. Hydrogen Energy 40 (25), 7920–7931. doi:10.1016/j.ijhydene.2015.04.067
Li, W., Guan, B., Liang, M., Hu, S., Zhang, N., and Liu, X. (2018). High performing triple-conductive Pr2NiO4+δ anode for proton-conducting steam solid oxide electrolysis cell. J. Mat. Chem. A 6 (37), 18057–18066. doi:10.1039/c8ta04018d
Le, L. Q., Hernandez, C. H., Rodriguez, M. H., Zhu, L., Duan, C., Ding, H., et al. (2021). Proton-conducting ceramic fuel cells: Scale up and stack integration. J. Power Sources 482, 228868. doi:10.1016/j.jpowsour.2020.228868
Le, L. Q., Meisel, C., Hernandez, C. H., Huang, J., Kim, Y., O’Hayre, R., et al. (2022). Performance degradation in proton-conducting ceramic fuel cell and electrolyzer stacks. J. Power Sources 537, 231356. doi:10.1016/j.jpowsour.2022.231356
Lu, M. Y., Scipioni, R., Park, B-K., Yang, T., Chart, Y. A., and Barnett, S. A. (2019). Mechanisms of prox performance enhancement of oxygen electrodes for low and intermediate temperature solid oxide fuel cells. Mat. Today Energy 14, 100362. doi:10.1016/j.mtener.2019.100362
Malerød-Fjeld, H., Clark, D., Yuste-Tirados, I., Zanón, R., Catalán-Martinez, D., Beeaff, D., et al. (2017). Thermo-electrochemical production of compressed hydrogen from methane with near-zero energy loss. Nat. Energy 2 (12), 923–931. doi:10.1038/s41560-017-0029-4
Marangio, F., Massimo, G. L. S., and Calì, M. (2009). Theoretical model and experimental analysis of a high pressure PEM water electrolyser for hydrogen production. Int. J. Hydrogen Energy 34 (3), 1143–1158. doi:10.1016/j.ijhydene.2008.11.083
Momma, A., Takano, K., Tanaka, Y., Kato, T., and Yamamoto, A. (2013). Experimental investigation of the effect of operating pressure on the performance of SOFC and SOEC. ECS Trans. 57, 699–708. doi:10.1149/05701.0699ecst
Ni, M., Michael, K., Leung, H., and Leung, D. Y. C. (2007). Parametric study of solid oxide steam electrolyzer for hydrogen production. Int. J. Hydrogen Energy 32 (13), 2305–2313. doi:10.1016/j.ijhydene.2007.03.001
Nikodemski, S., Tong, J., and O’Hayre, R. (2013). Solid-state reactive sintering mechanism for proton conducting ceramics. Solid State Ion. 253, 201–210. doi:10.1016/j.ssi.2013.09.025
O’Brien, (2012). High temperature electrolysis pressurized experiment design, operation, and results. Technical report.
Jensen, S. H., Hauch, A., Hendriksen, P. V., Mogensen, M., Bonanos, N., and Jacobsen, T. (2007). A method to separate process contributions in impedance spectra by variation of test conditions. J. Electrochem. Soc. 154, B1325. doi:10.1149/1.2790791
Jensen, S. H., Sun, X., Ebbesen, S. D., Knibbe, R., and Mogensen, M. (2010). Hydrogen and synthetic fuel production using pressurized solid oxide electrolysis cells. Int. J. Hydrogen Energy 35 (18), 9544–9549. doi:10.1016/j.ijhydene.2010.06.065
Sumi, H., Shimada, H., Yamaguchi, Y., Mizutani, Y., Okuyama, Y., and Amezawa, K. (2021). Comparison of electrochemical impedance spectra for electrolyte-supported solid oxide fuel cells (sofcs) and protonic ceramic fuel cells (pcfcs). Sci. Rep. 11, 10622. doi:10.1038/s41598-021-90211-9
Sun, X., Bonaccorso, A. D., Graves, C., Ebbesen, S. D., Jensen, S. H., Hagen, A., et al. (2015). Performance characterization of solid oxide cells under high pressure. Fuel Cells 15, 697–702. doi:10.1002/fuce.201500020
Talic, B., Molin, S., Hendriksen, P. V., and Lein, H. L. (2018). Effect of pre-oxidation on the oxidation resistance of crofer 22 apu. Corros. Sci. 138, 189–199. doi:10.1016/j.corsci.2018.04.016
Vøllestad, E., Strandbakke, R., Tarach, M., Catalan-Martinez, D., Fontaine, M-L., Beeaff, D., et al. (2019). Mixed proton and electron conducting double perovskite anodes for stable and efficient tubular proton ceramic electrolysers. Nat. Mat. 18, 752–759. doi:10.1038/s41563-019-0388-2
Wang, R., Sun, Z., Lu, Y., Gopalan, S., Basu, S. N., and Pal, U. B. (2020). Comparison of chromium poisoning between lanthanum strontium manganite and lanthanum strontium ferrite composite cathodes in solid oxide fuel cells. J. Power Sources 476, 228743. doi:10.1016/j.jpowsour.2020.228743
Yang, Y., Tong, X., Hauch, A., Sun, X., Yang, Z., Peng, S., et al. (2021). Study of solid oxide electrolysis cells operated in potentiostatic mode: Effect of operating temperature on durability. Chem. Eng. J. 417, 129260. doi:10.1016/j.cej.2021.129260
Zhu, H., Ricote, S., Duan, C., O’Hayre, R. P., and Kee, R. J. (2018). Defect chemistry and transport within dense BaCe0.7Zr0.1Y0.1Yb0.1O3−δ (BCZYYb) proton-conducting membranes. J. Electrochem. Soc. 165 (10), F845–F853. doi:10.1149/2.1091810jes
Zhu, H., Ricote, S., Duan, C., O’Hayre, R. P., Tsvetkov, D. S., and Kee, R. J. (2018). Defect incorporation and transport within dense BaZr0.8Y0.2O3−δ(BZY20) proton-conducting membranes. J. Electrochem. Soc. 165 (9), F581–F588. doi:10.1149/2.0161809jes
Zhu, H., Ricote, S., and Kee, R. J. (2022). Faradaic efficiency in protonic-ceramic electrolysis cells. J. Phys. Energy 4 (1), 014002. doi:10.1088/2515-7655/ac3729
Keywords: pressurized electrolysis, protonic ceramics, H 2 production, SOEC, SOFC
Citation: Herradon C, Le L, Meisel C, Huang J, Chmura C, Kim YD, Cadigan C, O’Hayre R and Sullivan NP (2022) Proton-conducting ceramics for water electrolysis and hydrogen production at elevated pressure. Front. Energy Res. 10:1020960. doi: 10.3389/fenrg.2022.1020960
Received: 16 August 2022; Accepted: 05 September 2022;
Published: 06 October 2022.
Edited by:
Rahul R. Bhosale, Qatar University, QatarReviewed by:
Ling Zhao, China University of Geosciences Wuhan, ChinaLiangdong Fan, Shenzhen University, China
Copyright © 2022 Herradon, Le, Meisel, Huang, Chmura, Kim, Cadigan, O’Hayre and Sullivan. This is an open-access article distributed under the terms of the Creative Commons Attribution License (CC BY). The use, distribution or reproduction in other forums is permitted, provided the original author(s) and the copyright owner(s) are credited and that the original publication in this journal is cited, in accordance with accepted academic practice. No use, distribution or reproduction is permitted which does not comply with these terms.
*Correspondence: C. Herradon, cherradon@mines.edu; N.P. Sullivan, nsulliva@mines.edu