Integration of non-energy among the end-use demands of bottom-up whole-energy system models
 Xavier Rixhon1
  Davide Tonelli1*
  Martin Colla1,2
  Kevin Verleysen2
  Gauthier Limpens1
  Hervé Jeanmart1
  Francesco Contino1*
- 1Institute of Mechanics, Materials and Civil Engineering, UCLouvain, Ottignies-Louvain-la-Neuve, Belgium
- 2Fluid and Thermal Dynamics, Vrije Universiteit Brussel, Brussels, Belgium
The complexity of bottom-up energy system models has progressively grown to enhance the representativeness of the system under analysis. Among them, whole-energy system models aim at representing the energy resources, conversion technologies, and energy demands of regions (i.e., a country) in its entirety. Despite this effort leading to an increased number of conversion processes modeled, the typologies of the end-use demand have remained limited to three categories: electricity, heat, and transportation. A fourth category, herein addressed as the non-energy demand, has widely been neglected. Being associated with the production of chemicals (i.e., plastics and fertilizers), the non-energy demand represents 10% of the world’s total end-use demand. Its relevance becomes fundamental in analyses that define the optimal defossilization pathways of energy systems with high dependence on fossil resources. This contribution introduces a schematic representation of the conversion processes involved in the satisfaction of the non-energy demand. Through its implementation in a bottom-up whole-energy system model, it evaluates the impact of this additional end-use in the configuration of the optimal energy system. In this study, the Belgian energy system, characterized by a penetration of the chemical and the petrochemical industries up to 20% of its total end-use demand, is taken as a reference case. The transition to a defossilized energy system is enforced through a snapshot analysis with a progressively more restrictive emissions cap. The results emphasize the role of renewable carriers (i.e., methanol and ammonia) in the defossilization of the energy system, otherwise hindered when the non-energy demand is neglected. The 100% import of these carriers at the lowest emissions cap highlights the potential dependence of the country under analysis, with limited availability of renewable resources, from countries exporting renewable methanol and ammonia.
1 Modeled end-use demands and non-energy demand definition
1.1 End-use demands in whole-energy system models
Among the wide variety of energy system models, a subclass concerns the investigation of the optimal energy supply system to satisfy the demand forecast of an entire country. Whole-energy system models include a wide number of conversion processes for the satisfaction of the energy demand for heat, electricity, mobility, and the production of goods (Contino et al., 2020). Despite being a significant contributor to global emissions (7%), the latter category, herein referred to as the non-energy demand (NED), has widely been neglected among whole-energy system models (Tsiropoulos et al., 2018). The non-energy demand represents about 10% of the global final energy consumption (IEA, 2020) and consists of fossil resources (i.e., petroleum products, natural gas, and coal) employed in the production of goods like plastics, fertilizers, and bitumen (IEA, 2018). Plastics in particular have experienced a production rise of more than tenfold in the last 25 years, while steel production has experienced only a threefold increase (IEA, 2018). The International Energy Agency estimates that the non-energy demand will continue to increase up to represent one-third of the oil demand in 2030 (IEA, 2018). Despite the expected growth and the non-negligible associated emissions, the non-energy demand has been widely excluded from bottom-up whole-energy system models. Three main reasons can be recognized behind such a decision: (i) the lack of statistical data for the modeling of the associated conversion processes (Weiss et al., 2008), (ii) the inconsistent definitions and methodologies in data collection, and (iii) the overall high complexity in the flows of materials and molecules involved. Indeed, in some conversion processes, some feedstocks can be used both as raw material for the production of chemical products and as fuels to satisfy part of the energy requirements of the process (Daioglou et al., 2014).
As highlighted in Table 1, to the knowledge of the authors, Daioglou et al. (2015) and Tsiropoulos et al. (2018) are the only studies that integrate the NED in an energy models, TIMER and MARKAL-NL-UU, respectively. However, both studies focus on biomass and their analyses do not take into consideration a transition of the whole-energy system toward carbon neutrality.
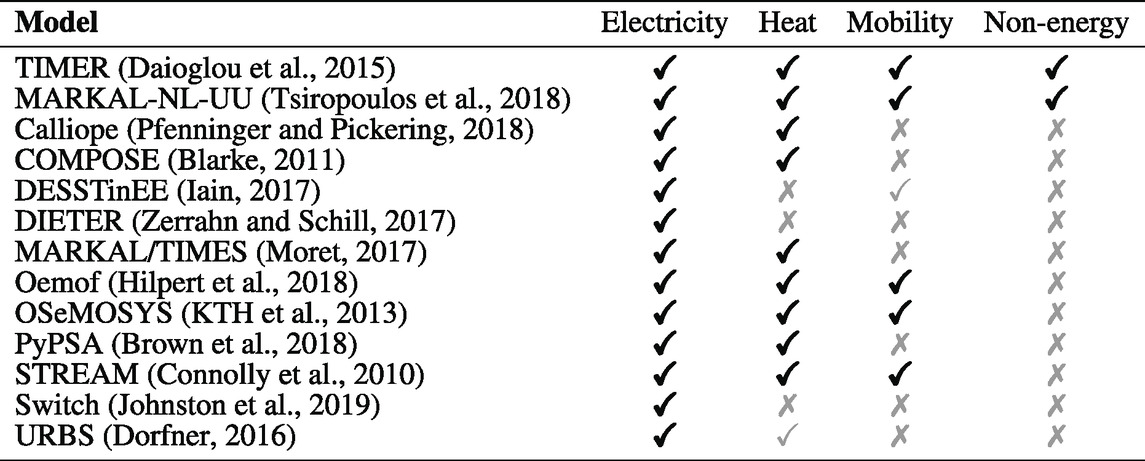
TABLE 1. Comparison of the energy sector accounted for in existing models for the large-scale system design. Legend: ✓criterion satisfied; ✓criterion partially satisfied; ✗ criterion not satisfied.
This study aimed at providing a framework for the integration of the non-energy demand in bottom-up whole-energy system models by collecting the conversion processes involved in the production of the final molecules of this end-use. To this purpose, a schematic representation of the conversion processes involved is presented and integrated into the open-source model EnergyScope TD (ESTD) (Limpens et al., 2019). The impact of the NED is studied based on a case study of the Belgian energy system in 2035 whose defossilization is analyzed based on a snapshot analysis with a progressive limitation of the total amount of greenhouse gas emissions.
In the following, Subsection 1.2 defines the non-energy demand with reference to its historical evolution both at a worldwide level and in the Belgian energy system.
1.2 Non-energy end-use demand
According to Eurostat (2019), the non-energy demand collects the “energy products used as raw materials in different sectors, not consumed as a fuel or transformed into another fuel.” This energy consumption currently represents the largest globally aggregated industrial consumption and is dominated by petroleum products, natural gas, and coal (IEA, 2018). It represents about 10% of the global final energy consumption (IEA, 2020). The non-energy demand is mainly associated with the chemical sector, composed of (i) high-value chemicals (HVCs), (ii) methanol, (iii) ammonia, and (iv) other products (IEA, 2018). Together, the feedstocks for the production of these products covers 90% of the total non-energy demand (IEA, 2018). The remaining 10% is composed of other feedstocks used to produce bitumen or lubricants. HVCs, ammonia, and methanol are mainly produced from dedicated processes, but approximately 30% of them, especially the HVCs, are obtained as by-products of refineries and processes based on coke ovens (IEA, 2018). In this study, we only focus on dedicated production processes and excluded the by-products of refineries, as in (IEA, 2018).
HVCs, with a global production of 365 Mt/year, represent the biggest group. They gather light olefins (i.e., ethylene, propylene) and aromatics (i.e., benzene, toluene, and xylene (BTX)), mainly used in the production of plastics, synthetic fibers, or rubber. The production of HVCs today relies on petroleum products such as naphtha, ethane, or liquefied petroleum gas. In 2017 the Asia-Pacific region has covered nearly half of the global demand of HVCs, which is expected to grow up to 300 Mt/year by 2050 in this region (IEA, 2018). The total demand for HVCs is foreseen to grow by around 60% by 2050 (reference scenario of (IEA, 2018)). Plastics are foreseen to remain the dominant driver for this growth, with packaging and construction plastics being the main end-uses. The Middle-East region is also foreseen to significantly increase its production of HVCs, overtaking the European production, which instead is forecast to decrease from around 50 Mt/year in 2017 to around 40 Mt/year in 2050 (IEA, 2018).
Methanol has a global demand of 100 Mt/year and is mainly converted to formaldehyde (resin), but is also used for the production of other chemicals (i.e., HVCs, solvents, and gasoline blends). Currently, its synthesis relies on natural gas via steam methane reforming. Methanol consumption is expected to experience a growth rate of almost 100% by 2050 (IEA, 2018) with the Asia-Pacific region driving the growth rate. This significant growth is mainly driven by the use of methanol for the production of fuel additives and by intermediate molecules for the production of HVCs. Fuel additives represent around 40% of the global demand for methanol; however, since this final use is included in the definition of fuels, it is excluded from the non-energy demand. Nonetheless, methanol as an intermediate molecule to produce HVCs is included in the non-energy demand.
Ammonia is mainly used for the production of fertilizers, which cover more than 80% of its use. On a global scale, its production sums up to 185 Mt/year with feedstocks mainly composed of natural gas (NG). Demand forecasts for ammonia show a growth of 30% by 2050, which is lower than that for HVCs and methanol (IEA, 2018). This is related to a stagnating demand for nitrogen fertilizers in developed countries and an increase in the efficiency of fertilizer applications in developing countries (IEA, 2018). Although Asia-Pacific remains the main producer of ammonia in the world, its production is better geographically distributed than HVCs. Developing countries are expected to achieve most of the projected increase by 2050 (IEA, 2018).
The last category includes bitumen, coal tar, and other oil products. Despite being part of the non-energy demand by definition, in the following, this category is neglected. Bitumen and coal tar represent only two marginal components of the current non-energy demand and their impact is expected to be negligible compared to other categories. Other oil products consist of by-products from refineries that in a perspective of defossilization can hardly be reused for the production of carbon-neutral energy carriers.
The rest of the study is structured as follows. Section 2 defines the conversion technologies and provides a schematic representation for implementation in bottom-up whole-energy system models. It introduces the optimization problem and summarizes the derivation of the input data used in the case study. Section 3 presents the results of the application to the Belgian energy system. Finally, Section 4 summarizes the main reasons behind this contribution and connects them to key considerations on the impact of the non-energy demand.
2 Technology models and case study
2.1 Conversion technologies
For the sake of providing a simplified, but sufficiently accurate implementation of the conversion technologies into a generic bottom-up model, only three of the four categories included in the definition of the non-energy demand (Subsection 1.2) are considered: (i) HVCs, (ii) methanol, and (iii) ammonia. Figure 1 illustrates the different conversion processes to produce the molecules of the NED according to the standard adopted in the open-source whole-energy system model EnergyScope TD (Limpens et al., 2020). Similarly to Tsiropoulos et al. (2018), naphtha resulting from refinery operation is modeled as an imported commodity. The implementation of the conversion technologies consists of a single technology per resource, producing one single product. As an example, the production of HVCs can use five different feedstocks (resources) for which five independent conversion technologies are modeled. Details of each conversion process are provided in Table 2 and Table 3 with respect to the price of the resources, the efficiency, and the investment cost of the conversion technologies. All data and related references can be found in https://energyscope-td.readthedocs.io/en/master/index.html. Among the resources, ammonia and methanol can either be produced locally or directly imported. In both cases, these resources will be identified as renewable (RE) or nonrenewable (NRE), depending on the resources used for their production.
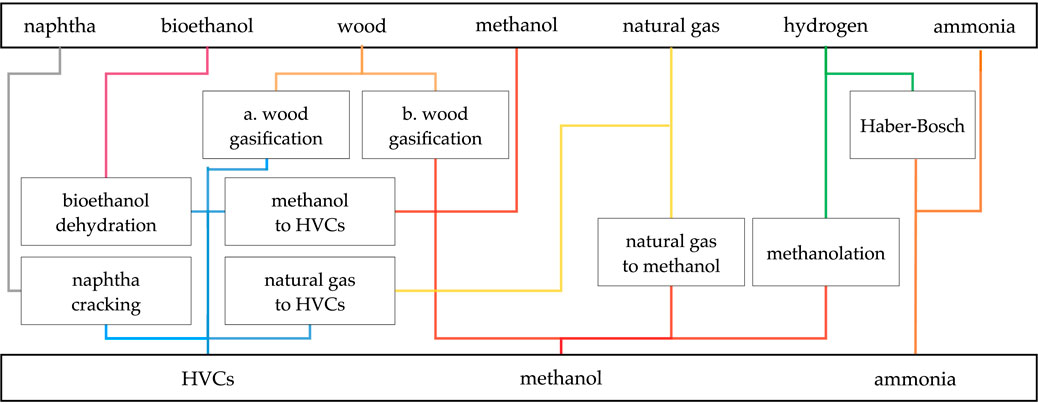
FIGURE 1. Schematic representation of the models of the conversion technologies used to represent the non-energy end-use demand. Details of the price of the resources can be found in Table 2. The efficiency and the investment cost of each conversion technology are reported in Table 3. In the study, “wood” and “woody biomass” are used with no distinctions.
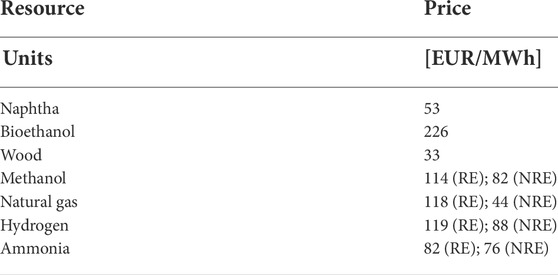
TABLE 2. Prices of the resources input to the conversion technologies represented in Figure 1 for the satisfaction of the non-energy demand. “RE” refers to the resource produced from renewables, while “NRE” to a production based on fossil resources. The values of the carbon intensity per typology of resource and the references of the values provided can be found in Limpens (2021).
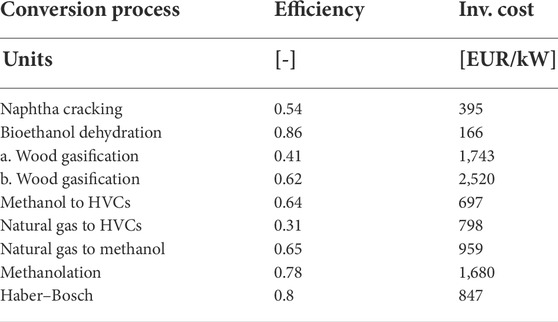
TABLE 3. Investment cost and efficiency of the conversion processes represented in Figure 1 for the satisfaction of the non-energy demand. References to the values provided can be found in Limpens (2021).
2.2 Optimization model
This study is based on the open-source, bottom-up whole-energy system model EnergyScope TD. The model has been formulated as linear programming (LP) and has already been applied to large-scale problems in energy system optimization (Limpens and Jeanmart, 2018; Limpens et al., 2019, 2020). Since this study builds upon a previously released version of ESTD, the interested reader can find a complete description of the model in Limpens et al. (2019).
The model is formulated as a “snapshot” model with a single objective function associated to the total cost of the system c. The total cost is expressed as the sum of the yearly cost of installation
where
•
•
Among the constraints, a maximum threshold over the allowed emissions (e) is enforced to limit the yearly emissions and study the transition toward a renewable system. In the model, the emissions of the system are expressed as global warming potential (GWP) and computed as the sum of the yearly emissions per resource associated with the operation of all the technologies
In the equation, emax is an exogenous parameter representing the emissions cap. A 100% emissions scenario is associated with the case when Eq. 2 is not binding. A progressive reduction of the maximum allowed emissions affects the results of the optimization problem through the selection of the conversion processes whose carbon intensity depends on their input resources. The scenario of 0% emissions determines a fully renewable system. The emissions are computed based on the primary resources necessary for the supply of the end-uses. Due to the possibility of temporarily storing the carbon in the form of final molecules (except for carbon-free ammonia), this approach might overestimate the total global warming potential (GWP) of the system, resulting in a conservative estimation. However, since the carbon stored in the molecules will finally be released (Neelis et al., 2005), in the snapshot approach used in this study, the emissions are considered only once at the point of manufacturing.
2.3 Case study
The case study considered is the Belgian energy system in 2035 which is halfway through the goal of carbon neutrality by 2050. This means that the system allows setting new policies in the perspective of reaching carbon neutrality while using known technologies.
The model has to satisfy the end-use demands of Belgium, grouped into four categories: electricity, heat, mobility, and non-energy. To meet these demands, the system relies on 24 resources which can be locally available from renewables (wind, solar, and biomass), imported but produced from renewables (green hydrogen, renewable methanol, and renewable ammonia), or imported as fossil fuels (gasoline, naphtha, and natural gas). These resources are converted through a set of technologies into different carriers to meet the end-use demands: electricity (9 technologies), heat (31 technologies), passenger and freight transport (20 technologies), and non-energy (11 technologies). Moreover, 20 infrastructure technologies are implemented to account for the power grid, the district heating networks, and the production of intermediate energy carriers not directly satisfying the end-use demand. Finally, the model includes 21 technologies to store electricity, heat, and fuels. Although the model may be applied to other countries, its accuracy has previously been tested on the Belgian energy system in 2035 (Limpens et al., 2020). The previous version of ESTD considered the non-energy demand being supplied either by natural gas or light fuel oils (LFO). To minimize the total cost of the system, the model simply selected the cheapest between the two resources (i.e., natural gas). The upgraded version used for this study includes the conversion processes to satisfy the non-energy demand as described in Figure 1.
Belgium is a major producer of plastic raw materials, of which 60% are exported abroad (Agoria and essenscia, 2019). The evolution of its demand of HVCs is dependent on the new regulations which aim at improving recycling and limiting the single-use of plastics (European Commission, 2019). The demand of HVCs estimated and used in this study is based on the assumption that the industrial activity of the country will remain at the rate of today till 2035. This estimation excludes also the future potential increase in net imports of HVCs as traded commodities. The current consumption of naphtha and LPG for non-energy use and as energy carriers in the chemical and petrochemical industries is converted into the demand of HVCs based on the respective efficiencies of 1.83 tnaphtha/tHVCs and 1.67 tLPG/tHVCs (IEA, 2018). This leads to an estimation of 3,069 kt in the current demand of HVCs independently of the specific chemicals included (i.e., ethylene, propylene, and BTX).
No production plant of methanol currently exists in Belgium, even if the country plays a role in trading this carrier between its neighboring countries, while consuming part of the import. This study solely considers the net import of methanol (i.e., import minus export). The estimation of the methanol demand is considered equal to 51% of its net import, which is the share used for formaldehyde production according to the Methanol Institute and the MMSA (Methanol Market Services Asia, 2016), amounting to 269 kt. The rest of the methanol is used for energy purposes, mostly MTBE in gasoline blending.
Concerning ammonia, the local production and import of this carrier is higher than its export. Based on the database (United Nations - Climate change, 2020) and the data of the National Bank of Belgium, Belgium results to have imported, exported, and locally produced on average 1,010 kt, 105 kt, and 990 kt of ammonia, respectively. Similarly to methanol, on top of the local production, the net import is also included in the non-energy demand. This results in the estimation of the current demand of 1,895 kt of ammonia.
Given the historical stability of the non-energy demand, the NED in 2035 has been assumed to increase by only 3% between 2020 and 2035, according to the European Commission (Capros et al., 2016). Table 4 summarizes the values of the non-energy demand set in the model of the Belgian energy system in 2035.
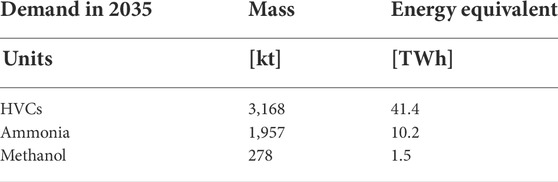
TABLE 4. Non-energy demand set in the model of the Belgian energy system in 2035. The demand associated with each product is expressed based on the respective LHV: HVCs −47 MJ/kg, ammonia −18.8 MJ/kg, and methanol −19.9 MJ/kg.
3 Results
As expected from the inclusion of an additional end-use demand, Figure 2 (left) shows an increase in the consumption of resources, independently of the constraint on emissions. It is noteworthy that up to 50% of emissions reduction, the additional demand in primary energy is mainly composed of fossil resources (more than 50% of the total primary energy). Apart from the minor increase in the use of the local renewable primary energy, the substantial replacement of the additional import of fossil resources used at low values of the emissions cap to satisfy the non-energy demand is based on the increase in the import of renewable carriers. The limited increase in the use of local resources is mainly due to the complete exploitation of these resources from end-uses different from the non-energy demand.
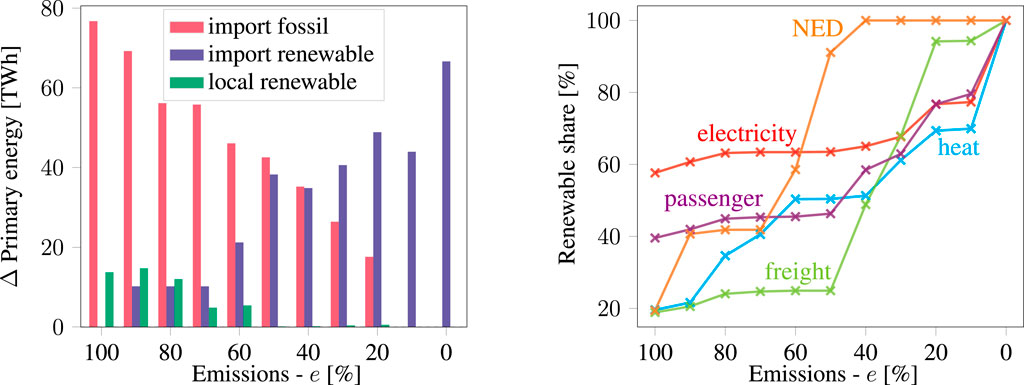
FIGURE 2. (Left) Difference in terms of primary energy consumed between the model with and without the non-energy demand among the end-uses that the optimization has to satisfy. The primary energy demand is split into energy imported via fossil-based resources (import fossil), energy imported produced with renewable resources (import renewable), and energy produced based on the local availability of renewable resources (local renewable). (Right) Share of renewable resources per end-use demand.
When compared to other end-use demands, the non-energy demand is the most fossil-based end-use, as presented in Figure 2 (right). In the scenario with no emissions cap (e = 100%), only 20% of its energy demand is satisfied through renewable resources. With a progressive reduction of the emissions cap, the non-energy demand experiences the steepest increase in the share of renewable resources exploited for its production. This trend is maintained even at higher constraints in emissions, making it the first end-use demand produced by 100% renewable resources already at a level of 40% emissions allowed. This result is particularly relevant if contextualized within the class of whole-energy system optimization models for pathway analyses. If NED is not included among the end-use demand, other end-uses could be prioritized in a timeline for defossilization, since only in the case of full-defossilization (e = 0%), all the end-uses are expected to be fully satisfied with renewable energy. At intermediate stages of defossilization (40% ≤ e ≤ 70%), the increase in the share of renewable energy for the non-energy demand can bring more benefits in terms of emissions avoided per unit of investment than any other end-use demand. Despite its significance, this result can be dependent on the method used to account for the emissions of the NED. This study follows the most conservative approach with the inclusion of the emissions as if immediately released, independently of the lifetime of the final products. Other accounting methods separate the carbon stored from the carbon released, reducing the number of emissions per feedstock.
In terms of differences in the optimal combination of technologies, Figure 3 presents the discrepancy in technologies involved for electricity (left) and high-temperature heat (right) production when the non-energy demand is included and when not. In the case when NED is not modeled, the design of the system includes a higher supply of electricity and heat based on combined cycle gas turbines (CCGTs) and boilers, respectively. In particular, CCGTs are fueled with natural gas at the lowest emissions caps and with renewable ammonia at the highest, while boilers are fed by woody biomass to a large extent. The inclusion of the NED leads to an increase in the use of combined heat and power (CHP) for the simultaneous production of both electricity and heat. The higher investment cost of CHP is justified by the higher efficiency in the combined production of electricity and heat and the lower cost compared to the independent installation of CCGTs and additional boilers, following the higher demand of high-temperature heat related to NED. It must be noticed that the switch from boilers to CHP is only related to the supply of high-temperature heat demand for the industry. In such a case, the cost of installation does not involve any heating distribution network since the production is assumed to be centralized at the location of the industrial plant. Minor differences involve a higher installation of PVs for (60% ≤ e ≤ 80%) and a higher import for e = 10% in the supply of electricity when NED is included, while the supply of heat involves a higher use of boilers for e = 80% and a limited use of electrical resistors for (20% ≤ e ≤ 80%) when NED is included.
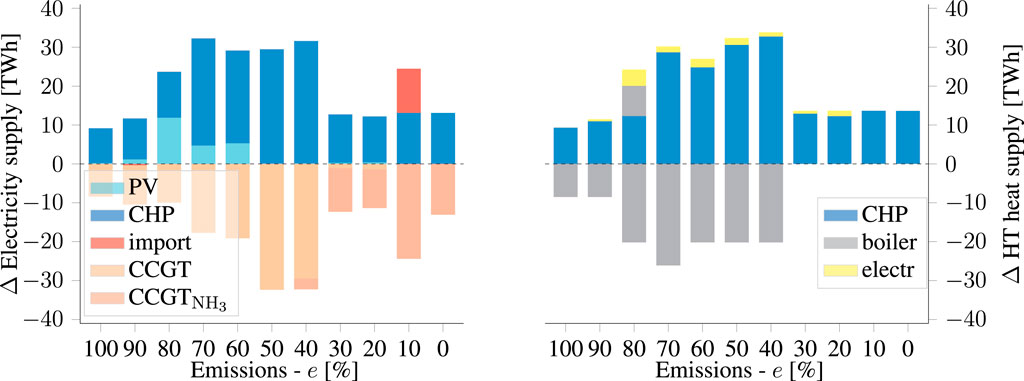
FIGURE 3. Impact of the non-energy demand on the technologies selected for the electricity supply (left) and the high-temperature (HT) heat supply (right). The y-axis represents the difference in energy supplied per technology. In the legend, “electr” refers to the electrical resistor.
Figure 4 presents the technologies involved in satisfying the non-energy demand per category: HVCs (left) and methanol (right). Ammonia is not included since its share in the non-energy demand is fully covered by the import of renewable ammonia for any percentage of emissions reduction e ≤ 90%. In production of HVCs, at low emissions reduction (60% ≤ e ≤ 100%), naphtha is the main resource used through the process of naphtha steam cracking, with a contribution of wood gasification limited to a maximum of 20% of the production for 80% ≤ e ≤ 100%. The complete switch from nonrenewable to renewable imported ammonia and the use of wood gasification are the two main drivers for the increase in the renewable share between the 100% and the 90% scenarios in the NED (Figure 2). For higher emissions reduction (0% ≤ e ≤ 50%), methanol is the main resource to satisfy the HVCs demand, where the typology of methanol used is imported renewable methanol. As in Figure 4 (right), the main resource used for methanol production is woody biomass via wood gasification for emissions reductions higher than 40% (60% ≤ e ≤ 100%). For lower emission caps, i.e., 0% ≤ e ≤ 50%, the methanol demand is predominantly satisfied by the direct import of renewable methanol (“import renewable”), while the woody biomass is used for other final uses in the system (e.g., industrial heat).
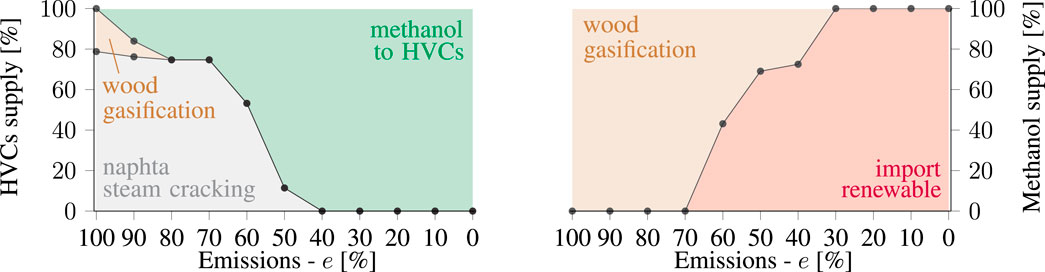
FIGURE 4. Breakdown of the typology of conversion processes used in the supply of the non-energy demand of HVCs (left) and methanol (right).
4 Conclusion
This study was conceived with the realization that a significant portion of energy demand associated with the production of goods such as fertilizers and plastics has been ignored among a large number of bottom-up energy system models used in the energy system design. Despite acknowledging that an increase in model complexity should always be justified by the specific research questions addressed, this contribution aims at providing evidence of the impact that such an omission can determine on the final design of the energy system.
Beyond the traditionally modeled end-use demands of electricity, mobility, and heat, a fourth end-use demand, defined as non-energy (NED), was described through its three main categories of HVCs, methanol, and ammonia. The NED is implemented in the bottom-up whole-energy system model EnergyScope TD and applied to the case study of the Belgian energy system in 2035. The impact of this additional demand is evaluated by comparing the results of the same model with and without the inclusion of the non-energy demand among the end-uses. Different scenarios are considered based on the imposition of a cap that progressively limits the emissions of the system from 100% to 0% by steps of 10 percentage points. In the case of the two extreme emissions scenarios of e = 100% and e = 0%, the non-energy demand implies only an additional use of resources to satisfy the energy demand of HVCs, ammonia, and methanol production through specific conversion processes. However, under intermediate emissions caps (10% ≤ e ≤ 90%), including the NED affects the selection of the technologies for the satisfaction of the heat and the electricity demand and influences the prioritization of the steps to achieve the complete defossilization. If the share of renewable production per end-use energy is interpreted as a proxy of the priority of defossilization, the non-energy end-use demand is the end-use with the highest priority for emissions reduction of up to 40% of the total emissions.
In terms of the role of renewable resources and carriers employed in the defossilization of the energy end-uses, the inclusion of the NED gives renewable methanol and ammonia a primary role. Methanol in particular results to be the key molecule to supply the NED based on the conversion of methanol to olefins for the production of renewable HVCs. Given the limited renewable potential of Belgium, renewable methanol and ammonia cannot be produced locally, and they imply an increase in the import of renewable carriers from abroad.
According to the definition of NED consistently used in this study, the consumption of molecules in refining industries for fuel production is not included in the proposed end-use demand. Since the molecules used (like hydrogen) represent a shared carrier in the satisfaction of different types of end-use demands, a gap remains in the definition of models for its implementation as end-use demand. Future works should identify the main conversion processes of refining industries and propose a schematic representation of the technologies involved to allow their implementation in bottom-up whole-energy system models.
Data availability statement
The original contributions presented in the study are included in the article/supplementary material; further inquiries can be directed to the corresponding authors.
Author contributions
XR: conceptualization, software, methodology, visualization, and writing—original draft; DT: conceptualization, visualization, and writing—original draft and final version; MC: conceptualization, methodology, writing—original draft, and review; KV: methodology and review; GL: conceptualization and software; HJ: supervision and review; FC: supervision and review.
Funding
With the support of the Energy Transition Fund—FPS Economy.
Conflict of interest
The authors declare that the research was conducted in the absence of any commercial or financial relationships that could be construed as a potential conflict of interest.
Publisher’s note
All claims expressed in this article are solely those of the authors and do not necessarily represent those of their affiliated organizations, or those of the publisher, the editors, and the reviewers. Any product that may be evaluated in this article, or claim that may be made by its manufacturer, is not guaranteed or endorsed by the publisher.
References
Agoria & essenscia (2019). The belgian plastics industry and the circular economy. Available at: https://www.essenscia.be/wp-content/uploads/2019/11/Plast_BROCH_A5_HR.pdf.
Blarke, M. (2011). Compose. Available at: http://www.energianalyse.dk/index.php/software.
Capros, P., De Vita, A., Tasios, N., Siskos, P., Kannavou, M., Petropoulos, A., et al. (2016). EU reference scenario 2016 - energy, transport and GHG emissions trends to 2050.
Connolly, D., Lund, H., Mathiesen, B. V., and Leahy, M. (2010). A review of computer tools for analysing the integration of renewable energy into various energy systems. Appl. Energy 87, 1059–1082. doi:10.1016/j.apenergy.2009.09.026
Contino, F., Moret, S., Limpens, G., and Jeanmart, H. (2020). Whole-energy system models: The advisors for the energy transition. Prog. Energy Combust. Sci. 81, 100872. doi:10.1016/j.pecs.2020.100872
Daioglou, V., Faaij, A. P., Saygin, D., Patel, M. K., Wicke, B., van Vuuren, D. P., et al. (2014). Energy demand and emissions of the non-energy sector. Energy Environ. Sci. 7, 482–498. doi:10.1039/c3ee42667j
Daioglou, V., Wicke, B., Faaij, A. P., and Van Vuuren, D. P. (2015). Competing uses of biomass for energy and chemicals: Implications for long-term global co2 mitigation potential. Gcb Bioenergy 7, 1321–1334. doi:10.1111/gcbb.12228
Dorfner, J. (2016). “Open source modelling and optimisation of energy infrastructure at urban scale,”. Ph.D. thesis (München, Germany: Technische Universität München).
European Commission (2019). European strategy for plastics. Brussels: European Commission. https://ec.europa.eu/environment/waste/plastic_waste.htm.
Hilpert, S., Kaldemeyer, C., Krien, U., Günther, S., Wingenbach, C., Plessmann, G., et al. (2018). The open energy modelling framework (oemof)-a new approach to facilitate open science in energy system modelling. Energy strategy Rev. 22, 16–25. doi:10.1016/j.esr.2018.07.001
IEA (2018). The future of petrochemicals – analysis. Paris, France: IEA. Available at: https://www.iea.org/reports/the-future-of-petrochemicals.
Johnston, J., Henriquez-Auba, R., Maluenda, B., and Fripp, M. (2019). Switch 2.0: A modern platform for planning high-renewable power systems. SoftwareX 10, 100251. doi:10.1016/J.SOFTX.2019.100251
Limpens, G., and Jeanmart, H. (2018). Electricity storage needs for the energy transition: An EROI based analysis illustrated by the case of Belgium. Energy 152, 960–973. doi:10.1016/j.energy.2018.03.180
Limpens, G., Jeanmart, H., and Maréchal, F. (2020). Belgian energy transition: What are the options? Energies 13, 261. doi:10.3390/en13010261
Limpens, G., Moret, S., Jeanmart, H., and Maréchal, F. (2019). Energyscope TD: A novel open-source model for regional energy systems. Appl. Energy 255, 113729. doi:10.1016/j.apenergy.2019.113729
Limpens, G. (2021). The energyscope model - Input data. Available at: https://energyscope-td.readthedocs.io/en/master/sections/Input%20Data.html#non-energy-demandw.
Methanol Market Services Asia (2016). MMSA supply and demand forecast. Singapore: Methanol Market Services Asia. Available at: https://www.methanolmsa.com/additional-mmsa-services/.
Moret, S. (2017). “Strategic energy planning under uncertainty,” École polytechnique fédérale de Lausanne. Ph.D. thesis (Vaud, Switzerland. doi:10.5075/EPFL-THESIS-7961
Neelis, M., Patel, M., Gielen, D., and Blok, K. (2005). Modelling CO2 emissions from non-energy use with the non-energy use emission accounting tables (NEAT) model. Resour. Conservation Recycl. 45, 226–250. doi:10.1016/j.resconrec.2005.05.003
Pfenninger, S., and Pickering, B. (2018). Calliope: A multi-scale energy systems modelling framework. J. Open Source Softw. 3, 825. doi:10.21105/joss.00825
Tsiropoulos, I., Hoefnagels, R., de Jong, S., van den Broek, M., Patel, M., Faaij, A., et al. (2018). Emerging bioeconomy sectors in energy systems modeling–integrated systems analysis of electricity, heat, road transport, aviation, and chemicals: A case study for The Netherlands. Biofuel. Bioprod. Biorefin. 12, 665–693. doi:10.1002/bbb.1881
United Nations - Climate change (2020). National inventory submissions 2020. Available at: https://unfccc.int/ghg-inventories-annex-i-parties/2020.
Weiss, M., Neelis, M., Zuidberg, M., and Patel, M. (2008). Applying bottom-up analysis to identify the system boundaries of non-energy use data in international energy statistics. Energy 33, 1609–1622. doi:10.1016/j.energy.2008.05.014
Keywords: energy modeling, non-energy demand, chemical industry, defossilization, whole-energy system models
Citation: Rixhon X, Tonelli D, Colla M, Verleysen K, Limpens G, Jeanmart H and Contino F (2022) Integration of non-energy among the end-use demands of bottom-up whole-energy system models. Front. Energy Res. 10:904777. doi: 10.3389/fenrg.2022.904777
Received: 25 March 2022; Accepted: 28 June 2022;
Published: 05 September 2022.
Edited by:
Brian Elmegaard, Technical University of Denmark, DenmarkReviewed by:
Daniel Sneum, Technical University of Denmark, DenmarkI.A. Grant Wilson, University of Birmingham, United Kingdom
Copyright © 2022 Rixhon, Tonelli, Colla, Verleysen, Limpens, Jeanmart and Contino. This is an open-access article distributed under the terms of the Creative Commons Attribution License (CC BY). The use, distribution or reproduction in other forums is permitted, provided the original author(s) and the copyright owner(s) are credited and that the original publication in this journal is cited, in accordance with accepted academic practice. No use, distribution or reproduction is permitted which does not comply with these terms.
*Correspondence: Davide Tonelli, davide.tonelli@uclouvain.be; Francesco Contino, francesco.contino@uclouvain.be