Grid-connected photovoltaic-based microgrid as charging infrastructure for meeting electric vehicle load
 Appalanaidu Chowdary
  Sura Srinivasa Rao*
- Department of Electrical Electronics and Communication Engineering, Gandhi Institute of Technology and Management (Deemed to Be a University), Visakhapatnam, Andhra Pradesh, India
Concerns about charging Infrastructure have arisen as electric vehicles (EVs) gain popularity in the transportation sector. Like gas stations, the charging infrastructure is mainly used to power the EV batteries until they are fully charged. As a result, many alternative options for creating charging stations were explored in the literature. This study proposes a grid-connected photovoltaic-based microgrid for EV charging infrastructure. It has two objectives: to design and model a grid-connected photovoltaic-based microgrid and to analyze a hypothetical EV population charging. While modeling, the realistic EV loads are considered, and the simulation is carried out. Results of this study include the power generation potential from the solar power plant, the energy mix of the microgrid (i.e., grid shared energy and onsite solar generation), and supply and load mismatch relationships. The analysis results include the weather parameter influence on power produced, followed by sensitivity analysis quantifying the impact of scaled EV sessions over microgrid power balances. Overall, it is understood that grid-connected microgrids support the seamless charging of EVs even in the case of uncertainties observed with onsite solar energy generation.
1 Introduction
The growing climate change concerns for various reasons and the associated issues with fossil fuel-based energy have resulted in the decarbonization of the transportation sector. The transportation sector is still responsible for 24% of direct CO2 emissions, mainly attributable to fossil fuel consumption, according to the International Energy Agency (IEA, 2021), suggesting the transition to the use of renewables for mobility. This pressing need sparked e-mobility leading to electric vehicle (EV) manufacturing and deployment in the market. Despite the growing EV adoption, it lags behind the sophisticated and long-term charging infrastructure needed for charging vehicles. As a result, charging stations were installed and powered mainly by the grid, which raised many critiques from technical aspects and contributions to sustainability (Boschmann and Kwan, 2008). The technical aspects include many concerns, for instance, voltage stability, power losses, reliability, and an increase in peak load. These are the significant repercussions on the energy sector. The sustainability-related concerns mainly revolved around the grid energy mix; for instance, a country with a significant share of fossil fuel energy mix powering EVs may not be sustainable (Nallapaneni and Chopra, 2021). At the same time, their participation in energy management and power balancing services may also be not sustainable (Nallapaneni and Chopra, 2021). Considering these raised concerns (Boschmann and Kwan, 2008; Nallapaneni and Chopra, 2021), maintaining energy sustainability was prioritized, leading to the development of renewable-based EV charging infrastructure. As a result, experts started focusing on developing EV charging infrastructure with renewables as power sources.
We conducted a thorough literature review to better understand the progress in the charging station research. Sivadanam et al. (2020a) researched renewable energy sources and concluded that renewable energy could be used for EV charging as the power source in off-grid mode. Singh et al. (2020) used a single voltage source converter combined with the solar photovoltaic (PV) array, a storage battery, the grid, and a diesel generator as EV charging infrastructure power components. Later, with the rise of optimization-influenced decisions, researchers started applying optimization and heuristic methods to improve infrastructure sizing and performance further. For instance, a queuing model for a stochastic optimization issue that incorporates RESs and EV charging stations is investigated by Jin et al. (2014) to understand the viability of the EV charging system. Rezaeimozafar et al. (2017) showed the use of the genetic algorithm and particle swarm optimization to size renewable energy sources integrated EV charging stations. Commercial EV charging infrastructure is also created using an integrated power system approach (Deb et al., 2019). Sivadanam et al. (2020b) investigated the implications of large-scale EV integration into the power system. Later, Podder et al.(2021a) designed the solar plus biogas-based EV charging station to power on-road three-wheeler vehicles in developing nations. They mentioned that integrated renewable energy-based systems are more reliable in powering EVs (Podder et al., 2021b). Osório et al. (2018) proposed an EV charging model that examines the load profile effect on the power system for various EV adoption degrees using traditional. They considered solar PV and wind as the power system component, followed by power conversion devices. According to Osório et al. (2018), integrating 15 EVs raises the load by 2%, whereas integrating 50 EVs increases the load by 7%. The above literature covered the apparent transition of EV charging infrastructure research from planning to performance concerning EV fleet increase in the system. Based on the literature, it is understood that optimal modeling of charging stations considering the scaled averaged session of EVs for charging per day is more important.
Hence, this study’s objectives align with the observed research gap (i.e., optimal modeling per EV fleet). Nevertheless, when we look further at the EV charging infrastructure, the reliable operation may be considered a critical issue. Researchers have proposed numerous options, for instance, energy storage and backup power generators (Das et al., 2020). Hence, in this study, we considered the grid as a support power option. The key contributions of this study include the formulation of a framework that aids in designing a reliable EV charging station and understanding the performance considering two objectives:
• To design and model the grid-connected photovoltaic-based microgrid considering the EV population while minimizing the peak load.
• To analyze the impact of the scaled average session of EV per day over the charging station power source sizing.
This study is structured in four sections. Section 2 presents the framework and methods adopted for modeling. Section 3 presents the discussion of the results, followed by the conclusion and future work in Section 4.
2 Framework and methods
This section presents the framework that aids in designing a reliable EV charging station for meeting the EV population’s load demand without interruption, followed by the proposed system and methodology used for modeling.
2.1 Framework
In Figure 1A, the framework is shown, where a time versus load plot defines the reliable operation of charging Infrastructure, highlighting the need for disrupted load compensation by any power source. Therefore, considering the framework, a charging infrastructure system shown in Figure 1B is considered. This infrastructure has an onsite solar power plant that is used to power the EV charging station and the grid to support reliable operation. Additionally, an energy storage system (ESS) and a power converter unit are used. The PV array and ESS are connected on the direct current bus, the grid and EVs are connected on the alternating current bus side, and a power converter is placed between the direct current and alternating current bus.
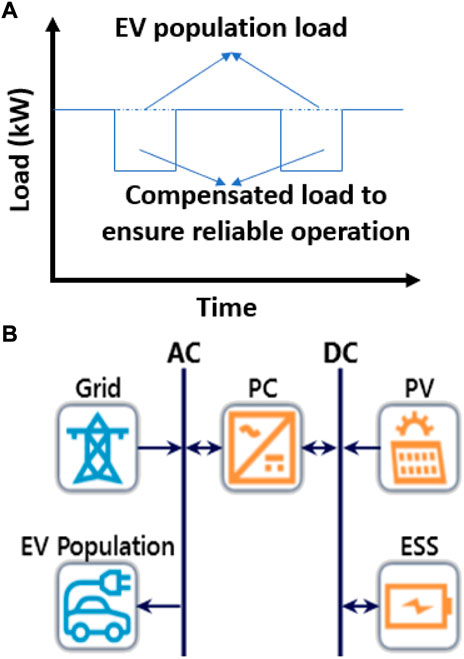
FIGURE 1. (A) Framework to ensure reliable operation of the EV charging station. (B) Schematic representation of proposed grid-connected photovoltaic-based microgrid as EV charging infrastructure.
In order to understand the reliable operation of the proposed charging infrastructure, a power governance function is used as follows:
where
As per Eq. 1, the power is maintained depending upon the reliable operating condition. For instance, the grid would provide support if there were disruptions on the solar PV array side. In all other cases, maximized use of solar PV energy is considered.
2.2 Grid-connected photovoltaic-based microgrid as charging infrastructure
In the below sections, the detailed modeling of individual components of the EV charging station is shown.
2.2.1 Electric vehicle load
An EV population of 100 is considered for this study, with 150 kW as the maximum power required to charge the vehicle, and the average duration of the vehicle charging is 50 min.
2.2.2 Modeling the power source
As shown in Figure 1B, the proposed system has two power sources: the grid and the onsite solar PV power plant. The PV plant’s electric power output is given as follows (Chowdary et al., 2020, Podder et al. (2021b):
where
In solar PV installations, temperature plays a crucial role in power performance. Hence, we considered temperature-influenced power. For evaluating the cell temperature, a model shown in the following equation is used (Kumar et al., 2018; Kumar et al., 2019):
where
2.2.3 Modeling the power converter
A power converter is a device that helps convert the direct current produced by a solar PV array to alternating current and alternating current to direct current to charge the ESS with grid power. Thefollowing equation governs the power converter operation (Kumar et al., 2019; Chowdary et al., 2020).
where
2.2.4 Energy storage system
We modeled the ESS as a charging station, where Eqs 5, 6 govern the charging and discharging patterns of the charging infrastructure based on the EV fleet (Kumar et al., 2018). Here, the number of chargers is 40, with each charger’s capacity of 150 kW (Chowdary et al., 2020):
where
2.3 Optimization method
The proposed system in this study is a grid-connected PV-based microgrid as EV charging infrastructure and is modeled considering Visakhapatnam city as the study location. The solar radiation, clearness index, temperature, and wind speed profiles are considered per the location; see Supplementary Figures S1–S3. Based on the discussed mathematical model in Section 2.2, the system is the preliminary model was modeled in the HOMER Grid tool (Grid, 2022). The peak-shaving strategy used for energy management was modeled in MATLAB 2019 (Mathworks, 2019), which was then coupled to the HOMER Grid optimization tool for further simulation and analysis.
2.3.1 Peak-shaving controller
A peak-shaving controller similar to the load leveling controller is used. The proposed controller proactively manages the EV overall load demand and, while managing it, eliminates the short-term demand spikes; see Figure 2A for a conceptual understanding of the peak-shaving strategy. To implement this strategy, we used the optimization approach that selects the shaving level governed by Eq. 8 while minimizing the optimization function below (Karmiris and Tengnér, 2013).
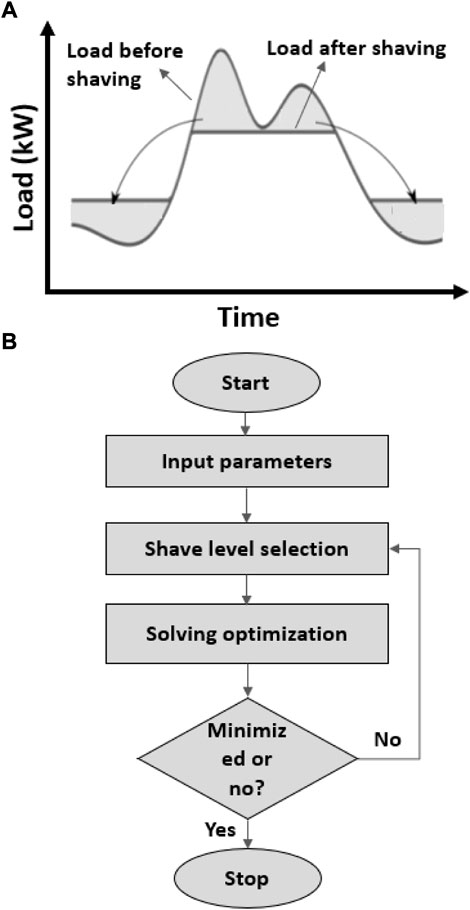
FIGURE 2. (A) Conceptual principle of peak shaving. (B) A simplified optimization approach for peak shaving in electric vehicle charging infrastructure.
Objective function:
Leveling constraints:
Figure 2B shows the flowchart for solving the optimization problem, starting with input parameters selection followed by shave level selection and optimization problem solving, then checking the decision whether the objective function error is minimized or not. If not minimized, it again checks by selecting different shave levels following Eq. 7.
2.3.2 Sensitivity analysis
For any EV charging station, the problem of the number of EVs connected could arise; hence, we considered the number of vehicles that could be connected to the charging station in a day as a sensitive parameter. Based on the visits/hour, the number of vehicles that can be connected to the charging station during the hour is calculated. For this, scaled average sessions/day is considered in the range of 10–40. Additionally, solar irradiation in the given location is considered a sensitive parameter.
3 Results and discussion
This section presents simulated results of the proposed grid-connected microgrid as an EV charging infrastructure. The results include the EV session per day’s influence on the infrastructure design, powerful performance of microgrid, and the impact of scaled EV sessions over microgrid power balances.
3.1 Analysis of the charging station design
Figure 3 represents the EV average visits profile at the charging station on a 24 h time scale. Based on this, the applied sensitive cases of sessions per day varying from 10 to 40 resulted in a considerable impact on the energy served at the charging station. The summary of the session profile and its impacts on energy served and peak demand are provided in Table 1.
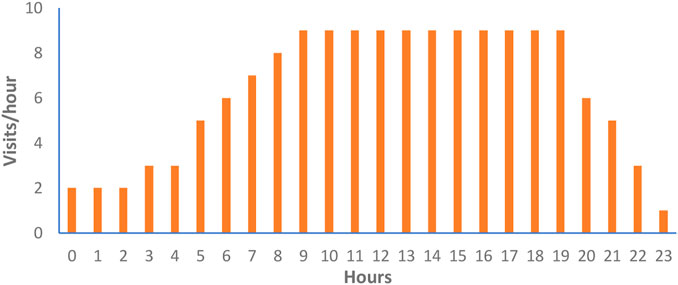
FIGURE 3. Electric vehicle visits profile at the charging station.

TABLE 1. Electric vehicle charging session summary.
Table 1 shows that the observed peak power demand varied from 350 to 840 kW. Furthermore, the energy storage strings required varied from 6 to 19. Table 2 presents the charging station’s ESS properties and results. The nominal capacity is varied from 1,260 to 3,990 kWh. The observed annual throughput varies from 461,042 to 133,213 kWh/yr, whereas the energy losses range between 28,228 and 81,214 kWh/yr.
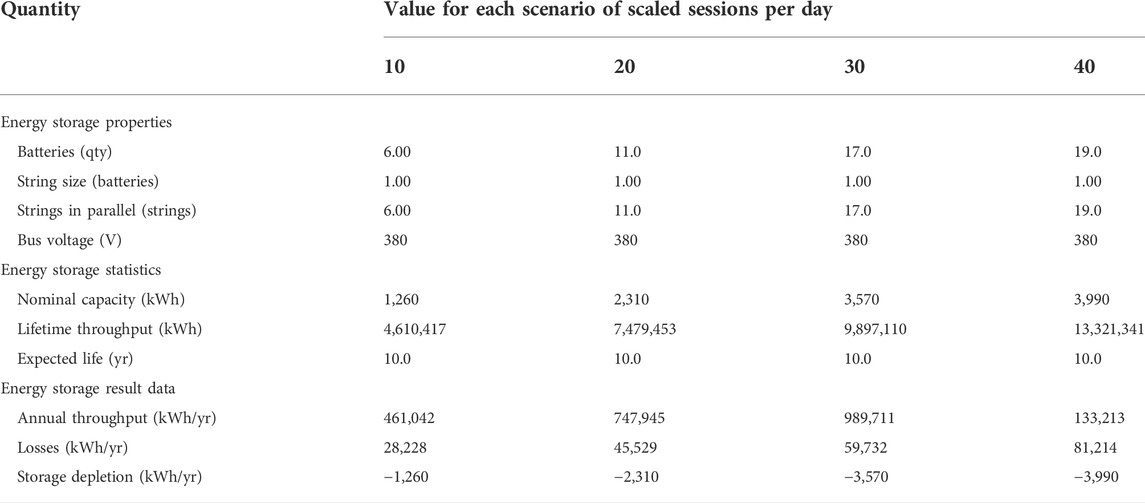
TABLE 2. Energy storage system sizing and energy results.
In Figure 4, the state of charge results is presented. The microgrid system design size also varied to power these varying energy needs. As a result, the component sizing of the microgrid that is believed to serve as a power source for a charging station is affected. Additionally, grid support was considered to ensure reliable operation.

FIGURE 4. The energy storage state of charge in %. as per the scaled average daily sessions. (A) 10, (B) 20, (C) 30, and (D) 40.
3.2 Power performance results of microgrid
The proposed microgrid’s primary power generation source is a solar PV power plant. The grid is a backup that provides and takes energy depending upon the situation of surplus and deficit based on the uncertain operation of solar and load. Figure 5 shows the DMap showing the solar PV power outputs for the whole year. This indicates that the PV plant supplies power to the charging station mostly between 06:10 and 18:00 h on a given day throughout the year with 2%–5% of the hourly variation. However, depending on the scaled session, the required peak capacity of the solar power plant varied; see Figures 5A–D. The observed mean power output from the solar power plant is varied between 2,592 and 4,753 kWh/day, depending on the peak installed capacities. The average capacity factor of the photovoltaic plant is observed to be 18%. The total operating hours of the photovoltaic power plant is 4,343 h/y based on the incident solar radiation (i.e., 5.07 kWh/Sq.m/day) and the clearness index (i.e., 0.67). The total energy production under the four scaled sessions varied from 946,235 to 1,734,764 kWh/y. The observed solar power penetration was around 97%.
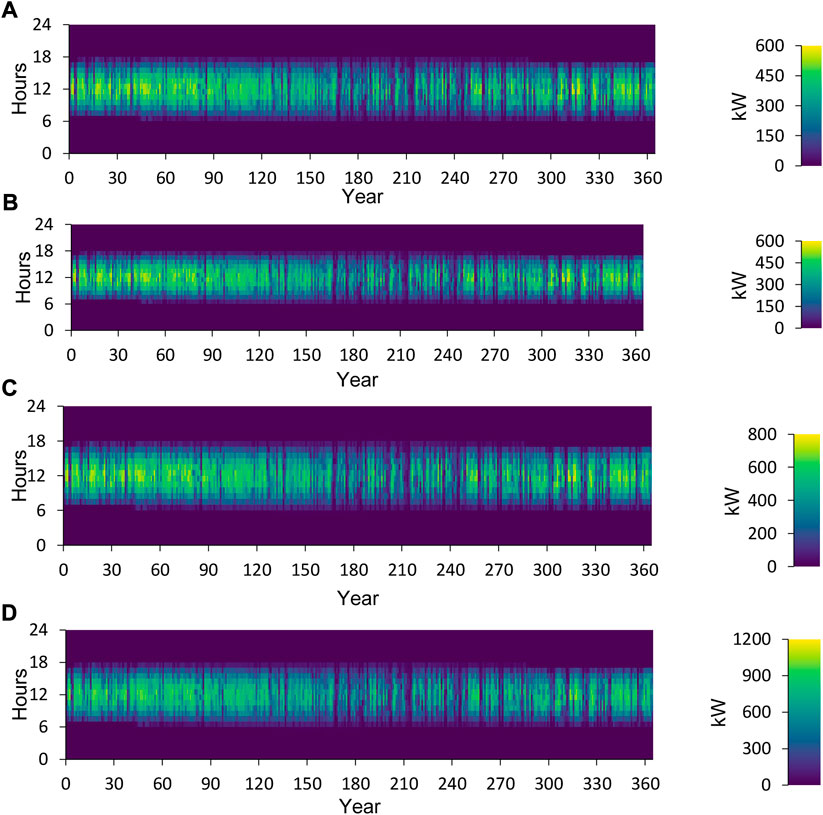
FIGURE 5. Power output from the solar photovoltaic plant as per the scaled average daily sessions. (A) 10, (B) 20, (C) 30, and (D) 40.
Figure 6 shows power imports from the grid to the charging station. Due to the solar PV plant’s uncertain operation, gird support became obvious in meeting the EV charging station demand. The observed grid imports are 1.54% (i.e., 14,840 kWh/yr), 12.7% (i.e., 137,344 kWh/yr), 18.4% (i.e., 284,113 kWh/yr), and 15.7% (i.e., 322,092 kWh/yr) for 10, 20, 30, and 40 scaled averaged sessions per day, respectively.
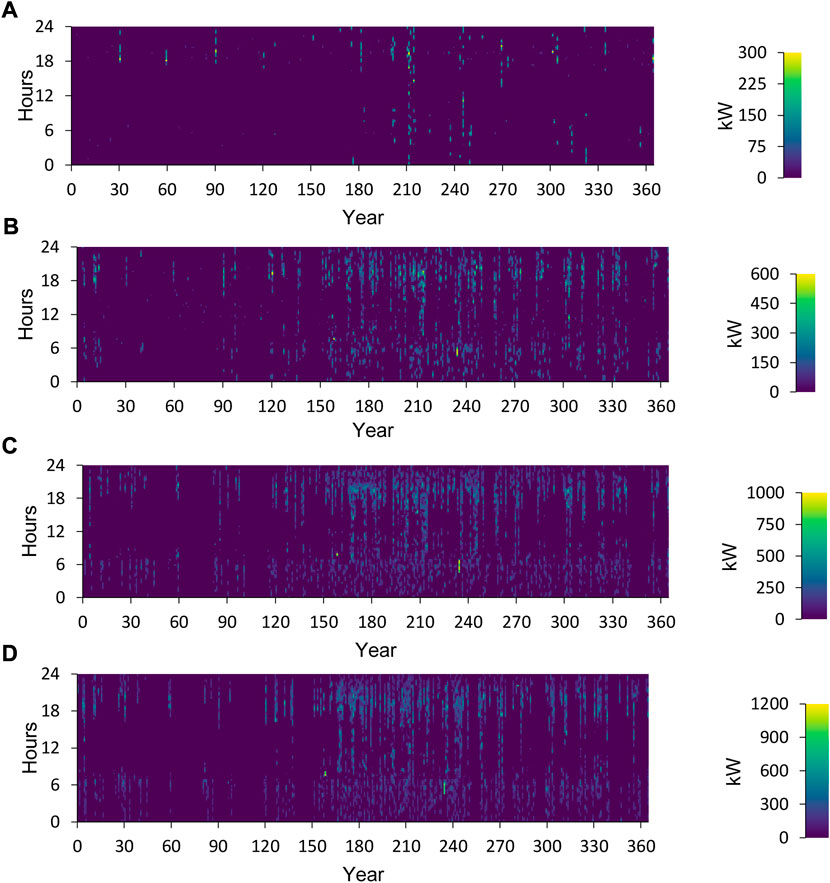
FIGURE 6. Power imports from the grid as per the scaled average daily sessions. (A) 10, (B) 20, (C) 30, and (D) 40.
Apart from imports, the proposed microgrid also exported some power share, as shown in Figure 7. The observed grid imports are 46.9% (i.e., 397,502 kWh/yr), 7.01% (i.e., 68,848 kWh/yr), 2.74% (i.e., 38,935 kWh/yr), and 4.13% (i.e., 77,973 kWh/yr) for 10, 20, 30, and 40 scaled averaged sessions per day, respectively.
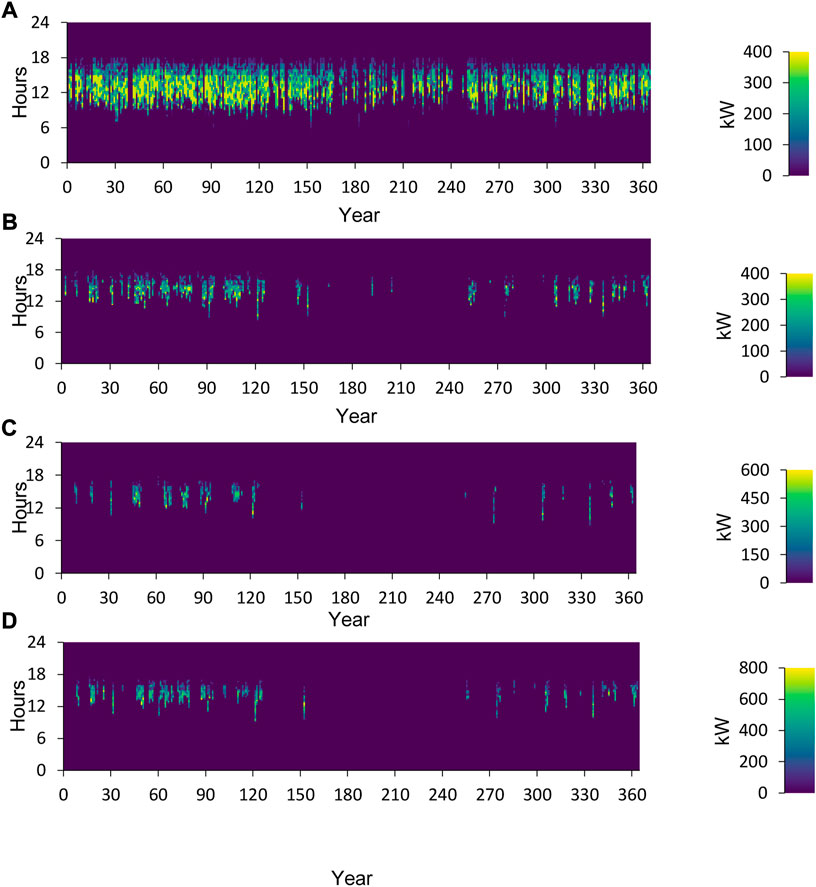
FIGURE 7. Power exports to the grid as per the scaled average daily sessions. (A) 10, (B) 20, (C) 30, and (D) 40.
3.3 Impact of scaled EV sessions over microgrid power balances
As discussed in Section 3.2, charging station interaction with solar PV plant and utility was evident, and this interaction varied dynamically. It is observed that the proposed peak-shaving control strategy proactively managed the EV overall load demand while eliminating the short-term demand spikes, as shown in Figure 8. To be more precise, a day’s results (i.e., 2 September) are shown where the interactions are clearly shown. Figures 8A–Dshow that the power imported from the grid is varied both quantity-wise and consumption time-wise. It is also observed that the highest percentage of power is imported in the case where averaged sessions per day are more.
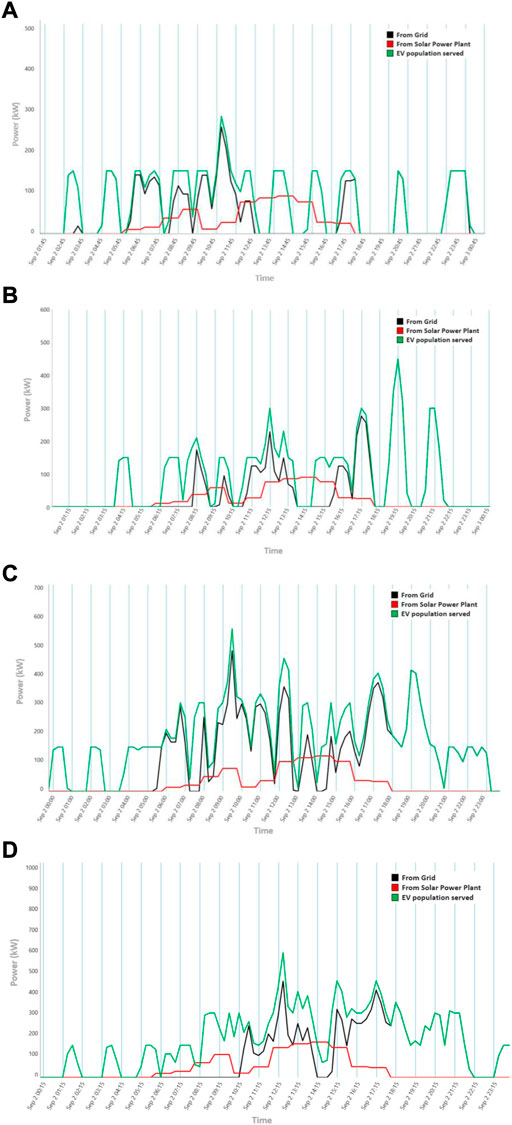
FIGURE 8. The energy storage state of charge in %. as per the scaled average daily sessions. (A) 10, (B) 20, (C) 30, and (D) 40.
4 Conclusion and future work
This study proposed a grid-connected photovoltaic-based microgrid as an EV charging infrastructure. Its design and modeling are carried out, followed by an analysis. While modeling, realistic EV loads are considered and simulated in four scenarios based on the scaled averaged session per day. The analysis included the results mainly focusing on power generation potential from the solar power plant, energy mix of the microgrid (i.e., grid shared energy and onsite solar generation), and supply and load mismatch relationships for the EV charging station. Based on the observed results, the following conclusions were drawn:
• The proposed peak-shaving dispatch strategy eliminated short spikes, so incorporating this in the size optimization plays a crucial role.
• The proposed model showed a high solar fraction with a minor share of imports from and exports to the grid. This clearly showed that EV charging stations could be made grid-independent; however, keeping the uncertain renewable operation, it is suggested to have grid connectivity.
• Based on the scaled sessions per day, there is a possibility of increased peak capacity installation of the PV plant, which might influence the overall cost of the charging infrastructure. This could be considered a research direction.
The future work includes placing the proposed microgrid-based EV charging station in the distribution system by identifying a suitable location, to understand the techno-economic feasibility of such integration.
Data availability statement
The original contributions presented in the study are included in the article/Supplementary Material. Further inquiries can be directed to the corresponding author.
Author contributions
Conceptualization and modeling are done by AC. Framework, design, and analysis are done by AC. SR guided and reviewed the work done.
Conflict of interest
The authors declare that the research was conducted in the absence of any commercial or financial relationships that could be construed as a potential conflict of interest.
Publisher’s note
All claims expressed in this article are solely those of the authors and do not necessarily represent those of their affiliated organizations or those of the publisher, the editors, and the reviewers. Any product that may be evaluated in this article, or claim that may be made by its manufacturer, is not guaranteed or endorsed by the publisher.
Supplementary material
The Supplementary Material for this article can be found online at: https://www.frontiersin.org/articles/10.3389/fenrg.2022.961734/full#supplementary-material
References
Boschmann, E. E., and Kwan, M. P. (2008). Toward socially sustainable urban transportation: Progress and potentials. Int. J. Sustain. Transp. 2 (3), 138–157. doi:10.1080/15568310701517265
Chowdary, A., Sura, S., and Ra, O. (2020). Off-grid solar photovoltaics powered charging infrastructure for electric vehicles. J. Green Eng. 10, 12721–12728.
Das, S. R., Ray, P. K., Sahoo, A. K., Ramasubbareddy, S., Babu, T. S., Kumar, N. M., et al. (2020). Performance of hybrid filter in a microgrid integrated power system network using wavelet techniques. Appl. Sci. 10 (19), 6792. doi:10.3390/app10196792
Deb, S., Tammi, K., Kalita, K., and Mahanta, P. (2019). Charging station placement for electric vehicles: A case study of guwahati city, India. IEEE Access 7, 100270–100282. doi:10.1109/access.2019.2931055
Grid, H. (2022). Getting Started with HOMER Grid, March 5 2021. URL: https://homerenergy.force.com/supportcenter/s/article/getting-started-with-homer-grid (accessed August 18, 2022).
IEA (2021). Tracking Transport 2021 https://www.iea.org/reports/tracking-transport-2021.
Jin, C., Sheng, X., and Ghosh, P. (2014). Optimized electric vehicle charging with intermittent renewable energy sources. IEEE J. Sel. Top. Signal Process. 8, 1063–1072. doi:10.1109/jstsp.2014.2336624
Karmiris, G., and Tengnér, T. (2013). Peak shaving control method for energy storage. Vasterås, Sweden: Corporate Research Center.
Kumar, N. M., Gupta, R. P., Mathew, M., Jayakumar, A., and Singh, N. K. (2019). Performance, energy loss, and degradation prediction of roof-integrated crystalline solar PV system installed in Northern India. Case Stud. Therm. Eng. 13, 100409. doi:10.1016/j.csite.2019.100409
Kumar, N. M., Sudhakar, K., Samykano, M., and Jayaseelan, V., "BIPV market growth: SWOT analysis and favorable factors, " 2018 4th International Conference on Electrical Energy Systems (ICEES), 07-09 February 2018, Chennai, India, 2018, pp. 412–415.
Mathworks, (2019). R2019a at a glance. URL: https://www.mathworks.com/products/new_products/release2019a.html (accessed August 19, 2022).
Nallapaneni, M. K., and Chopra, S. S. (2021). “Electric vehicles participation in load frequency control of an interconnected power system is not sustainable,” in 6th AIEE Energy Symposium Current and Future Challenges to Energy Security: the energy transition, a pathway from low carbon to decarbonization, 14 - 17 December 2021, Milan, Italy.
Osório, G. J., Shafie-Khah, M., Coimbra, P. D. L., Lotfi, M., and Catalão, J. P. S. (2018). Distribution system operation with electric vehicle charging schedules and renewable energy resources. Energies 11, 3117. doi:10.3390/en11113117
Podder, A. K., Das, A. K., Hossain, E., Kumar, N. M., Roy, N. K., Alhelou, H. H., et al. (2021b). Integrated modeling and feasibility analysis of a rooftop photovoltaic systems for an academic building in Bangladesh. Int. J. Low-Carbon Technol. 16 (4), 1317–1327. doi:10.1093/ijlct/ctab056
Podder, A. K., Supti, S. A., Islam, S., Malvoni, M., Jayakumar, A., Deb, S., et al. (2021a). Feasibility assessment of hybrid solar photovoltaic-biogas generator based charging station: A case of easy bike and auto rickshaw scenario in a developing nation. Sustainability 14 (1), 166. doi:10.3390/su14010166
Rezaeimozafar, M., Moradi, M. H., and Amini, M. H. (2017). A simultaneous approach for optimal allocation of renewable energy sources and electric vehicle charging stations in smart grids based on improved GA-PSO algorithm. Sustain. Cities Soc. 32, 627–637. doi:10.1016/j.scs.2017.05.007
Singh, B., Verma, A., Chandra, A., and Al-Haddad, K. (2020). Implementation of solar PV-battery and diesel generator based electric vehicle charging station. IEEE Trans. Ind. Appl. 56, 4007–4016. doi:10.1109/TIA.2020.2989680
Sivadanam, N., Nagu, B., and Sydulu, M. (2020a). Inertial response and frequency control in electric vehicles integrated renewable and non-renewable power system. J. Green Eng. 10 (11), 10981–10993.
Keywords: electric vehicles, charging stations, solar for EVs, microgrid-based EV charging infrastructure, PV plant feasibility
Citation: Chowdary A and Rao SS (2022) Grid-connected photovoltaic-based microgrid as charging infrastructure for meeting electric vehicle load. Front. Energy Res. 10:961734. doi: 10.3389/fenrg.2022.961734
Received: 05 June 2022; Accepted: 25 August 2022;
Published: 06 October 2022.
Edited by:
Nallapaneni Manoj Kumar, City University of Hong Kong, Hong Kong SAR, ChinaReviewed by:
Sudhakar Babu Thanikanti, Chaitanya Bharathi Institute of Technology, IndiaNiveditha Sivadanam, National Institute of Technology Warangal, India
Copyright © 2022 Chowdary and Rao. This is an open-access article distributed under the terms of the Creative Commons Attribution License (CC BY). The use, distribution or reproduction in other forums is permitted, provided the original author(s) and the copyright owner(s) are credited and that the original publication in this journal is cited, in accordance with accepted academic practice. No use, distribution or reproduction is permitted which does not comply with these terms.
*Correspondence: Sura Srinivasa Rao, ssura@gitam.edu