The Ability to Reduce Soil Legacy Phosphorus at a Country Scale
 Richard McDowell
 Rosalind Dodd
 Peter Pletnyakov
 Alasdair Noble
- 1AgResearch, Lincoln Science Centre, Hamilton, New Zealand
- 2Faculty of Agriculture and Life Sciences, Lincoln University, Christchurch, New Zealand
The build-up of soil phosphorus (P) beyond plant requirements can lead to a long-term legacy of P losses that could impair surface water quality. Using a database of ∼4,50,000 samples collected from 2001–2015 we report the level of soil P enrichment by soil type, land use and region and the time it would take for Olsen P to decline to agronomic targets (20–0 mg L–1) if P fertilizer was stopped. We also modeled the time it would take for water extractable P (WEP), an indicator of P losses in surface runoff, to decline to an environmental target (0.02 mg L–1). Some 63% of the samples were enriched beyond agronomic targets. The area-weighted median time to reach the agronomic target was predicted to occur within a year for 75% of samples but varied up to 11.8 years in some land uses. However, the area-weighted time to reach an environmental target was 26–55 years for the 50th and 75th percentile of areas. This indicates that while an agronomic target can be easily met, additional strategies other than stopping P fertilizer inputs are required to meet an environmental target.
Introduction
The loss of phosphorus (P) from land can impair surface water quality (Carpenter, 2008). Much (30–90%) of the total P lost from a grassland or cropping farms originates from the loss of soil particles (McDowell et al., 2007). Other sources of P loss include dung or manure from grazing animals, fertilizer and plant residues (Hart et al., 2004; Dougherty et al., 2008). The quantity of P loss reaching surface water increases linearly or curvilinearly with increasing soil P concentrations but is also influenced by the soil’s sorption capacity (McDowell and Condron, 2004; Nair, 2014). For instance, a soil with a high anion storage capacity (ASC; 0–100%), a measure of the soil aluminum (Al) and iron (Fe) oxide concentration, will have a greater P sorption capacity than a low ASC soil. If two soils have the same soil test P (STP) concentration, the low ASC soil will release more P into solution than the high ASC soil. Due to this variation in the STP (e.g., Olsen P) and ASC relationship, the ability to decrease P losses to a concentration not likely to impair surface water quality varies widely. This dissolved P could be lost to surface runoff or leaching or mopped up by the soil biota or plant roots (Dodd et al., 2014b). However, the amount of P taken up by plants and soil biota decreases beyond agronomic optimum STP concentrations where production becomes limited by other factors (Zhang et al., 2017).
The addition of fertilizer-P to soils aims to establish optimal STP concentrations. Due to differences in ASC or other measures of soil P sorption, recommended fertilizer rates to reach agronomic optima vary by soil and crop type. However, it has been common practice to apply a little extra P when cash is available as an insurance policy against poor years when little P may be applied (van Dijk et al., 2016). Furthermore, in confined animal feeding operations, there is often an imbalance between the amount of P brought in as feed and the amount of land that can receive the resulting manure-P (van Dijk et al., 2016). The over application of fertilizer and manure results in STP concentrations that are enriched beyond agronomic optima (Sharpley and Tunney, 2000). Enriched STP concentrations therefore represent a source of P that can result in a long legacy of P losses even if the balance is made negative to decrease STP concentrations (Sharpley et al., 2013).
The most extreme version of a negative P balance involves no application or returns of P to the soil. Research has shown that in grassland systems with little erosion and a similar climate this no-P scenario results in a rate of decline that reflects the initial STP concentration and ASC (Dodd et al., 2013; Coad et al., 2014). Other management strategies are available to decrease P losses while improving the chances of being profitable. Such strategies include the addition of nitrogen (N) fertilizer to enhance P-limitation and the uptake of P by pasture plants, or tillage to redistribute and dilute enriched topsoil P concentrations throughout the plough layer (Dodd et al., 2014a, b). However, these strategies cannot be used everywhere. For example, applying too much N will enhance N-leaching and impair surface and groundwater quality, while conventional tillage will promote mineralization and the loss of carbon and N and increases the risk of soil erosion (Shepherd et al., 1996; Bilotta et al., 2007).
The drive for profit is a common factor in rapid land use change. In New Zealand, the number of dairy cows increased from 2.9 M in 1996 to 5.0 M in 2016, much of this has been onto land traditionally used for drystock sheep and beef grazing (DairyNZ, 2016; McDowell et al., 2017). In reflecting greater stocking rates, most dairy-farmed land will be maintained at a greater STP concentration than land used for sheep and beef farming. At the beginning of the dairy expansion in 2001, Wheeler et al. (2004) noted that depending on the region, 30–65% of samples from dairy farms had Olsen P concentrations greater than that required for optimal pasture production. A preliminary analysis of Olsen P data from 2001–2015 suggested that increases in Olsen P were still happening in some regions, but the magnitude of enrichment was unclear (McDowell et al., 2019).
The objective of our paper was to determine: (1) the state as of 2016 and any trends over the last 15 years in soil Olsen P concentrations, and (2) to determine the time it would take soils enriched with P to decrease to an agronomic or environmental optimum for their land use and soil group.
Materials and Methods
Soil Database
Data were obtained for soil Olsen P concentrations from the three major commercial laboratories in New Zealand (ARL, Eurofins, Hills Labs). This data comprises soil test results for various commercial agricultural enterprises undertaken to assess soil fertility and fertilizer requirements. The database covered the years 2001–2015 and contained ∼4,50,000 data points. Each laboratory has international standards (ISO 9000) relevant to the collection, analysis and recording of Olsen P data. All dairy and drystock samples were from the 0–7.5 cm depth, while cropping samples were from the 0–15 cm depth.
Each sample had metadata describing region (16 local authorities) and land use [dairy, drystock (sheep, sheep and beef, and red deer), cropping or horticulture]. The Eurofins and Hills Labs data (c. 2,30,000 samples) had data for soil group (ash, peat, pumice, and sedimentary). These groups corresponded to New Zealand soil orders (Hewitt, 2010) of Organic (Peat), Pumice (Pumice), Allophanic (Volcanic), and all other soil orders (Sedimentary), their regional distribution can be found in Supplementary Table 1. Equivalent classifications in United States Soil Taxonomy are: Fibrists, Hemists or Saprists (Organic); Vitraquands, Vitrands or Vitricryands (Pumice); Aquands, Cryands, and Udands (Allophanic); and with all other classes combined within the Sedimentary group (Hewitt, 2010). The soil groups combine soil orders with a similar relationship between Olsen P and production, and provide the basis for fertilizer management recommendations in New Zealand (Sparling et al., 2008). The ARL samples (c. 2,20,000) did not have soil group data but were identifiable at a finer spatial scale by post code and sometimes the name of the enterprise. To attribute post code to soil group we intersected the location of a sample’s post code with the New Zealand Fundamental Soil Layers (Newsome et al., 2008).
We estimated the water extractable P (WEP) concentration (mg L–1) of each sample using the equation of McDowell and Condron (2004). WEP estimates dissolved reactive P (DRP) concentrations in surface runoff from New Zealand soils (McDowell and Condron, 2004). The equation (Eq. 1: r2 = 0.83; P < 0.001) used Olsen P and ASC (%) (Saunders, 1965) to predict WEP:
As input data we combined median region-by-land use-by-soil group-specific Olsen P concentrations with location specific ASC data mapped nationally at a 1:50,000 scale within the New Zealand fundamental soil layer (Newsome et al., 2008).
Targets
We used targets for soil Olsen P concentrations that corresponded to an agronomically optimum level of production and a WEP concentration set as an environmental target unlikely to induce excessive levels of periphyton biomass in streams and rivers.
Agronomic targets were set for different land uses within each soil group (Nicholls et al., 2009; Roberts and Morton, 2009; Morton and Roberts, 2016). Targets for pasture production on drystock farms were taken as the 95th percentile of maximum pasture growth from Morton and Roberts (2016) and Edmeades et al. (2006). These concentrations were 20 and 22 mg L–1, respectively in Sedimentary and Volcanic soils, and 38 mg L–1 for Pumice and Peat soils. The Olsen P corresponding to the 95th percentile was also used as a target dairy farms using data from Roberts and Morton (2009) and O’Connor et al. (2001). Targets for dairy farms were set at 25 mg L–1 for Volcanic and Sedimentary soils and 40 mg L–1 for Peat and Pumice soils. After considering the Olsen P requirements of the main arable and horticultural crops in New Zealand, targets were set at 18 mg L–1 for Volcanic and Sedimentary soils (Nicholls et al., 2009) and 25 mg L–1 for Pumice and Peat soils (Sparling et al., 2008). We note that agronomic targets for vegetable production tend to be high (Reid and Morton, 2019), but the area under vegetable production only represented a third of horticultural land use and was therefore not considered widespread enough to have its own target. We set a WEP target of 0.02 mg L–1 as the environmental target. This target captured all default guideline values for DRP concentrations (also called filterable reactive P) across lowland rivers or lakes of warm or cool climates set by the Australian and New Zealand Governments (2018). A slightly more restrictive target (0.018 mg L–1) is currently being considered as part of freshwater policy (Ministry for the Environment, 2019).
Analyses
Median concentrations of soil Olsen P and WEP were derived for the 2010–2015 years. This range was chosen as an indicator, unlikely to be influenced by trends, of the present state of these parameters in each region by land use by soil group combination. Because the data were skewed, concentrations for each region, soil group and land use, and their interactions, were compared as medians using an analysis of variance of ranked data. Data from 2001–2015 for each region by land use by soil group combination with >500 data values were analyzed for trends in the annual enrichment or depletion of median Olsen P concentrations using a non-parametric Mann-Kendall test within the Time Trends software package (Jowett, 2009). We chose 500 data points as a cut-off to increase the likelihood that combinations would have good spatial and temporal representativeness. If the associated P value of the Mann-Kendall test was small (<0.05), the null hypothesis can be rejected; in other words, the observed trend, either upward or downward, is most unlikely to have arisen by chance. We presented significant trends as a relative change in median concentrations by dividing the Sen Slope estimate by the median. This allowed for the direct comparison between region by soil group by land use combinations measured as the percentage change per year. A positive change indicates an overall increasing trend, while a negative change indicates an overall decreasing trend.
To estimate the time to reach an agronomic and environmental target we used the equations of Dodd et al. (2013). We recognize that these equations were derived for grassland. We therefore advise caution when interpreting predictions for cropping or horticultural land use. However, due to small area in New Zealand under cropping or horticultural land use (<5% of productive land) this was not thought to influence estimates at a national scale.
We calculated the time (t, in years) that it would take for P-enriched soils for each region by land use by soil group combination to decrease to a target Olsen P concentration (Olsen Pt in mg L–1) as:
where WEPi is the initial WEP concentration calculated via Eq. 1 and Olsen Pi is the initial median Olsen P for the between 2010–2015.
We calculated the time (t, in years) that it would take for P-enriched soils to decrease to a target WEP concentration (WEPt), set at 0.02 mgP L–1 for each region by land use by soil group combination as:
Equations 1–3 were calibrated by Dodd et al. (2012) to soils of Olsen P > 15 and high ASC (<72). Concentrations of WEP are likely to be below the environmental target if Olsen P < 15 and ASC is >50% (McDowell and Condron, 2004), therefore t was set to zero in these situations.
Data for the time to deplete the median region by soil group by land use combination for soil Olsen P or WEP to their respective agronomic or environmental target in each combination or at the land use, soil group or national level were also calculated as area-weighted medians. Areas for each combination are given in Supplementary Table 1.
Results
State and Trend of Olsen P Concentrations
Within the database, Peat, Pumice, Sedimentary and Volcanic soils had 7,561, 16,109, 3,42,537, and 54,749 samples in them, respectively. Most soils were sampled under dairy land (2,21,035), followed by drystock (1,41,775), cropping (47,398) and horticulture (10,748). The median number of samples within a region by land use by soil group combination was 380 while the mean was 3,028. The number of samples measured per year was slightly greater in later years.
Median Olsen P concentrations across region by land use by soil group combinations are given in the Table 1. These concentrations range from a low of 6 mg L–1 for drystock Peat soils in the Northland region to 106 mg L–1 for horticultural Volcanic soils in the Taranaki region. An analysis of variance using ranked data indicated that there were significant differences (P < 0.001) between regions, land uses, soil groups and for the interactions between these terms. Pumice soils were more enriched (44 mg L–1) than Peat (40 mg L–1), Volcanic (37 mg L–1) or Sedimentary (26 mg L–1) soils, while Horticulture was more enriched (39 mg L–1) than dairy (32 mg L–1), cropping (22 mg L–1) or drystock (20 mg L–1) land uses. Across the regions, the Bay of Plenty had the greatest concentration while Otago had the least, presumably due to the prevalence of horticulture or dairying in the Bay of Plenty and drystock in Otago.
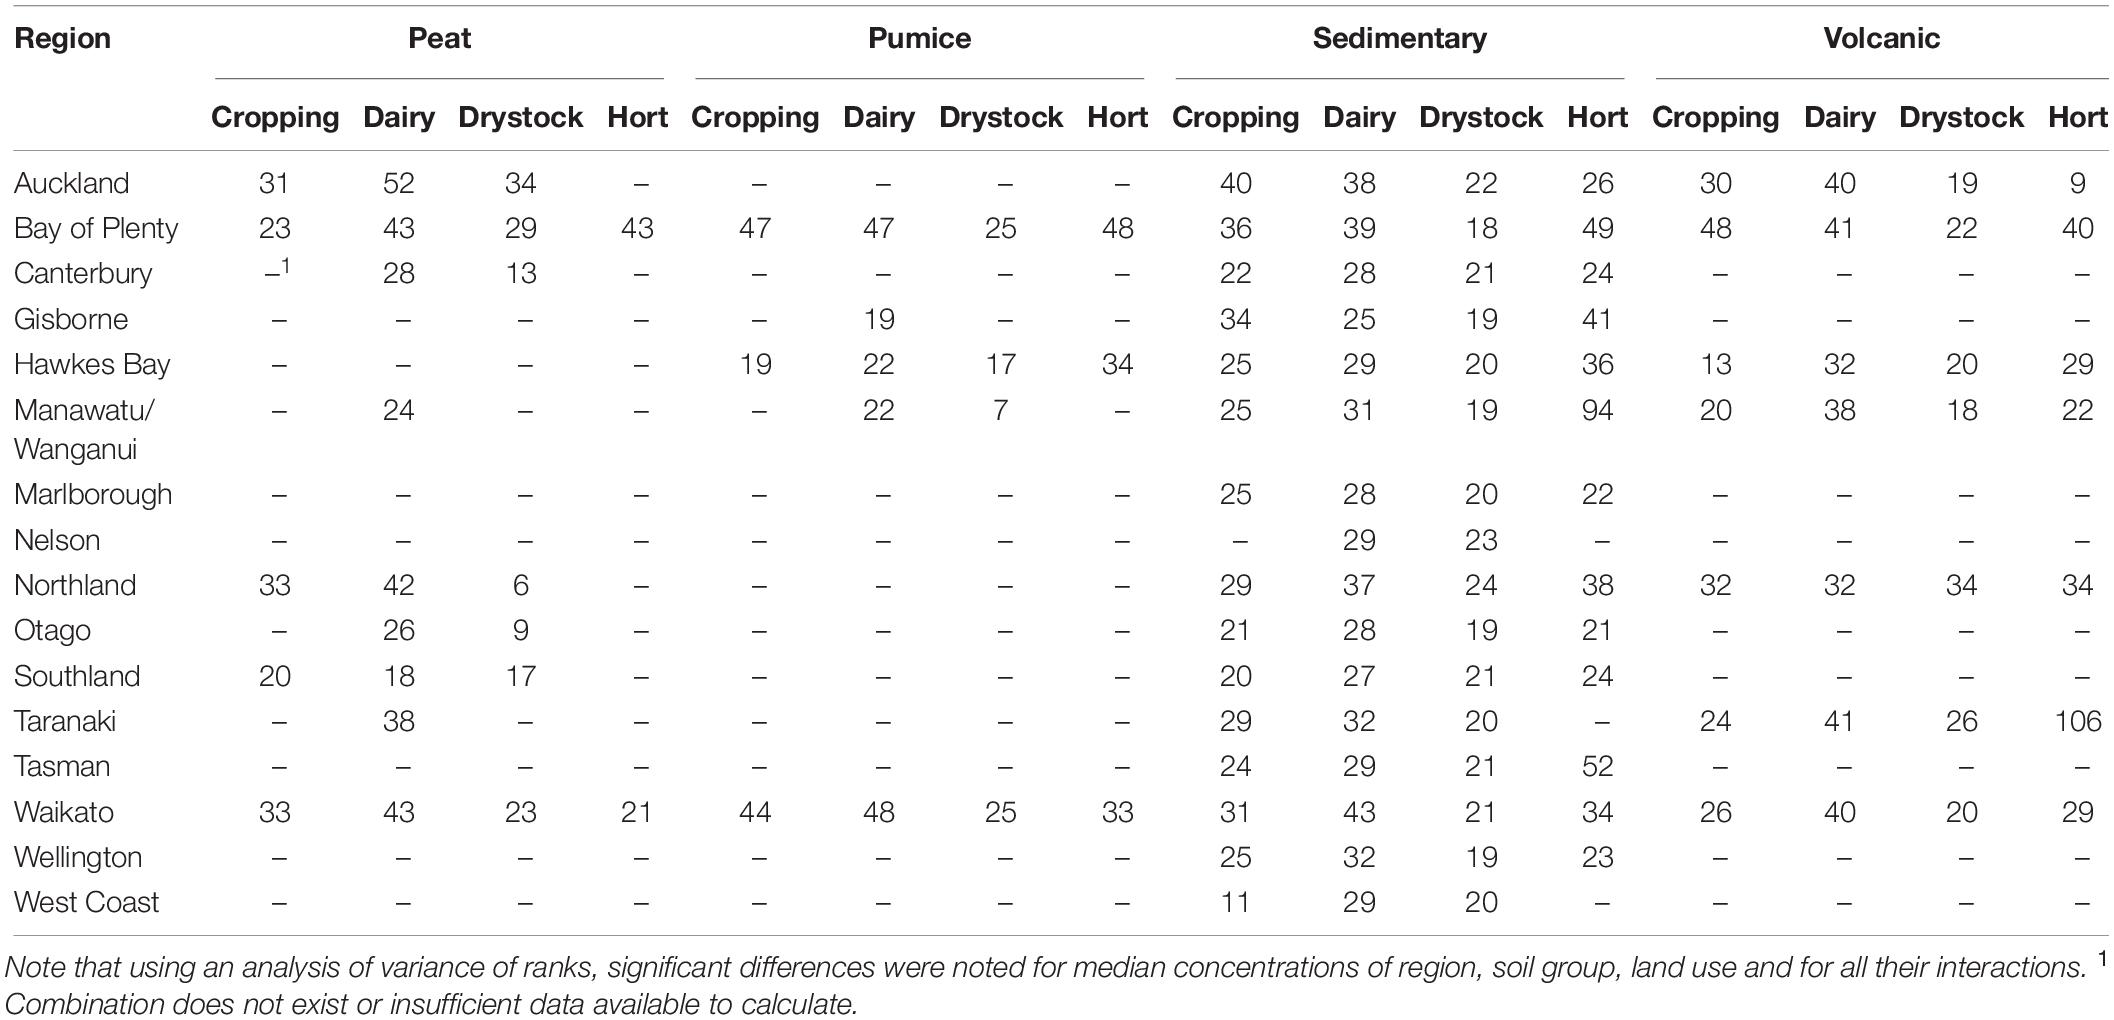
Table 1. Median Olsen P concentrations (mg L–1) in each region by soil group by land use (Hort = horticulture) combination.
Of the 124 combinations, 32 showed significant trends in concentrations from 2001 to 2015 (Table 2). Of these, 18 were increases that ranged from 0.8% per year under dairy Pumice soils in the Waikato to 16.2% under horticultural Volcanic soils in the Manawatu-Wanganui region. Decreases ranged from −0.5% under dairy Sedimentary soils in Northland to −5.2% per annum under drystock Sedimentary soils in the Bay of Plenty region. Across New Zealand there was a mean rate of increase in the median concentration of 1.2% per annum. Although modest, this trend tallies with an increase in the number of soils that exceeded an agronomic target set by Wheeler et al. (2004) for dairy and drystock land uses sampled between 1988 and 2001 (Figure 1). On an area basis those soils that were above the agronomic target represented 7.1 M ha (63%) or 11.3 M ha of productive land.
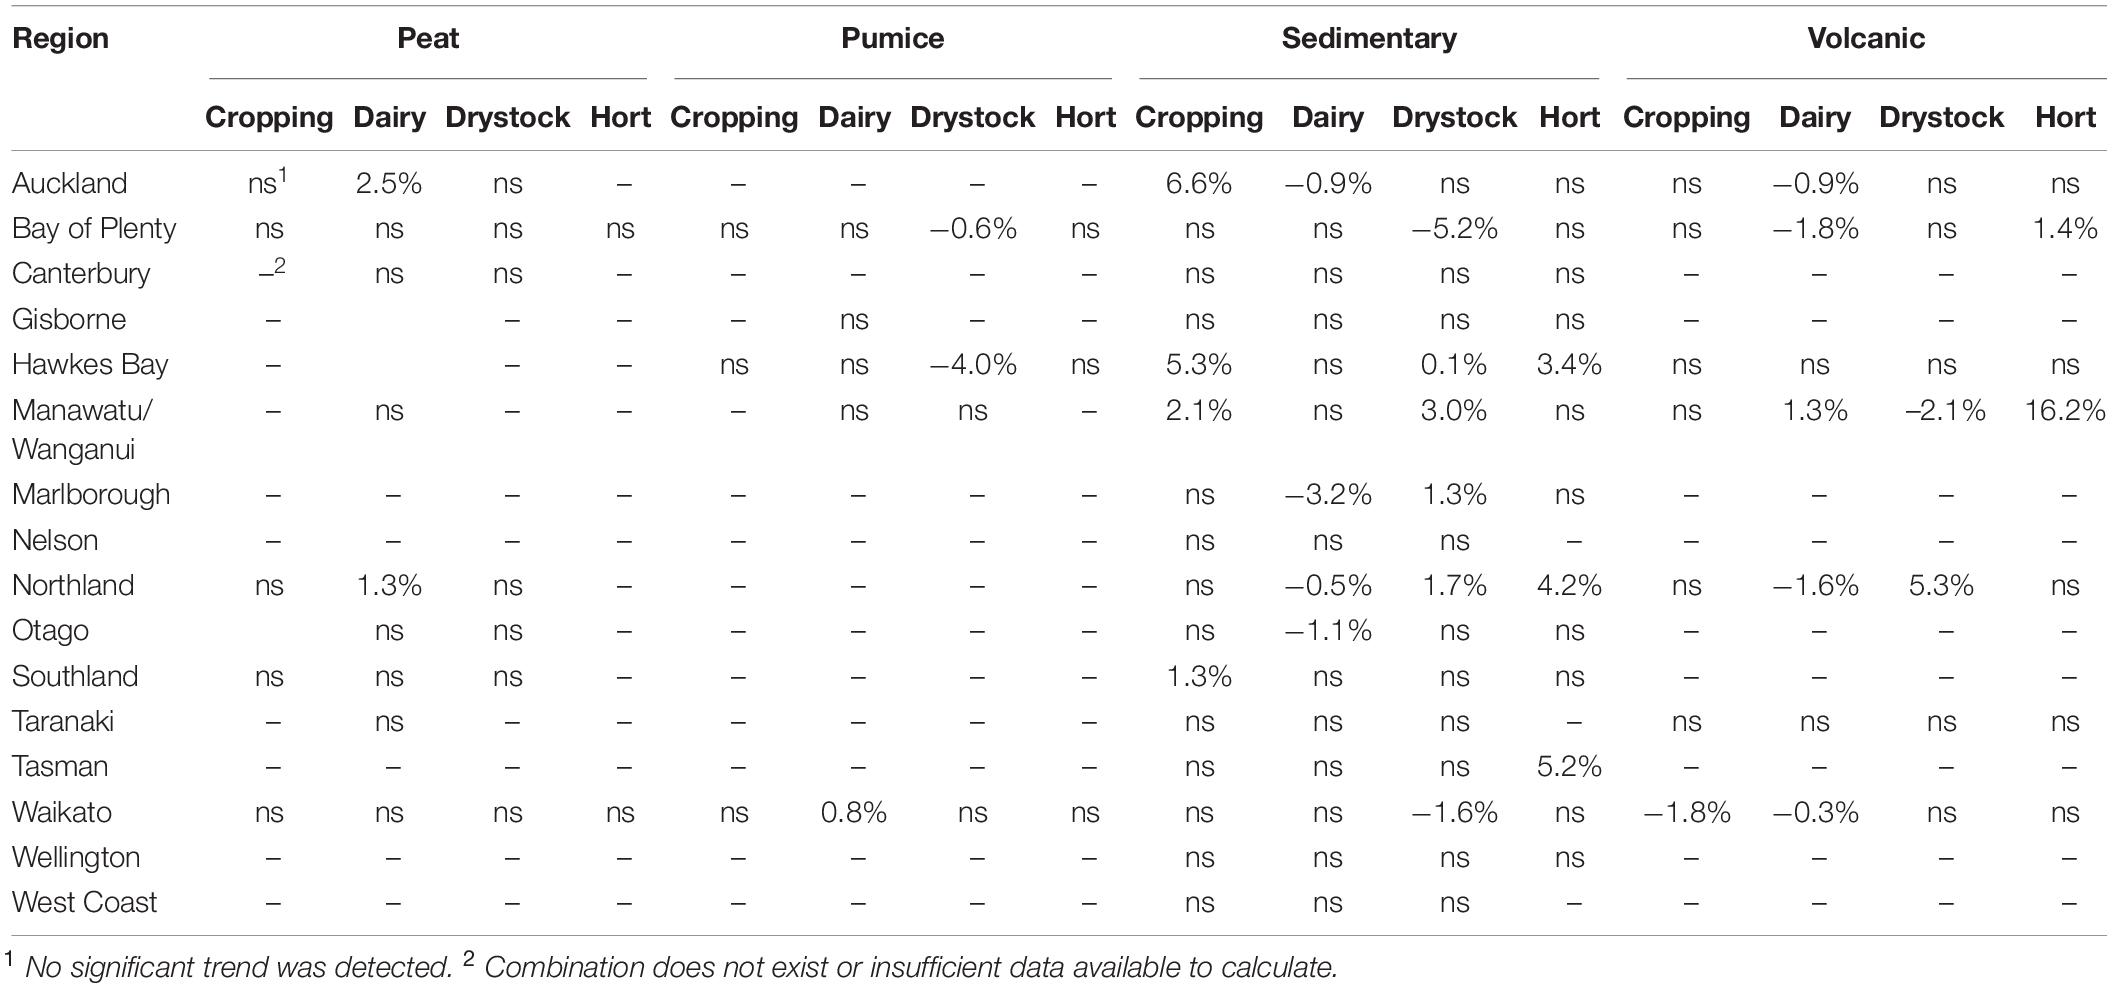
Table 2. Mean annual percentage change in the median concentration of Olsen P for each region by soil group by land use (Hort = horticulture) combination over 2001–2015.
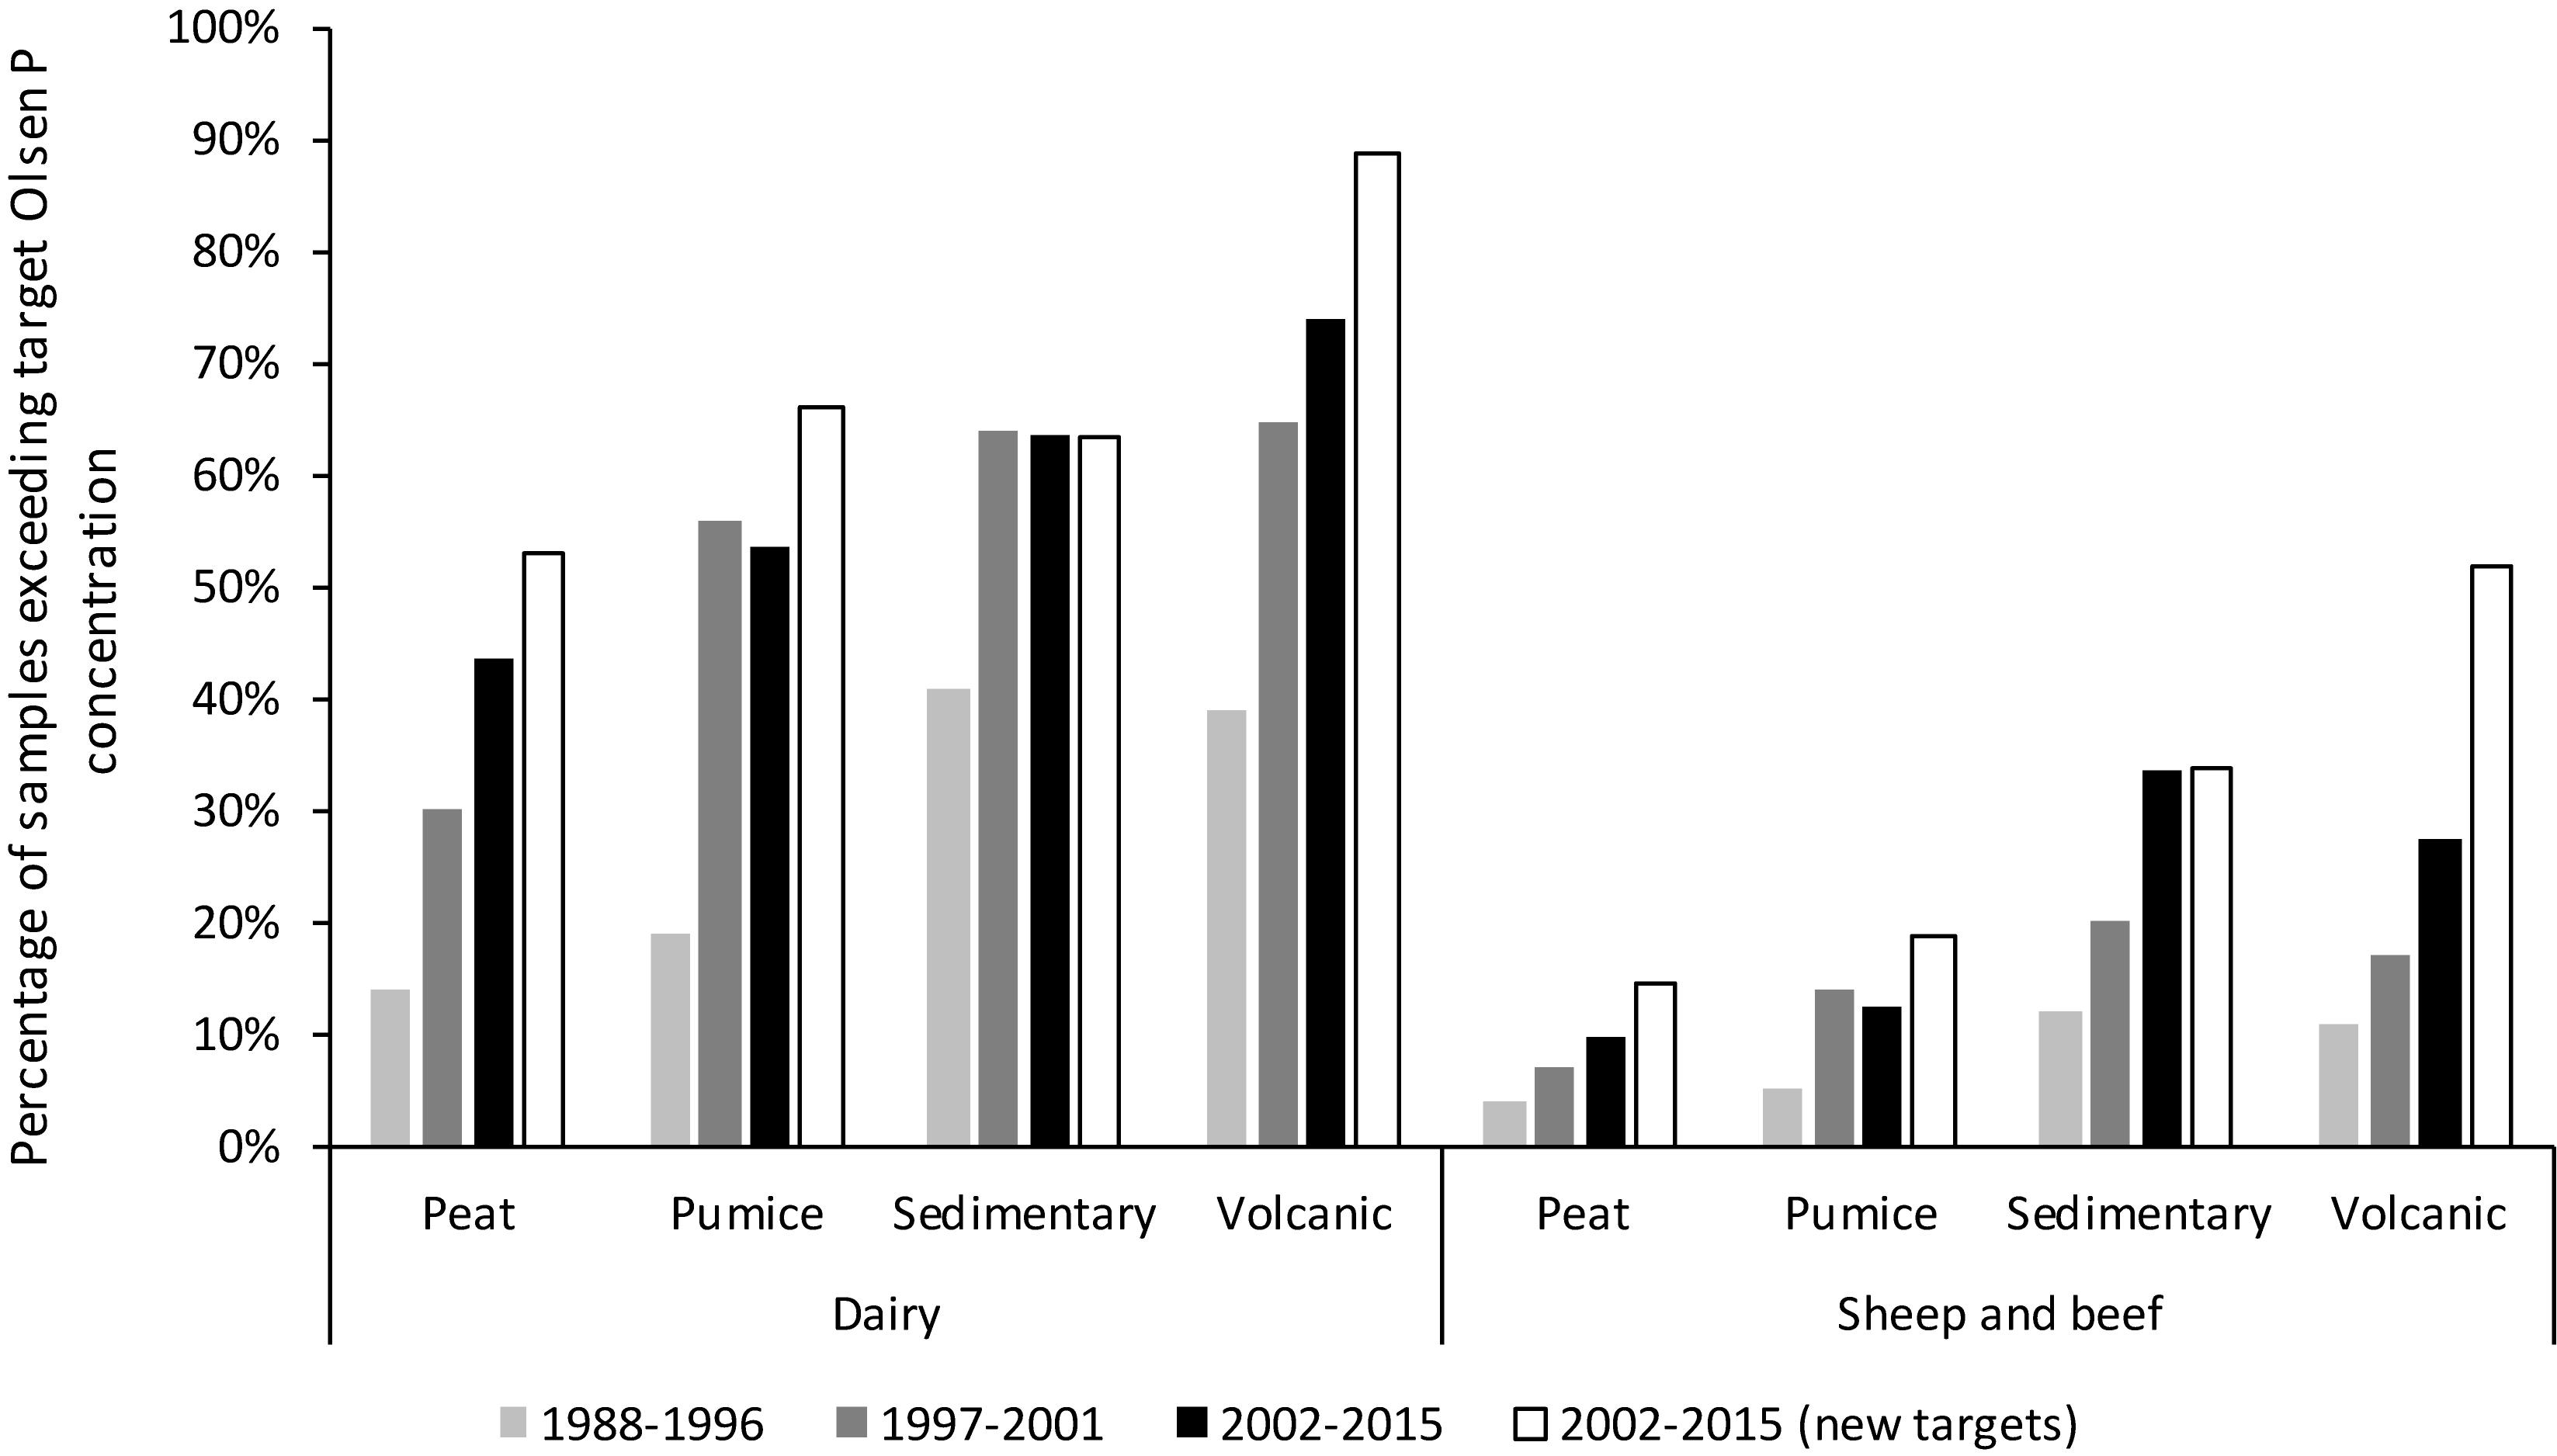
Figure 1. The percentage of samples collected in 1988–1996, 1996–2001, and 2002–2015 exceeding target ranges in Olsen P for each soil group in dairy or sheep and beef land use. Data for 1988–2001 and targets (45, 45, 25, and 30 mg L–1 for Peat, Pumice, Sedimentary, and Volcanic soils, respectively) were taken from Wheeler et al. (2004). Targets used in this paper are referred as “new targets.”
Time to Deplete Samples to Their Agronomic or Environmental Target
Median Olsen P concentrations were above their respective soil group-by-land use-specific agronomic target in 82 of the 124 combinations (Table 3). Across all combinations the national area-weighted median time to deplete samples to the agronomic target was <1 year but was as high as 11 years in horticultural Volcanic soils in the Taranaki region (Figure 2). This is similar to the 8–10 years reported by McCollum (1991) for a mid-Atlantic sandy loam soil that was 30–40% above an agronomic target for corn, but less than the 30–40+ years estimated in areas of the United Kingdom, United States, and Finland for soils that were where often >100% above agronomic targets (Withers et al., 2019).
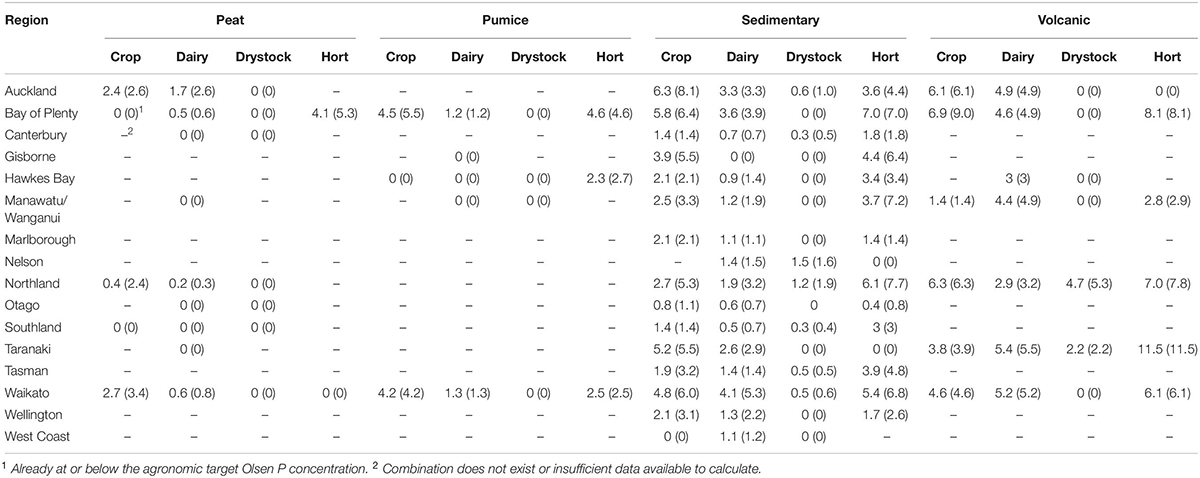
Table 3. Median and the 75th percentile (in parentheses) of the time (years) taken for Olsen P to decrease to agronomic targets in each region by soil group by land use (Crop = Cropping, Hort = horticulture) combination if fertilizer P was withheld.
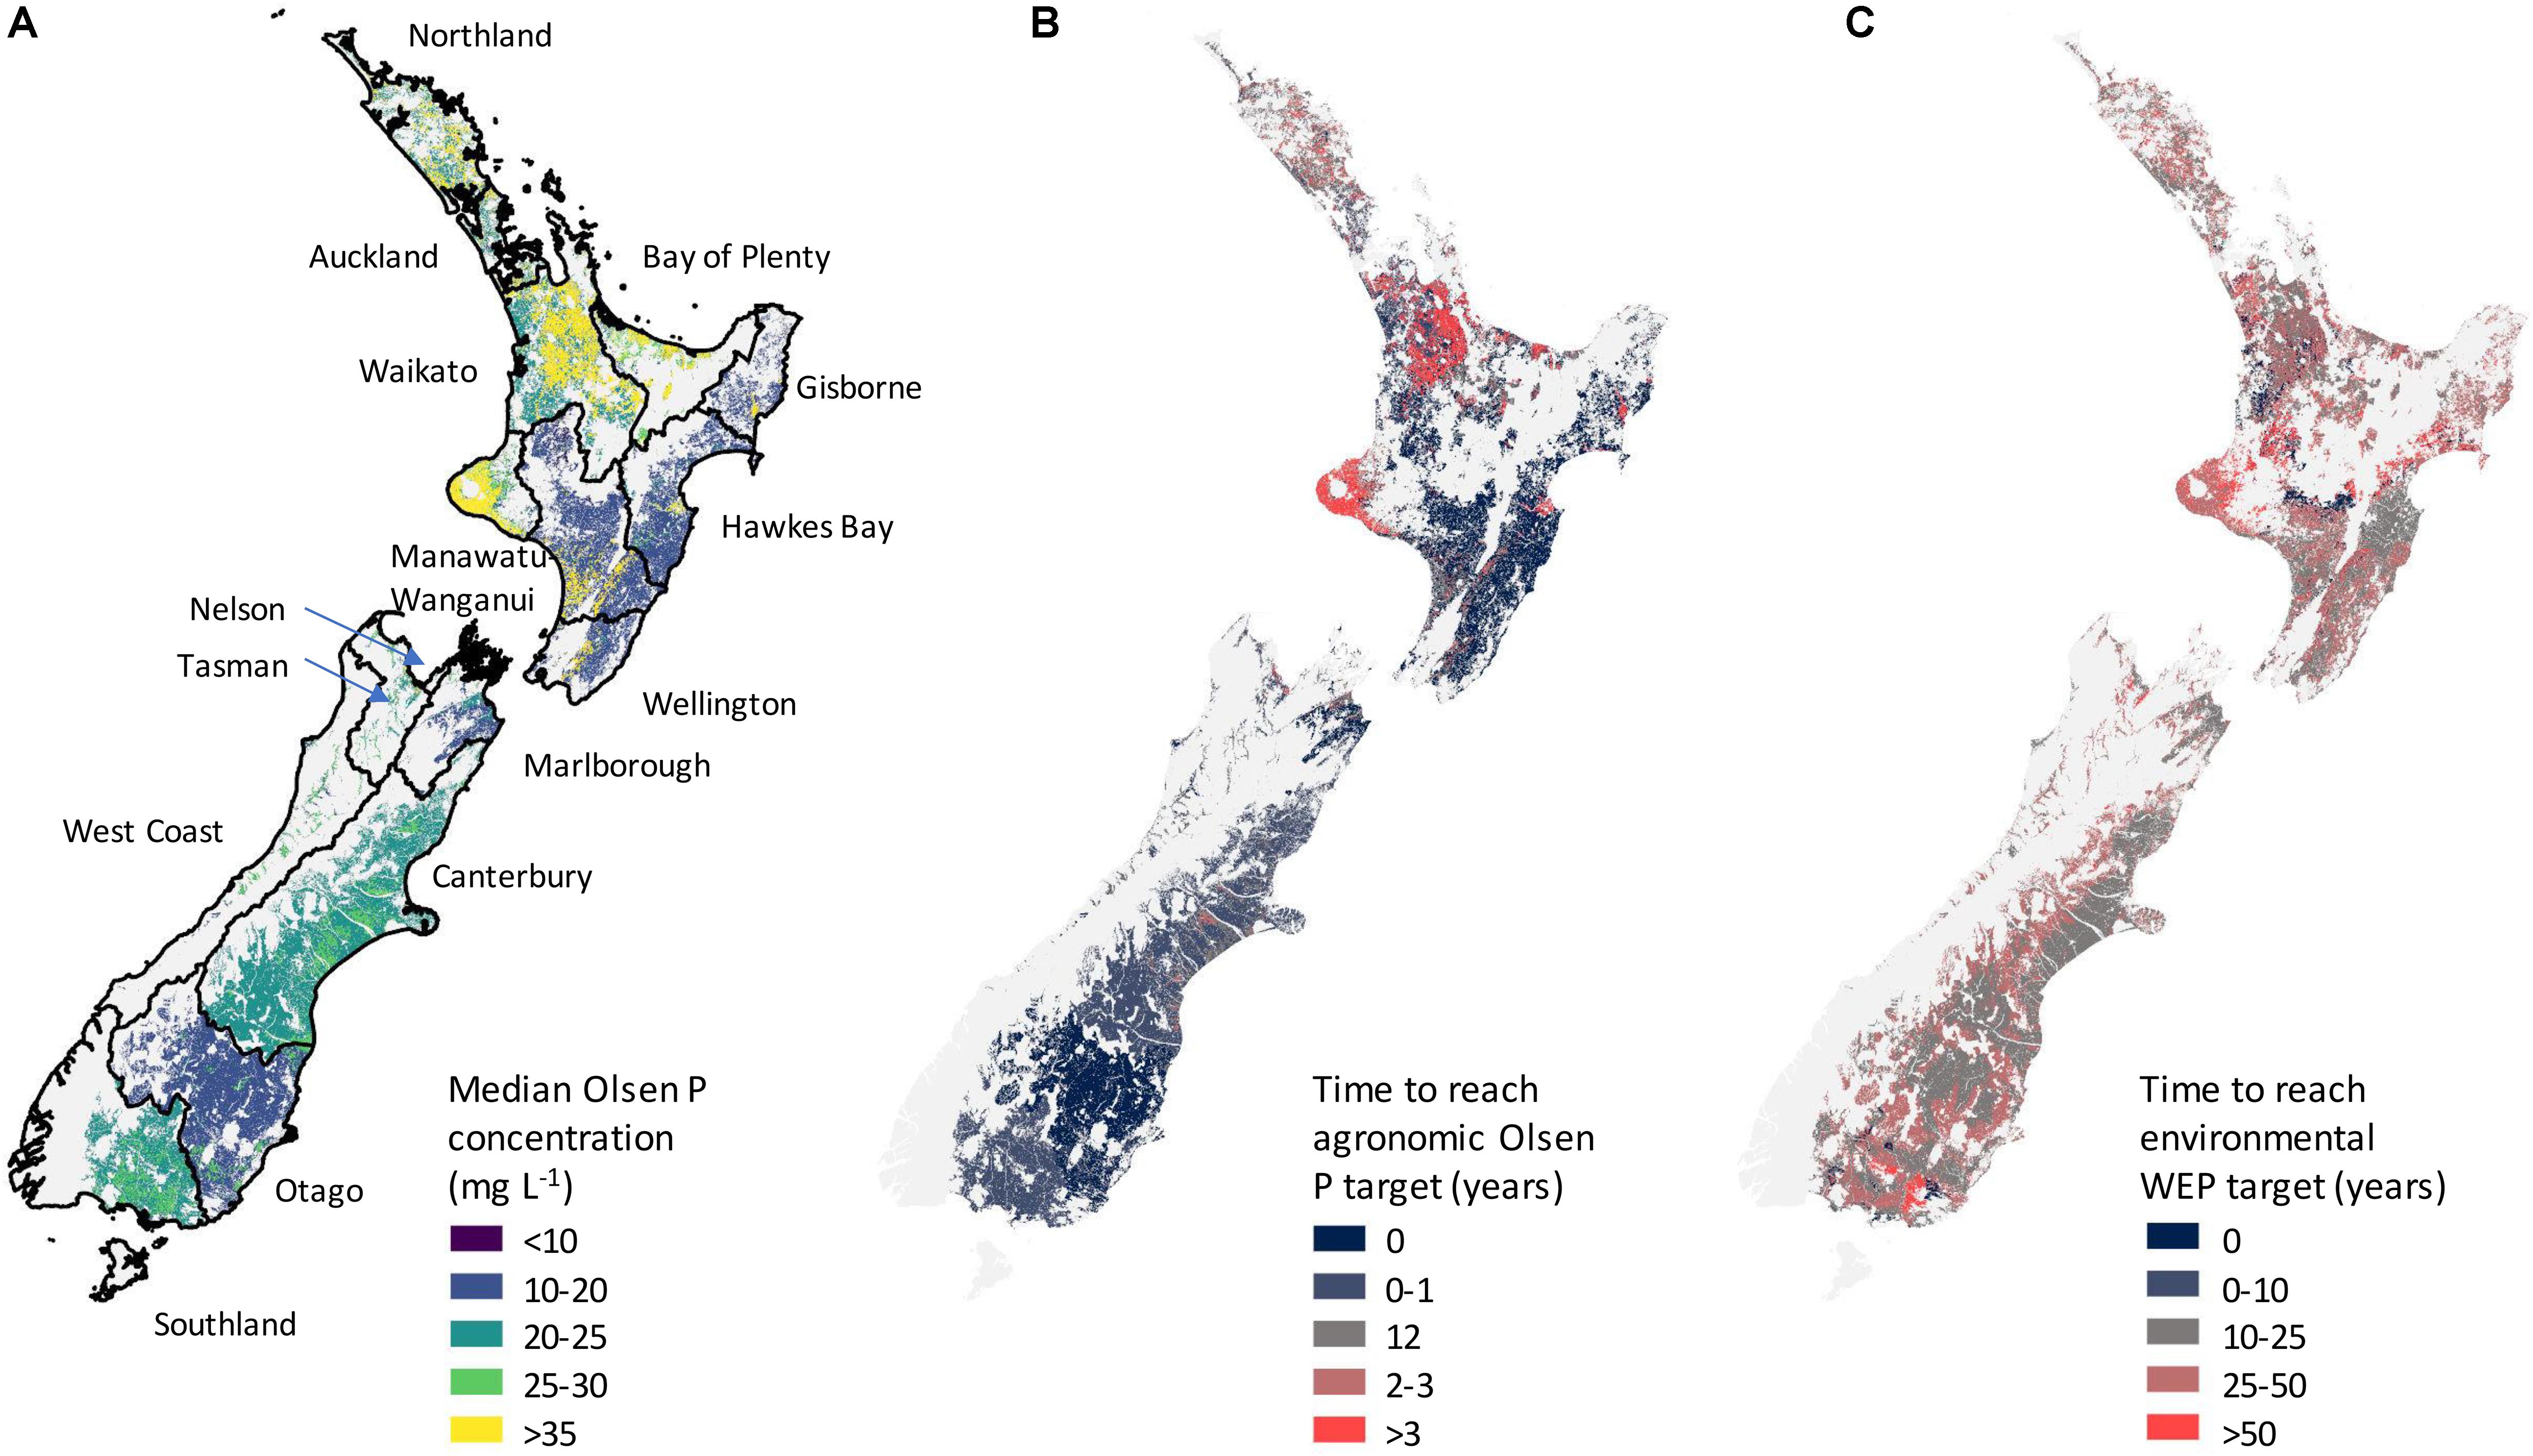
Figure 2. Maps showing the distribution of median topsoil Olsen P (mg L–1) concentrations (A), and the number of years it would take areas to decrease their soil median soil Olsen P and water extractable P concentrations (mg L–1) to agronomic (B) and environmental (C) targets, respectively.
Across all soil groups, the longest area-weighted time to reach the agronomic target was in the Volcanic soils (3.3 years), followed by the Pumice (2.3 years), Peat and Sedimentary (<1 year) soils. Amongst land uses, horticultural soils were estimated to take the longest time to reach the target (3.3 years) followed by dairy, cropping and drystock soils at 2.3, 1.9, and <1 year, respectively. The area-weighted time for the 75th percentile was 1 year and the corresponding time to reach the Olsen P target was 3.7, 2.6, 1.2, and 1.2 years for Volcanic, Pumice, Sedimentary and Peat soils, respectively.
Compared to the time to reach an agronomic target, the median time to reach the environmental target was much greater: the national area-weighted time was 26 years and ranged from 0 years for land uses of Peat soils in Southland to >100 years for six land uses of Volcanic soils (Table 4 and Figure 2). Volcanic soils took longer to reach the environmental target (36.8 years), followed by Pumice soils (36.7 years), Sedimentary soils (30.7 years), and Peat soils (27.3). There was little time separating land uses with drystock (32.0 years) taking the longest to reach the target, followed by dairy, cropping and horticulture taking 30.0, 28.5, and 26.0 years, respectively. The area-weighted time for the 75th was 39 years and the corresponding time to reach the WEP target was 55, 42, 37, and 36 years for Volcanic, Pumice, Sedimentary and Peat soils, respectively.
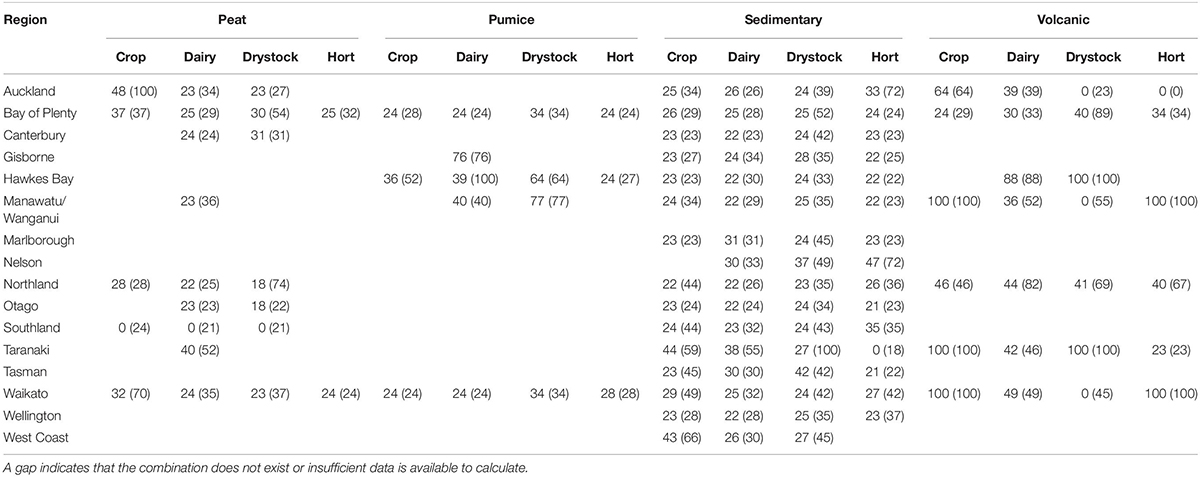
Table 4. Median and the 75th percentile (in parentheses) of the time (years) taken for water extractable P (WEP) to decrease to environmental targets in each region by soil group by land use (Crop = Cropping, Hort = horticulture) combination if fertilizer P was withheld.
Discussion
Bias and Representativeness
Some care is needed when interpreting our dataset. There are questions over bias, representativeness, and the repeatability of measurements. Although we have isolated soil Olsen P concentrations to the post code level, no information was available to determine if the samples submitted represented the range of Olsen P concentrations present within a post code or within a land use by soil group combination. We also had no information to determine if a disproportionate number of samples were being sent from enterprises with low or high Olsen P concentrations or if multiple samples were coming from the same enterprises over time. However, analysis of data from one of the providers, ARL, enabled the enterprise to be identified in about 20,000 samples. Of these samples, <5% of enterprises were represented more than once on a sampling date or had multiple samples over the 15-year period of record.
Bias is also possible due to errors in recording a sample’s location and assignment to the appropriate soil group. Related to this, the calculation of timeframes to deplete soil P to agronomic and environmental targets is subject to errors associated with the use of default ASC values for specific soil types. The original equations generated by Dodd et al. (2012) utilized ASC derived analytically for each specific soil using the method of Saunders (1965). This error will be exacerbated using ASC to estimate WEP concentrations for Olsen P in equation 1. However, to minimize this bias, we cross-checked locations with their soil group as per the New Zealand Fundamental Soil Layer (Newsome et al., 2008) and removed those that were in the wrong location. Fewer than 1% of samples met this criterion. Little bias was found in the number of samples within each Soil group, 2% (Peat), 4% (Pumice), 80% (Sedimentary) and 13% (Volcanic) which were very similar to the aerial coverage in these groups at 1, 5, 85, and 9%, respectively.
State and Trends in Olsen P Concentrations
The majority of region by soil by land use by soil group combinations had median concentrations that were close to their agronomic target. However, of those soils with an Olsen P concentration above the agronomic target a large proportion were in Volcanic dairy soils (Figure 1). Soils used for horticulture, specifically vegetable production, can have high Olsen P concentrations (>100 mg L–1) (Cavanagh et al., 2019). However, this was only occasionally detected in regions. Before 2003, the recommended Olsen P concentration for Volcanic dairy soils were based on a single trial in the Taranaki region which showed production benefits to Olsen P concentrations >50 mg L–1 (Morton et al., 2003). The target has subsequently been refined to sit at 20–30 mg L–1 (note we chose a mid-point representing a 95th percentile of pasture production as 25 mg L–1), but it will take time for recommendations to be reflected in fertilizer application rates and decreased soil Olsen P concentrations.
There were few trends in Olsen P concentrations. This is despite significant land use change in some regions. For instance, dairy cattle numbers in Canterbury, Otago, and Southland increased from 5,76,632 to 1,767,763 from 2001 to 2015 (Livestock Improvement, 2001; DairyNZ, 2016). Land use was from sheep and beef farming, which traditionally maintained a lower Olsen P than dairying. The absence of trends could have been caused by a decrease in the number of sheep and beef samples with an Olsen P above the target. However, no negative trends were found in areas with large increases in dairy cattle numbers. Furthermore, the proportion of samples above the agronomic target had not decreased compared to 1997–2001 when dairy cattle numbers were just starting to increase (Figure 1). A more likely reason for the absence of trends were that a small proportion of samples that came from the same farm in the dataset (<5%). Coupled with on-farm spatial variation in P, which can be as high as 100% in many grassland farms (McDonald et al., 2019), the likelihood of detecting a change associated with repeated measures is probably low. Trends within a land use such as dairy farms may not occur as New Zealand dairy farms are largely able to balance P inputs and outputs. For instance, the land areas available for the application of farm dairy effluent is sufficiently large enough to avoid soil P-enrichment.
Variation in the Rate of Olsen P and WEP Decline
Following the cessation of fertilizer-P additions the rate of decline in Olsen P has been shown to vary according to soil type and the initial STP concentration (Dodd et al., 2012). Soils with a greater initial STP concentration decrease at a faster rate than those with a lower STP concentration. For instance, Ma et al. (2009) found that stopping the application of P fertilizer for 14–15 years to five Cambisols growing winter wheat and maize in China resulted in a faster rates of Olsen P decline in the soil with the highest initial Olsen P concentration (27 mg kg–1), and the slowest rate of decline in the soil with the least Olsen P concentration (4 mg kg–1). A faster decrease at more enriched Olsen P concentrations is probably due to a greater proportion of P that is loosely bound and available either for uptake by plant roots or loss in leachate or surface runoff than in soils with lower Olsen P concentrations where the P is likely bound in more recalcitrant perhaps organic forms (Toor and Sims, 2015; Boitt et al., 2018). In soils of different soil P sorption, P in soil solution tends to be lower where soil P sorption strength or capacity is high (Barrow, 2000). In our study, Volcanic soils were predicted to take the longest time to decrease to an agronomic target and Peat or Sedimentary soils, the least. The ASC, a proxy for soil P sorption, of Volcanic soils tends to be >70%, but <10% for most Peat soils (without containing allophane) and 20–50% for Sedimentary soils (Sparling and Schipper, 2002).
Much like Olsen P, the rate of decline in WEP is a function of the initial STP concentration of the soil and soil P sorption. For example, in addition to predicting the rate of decline in WEP was a function of Olsen P and ASC, Dodd et al. (2013) investigated further using 33P to show that the rate of decline in WEP was associated with P that was immediately exchangeable, while more strongly sorbed P only exchangeable over months was not. In measuring CaCl2-P in six Australian soils of varying soil P sorption capacity, Coad et al. (2014) found that the rate of decline in CaCl2-P over 4 years was inversely related to soil P sorption capacity, measured as the P buffering index (Burkitt et al., 2006). Calcium chloride extractable P was used in this study a proxy to estimate the potential for P loss in leachate (McDowell and Condron, 2004).
Meeting Agronomic Targets
On those soils where Olsen P is above the agronomic targets, Olsen P concentrations must reduce. The first step in making reductions is to ensure that the on-farm P balance is not in surplus thereby avoiding soil P enrichment. While livestock systems with confinement will likely have P a surplus (Reid et al., 2019), systems that get most of their feed from forage grown on-farm are likely to be balanced, but could support a negative P balance. A negative, but still profitable on farm P balance can be achieved by shifting producers from nutrient regimes that focus on minimizing P inputs and augmenting production with N (Dodd et al., 2014b; Sadeghpour et al., 2017).
While a P balance is a good method of decreasing Olsen P toward a target, it can take many years to do so. There are methods that can achieve reductions in Olsen P faster. For instance, plowing to reduce the soil P stratification can decrease topsoil P concentrations by half – overnight, abating surface runoff losses (Sharpley, 2003). However, while plowing can disrupt macropores and P leaching, Dodd et al. (2014a) found that earthworm activity restored macropore function and P leaching within 18 months. Other researchers have focused on altering crop rotations to phytoextract available (and leachable) P from topsoil. Of 12 different crops, Delorme et al. (2000) measured annual P uptake rates of 114 kg P ha–1 for maize and 108 kg P ha–1 for Indian mustard (Brassica juncea L.).
In pasture systems, Sistani et al. (2003) and Gotcher et al. (2014) measured uptake rates for Red River crabgrass (Digitaria ciliaris Retz. Koel.) of 34–49 kg P ha–1 year–1. However, by using pastures like Lucerne sp. to fix nitrogen for subsequent rotations of maize and wheat-soybean, STP concentrations were reduced by half compared to grain crops alone Fiorellino et al. (2017). The enhanced extraction is likely caused by N-fixation that shifted the crops into P-limitation thereby extract more P from the soil.
Grain crops and grass forage rotations were able to deplete topsoil STP by 11 – 36% over 7–16 years in Swedish lysimeter trials. However, translocation of P to the subsoil was noted in three of four soil types with associated increases in P leaching (Svanbäck et al., 2015). The degree of sub-soil enrichment was associated with the P saturation index, suggesting that care is needed when mobilizing legacy P stores in soils with limited P sorption capacity, either through inherent soil properties or saturation of sorption sites, to protect water quality.
Meeting Environmental Targets
We predicted that the area-weighted time for median and 75th percentile of Olsen P concentration across New Zealand to decrease to its agronomic target was within a year. However, the equivalent area-weighted time for WEP was 26–55 years, inferring that to reach targets for WEP would require the cessation of P fertilizers over generational timeframes. Pursuing low WEP concentrations may also result in Olsen P concentrations lower than the agronomic target in many soils, impairing production. For instance, in a sheep grazed trial in Winchmore, Canterbury, New Zealand withholding fertilizer for 6 years resulted in a 34–53% decrease in pasture production (McBride et al., 1990). In plots that had received superphosphate at rates of 34 and 51 kg P ha–1 year–1 this decreased Olsen P from 28 and 24 mg L–1 to <20 mg L–1, respectively. However, Dodd et al. (2012) estimated that it would take ∼22–24 years of withholding fertilizer in these soils to reach an environmental target of 0.02 mg WEP L–1 and an Olsen P < 10 mg L–1. This reduction in Olsen P concentration would likely result in stocking rates falling from 18 to 6 stock units ha–1, equivalent to an unfertilized control (Fraser et al., 2012). The consequences of not reducing stocking rates are poor liveweight gain and wool growth. In a trial, again withholding fertilizer for 6 years to a sedimentary soil, O’Connor et al. (1990) found that Olsen P reduced from 14 to 8 mg L–1 causing pasture production to decrease by 30%. Maintaining the same stocking rate throughout, winter spring wool growth decreased by 28%. In contrast to pasture, other studies have found little or no decrease in maize (Zea mays L.) production as STP concentrations and WEP trend toward their respective targets (Zhang et al., 2004; Ribey and O’Halloran, 2016). This is presumably due to the ability of maize to explore a much greater depth and volume of soil than pasture and therefore access greater P reserves.
Other strategies are therefore required to augment or replace the cessation of P fertilizer to soils to reduce WEP concentrations. Such strategies include, but are not limited to: the application of Al-, Fe- or Ca-P-sorbing compounds like alum, bauxite or crushed shells to reduce the dissolution of P into soil solution (Vlahos et al., 1989; Ballantine and Tanner, 2010); altering soil pH to a range where P is less soluble (e.g., <5.5 or >7.5) but still available to plants (McDowell et al., 2003); or the application of sparingly soluble fertilizer P forms. In addition, it is important to understand that 10–80% of P losses can come from other parts of the farm such as recent fertilizer or manure (and dung) applications or unutilized forage (McDowell et al., 2007). Strategies are also available to reduce losses from these sources such as the application of sparingly soluble P fertilizers (Nash et al., 2019) or avoiding the grazing of wet areas that are well-connected to nearby streams (Monaghan et al., 2017). Each strategy varies in its cost and effectiveness and while cost-effectiveness can be improved by targeting strategies to the sources of P loss, this may not be sufficient to enable WEP losses to meet the target nor do so without significantly reducing farm profitability (McDowell and Nash, 2012). This may force land use change to systems that can produce well from very low Olsen P concentrations. Although traditionally this may have been restricted to forestry, new pasture cultivars are becoming available that can access recalcitrant P forms negating the need to maintain Olsen P concentrations at current targets (Nichols and Crush, 2016; Sandral et al., 2018). Some evidence also suggests that production can be enhanced by adding silicon which solubilizes P at low STP concentrations (Qin and Shober, 2018).
Conclusion
Analysis of the P status of New Zealand agricultural soils revealed that 63% of the productive land area had Olsen P concentrations more than the agronomic optimum. Accumulation of soil P was found to be related to both the soil order and farming system with dairy operations on volcanic soils, with high ASC values, exhibiting the greatest exceedances. If fertilizer application was halted, we predicted that the median Olsen P concentration could be reduced to the agronomic optimum within 1 year. In contrast, reducing the median WEP to an environmental target would require 36–55 years for most soil orders and farming systems, but greater than 100 years for volcanic soils with the greatest P enrichment. To safeguard water quality, strategies such as phytomining are required to accelerate the decline in WEP from the most enriched soils along with mitigation strategies to reduce P solubility. The discrepancy between the timescales to reach these two targets highlights the difficulty in maintaining high agronomic productivity while ensuring good water quality status. Revision of the agronomic targets should be undertaken to account for increases in P use efficiency in modern farming systems and could go some way to closing this gap. However, our results suggest that new land management strategies will be required to develop agronomically and environmentally sustainable farming systems which are productive at a lower Olsen P status.
Data Availability Statement
The datasets generated for this study are available on request to the corresponding author.
Author Contributions
RM wrote the manuscript and analyzed the data along with AN. RD contributed text to the manuscript. PP developed the maps and generated spatial data.
Conflict of Interest
The authors declare that the research was conducted in the absence of any commercial or financial relationships that could be construed as a potential conflict of interest.
Funding
This work was supported by the Our Land and Water National Science Challenge (contract C10×1507 from the Ministry of Business, Innovation and Employment).
Acknowledgments
We are grateful to Hills Laboratories, ARL, and Eurofins for the supply of Olsen P data.
Supplementary Material
The Supplementary Material for this article can be found online at: https://www.frontiersin.org/articles/10.3389/fenvs.2020.00006/full#supplementary-material
References
Australian and New Zealand Governments, (2018). Australian and New Zealand Guidelines for Fresh and Marine Water Quality. Canberra, ACT: Australian and New Zealand Governments and Australian state and territory governments.
Ballantine, D. J., and Tanner, C. C. (2010). Substrate and filter materials to enhance phosphorus removal in constructed wetlands treating diffuse farm runoff: a review. N. Z. J. Agric. Res. 53, 71–95. doi: 10.1080/00288231003685843
Barrow, N. J. (2000). Towards a single-point method for measuring phosphate sorption by soils. Aust. J. Soil Res. 38, 1099–1113. doi: 10.1071/sr99135
Bilotta, G. S., Brazier, R. E., and Haygarth, P. M. (2007). “The impacts of grazing animals on the quality of soils, vegetation, and surface waters in intensively managed grasslands,” in Advances in Agronomy, ed. L. S. Donald, (Cambridge, MA: Academic Press), 237–280. doi: 10.1016/s0065-2113(06)94006-1
Boitt, G., Black, A., Wakelin, S. A., McDowell, R. W., and Condron, L. M. (2018). Impacts of long-term plant biomass management on soil phosphorus under temperate grassland. Plant Soil 427, 163–174. doi: 10.1007/s11104-017-3429-0
Burkitt, L. L., Gourley, C. J. P., Hannah, M. C., and Sale, P. W. G. (2006). Assessing alternative approaches to predicting soil phosphorus sorption. Soil Use Manag. 22, 325–333. doi: 10.1111/j.1475-2743.2006.00042.x
Carpenter, S. R. (2008). Phosphorus control is critical to mitigating eutrophication. Proc. Natl. Acad. Sci. U.S.A. 105, 11039–11040. doi: 10.1073/pnas.0806112105
Cavanagh, J.-A. E., Yi, Z., Gray, C. W., Munir, K., Lehto, N., and Robinson, B. H. (2019). Cadmium uptake by onions, lettuce and spinach in New Zealand: implications for management to meet regulatory limits. Sci. Total Environ. 668, 780–789. doi: 10.1016/j.scitotenv.2019.03.010
Coad, J., Burkitt, L., Dougherty, W., and Sparrow, L. (2014). Decrease in phosphorus concentrations when P fertiliser application is reduced or omitted from grazed pasture soils. Soil Res. 52, 282–292. doi: 10.1071/SR13243
Delorme, T. A., Angle, J. S., Coale, F. J., and Chaney, R. L. (2000). Phytoremediation of Phosphorus-Enriched Soils. Int. J. Phytoremediation 2, 173–181. doi: 10.1080/15226510008500038
Dodd, R. J., McDowell, R. W., and Condron, L. M. (2012). Predicting the changes in environmentally and agronomically significant phosphorus forms following the cessation of phosphorus fertilizer applications to grassland. Soil Use Manag. 28, 135–147. doi: 10.1111/j.1475-2743.2012.00390.x
Dodd, R. J., McDowell, R. W., and Condron, L. M. (2013). Changes in soil phosphorus availability and potential phosphorus loss following cessation of phosphorus fertiliser inputs. Soil Res. 51, 427–436. doi: 10.1071/sr13168
Dodd, R. J., McDowell, R. W., and Condron, L. M. (2014a). Is tillage an effective method to decrease phosphorus loss from phosphorus enriched pastoral soils? Soil Tillage Res. 135, 1–8. doi: 10.1016/j.still.2013.08.015
Dodd, R. J., McDowell, R. W., and Condron, L. M. (2014b). Manipulation of fertiliser regimes in phosphorus enriched soils can reduce phosphorus loss to leachate through an increase in pasture and microbial biomass production. Agric. Ecosyst. Environ. 185, 65–76. doi: 10.1016/j.agee.2013.12.018
Dougherty, W. J., Nicholls, P. J., Milham, P. J., Havilah, E. J., and Lawrie, R. A. (2008). Phosphorus fertilizer and grazing management effects on phosphorus in runoff from dairy pastures all rights reserved. No part of this periodical may be reproduced or transmitted in any form or by any means, electronic or mechanical, including photocopying, recording, or any information storage and retrieval system, without permission in writing from the publisher. J. Environ. Qual. 37, 417–428. doi: 10.2134/jeq2007.0049
Edmeades, D. C., Metherell, A. K., Waller, J. E., Roberts, A. H. C., and Morton, J. D. (2006). Defining the relationships between pasture production and soil P and the development of a dynamic P model for New Zealand pastures: a review of recent developments. N. Z. J. Agric. Res. 49, 207–222. doi: 10.1080/00288233.2006.9513711
Fiorellino, N., Kratochvil, R., and Coale, F. (2017). Long-term agronomic drawdown of soil phosphorus in mid-Atlantic coastal plain soils. Agron. J. 109, 455–461. doi: 10.2134/agronj2016.07.0409
Fraser, P. M., Schon, N. L., Piercy, J. E., Mackay, A. D., and Minor, M. A. (2012). Influence of summer irrigation on soil invertebrate populations in a long-term sheep irrigation trial at Winchmore (Canterbury). N. Z. J. Agric. Res. 55, 165–180. doi: 10.1080/00288233.2012.662902
Gotcher, M. J., Zhang, H., Schroder, J. L., and Payton, M. E. (2014). Phytoremediation of soil phosphorus with crabgrass. Agron. J. 106, 528–536. doi: 10.2134/agronj2013.0287
Hart, M. R., Quin, B. F., and Nguyen, M. L. (2004). Phosphorus runoff from agricultural land and direct fertilizer effects: a review. J. Environ. Qual. 33, 1954–1972. doi: 10.2134/jeq2004.1954
Hewitt, A. E. (2010). New Zealand Soil Classification. Lincoln: Manaaki Whenua Press – Landcare Research.
Jowett, I. (2009). Time Trends Software, 3rd Edn. Christchurch: National Institute of Water and Atmospheric Research.
Livestock Improvement (2001). Dairy Statistics 2000/01. Hamilton: Livestock Improvement Incorporation.
Ma, Y., Li, J., Li, X., Tang, X., Liang, Y., Huang, S., et al. (2009). Phosphorus accumulation and depletion in soils in wheat–maize cropping systems: modeling and validation. Field Crops Res. 110, 207–212. doi: 10.1016/j.fcr.2008.08.007
McBride, S. D., Nguyen, M. L., and Rickard, D. S. (1990). Implications of ceasing annual superphosphate topdressing applications on pasture production. Proc. N. Z. Grass. Assoc. 52, 177–180.
McCollum, R. E. (1991). Buildup and decline in soil phosphorus 30-year trends on a typic Umbraquult. Agron. J. 83, 77–85. doi: 10.2134/agronj1991.00021962008300010019x
McDonald, N. T., Wall, D. P., Mellander, P. E., Buckley, C., Shore, M., Shortle, G., et al. (2019). Field scale phosphorus balances and legacy soil pressures in mixed-land use catchments. Agric. Ecosyst. Environ. 274, 14–23. doi: 10.1016/j.agee.2018.12.014
McDowell, R. W., and Condron, L. M. (2004). Estimating phosphorus loss from New Zealand grassland soils. N. Z. J. Agric. Res. 47, 137–145. doi: 10.1080/00288233.2004.9513581
McDowell, R. W., Hedley, M. J., Pletnyakov, R., Rissmann, C., Catto, W., and Patrick, W. (2019). Why are median phosphorus concentrations improving in New Zealand streams and rivers? J. R. Soc. N. Z. 49, 143–170. doi: 10.1080/03036758.2019.1576213
McDowell, R. W., Mahieu, N., Brookes, P. C., and Poulton, P. R. (2003). Mechanisms of phosphorus solubilisation in a limed soil as a function of pH. Chemosphere 51, 685–692. doi: 10.1016/s0045-6535(03)00107-3
McDowell, R. W., Monaghan, R. M., Dougherty, W. J., Gourley, C. J. P., Vibart, R., and Shepherd, M. (2017). Balancing water quality threats from nutrients and production in Australian and New Zealand dairy farms under low profit margins. Anim. Prod. Sci. 57, 1419–1430.
McDowell, R. W., and Nash, D. (2012). A review of the cost-effectiveness and suitability of mitigation strategies to prevent phosphorus loss from dairy farms in New Zealand and Australia. J. Environ. Qual. 41, 680–693. doi: 10.2134/jeq2011.0041
McDowell, R. W., Nash, D. M., and Robertson, F. (2007). Sources of phosphorus lost from a grazed pasture receiving simulated rainfall. J. Environ. Qual. 36, 1281–1288. doi: 10.2134/jeq2006.0347
Ministry for the Environment, (2019). Action for Healthy Waterways – A Discussion Document on National Direction for Our Essential Freshwater. Wellington: Ministry for the Environment.
Monaghan, R. M., Laurenson, S., Dalley, D. E., and Orchiston, T. S. (2017). Grazing strategies for reducing contaminant losses to water from forage crop fields grazed by cattle during winter. N. Z. J. Agric. Res. 60, 333–348. doi: 10.1080/00288233.2017.1345763
Morton, J. D., McDowell, R. W., Monaghan, R. M., and Roberts, A. H. C. (2003). Balancing phosphorus requirements for milk production and water quality. Proc. N. Z. Grass. Assoc. 65, 111–115.
Morton, J. D., and Roberts, A. H. C. (2016). Fertiliser use on New Zealand Sheep and Beef Farms. Auckland: New Zealand Fertiliser Manufacturers’ Research Association.
Nair, V. D. (2014). Soil phosphorus saturation ratio for risk assessment in land use systems. Front. Environ. Sci. 2:6. doi: 10.3389/fenvs.2014.00006
Nash, D. M., McDowell, R. W., Condron, L. M., and McLaughlin, M. J. (2019). Direct exports of phosphorus from fertilizers applied to grazed pastures. J. Environ. Qual. 48, 1380–1396. doi: 10.2134/jeq2019.02.0085
Newsome, P. F. J., Wilde, R. H., and Willoughby, E. J. (2008). Land Resource Information System Spatial Data Layers. Lincoln: Manaaki Whenua – Landcare Research.
Nicholls, A., van der Weerden, T. J., Morton, J. D., Metherell, A., and Sneath, G. (2009). Managing Soil Fertility on Cropping Farms. Auckland: New Zealand Fertiliser Manufacturers’ Research Association.
Nichols, S. N., and Crush, J. R. (2016). “Develping nutrient efficient clovers for New Zealand farmers,” in Integrated Nutrient and Water Management for Sustainable Farming, eds L. D. Currie and R. Singh, (Palmerston North: Fertilizer and Lime Research Centre, Massey University).
O’Connor, M. B., Longhurst, R. D., Johnston, T. J. M., and Portegys, F. N. (2001). Fertilizer requirements for peat soils in the Waikato region. Proc. N. Z. Grass. Assoc. 63, 47–51.
O’Connor, M. B., Smart, C. E., and Ledgard, S. F. (1990). Long term effects of withholding phosphate applicaton on North Island hill country: Te Kuiti. Proc. N. Z. Grass. Assoc. 51, 21–24.
Qin, Z., and Shober, A. (2018). The challenges of managing legacy phosphorus losses from manure-impacted agricultural soils. Curr. Pollut. Rep. 4, 265–276. doi: 10.1007/s40726-018-0100-1
Reid, J. R., and Morton, J. (2019). Nutrient Management for Vegetable Crops in New Zealand. Wellington: Horticulture New Zealand.
Reid, K., Schneider, K., and Joosse, P. (2019). Addressing imbalances in phosphorus accumulation in Canadian agricultural soils. J. Environ. Qual. 48, 1156–1166. doi: 10.2134/jeq2019.05.0205
Ribey, M. A., and O’Halloran, I. P. (2016). Consequences of Ontario P index recommendations for reduced manure and fertilizer phosphorus applications on corn yields and soil phosphorus. Can. J. Soil Sci. 96, 191–198. doi: 10.1139/cjss-2015-0072
Roberts, A. H. C., and Morton, J. D. (2009). Fertiliser use on New Zealand Dairy Farms. Auckland: New Zealand Fertiliser Manufacturers’ Research Association.
Sadeghpour, A., Ketterings, Q. M., Godwin, G. S., and Czymmek, K. J. (2017). Shifting from N-based to P-based manure management maintains soil test phosphorus dynamics in a long-term corn and alfalfa rotation. Agron. Sustain. Dev. 37, 8. doi: 10.1007/s13593-017-0416-z
Sandral, G. A., Haling, R. E., Ryan, M. H., Price, A., Pitt, W. M., Hildebrand, S. M., et al. (2018). Intrinsic capacity for nutrient foraging predicts critical external phosphorus requirement of 12 pasture legumes. Crop Pasture Sci. 69, 174–182. doi: 10.1071/CP17276
Saunders, W. M. H. (1965). Phosphate retention by New Zealand soils and its relationship to free sesquioxides, organic matter, and other soil properties. N. Z. J. Agric. Res. 8, 30–57. doi: 10.1080/00288233.1965.10420021
Sharpley, A., Jarvie, H. P., Buda, A., May, L., Spears, B., and Kleinman, P. (2013). Phosphorus Legacy: overcoming the effects of past management Practices to mitigate future water quality impairment. J. Environ. Qual. 42, 1308–1326. doi: 10.2134/jeq2013.03.0098
Sharpley, A., and Tunney, H. (2000). Phosphorus research strategies to meet agricultural and environmental challenges of the 21st century. J. Environ. Qual. 29, 176–181. doi: 10.2134/jeq2000.00472425002900010022x
Sharpley, A. N. (2003). Soil mixing to decrease stratification of phosphorus in manured soils. J. Environ. Qual. 32, 1375–1384.
Shepherd, M. A., Stockdale, E. A., Powlson, D. S., and Jarvis, S. C. (1996). The influence of organic nitrogen mineralization on the management of agricultural systems in the UK. Soil Use Manag. 12, 76–85. doi: 10.1111/j.1475-2743.1996.tb00963.x
Sistani, K. R., Pederson, G. A., Brink, G. E., and Rowe, D. E. (2003). Nutrient uptake by ryegrass cultivars and crabgrass from a highly phosphorus−enriched soil. J. Plant Nutr. 26, 2521–2535. doi: 10.1081/PLN-120025476
Sparling, G., Lilburne, L., and Vojvodic-Vukovic, M. (2008). Provisional Targets for Soil Quality Indicators in New Zealand. Palmerston North: Manaaki Whenua – Landcare Research.
Sparling, G., and Schipper, L. A. (2002). Soil quality at a national scale in New Zealand. J. Environ. Qual. 31, 1848–1857. doi: 10.2134/jeq2002.1848
Svanbäck, A., Ulén, B., Bergström, L., and Kleinman, P. J. A. (2015). Long-term trends in phosphorus leaching and changes in soil phosphorus with phytomining. J. Soil Water Conserv. 70, 121–132. doi: 10.2489/jswc.70.2.121
Toor, G. S., and Sims, J. T. (2015). Managing phosphorus leaching in mid-Atlantic soils: importance of legacy sources. Vadose Zone J. 14, 1–12. doi: 10.2136/vzj2015.08.0108
van Dijk, K. C., Lesschen, J. P., and Oenema, O. (2016). Phosphorus flows and balances of the European Union Member States. Sci. Total Environ. 542(Pt B), 1078–1093. doi: 10.1016/j.scitotenv.2015.08.048
Vlahos, S., Summers, K. J., Bell, D. T., and Gilkes, R. J. (1989). Reducing phosphorus leaching from sandy soils with red mud bauxite processing residues. Aust. J. Soil Res. 27, 651–662.
Wheeler, D. M., Sparling, G. P., and Roberts, A. H. C. (2004). Trends in some soil test data over a 14−year period in New Zealand. N. Z. J. Agric. Res. 47, 155–166. doi: 10.1080/00288233.2004.9513583
Withers, P. J. A., Vadas, P. A., Uusitalo, R., Forber, K. J., Hart, M., Foy, R. H., et al. (2019). A Global perspective on integrated strategies to manage soil phosphorus status for eutrophication control without limiting land productivity. J. Environ. Qual. 48, 1234–1246. doi: 10.2134/jeq2019.03.0131
Zhang, J., Beusen, A. H. W., Van Apeldoorn, D. F., Mogollón, J. M., Yu, C., and Bouwman, A. F. (2017). Spatiotemporal dynamics of soil phosphorus and crop uptake in global cropland during the 20th century. Biogeosciences 14, 2055–2068. doi: 10.5194/bg-14-2055-2017
Keywords: Olsen phosphorus, soil test phosphorus, surface runoff, water extractable phosphorus, leaching
Citation: McDowell R, Dodd R, Pletnyakov P and Noble A (2020) The Ability to Reduce Soil Legacy Phosphorus at a Country Scale. Front. Environ. Sci. 8:6. doi: 10.3389/fenvs.2020.00006
Received: 20 November 2019; Accepted: 09 January 2020;
Published: 30 January 2020.
Edited by:
Paulo Sergio Pavinato, University of São Paulo, BrazilReviewed by:
Cledimar Rogério Lourenzi, Federal University of Santa Catarina, BrazilDonnacha Doody, Agri-Food and Biosciences Institute (AFBI), United Kingdom
Carlos Antonio Costa Do Nascimento, São Paulo State University, Brazil
Copyright © 2020 McDowell, Dodd, Pletnyakov and Noble. This is an open-access article distributed under the terms of the Creative Commons Attribution License (CC BY). The use, distribution or reproduction in other forums is permitted, provided the original author(s) and the copyright owner(s) are credited and that the original publication in this journal is cited, in accordance with accepted academic practice. No use, distribution or reproduction is permitted which does not comply with these terms.
*Correspondence: Richard McDowell, richard.mcdowell@agresearch.co.nz