Temporal-Spatial Evolution and Driving Factors of the Green Total Factor Productivity of China’s Central Plains Urban Agglomeration
 Fengting Wang
 Ruichao Li3
  Chang Yu
 Lichun Xiong
 Yuan Chang
- 1College of Economics and Management, Zhejiang A&F University, Hangzhou, China
- 2Zhejiang Province Key Cultivating Think Tank Research Academy for Rural Revitalization of Zhejiang Province, Zhejiang A&F University, Hangzhou, China
- 3School of Economics and Management, Beijing Forestry University, Beijing, China
- 4School of Management Science and Engineering, Central University of Finance and Economics, Beijing, China
As China’s largest urban agglomeration with rapid growth of economy and population, the development of the Central Plains Urban Agglomeration (CPUA) has been severely restricted by environmental problems. Thus, the green development performance of the CPUA is worth studying. This study used the panel data of 29 cities in the CPUA from 2003 to 2018 based on the Slacks-based Measure and Global Malmquist–Luenberger index to measure the green total factor productivity (GTFP) and its decomposition index of each city. A spatial econometric model was developed to explore the factors affecting the GTFP of the CPUA. The results show that the GTFP of the CPUA had an upward trend in 2003–2018, but the productivity level was still low. There were significant spillover effect in the GTFP among different cities of the CPUA. The results of the spatial measurement model show that technological progress, industrial structure and solid waste environmental regulationhave a significant positive spillover effect on the GTFP. The, fiscal expenditure, and informatization level also have positive impacts on the GTFP. In the future, local government should provide technical and financial support for the development of green industries in the CPUA, and accelerate the construction of environmental protection infrastructures.
Introduction
Currently, an urban agglomeration is a center of economic, cultural and industrial activities. The data related to global urban development show that cities accommodate more than 60% of the world population. However, the excessive utilization of resources and environmental pollution have already handicapped the development of urban agglomerations (Bank, 2017; Lewis, 2018; Li et al., 2019). China has 10 of the 25 most polluted cities in the world (Wang et al., 2017). The emissions of sulfur dioxide, wastewater, smoke, and dust in China rank first in the world, and 90% is generated in cities (National Bureau of Statistics, 2019b). Therefore, how to reduce pollution and implement green transformation during urbanization is key to realizing the Sustainable Development Goals of the United Nations by 2030. China has continuously proposed planning for several urban agglomerations with indicators regarding the environment, resource utilization, and industrial structure to cope with urban environmental problems.
As one of the national-level urban agglomerations, the Central Plains Urban Agglomeration (CPUA) has the largest agglomeration scale and the most concentrated population in China. The goal of the CPUA in national planning is to become a demonstration area for green ecological development and become a new growth pole of China’s economy. However, the CPUA is currently facing severe problems of pollution and ecological damage. Most industries in the CPUA are resource-consuming and pollution-intensive industries. Besides, the CPUA is short of water endowment. The per capita water resources are less than one-fifth of the national average, causing an imbalance between the water supply and demand. In contrast, the discharge of wastewater and the chemical oxygen demand in the CPUA rank in the top five in China. Furthermore, air pollution seriously exceeds standards. The concentration of sulfur dioxide exceeds 2DU1, which is more than 10 times the international carcinogenic concentration threshold value. In the past five years, the serious air pollution days of the CPUA accounted for 55% of the days in a year. Moreover, the CPUA’s terrain characteristics and aerostatic temperature inversion make pollutant diffusion more difficult. Additionally, the per capita discharge of solid waste in the CPUA is nearly 10 times that of the national average. All these facts require a clarification of the mechanisms to improve urban environmental management to stimulate the green transformation of the CPUA.
Therefore, this paper aims to calculate the CPUA’s green total factor productivity (GTFP) that is widely used to measure the urban green development based on various resource and environmental factors. We further clarify the GTFP’s temporal and spatial evolution characteristics, and explore its driving factors with a spatial econometric model. The paper is organized as follows: Literature Review conducts the literature review regarding the environmental studies in the Central Plains Urban Agglomeration and the methods for calculating green total factor productivity. Methods and Materials introduces the research methods of Slacks-based Measure (SBM) and Global Malmquist–Luenberger (GML) models and provides data sources. Empirical Results Analysis aims to present the spatial and temporal characteristics of the GTFP and provides the spatial econometric regression results of the influencing factors of GTFP in the CPUA. Discussion and Conclusion are the discussion and conclusion, respectively. The research results will provide an empirical reference for coordinating the rapid economic development and environmental performance in the large-scale urban agglomerations.
Literature Review
With the aggravation of the environment and resource restriction, the mechanisms of urban sustainable development are becoming increasing important in terms of the coordination of the economy and environment, urban environmental quality, and industrial structure adjustment. Regarding urban environmental quality, a series of indictors (e.g., waste water, exhaust gas, solid waste, carbon dioxide, and PM2.5) are often used to monitor and control environmental quality (Chen et al., 2019). Several scholars have studied the sources of PM2.5 in the CPUA and discovered that motor vehicle exhaust was a main source; additionally, the high PM2.5 concentration was centralized in winter (Qiu et al., 2014; Liu et al., 2018; Liu et al., 2019). Moreover, the adjustment of the industrial structure can increase the ratio of low-energy industries and promote industrial transformation, which is an effective measure to stimulate urban green development (Porfiryev and Bobylev, 2018). As the environmental problems of urban development become more intense, analyzing the performance and mechanisms of urban green development is inevitable for scientific decision-making for urban management.
The previous research on the performance of urban green development mainly focused on evaluating the methods and influencing factors of green development performance. Green development refers to the measurement of economic and social development levels that should consider environmental impact and resource utilization. This concept can be specified by a set of indexes to present environmental efficiency and sustainability in economic development. Färe et al. (1992) first proposed the measurement index of green development to analyze the relationship between environmental pollution in the papermaking industry and industrial development in Switzerland (Färe et al., 1992). The evaluation of traditional economic productivity in the early stage focused only on economic output, and total factor productivity (TFP) was frequently used to evaluate economic performance. The expected output indicators of the economy (e.g., GDP and industrial added value) were often used as the output variables, while the negative externalities of economic and social activities on environmental resources received less attention. This result may cause the performance of economic growth to be overestimated. As the calculating methods advance, the level of green development can more accurately evaluate the actual economic development. With the increasing constraints on resource carrying capacity and environmental capacity, an increasing number of scholars and government departments regard the green development level as an important indicator for regional economic development assessments (Oh, 2010; Ke and Lin, 2017; Marimin et al., 2018). The green total factor productivity (GTFP) has been widely used to measure the actual level of socioeconomic development of resources and environmental factors. To calculate the GTFP, the Frontier methods considering technical inefficiency are mostly used, mainly including data envelopment analysis (DEA) (based on nonparametric methods), and stochastic Frontier analysis (SFA) (based on parametric methods). DEA method can effectively avoid the setting errors of equation form, making it easier to operate (Sueyoshi and Goto, 2017; Han et al., 2018). Among the DEA models, the Slacks-based Measure (SBM) can incorporate the undesirable outputs in the aspects of environmental issues (Sueyoshi and Goto, 2017). Moreover, the DEA model has often been combined with index analysis, including the Malmquist index, Malmquist–Luenberger (ML) index and global Malmquist–Luenberger (GML) index. The Malmquist index was first put forward by Malmquist in 1953 (Malmquist, 1953). However, this index may overestimate environmental efficiency because the index could not measure environmental efficiency with undesirable outputs. Later, Chung et al. (1997) developed the Shephard distance function into the directional distance function and constructed a ML index, to reduce the bias in the environmental efficiency measurement (Chung et al., 1997). However, the ML index came with problems, such as infeasible solutions of linear programming. To solve the problems, Oh (2010) proposed a GML index (Oh, 2010). Since then, the combination of the GML index and the non-radial distance function has become a more scientific method for measuring the GTFP.
Most studies on the GTFP have considered the influencing factors such as policy, technology, management, scale, and information. Yang et al. (2017) investigated the green production performance of the steel industry in China using the DEA and Luenberger index and noted that carbon emission regulation policies have not played an effective role in emission reductions and industrial development (Yang et al., 2017). Zhu et al. (2018) analyzed the GTFP of the mining industry from 1991 to 2014 and found that gradual improvements in the management efficiency of the mining industry have become an important factor (Zhu et al., 2018). Wang and Feng (2015) investigated the regional productivity growth of China from 2003 to 2011 with global DEA and discovered that the declining scale and management efficiency were the two obstacles to green productivity. Sanchez-Vargas et al. (2013) found a nonlinear relationship between environmental regulation and productivity in manufacturing research in Mexico (Sanchez-Vargas et al., 2013). The nonlinear relationship was also found by Wang and Shen (2016) in their research on sub-industries of China, and it conformed to the Porter hypothesis (Wang and Shen, 2016). Albrizio et al. (2017), based on OECD national panel data studies, found that the positive impact of environmental policy intensity on productivity growth was reflected only in a short period of time and weakened as it progressed from the global production Frontier (Albrizio et al., 2017). Additionally, Newman et al. (2015), based on more than 4,000 production enterprises in Vietnam, noted that technological transfer and investments abroad had a spillover effect on productivity (Newman et al., 2015). Brock et al. (2004) found that industrial structure promoted the separation of production factors from highly polluting industries, thereby increasing the GTFP. Other factors, such as marketization degree, informatization level, fiscal decentralization and urbanization rate, also influenced GTFP to some extent (Munisamy and Arabi, 2015; Feng et al., 2017; Lin and Chen, 2018; Zhu et al., 2018). In addition, spatial econometrics have been widely used to investigate spatial spillover effect of the GTFP (Xie et al., 2019).
The previous literature has made fruitful achievements in terms of GTFP, but three aspects still can be improved. First, most studies on environmental pollution and green development have focused on provincial or national scales or on industrial scales, but fewer studies have focused on cities or microscales. In addition, few studies focus on the green total factor productivity of China’s Central Plains Urban Agglomeration which is an agglomeration area with the most serious environmental pollution. Second, most of the existing research methods use the traditional DEA and Malmquist or Malmquist–Luenberger index to decompose the index, which may have the problems of infeasible solutions. Third, existing studies have not considered the influence of regional heterogeneity on GTFP and pay less attention to the spatial spillover effect of GTFP. Accordingly, our study aims to study the green total factor productivity of the Central Plains Urban Agglomeration in China based on the combination of the SBM model and the GML index. Moreover, the econometric model is used to explore the spatial spillover effect of the green total factor productivity and its influencing factors in the Central Plains Urban Agglomeration.
Methods and Materials
Sampling Sites
The study area, shown in Figure 1, is located in the central and eastern parts of China and covers five provinces (i.e., Henan, Hebei, Shanxi, Shandong and Anhui), including 30 prefecture cities, forming an urban agglomeration with close economic and social ties. In 2019, its GDP was 1,210.72 billion dollars, with an area of 2.87 square kilometers and a total population of 164.33 million, accounting for 12% of China’s population (National Bureau of Statistics, 2019b). As China’s fourth largest urban agglomeration, it undertakes the industrial transfer from China’s eastern regions. The development goal of this urban agglomeration is to be a new growth pole and a green ecological development demonstration zone by 2030 to promote the central and western regions in China.
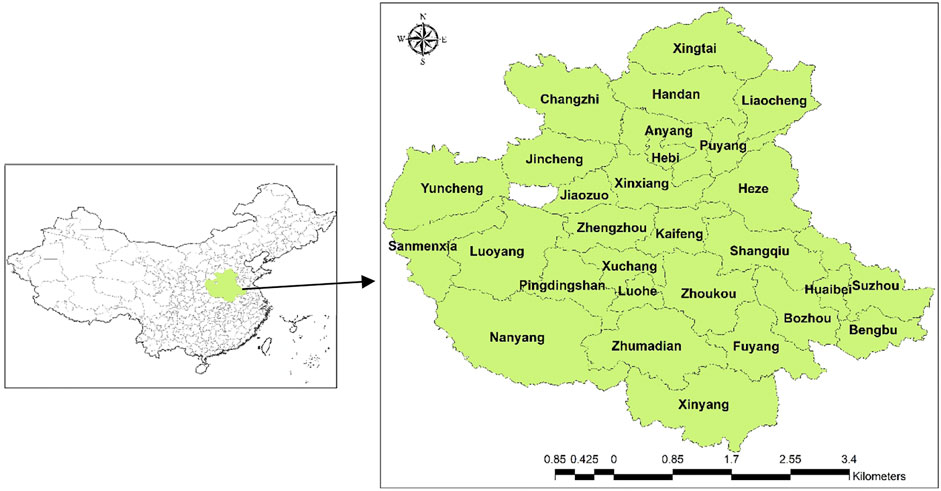
FIGURE 1. Location of the study area in the CPUA.
Methods
GTFP Measurement and Its Decomposition
The green total factor productivity (GTFP) is usually expressed by an exponential method, and this paper adopts a non-radial SBM model with an undesirable output and the GML index to calculate the GTFP. At production time t, each city is taken as the decision-making unit DMU. x,y,b represent the input vector, desirable output vector and undesirable output vector, respectively. The production possibility set Pt of DMU at production time t is shown in Eq. 1:
Where
In which the non-radial and non-angular SMB directional global distance function with undesirable output refers to
Where
Econometric Model Setting
A prerequisite of spatial econometric analysis is to determine the spatial distance between regions, and the spatial weight matrix is used to measure the relationship between different regions in terms of geographic distance or economic attributes. There are three commonly used spatial weight matrices: adjacency matrix, geographic distance matrix, and economic distance matrix (Bivand and Piras, 2013). The GTFP refers to the input-output efficiency under resource environment constraints, which are greatly influenced by the degree of economic development between areas. Therefore, to comprehensively reflect the influence of multiple factors such as the geographical distance, economic development level and social relationship on the spatial correlation of the GTFP, this paper uses the economic distance as the spatial weight matrix (Durbin, 1998). The economic distance matrix is represented as
Where I refers to the Moran’s index, Wij refers to the spatial weight matrix, pi refers to the GTFP of each city,
To explore the spillover effect of the GTFP, the spatial panel data model is established as shown in Eq. 5:
Where
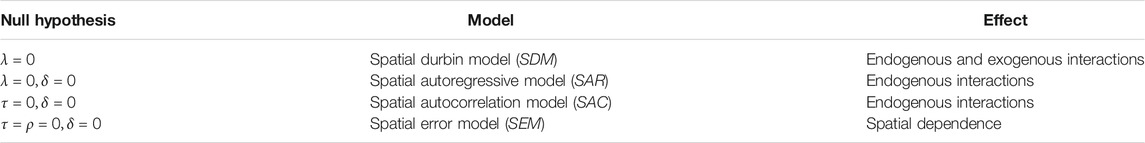
TABLE 1. Adaptability test of spatial econometric model.
The dependent variable refers to the CPUA for weighing the green development level of each city in the CPUA. The input indicators for measuring the GTFP include the capital, labor, land, and water resources. Among them, capital investment is expressed by the fixed asset investment, and depreciation is based on the year 2003. Labor and land indicators are represented by the number of employed people and the area of urban construction land at the end of the year, respectively, and the water resource is measured by the total urban water use per year. The desirable output is calculated by the actual GDP of each city. The undesirable output is calculated by the three indicators of wastewater, waste gas and solid waste, namely, industrial wastewater discharge, industrial sulfur dioxide emissions and industrial smoke or powder dust emissions. The descriptive statistics of the input-output indicators for estimating the GTFP are shown in Table 2.
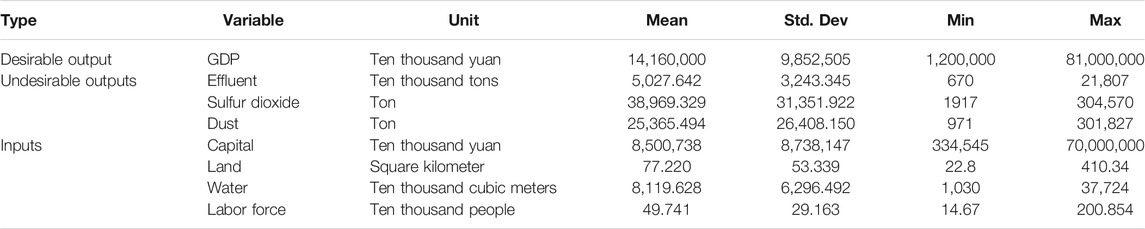
TABLE 2. Statistical analysis of input-output variables.
In the model, the global technical change TECHC, green level of industrial structure STRU and environmental regulation intensity REGU are the core explanatory variables. The technical change can reflect the degree of proximity of the production activity toward the technical Frontier area, and it is the technical support for the improvement of the GTFP and comes from the GML index decomposition. The green level of industrial structure is measured by the rationalization degree of the industrial structure, and the improvement of the rationalization of the industrial structure indicates that the structural transformation capability and resource utilization degree between industries have improved. Furthermore, the greening of the industrial structure has become an important factor in terms of achieving the coordinated development of economic performance and environmental performance, and it is the direction of regional green development. The level of industrial greening is calculated using the method proposed by Bin (2015), which is reflected by the degree of rationalization of the industrial structure, and its formula is as follows:
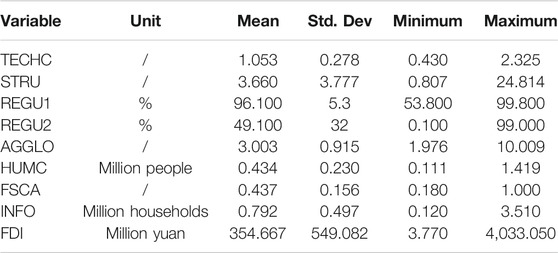
TABLE 3. Definition of variables and descriptive statistical analysis.
Data Sources
In this study, we acquired the data of 29 cities1 in the CPUA from 2003 to 2018, and the sample size is 464. The year of 2003 is used as the beginning year because the data of discharge gas, wastewater and solid waste start to be recorded. The year of 2018 is the latest year of the updated data. The main data are derived from the China City Statistical Yearbook, China Statistical Yearbook on Environment, China Statistical Yearbook for Regional Economy, annual statistical yearbook of each city in CPUA and Ministry of Housing and Urban-Rural Development. The missing data in some years were supplemented by interpolation, such as moving average and piecewise linear methods. The statistical analysis software used in this study include MaxDEA6.7, ArcGIS10.2 and Stata15.
Empirical Results Analysis
Temporal and Spatial Characteristics of the GTFP
Figure 2 depicts the interannual dynamics of the cumulative GTFP in the CPUA and sub-regions from 2003 to 2018. The overall GTFP of the CPUA shows a volatile trend, and the later rise is relatively sharp. In terms of regions, the difference in the GTFP among the five regions is significant. Hebei and Anhui provinces have higher productivity values, with an average annual value of 1.9,2.2, respectively. Shanxi and Henan have lower values, with an annual productivity of 1.1,1.4, respectively, and the productivity of Shandong is at a medium level (1.5). From the perspective of changes, the five regions showed a trend of steadily increasing. In the last two years, there has been a sharp increase. Hebei had the largest increase in the study period, followed by that of Anhui, and Shanxi had the smallest change during the study period. In addition, the regional difference in the GTFP was significant. The city with the highest annual average value of GTFP was Luohe (1.29), the lowest was Xinxiang (0.98), and the former was 1.3 times the value of the latter.
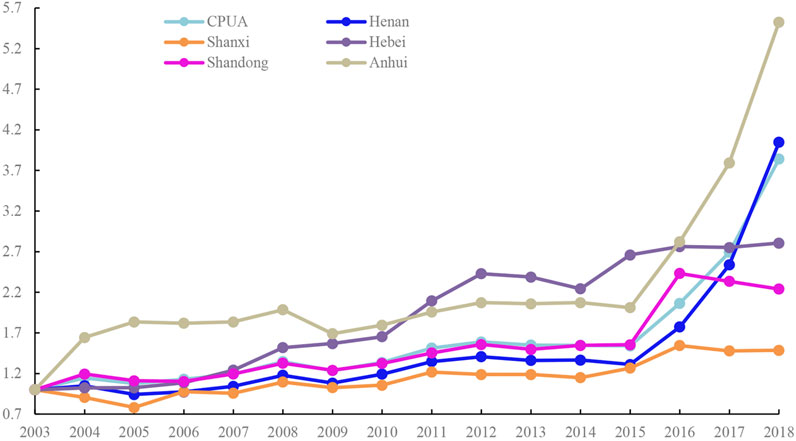
FIGURE 2. Cumulative GTFP in the CPUA and sub-regions from 2003 to 2018.
Figure 3 shows the dynamic evolution of the three indexes of the cumulative global productivity index (CGML), global technical efficiency index (CGEC) and global technical change index (CGTC) for the CPUA. As shown in Figure 3, the CGML and CGEC indexes steadily increased, while the global technical progress index showed alternating peaks and valleys throughout the study period; thus, the index significantly changed and was unstable.
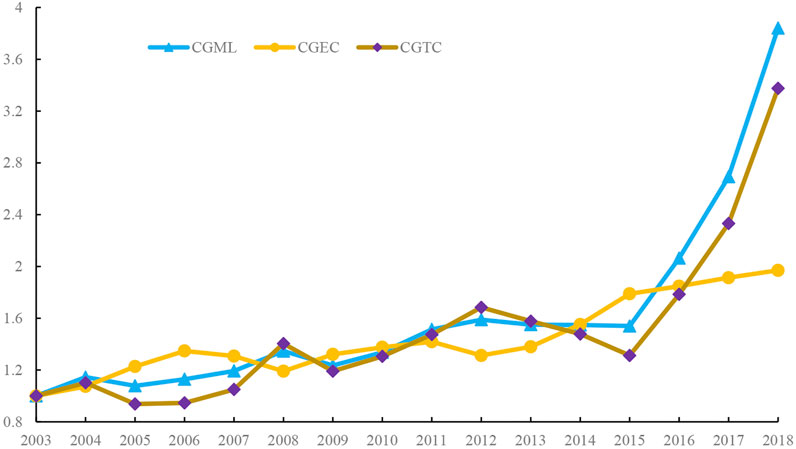
FIGURE 3. Three cumulative GTFP indices in the CPUA from 2003 to 2018. Note: The geometric mean of the GTFP of the 29 cities in the CPUA is used as the index of each year.
The spatial distribution characteristics of the GTFP in the CPUA in 2004 and 2018 were depicted with Arcgis10.2 software as shown in Figure 4 From the perspective of interannual change, the GTFP in the CPUA showed a gradual upward trend. In 2004, the GTFP value of 55% of the cities in the CPUA was greater than 1, while in 2018, more than 83% of the cities had GTFP values above 1. In terms of the spatial distribution, the GTFP of 55% cities in the CPUA had apparent intercity differences. The three cities with higher average GTFP in the CPUA were Luohe (2.28), Fuyang (2.09) and Bengbu (1.80), and the three cities with the lowest values were Xinxiang (0.83), Changzhi (0.85) and Handan (0.92). Meanwhile, the cities with higher GTFP values, such as Bengbu and Zhengzhou, were clustered together, and the cities with lower GTFP, such as Handan and Changzhi, were clustered together.
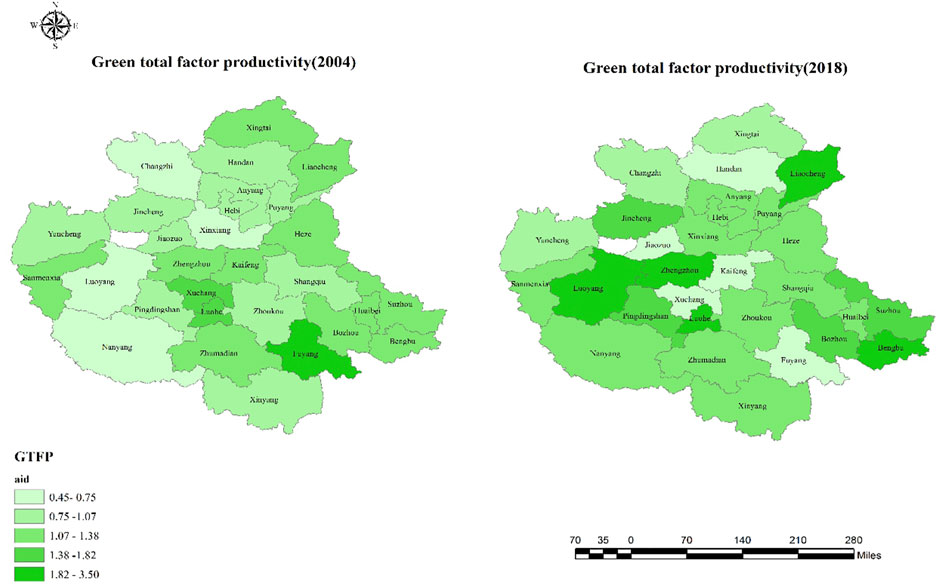
FIGURE 4. Green total factor productivity of the CPUA in 2004 and 2018.
Empirical Results
Econometric Model Setting
Based on the economic distance spatial weight matrix, the global Moran’s I test value of the GTFP of the 29 cities is shown in Table 4. Except for the individual years, the Moran’s I value in the remaining years rejected the null hypothesis of no spatial autocorrelation (p < 0.1). Therefore, it is necessary to introduce a spatial econometric model. It should be noted that the insignificance of the CPUA Green Development Moran’s I in the four years does not fully indicate that the spatial autocorrelation of green development in these years does not exist. The global Moran index examines the spatial agglomeration between regions in the entire space, while the local Moran index or the local Getis-Ord index can further measure the spatial agglomeration near each region. Specifically, although the global spatial autocorrelation indexes of 2009, 2012, and 2014 are not significant, the local spatial autocorrelation indexes of these three years, measured by the Getis-Ord index, all reject those with no spatial autocorrelation at a significant level of 1%. The original hypothesis is that there is spatial autocorrelation, and there is also a spatial agglomeration of GTFP near the cities in the Central Plains urban agglomeration in these three years. Due to space limitations, the local spatial autocorrelation index results of the cities in CPUA in the three years are included in Supplementary Tables S1–S3. In addition, the calculation of spatial autocorrelation indicators such as the Moran index and hypothesis testing only provides a preliminary test of whether there is a spatial effect. In-depth testing relies on the establishment of a formal spatial measurement model. The subsequent spatial measurement model results prove the existence of spatial effects. Therefore, it can basically be explained that there is also a certain degree of spatial autocorrelation in green development, and the phenomenon of spatial agglomeration of green development industries has also existed objectively.
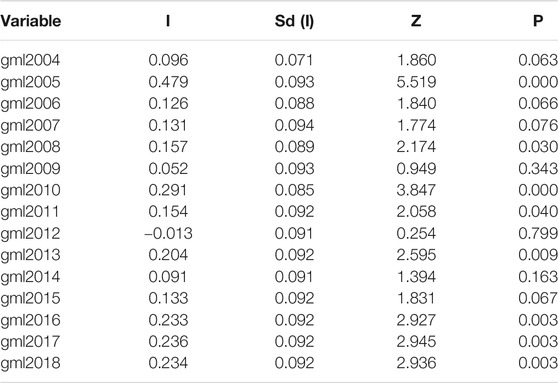
TABLE 4. Global moran index results.
Model Test
The Multicollinearity test refers to the fact that the explanatory variables in the linear regression model are distorted or difficult to estimate accurately due to the existence of precise correlation or high correlation. In order to test whether the model has multiple collinearity problems, the variance inflation factor (VIF) is usually used to test. The basic idea of detection is that when the value of VIF is greater than 1, the closer the VIF value is to 1, the lighter the multicollinearity, and vice versa. Usually 10 is used as the judgment boundary. When VIF<10, there is no multicollinearity; when 10 ≤ VIF<100, there is strong multicollinearity; when VIF ≥ 100, there is severe multicollinearity. Because the VIF results of all variables in this model are less than 10, there is no multicollinearity problem in this model. Multicollinearity test results shown in Table 5 reflected that the variance inflation factor (VIF) of all independent variables was less than 10, which rejects the null hypothesis of multicollinearity; thus, there was no multicollinearity problem in the model.
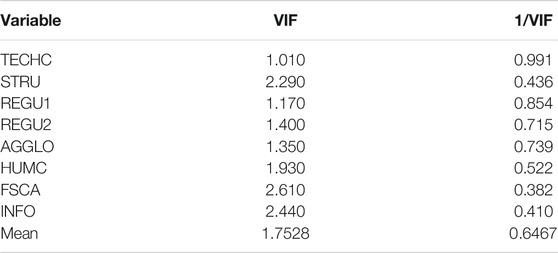
TABLE 5. Results of VIF test.
For the choice of panel model form, the Hausman test results showed that the fixed effect was appropriate (p = 0.006 < 0.01). Regarding the choice of spatial econometric model form, the Wald and L ratio tests were performed to test the adaptability of the spatial econometric model, in reference to Elhorst (2014). The spatial autocorrelation coefficient of the independent variable
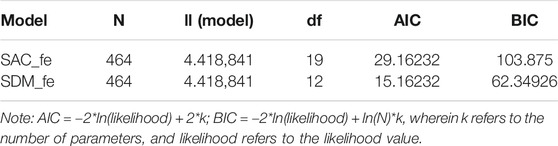
TABLE 6. Adaptability test of SAC and SDM models.
Influencing Factors of GTFP
This paper uses the maximum likelihood estimation method to estimate the model parameters with the stata15.0 software. The estimation results of the spatial panel model and OLS are shown in Table 7. It is worth noting that the regression coefficient of the variables in the SDM model different from the ordinary regression coefficient, and the marginal effect of the independent variable on the dependent variable is reflected by the direct effect, indirect effect and total effect (Lesage and Pace, 2014). Due to the limited length of the paper, Table 7 only presents the regression results of the total effects of the parameter estimates of variables. The regression results of the direct effects and indirect effects are detailed in Supplementary Table S4. It can be seen from Table 7 that the parameter estimation directions of the explanatory variables of the two models are the same, and the parameter values are different. For spatial effects, the MLE estimation is more efficient than the ordinary least squares (OLS).
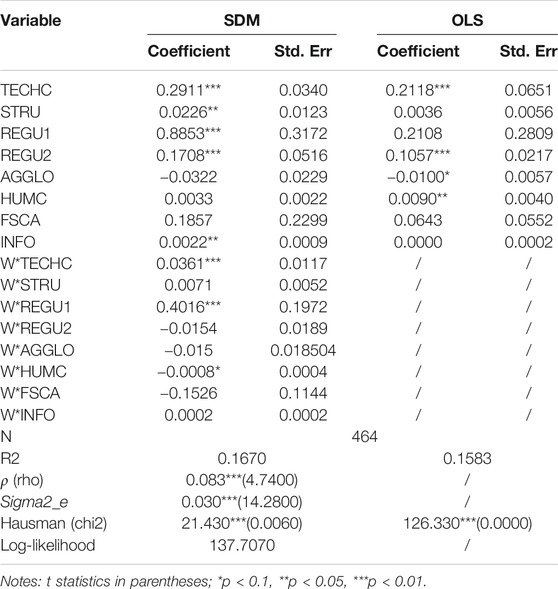
TABLE 7. Spatial panel model estimation results.
The Sigma2_e and log-likelihood shown in Table 7 indicated that the model had a higher level of fit. In addition, the spatial autoregressive coefficient
Discussion
For The results of Empirical Results Analysis reveal the status of the GTFP of cities in the CPUA from 2003 to 2018. During this period, the GTFP values of 29 cities in the CPUA showed an upward trend. Meanwhile, there were significant differences among different cities in terms of the GTFP. The number of cities with GTFP values greater than one in the CPUA increased by 28% during 2003–2018. The values of GTFP in the northern and southern parts of the CPUA were relatively high, while the values in the western and central regions were relatively low. The city with the highest average value of GTFP (Fuyang) was 1.3 times the lowest value (Xinxiang). From the perspective of the current urban green development pattern in the CPUA, the western and central regions were the focus of GTFP improvement. In 2017, the National Development and Reform Commission issued the CPUA plan, and the plan noted that the CPUA’s medium-term goal until 2020 is to build a green development ecological demonstration zone. To ensure the realization of the target, it is necessary to coordinate the green synergy development of the CPUA. Therefore, the demonstration role of green economy development in the southern region, which has a high GTFP in the CPUA, cannot be ignored. At the same time, the western and central regions with lower GTFP values could be the focus of green development level improvement. In addition, limited by the insufficient data of each city’s sub-industry, the next research direction is to analyze the green development of each city in the CPUA from the perspective of industry heterogeneity.
Both the spatial distribution map and the spatial correlation quantitative test indicate that there is a significant correlation in the spatial GTFP among different cities of the CPUA. Specifically, the spatial aggregation of high GTFP is presented, and cities with low GTFP are clustered together. For example, the cities of Bengbu and Zhengzhou are a cluster center with a higher GTFP, while Handan and Changzhi are cities with a lower GTFP. The spatial clustering of GTFP in the CPUA may be related to the economic development mode and policy implementation among cities; that is, cities with similar economic development levels usually have similar development modes. For example, Bengbu and Zhengzhou, which have high GTFP, are two cities whose economic development modes are based on high-tech industries, such as electronic information and new materials, which have the characteristics of low energy consumption and low pollutant emissions. Thus, green economic development could promote the sustainability of products and upstream and downstream industry chains, and further contributes to improving the GTFP. In addition, there are similarities in the environmental policies and development policies implemented for places with close economic development level, and the implementation of environmental protection policies with a specific intensity and scope will bring about the corresponding level of urban green development.
From the perspective of influencing factors of GTFP in the CPUA, the results show that technological progress has a significant positive impact on the GTFP, reconfirming the contributions of technological innovation on urban green development (Zhang et al., 2018). The possible reason is that technological progress represents more advanced technologies for wastewater, waste gas treatment, and reduced pollutant discharge and discharge rate. From the perspective of Zhengzhou and Bengbu, which have high GTFP values, the two cities’ governments increased investments in science and technology by 123 times and 362 times, respectively, from 2003 to 2018 (Department of Urban Social and Economic Survey, 2019), and the investments in science and technology increased significantly. However, in terms of relative quantities, the proportion of science and technology investments in each city in the CPUA is still low, with values mostly less than 7% (National Bureau of Statistics, 2019a). From the perspective of spatial impact, technological advances in other cities have a significant spillover effect on the GTFP in the region. The reason is that technological progress in other cities brings external economies to enterprises or industries in the region through technology replication and information sharing, which improves the GTFP. The reason why industrial structure optimization can promote the improvement of GTFP lies in that, on the one hand, the more rational industrial structure means that the traditional economic production mode that relies on high pollution and high energy and resources input has been gradually eliminated and shifts to the economic production mode driven by the tertiary industry. This process is accompanied by the transformation of industrial energy use, thereby promoting the green production of industries and products. On the other hand, industrial transformation will also promote the improvement of environmentally friendly concepts and awareness. It is worth noting that the rationalization of the industrial structure in the region has no significant impact on the GTFP in the surrounding areas. This may be because that the industrial structure optimization of the region is often accompanied by the reconfiguration of factors and the transfer of high-energy-consuming industries to surrounding areas. At the same time, the economic growth brought about by industrial optimization in the region will stimulate the surrounding governments to blindly build redundant industries, resulting in resource allocation inefficiency and environmental pollution problems, in turn, inhibiting the GTFP in the surrounding areas. Hence, the channel of spillover effect of industrial structure rationalization on GTFP needs to be addressed, and its synergistic effect on the green development level across regions should be considered.
The strengthening of environmental regulation has a positive effect on the GTFP of the CPUA. Compared with the environmental regulation of waste gas, solid waste regulation has a better effect on the improvement of GTFP in the CPUA. The environmental regulation of the local solid waste can improve the GTFP in this region, possibly because the environmental regulation of solid waste can stimulate the transformation and upgrading of the industrial structure. Interestingly, the marginal effect of environmental regulation of solid waste on GTFP is significantly greater than that of waste gas, indicating that the environmental management of solid waste enhancement contributes more to regional GTFP than does waste gas environmental regulation. Compared with waste gas, solid waste is less likely to spread, and the pollution source is relatively fixed. On the other hand, the purification process of solid waste is less technically difficult, resulting in less undesirable output. Therefore, its management and control are more effective and more stable. Thus, for regions with low GTFP, it is necessary to take the reduction of solid waste or greening treatment as a breakthrough in improving the level of urban green development in short term. In addition, other municipal solid waste environmental regulations have a spillover effect on the GTFP in this region, which may be affected by the demonstration effect of inter-city solid waste policies. The environmental regulation of waste gas has a significant effect on the GTFP in this region. However, the spillover effect of other cities’ waste gas environmental regulations on GTFP in the CPUA has not been shown, mainly because waste gas pollution of surrounding cities is greatly affected by wind direction, temperature and other natural factors, undermining the role of waste gas regulations in promoting green development in the region.
Regarding other control variables, the informatization has a positive effect on GTFP, but the informatization in one region has no positive demonstration effect on its surrounding GTFP. This result indicates that the overall coordination between the cities in the CPUA is low in terms of the dissemination and sharing of information, and the inter-regional information interconnection must be improved. The increases in local human capital have no significant impact on the local GTFP, but it has a negative impact on the GTFP in the surrounding area. The reason may be that, despite the increase in local human capital, in the context of regional vicious competition, there are restrictions on the flow of talents and the radiation of quality education resources between regions. Thus, one region’s increase in local human capital does not play a role in promoting the overall GTFP of the surrounding areas.
Conclusion
All Based on SBM model and GML index, this paper estimated the GTFP of 29 prefecture-level cities in the CPUA from 2003 to 2018. In addition, the econometric model considering spatial correlation effects was used to analyze the influencing factors of urban GTFP in the CPUA. The research results showed that from 2003 to 2018, the GTFP of the CPUA had an upward trend, but the GTFP value was still low. There were significant regional differences among cities in the CPUA. The areas with high GTFP were concentrated in the central and northern regions of the CPUA. Moreover, there was a significant positive spatial correlation of GTFP in the CPUA, forming a high-concentration area centered on Zhengzhou and Bengbu and a low-concentration area centered on Handan and Changzhi. The results of the urban spatial econometric empirical model showed that technical advance and environmental regulations had the greatest marginal effects on GTFP. Furthermore, industrial structure, fiscal expenditure and informatization had a positive influence on GTFP, and the technical progress and environmental regulation of solid waste had significant positive spillover effects on GTFP. Therefore, the northern and southern cities with high levels of green development should play a demonstration role to influence the central and western cities with low levels of green development, to coordinate and promote the green development level of the CPUA.
Based on the GTFP results of CPUA, as well as the green development and socio-economic status of each region, in order to improve GTFP, the following targeted countermeasures and suggestions are puts forward: 1) Because of the central and northern regions of CPUA, such as Handan and Changzhi, whose development level of GTFP is relatively lagging. For these cities, we should take key green development and upgrading measures, reduce the proportion of energy consumption type industrial structure, and increase the clean energy type industrial structure. 2) In view of the significant regional differences and spillover effects of GTFP, it is necessary to give full play to the demonstration effect and balance the level of green development between cities. 3) For the promotion function of technology progress on GTFP, the government should increase research and development subsidies for green technologies as well as strengthen the cultivation of innovative talents, which are the driving force of technological advances, and promote the industrialization of energy conservation and environmental protection technology and exert the long-term promotion effect of technological progress on regional green development. In terms of industrial development, financial support, innovation platforms and institutional guarantees should be provided for the growth of low-carbon industries. Regarding environmental protection infrastructures, the government should accelerate the construction of environmental protection facilities for coal-fired power plants in cities of the CPUA, sewage treatment plants for enterprises and supporting pipe networks, and facilities for the treatment of solid waste and urban household garbage and hazardous waste.
Data Availability Statement
The original contributions presented in the study are included in the article/Supplementary Material, further inquiries can be directed to the corresponding authors.
Author Contributions
Conceptualization, FW, LX; methodology, FW; software, FW; validation, CY, RL; formal analysis, FW, CY; investigation, YC, LX; resources, FW; data curation, LX, RL; writing—original draft preparation, FW; writing-review and editing, CY, YC; visualization, FW, LX; supervision, YC; project administration, CY; funding acquisition, CY. All authors have read and agreed to the published version of the manuscript.
Funding
This work was supported by the National Natural Science Foundation of China (Grant No. 71804012 and No. 72003179). This work was also supported by Zhejiang A&F University Scientific Research Development Fund Talent Start Program (Grant No. 2020FR089), and Project of Department of Education of Zhejiang Province (Grant No. Y202045019), and Leading Talent Cultivation Project of Philosophy and Social Sciences in Zhejiang Province (Grant No. 21YJRC12-1YB).
Conflict of Interest
The authors declare that the research was conducted in the absence of any commercial or financial relationships that could be construed as a potential conflict of interest.
Supplementary Material
The Supplementary Material for this article can be found online at: https://www.frontiersin.org/articles/10.3389/fenvs.2021.686725/full#supplementary-material
References
Albrizio, S., Kozluk, T., and Zipperer, V. (2017). Environmental Policies and Productivity Growth: Evidence across Industries and Firms. J. Environ. Econ. Management 81, 209–226. doi:10.1016/j.jeem.2016.06.002
Baldwin, J. R., Brown, W. M., and Rigby, D. L. (2010). Agglomeration Economies: Microdata Panel Estimates from Canadian Manufacturing*. J. Reg. Sci. 50, 915–934. doi:10.1111/j.1467-9787.2010.00675.x
Bank, W. (2017). Atlas of Sustainable Development Goals 2017: From World Development Indicators. World Bank Publications.
Bivand, R., and Piras, G. (2013). Comparing Implementations of Estimation Methods for Spatial Econometrics. J. Stat. Softw. 63, 1–36. doi:10.18637/jss.v063.i18
Chen, L., Zhang, X., He, F., and Yuan, R. (2019). Regional green Development Level and its Spatial Relationship under the Constraints of Haze in China. J. Clean. Prod. 210, 376–387. doi:10.1016/j.jclepro.2018.11.037
Chung, Y. H., Färe, R., and Grosskopf, S. (1997). Productivity and Undesirable Outputs: A Directional Distance Function Approach. J. Environ. Manage. 51, 229–240. doi:10.1006/jema.1997.0146
Department of Urban Social and Economic Survey (2019). China Urban Statistics Yearbook. Beijing: China Statistics Press.
Durbin, R. A. (1998). Spatial Autocorrelation: a Primer. J. Hous. Econ. 7 (4), 304–327. doi:10.1006/jhec.1998.0236
Elhorst, J. P. (2014). Matlab Software for Spatial Panels. Int. Reg. Sci. Rev. 37, 389–405. doi:10.1177/0160017612452429
Färe, R., Grosskopf, S., Lindgren, B., and Roos, P. (1992). Productivity Changes in Swedish Pharamacies 1980–1989: A Non-parametric Malmquist Approach. J. Prod. Anal. 3, 85–101.
Feng, T., Zhang, H., Yi, H., and Duncan, A. A. (2017). Growth of green Total Factor Productivity and its Determinants of Cities in China: a Spatial Econometric Approach. Emerg. Mark. Financ. Tr., 1258359.
Han, Y., Long, C., Geng, Z., and Zhang, K. (2018). Carbon Emission Analysis and Evaluation of Industrial Departments in China: An Improved Environmental DEA Cross Model Based on Information Entropy. J. Environ. Manage. 205, 298–307. doi:10.1016/j.jenvman.2017.09.062
Ke, L., and Lin, B. (2017). Economic Growth Model, Structural Transformation, and green Productivity in China. Appl. Energ. 187, 489–500.
Lesage, J., and Pace, R. (2014). The Biggest Myth in Spatial Econometrics. Econometrics 2, 217–249. doi:10.3390/econometrics2040217
Lesage, J. P., and Pace, R. K. (2010). Spatial Econometric Modeling of Origin-Destination Flows. J. Reg. Sci. 48 (5), 941e967.
Lewis, A. C. (2018). The Changing Face of Urban Air Pollution. Science 359, 744–745. doi:10.1126/science.aar4925
Li, Y., Beeton, R. J. S., Sigler, T., and Halog, A. (2019). Enhancing the Adaptive Capacity for Urban Sustainability: A Bottom-Up Approach to Understanding the Urban Social System in China. J. Environ. Manage. 235, 51–61. doi:10.1016/j.jenvman.2019.01.044
Lin, B., and Chen, Z. (2018). Does Factor Market Distortion Inhibit the green Total Factor Productivity in China?. J. Clean. Prod. 197, 25-33. doi:10.1016/j.jclepro.2018.06.094
Liu, H., Tian, H., Zhang, K., Liu, S., Cheng, K., Yin, S., et al. (2019). Seasonal Variation, Formation Mechanisms and Potential Sources of PM2.5 in Two Typical Cities in the Central Plains Urban Agglomeration, China. Sci. Total Environ. 657, 657–670. doi:10.1016/j.scitotenv.2018.12.068
Liu, S., Hua, S., Wang, K., Qiu, P., Liu, H., Wu, B., et al. (2018). Spatial-temporal Variation Characteristics of Air Pollution in Henan of China: Localized Emission Inventory, WRF/Chem Simulations and Potential Source Contribution Analysis. Sci. Total Environ. 624, 396–406. doi:10.1016/j.scitotenv.2017.12.102
Luo, J., Du, P., Samat, A., Xia, J., and Xue, Z. (2017). Spatiotemporal Pattern of PM2.5 Concentrations in Mainland China and Analysis of its Influencing Factors Using Geographically Weighted Regression. Sci. Rep. 7, 40607. doi:10.1038/srep40607
Malmquist, S. (1953). Index Numbers and Indifference Surfaces. Trabajos de Estadistica 4, 209–242. doi:10.1007/bf03006863
Marimin, M. A., Darmawan, R. P., and Teniwut, Y. K. (2018). Green Productivity Improvement and Sustainability Assessment of the Motorcycle Tire Production Process: A Case Study. J. Clean. Prod. 191, 273–282. doi:10.1016/j.jclepro.2018.04.228
Munisamy, S., and Arabi, B. (2015). Eco-efficiency Change in Power Plants: Using a Slacks-Based Measure for the Meta-Frontier Malmquist-Luenberger Productivity index. J. Clean. Prod. 105, 218–232. doi:10.1016/j.jclepro.2014.12.081
National Bureau of Statistics, (2019a). China Science and Technology Statistical Yearbook. Beijing: China Statistics Press.
National Bureau of Statistics, (2019b). China Statistical Yearbook. Beijing: China Statistical Press.
Newman, C., Rand, J., Talbot, T., and Tarp, F. (2015). Technology Transfers, Foreign Investment and Productivity Spillovers. Eur. Econ. Rev. 76, 168–187. doi:10.1016/j.euroecorev.2015.02.005
Oh, D.-h. (2010). A Global Malmquist-Luenberger Productivity index. J. Prod. Anal. 34, 183–197. doi:10.1007/s11123-010-0178-y
Porfiryev, B. N., and Bobylev, S. N. (2018). Cities and Megalopolises: The Problem of Definitions and Sustainable Development Indicators. Stud. Russ. Econ. Dev. 29, 116–123. doi:10.1134/s1075700718020119
Qiu, P., Tian, H., Zhu, C., Liu, K., Gao, J., and Zhou, J. (2014). An Elaborate High Resolution Emission Inventory of Primary Air Pollutants for the Central Plain Urban Agglomeration of China. Atmos. Environ. 86, 93–101. doi:10.1016/j.atmosenv.2013.11.062
Sanchez-Vargas, A., Mansilla-Sanchez, R., and Aguilar-Ibarra, A. (2013). An Empirical Analysis of the Nonlinear Relationship between Environmental Regulation and Manufacturing Productivity. J. Appl. Econ. 16, 357–371. doi:10.1016/s1514-0326(13)60015-x
Sueyoshi, T., and Goto, M. (2017). World Trend in Energy: an Extension to DEA Applied to Energy and Environment. J. Econ. Struct. 6 (1), 13. doi:10.1186/s40008-017-0073-z
Wang, Y., Bao, S., Wang, S., Hu, Y., Shi, X., Wang, J., et al. (2017). Local and Regional Contributions to fine Particulate Matter in Beijing during Heavy Haze Episodes. Sci. Total Environ. 580, 283–296. doi:10.1016/j.scitotenv.2016.12.127
Wang, Y., and Shen, N. (2016). Environmental Regulation and Environmental Productivity: The Case of China. Renew. Sustainable Energ. Rev. 62, 758–766. doi:10.1016/j.rser.2016.05.048
Xie, H., Chen, Q., Lu, F., Wang, W., Yao, G., and Yu, J. (2019). Spatial-temporal Disparities and Influencing Factors of Total-Factor green Use Efficiency of Industrial Land in China. J. Clean. Prod. 207, 1047–1058. doi:10.1016/j.jclepro.2018.10.087
Xu, C., Dong, L., Yu, C., Zhang, Y., and Cheng, B. (2020). Can forest city Construction Affect Urban Air Quality? the Evidence from the Beijing-Tianjin-Hebei Urban Agglomeration of China. J. Clean. Prod. 264, 121607. doi:10.1016/j.jclepro.2020.121607
Yang, Z., Fan, M., Shao, S., and Yang, L. (2017). Does Carbon Intensity Constraint Policy Improve Industrial green Production Performance in China? A Quasi-DID Analysis. Energ. Econ. 68, 271–282. doi:10.1016/j.eneco.2017.10.009
Zhang, J., Yuan, C., Zhang, L., and Ding, L. (2018). Do technological Innovations Promote Urban green Development? —A Spatial Econometric Analysis of 105 Cities in China. J. Clean. Prod. 182, S0959652618303731. doi:10.1016/j.jclepro.2018.02.067
Zhang, Y., Jin, P., and Feng, D. (2015). Does Civil Environmental protection Force the Growth of China's Industrial green Productivity? Evidence from the Perspective of Rent-Seeking. Ecol. Indicators 51, 215–227. doi:10.1016/j.ecolind.2014.06.042
Keywords: green total factor productivity, global malmquist-luenberger index, spatial-temporal evolution, spatial durbin model, central plains urban agglomeration
Citation: Wang F, Li R, Yu C, Xiong L and Chang Y (2021) Temporal-Spatial Evolution and Driving Factors of the Green Total Factor Productivity of China’s Central Plains Urban Agglomeration. Front. Environ. Sci. 9:686725. doi: 10.3389/fenvs.2021.686725
Received: 27 March 2021; Accepted: 19 May 2021;
Published: 07 June 2021.
Edited by:
Faik Bilgili, Erciyes University, TurkeyReviewed by:
Wenjian Liu, The City University of New York, United StatesAweng Peter Majok Garang, University of Juba, South Sudan
Copyright © 2021 Wang, Li, Yu, Xiong and Chang. This is an open-access article distributed under the terms of the Creative Commons Attribution License (CC BY). The use, distribution or reproduction in other forums is permitted, provided the original author(s) and the copyright owner(s) are credited and that the original publication in this journal is cited, in accordance with accepted academic practice. No use, distribution or reproduction is permitted which does not comply with these terms.
*Correspondence: Chang Yu, changyu@bjfu.edu.cn; Yuan Chang, yuan.chang@cufe.edu.cn