Evaluating the Impact of Urban Blue Space Accessibility on Housing Price: A Spatial Quantile Regression Approach Applied in Changsha, China
 Huang Tuofu
 He Qingyun1*
  Yang Dongxiao
- 1College of Geographic Science, Hunan Normal University, Changsha, China
- 2School of Economics and Trade, Hunan University, Changsha, China
- 3Hunan Institute of Economic Geography, Hunan University of Finance and Economics, Changsha, China
Urban nature spaces are increasingly recognized as essential urban features providing crucial amenities to the residents’ health and well-being. While many studies have been conducted focusing on the influence of green spaces on house prices, very few have explored the impact of urban blue spaces. In this study, we analyzed the proximity effects of different types and sizes of urban blue spaces on property value in Changsha metropolis, China, and examined the spatial quantile effect across different housing prices. A two-stage instrumental method (2SLS) hedonic model was employed to evaluate the impact of different types of urban blue space: river (mainstream and tributary), wetland park, and lakes (large, medium, and small). Spatial quantile regression (SQR) was then used to measure the spatial effect of accessibility on various house price ranges. The 2SLS results show that, except for small-sized lakes, proximity to blue spaces significantly increases property value. Analysis of the SQR model reveals that proximity to major blue spaces increases the marginal willingness-to-pay among homebuyers of high-priced properties, while ordinary blue spaces are more attractive to buyers of low- and medium-priced houses. This may be broadly related to the level of education, utility, and sensitivity to ecosystem services across income groups. Based on these findings, we recommend that urban planners adopt different strategies to promote space utilization efficiency. This is one of the few studies that analyze the capitalization of blue space accessibility in house prices across different quantiles. By categorizing blue spaces and employing the SQR model, this study found the effect of blue spaces on housing prices to be heterogeneous, providing new perspectives to the existing literature.
Introduction
In the process of intensified urbanization across modern China, the well-being of residents faces numerous challenges. Deteriorating ecological environment, unhealthy lifestyle, and highly competitive employment market (Wu Q. et al., 2020, Wu et al., 2021), have put significant pressure and risks on the urban population’s health and well-being. In response to these social and environmental concerns, nature spaces have become increasingly popular not just for their aesthetic functions but also for their various ecosystem services such as regulating phytoclimate, reducing the heat island effect, and providing recreation and leisure spaces (Gómez-Baggethun and Barton, 2013; Roebeling et al., 2017).
In general, urban nature space can be divided into two categories: green spaces (urban vegetation areas) and blue spaces (urban surface waters) (Targino et al., 2019). Numerous articles suggest that attractive landscapes composed of green and blue spaces promote physical and mental health (Voelker and Kistemann, 2015). With the concept promoted by the government, media, and property developers, urban residents have started to put increased value on the ecological-environmental quality around their settlements. In many cities, housing with better ecological surroundings has become expensive. According to the hedonic price theory (Rosen, 1974), adjacent nature spaces have become key attributes to the value of a property. Empirical evidence from hedonic models has shown that open public green spaces (e.g., forests, grasslands, parks) can increase the price of the surrounding properties through visibility and accessibility (Kong et al., 2007). However, while urban blue spaces are extremely important landscape elements (Kaplan and Kaplan, 1989), their effect on property value has largely been overlooked. Studies on the benefits of visits and access to urban blue spaces found that these areas provide positive health effects as much as their terrestrial counterparts (Lianyong and Eagles, 2009). Despite the growing research trend on the health benefits of urban blue spaces, studies on the capitalization of blue attributes to the housing market have remained limited. Very few hedonic housing price studies have explicitly analyzed the value impact of urban blue spaces and instead often merged blue spaces with other urban open space types.
Proximity and access to water have been regarded as key factors for human settlement, providing numerous benefits. Some studies have tried to value the effect of urban blue spaces on the housing market across different cities (Sander and Zhao, 2015; Liebelt et al., 2019; Liu et al., 2020). However, these studies did not differentiate blue spaces. Empirical evidence on the impact caused by urban blue spaces on house prices remains vague and unclear. In addition to cities with coastlines, blue spaces in inland cities comprise different freshwater bodies, including rivers, wetlands, and lakes. More studies are needed to investigate how the different types and sizes of urban blue spaces may affect prices in the housing market.
The conventional hedonic price models using ordinary least square (OLS) regression may lead to inconsistencies between estimated results and reality (McMillen, 2012). Assuming housing is a normal good, wealthy buyers usually purchase high-priced houses that provide higher quality hedonic attributes, including natural amenities. This suggests that high-income families pay more at the margin for natural resources. Considering that the willingness-to-pay for blue amenities may vary for buyers of different income groups, estimated effects of blue spaces across the conditional distribution of housing prices could be biased. Previous studies evaluating hedonic attributes on house prices using quantile regression found significant differences among samples at different price regions (Liao and Wang, 2012). These results indicate that the proximity of some attributes (e.g., facilities or green spaces) has a positive effect on nearby housing prices and that the impact varies for high- and low-priced houses. Another study found that proximity to educational facilities positively correlates with house prices and that homebuyers of high-priced houses are willing to pay more for educational resources (Wen et al., 2014).
However, for blue spaces, their impact on house prices has not been sufficiently explored. Spatial dependence also needs to be considered in exploring the effect of blues spaces in hedonic studies. Adjacent residences share public facilities, natural resources, and other amenities, which means that their prices may correlate spatially (Zhang, 2016). Spatial econometrics has been broadly applied in hedonic models (LeSage and Pace, 2004) and on the capitalization of housing attributes (Huang et al., 2017), but not for hedonic studies on the capitalization of blue spaces. Variations in the spatial effects across the conditional distribution of property prices have also been largely overlooked in the existing literature.
To address this research gap, this study used a spatial quantile hedonic model to investigate the proximity effects of different types of blue spaces on property prices across different conditional distributions. The study area was Changsha city, an important regional central city in south-central China. To the best of our knowledge, this is the first study to use a spatial quantile hedonic model for blue space capitalization in urban China. This research can provide empirical evidence for the effective use of land resources for urban managers and planners.
This paper is organized as follows. The next section reviews the relevant literature and discusses the contributions of this study. Data and Methodology presents the research area, the data used in the study, and the main research methodology. Results provides the empirical results and robustness check analysis to avoid bias. Discussion examines how the results correspond to previous studies and explores their implications. Conclusion and Recommendation provides the conclusion.
Literature Review
Given the clear relations between the natural environment and human health (Gascon et al., 2015), numerous articles have found a positive capitalization effect of green spaces using the hedonic approach (Kong et al., 2007; Conway et al., 2010). Different subcategories of green spaces have been analyzed to compare their effects on housing prices (Czembrowski and Kronenberg, 2016). While the studies found the impact of green spaces varies, the positive effect of most green spaces is clear. In addition, rich patches of green spaces have also been found to have significant influence on house prices (Kong et al., 2007). Visibility and accessibility are key variables indicating the impact of green spaces on property value (Jim and Chen, 2006; Brander and Koetse, 2011; Czembrowski and Kronenberg, 2016). Some studies have also explored the different effects of green spaces on capitalization from different ecosystem services (Sander and Haight, 2012; Gómez-Baggethun and Barton, 2013).
Studies have found that urban blue spaces have a unique effect on the health and well-being of residents, different from the impact of green spaces. Some studies have found unique health-enhancing effects of urban blue in multiple conceptual therapeutic landscape dimensions, particularly experienced and symbolic (Voelker and Kistemann, 2015). Social interaction and psychological benefits have been found as the most important benefits obtained from visiting blue spaces, especially among the elderly (Garrett et al., 2019; Targino et al., 2019). The unique resistance of blue spaces to urban heat island effects cannot be ignored (Yu et al., 2020). Considering that the environmental amenity has a strong effect on housing prices, these previous studies suggest that urban blue as a residential environment-promoting factor needs a more comprehensive evaluation of its general and specific capitalization effects.
A growing number of studies have found a positive capitalization effect of blue spaces. One hedonic study used blue spaces as a subcategory of green spaces to value blue and green spaces in Ramsey and Dakota Counties in the Unites States (Sander and Zhao, 2015). Proximity to large parks, as well as water bodies, was found to increase house prices in the Phoenix Metropolitan Area (Larson and Perrings, 2013). Another study found a positive impact of lakes on property valuation (Anderson and West, 2006). While these studies were able to find significant impact of blue spaces on house prices, this was only one of their sub-objectives. Lakeside and riverside have been used as main subjects in previous hedonic studies on urban blue; however, the impact of blue spaces in these studies was found to have radically different magnitudes (Kelejian and Prucha, 1999; Sander and Zhao, 2015; Mei et al., 2018; Wu P.-I. et al., 2020). One possible reason is that many of these studies did not distinguish between the various types of blue spaces. In general, research on this subject matter remains limited, particularly compared to green spaces. More research is needed on the capitalization of blue spaces, particularly on assessing the impact of different kinds of urban blue spaces.
Another possible factor is the quantile effect, which had been rarely considered in previous studies. As a hedonic attribute, blue space would be valued differently by residents with varying income levels and social status. Housing price levels often correspond to households with different incomes, which may result in very different marginal buying strategies for the same characteristic attributes. In many cases, having segmented housing markets distinguished by price is even more reasonable than separating them from geographical boundaries (Rajapaksa et al., 2017). Numerous studies have found that the influence on housing prices of property attributes, such as house structure and neighborhood facilities, is heterogeneous across the whole distribution (Ebru and Eban, 2011). This heterogeneity caused by different quartile effects can be detected through the quantile model (QR), which can comprehensively evaluate the various distributions (Coulson and McMillen, 2007).
Employing the QR model can reveal more information about sub-markets, which OLS regression may result in biased estimates. QR has better robustness to outliers, can avoid biased estimation caused by OLS truncation of dependent variables, and better handle heteroscedasticity (McMillen, 2012). For these reasons, QR has been used in hedonic models. For example, some studies concluded that the quartile effect of green space accessibility on house price across distributions could not be ignored (Zietz et al., 2008; Mak et al., 2010).
QR is also applicable to blue space capitalization for the following reasons. First, the same blue attribute may be valued variedly by homebuyers of different income levels. Studies have found that geographically accessible blue spaces in local areas are more highly valued by the elderly or senior residents with restricted mobility. In general, mid-age and elderly residents have higher capabilities and willingness to pay for high-priced properties with better amenities. Correspondingly, the coefficient estimates of urban blue spaces based on the sample of high-priced houses may be different with conditional mean. Second, residents of high-priced properties may be more cognizant of ecological-environmental factors and are willing to pay higher prices for blue spaces. Herbert and Thomas (1998) found a strong positive correlation between education level and economic status. People with higher income levels are more likely to receive better education and better understand the relationship between blue spaces and personal well-being. Thus, homebuyers from different price regions may perceive blue spaces differently. Few studies have explored the hedonic pricing of urban blue spaces using the quantile perspective.
In the QR model, spatial effects should be considered, as studies have shown high spatial dependence in property prices. Ignoring spatial effect would likely lead to overestimation in attribute variables. Kang and Liu (2014) used a quantile regression model to study the impact of the 2008 financial crisis on Taiwan's real estate market. They found that the price impact on high-priced houses was more significant than on low-priced ones. Mueller and Loomis (2014) conducted an empirical study and found that the influence of fires in Southern California differs across the conditional distribution of housing prices. These two studies did not consider the spatial dependence of prices, which could explain the huge gap in estimated coefficients between price samples.
To address the spatial aspects, the SAR method is a commonly used modification to the hedonic model; however, this method still has major limitations. The lag term of the dependent variable as a lag factor may be related to the error term, which causes endogenous problems (Anselin, 2002). To deal with these concerns, the two-stage regression method (2SLS) is used, which is essentially an instrumental variable method, leading to a more consistent estimate (Chernozhukov and Hansen, 2006). At the first stage, the explanatory variable regresses the instrumental parameter to obtain the estimates. In the second stage, the obtained estimate of the explanatory variable is regressed on the explained variable, which is the final regression result of 2SLS.
In this study, we employed a 2SQR model, which combines the 2SLS and QR (Kim and Muller, 2004). Similar to previous studies (Zietz et al., 2008; Kuethe and Keeney, 2012), the instrumental variable adopts the lag term of the independent variable (WX), which is used in adding a regressor in the second stage. To deal with weak instruments, we adopted the IVQR (Chernozhukov and Hansen, 2006). This approach is similar to the GMM method and has been widely used in numerous research fields (Kostov, 2009).
As far as we know, few studies have investigated the quantile effect of blue spaces on housing prices, especially for large inland cities in China. This study, which utilizes a quantile regression model of the two-stage instrumental variable method, explores the effect of various types and sizes of blue spaces and different categories of homebuyers, filling the gap of the detailed and accurate determination of urban blue spaces general and specific capitalization effects in the existing literature across modern urban China.
Data and Methodology
Study Overview
As a kind of ecological land, blue space has several benefits and costs to urban residents’ well-being. A number of studies have analyzed ecosystem services provided by blue spaces, such as increasing recreation, reducing harm, supplying leisure places, and beautifying the environment (Gómez-Baggethun and Barton, 2013). On the other hand, blue spaces may also result in higher flood risks, negatively affecting house prices (Wu P.-I. et al., 2020). In this study, the net impact of blue spaces in house prices is equal to the positive minus the negative utilities. The accessibility of blue spaces (with different categories based on attribute and size) is used as the variable.
To calculate accessibility, the walking distance between transaction houses and nature blue in the year 2019 was calculated using ArcGIS subtract from house transaction and road network data. Since hedonic regression requires other house attributes, the housing structural features, community attributes, public facilities, and location are also obtained. Considering that businesses, living facilities, and other information may impact housing prices, network capture technology was used to obtain various points of interest (POI) in Changsha City for 2019.
In this study, a 2SLS regression model was constructed to quantify the mean effect of blue space accessibility across all distribution samples, which would prevent biased outcomes and avoid overestimating the effects of independent variables. The methodology used in this study strikes the right balance between unbiased and valid estimates. We employed the 2SQR model to investigate the spatial quantile effect of varying kinds of urban blue spaces. The 2SQR model eliminates endogeneity produced by the spatial heterogeneity of housing price and provides integrated and complete descriptions of various distributions. This model, developed by McMillan in 2012, greatly improves the performance of quantile regression OLS regression, and the densities of the different sub-samples were added to estimate the robustness of the test results.
Model Description
For the robustness check, we used the reduced hedonic form for cross-checking. Considered the general research conclusions, the logarithm of the dependent variable can be taken to obtain a better model explanatory power. The reduced form of the model is as follows:
where P is the property price; S is the structure characteristics; L is the location attributes; N is the neighborhood facilities attributes; B is the blue space attributes; G is the green space without waterscape; α0,
When considering the spatial dependence effect in house pricing caused by neighborhood houses, the spatial auto aggression model (SAR) is the preferred option. The lag term (Wlnp) is added to the reduced hedonic model in order to indicate the influence of adjacent housing prices. The evolved spatial hedonic form as follows:
where W is a spatial weight matrix, and
where
We also applied the 2SLS method based on hedonic SAR to further eliminate the endogeneity of the model (Kelejian and Prucha, 1999). Similar to the instrumental variable method, it has two steps. First, WlnP is regressed on instruments of X and WX. Then, the predicted value of WlnP is added to SAR as an independent variable. To examine the impact of blue space attribution on different house prices, we adopted a quantile form with a spatial lag term based on the 2SLS technique, which has been shown useful in previous studies (Kim and Muller, 2004; Liao and Wang, 2012; McMillen, 2012). The final form of the spatial quantile form as follows:
where τ is the corresponding quantile of housing price;
Data and Variables
The study area is Changsha, a typical inland second-tier city in the middle region of China. This city has shown considerable economic growth in recent years. From 2014 to 2019, the city’s average annual GDP growth was 10.4%, much higher than the national average of 6.8%. As China continues to shift its development focus to the Middle Region, Changsha’s future is promising.
In terms of the housing market, as one of the pioneers restoring the Housing Purchasing Restriction Policy (HPR), Changsha has been described as the model city for housing market regulations by the central government and media. Although Changsha is considered a model for regulations, its average housing prices remain comparatively low compared with other capital cities in China, mainly due to its sufficient housing and land supply. Oversupply has kept Changsha’s housing prices tepid for years. Changsha also has a large number of houses constructed by state companies or institutions solely for its employees. These houses usually are sold at low prices as incentive for their employees, lowering the average housing prices in this city. Despite strict regulations, the city’s economy remains vibrant, and the local government does not directly intervene with housing prices. Changsha’s HPR experience has been promoted nationally to encourage other mega-cities to apply similar management strategies. For these reasons, Changsha is an appropriate research object for housing prices, and to some extent, can be for the housing market in modern China.
Figure 1 shows the study area. Focusing on the agglomeration of residential communities, the urban district of Changsha is used as the research area. Data employed in this study could be divided into three categories: housing data, the POI data, and the Land-Use Land-Cover Change dataset (LUCC).
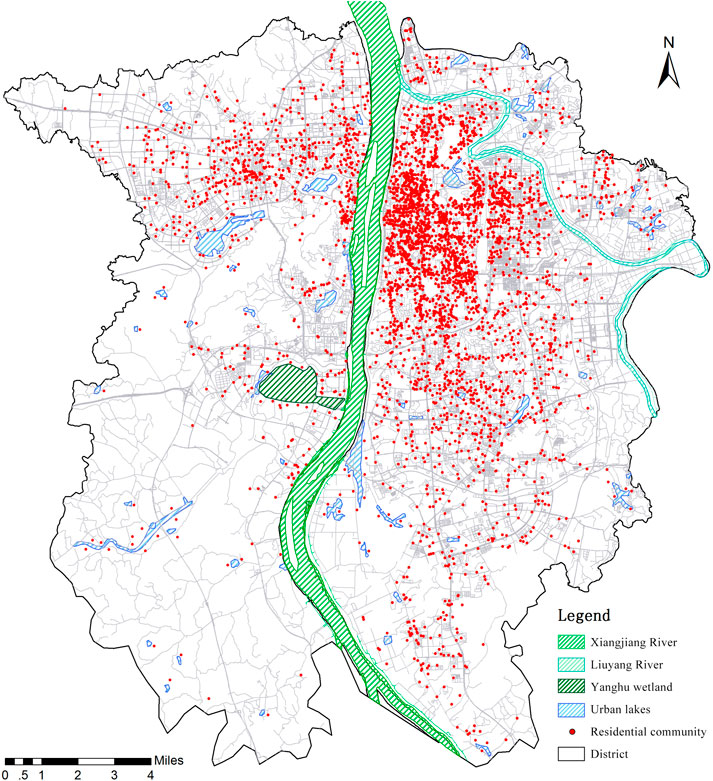
FIGURE 1. Urban blue spaces and residential community in Changsha.
There are three sources of housing data for Chinese cities: local official data, tax assessor data, and websites of real estate (Li et al., 2019a). With respect to data accuracy, the local official data is highly appropriate for housing price studies. We obtained the housing data from the Housing and Urban-rural Development of Changsha, including the property’s location, size, and market value. We collected 62,187 residential transactions from January 2019 to December 2019 and merged the corresponding information for residential communities. We also obtained community data, such as location, plot ratio, house age for all 5,860 communities in the region from the same source.
The POI data were gathered based on the service facilities of Baidu Map (map.baidu.com) and complemented by digitizing satellite maps of Google Earth. This dataset includes private service amenities and public facilities, such as schools, shopping malls, and subway stations. Web open data (e.g., Baidu Map) has been used in previous studies because of their availability and operability. However, there are still concerns about the accuracy and usefulness of open-source web data (Li et al., 2019b). To ensure data accuracy, we carefully checked all POI locations and attributes., removed redundant and duplicate points, and corrected incorrect points. After data preprocessing, the POI dataset fulfilled the requirements of this study.
Using the latest 2019 Changsha Metropolitan Area LUCC database (provided by the Department of Environment and Natural Resources of Changsha), we mapped the distribution of water bodies in the study area. To explore the difference across various types of water bodies, we differentiated the four categories of blue spaces as follows.
Xiangjiang River runs through Changsha and serves as an important blue landscape in the city. Since Changsha Government implemented the River Upgrade and Reconstruction Plan in 1995, the riverbank, scenario square, jogging track, and bicycle paths have been constructed. Liuyang River is the largest tributary of Xiangjiang River, which was also constructed with riverfront amenities and riverbank facilities in later years. Both river systems have nearby areas experiencing high population growths. Although the risk of river flooding exists, we assume that the presence of the rivers still has an overall positive effect on housing prices.
According to the National Wetland Park Evaluation Criteria of China, the 141-ha Yanghu National Wetland Park is the largest wetland in central China and is the only wetland in the Changsha urban area. It is a multi-functional wetland park integrating ecology, climate, and recreation, which has also become an important stop for migratory birds. Because of the significant microclimate regulation function of the wetland park, the temperature and humidity in the surrounding area of the park are more comfortable than in other urban areas. These ecological functions of wetland combined with its unique ecological landscape distinguish from other urban blue space. However, research on the impact of wetlands on housing prices has been very limited. Although one study (Mei et al., 2018) found wetlands to have a positive effect on housing prices, their impact, particularly on Chinese cities, is still largely uncertain.
For this study, the lakes were used to define the urban waterscape. Similar to previous studies on green spaces (Czembrowski and Kronenberg, 2016), we categorized the lakes based on size: small (<18,000 m2); medium (18,000–200,000 m2); and large (>200,000 m2). We assumed all lake sizes would have a positive impact on house prices. We set other control variables according to the model in Model Description. For control and comparison, we added non-water green space variables, including the accessibility to the Yuelu Mountain National Forest Park and proximity to green space parks. Neighborhood and location variables were obtained through the points of interest (POI) of Baidu Map. The location variable pertains to the accessibility from the sample house to the central business district (CBD). All the accessibility variables were determined based on the walking distance using the road network in Changsha.
Structure variables, such as plot ratio, were calculated using the values of the indicators. Neighborhood attributes, some of which were defined using dummy variables (1 or 0), included proximity parameters to vital community facilities or amenities. For instance, for the proximity to subway station variable, 1 means that a subway station is within 1 km from the property. Four structure attributes, one location parameter, six neighborhood features, five blue space parameters, and two green space parameters were adopted in this study. We used community level as the research scale because most of the variables used corresponded to community attributes. The descriptions of these variables are shown in Table 1, and the descriptive statistics for blue space categories are in Table 2. All data were processed and calculated in ArcGIS and STATA.
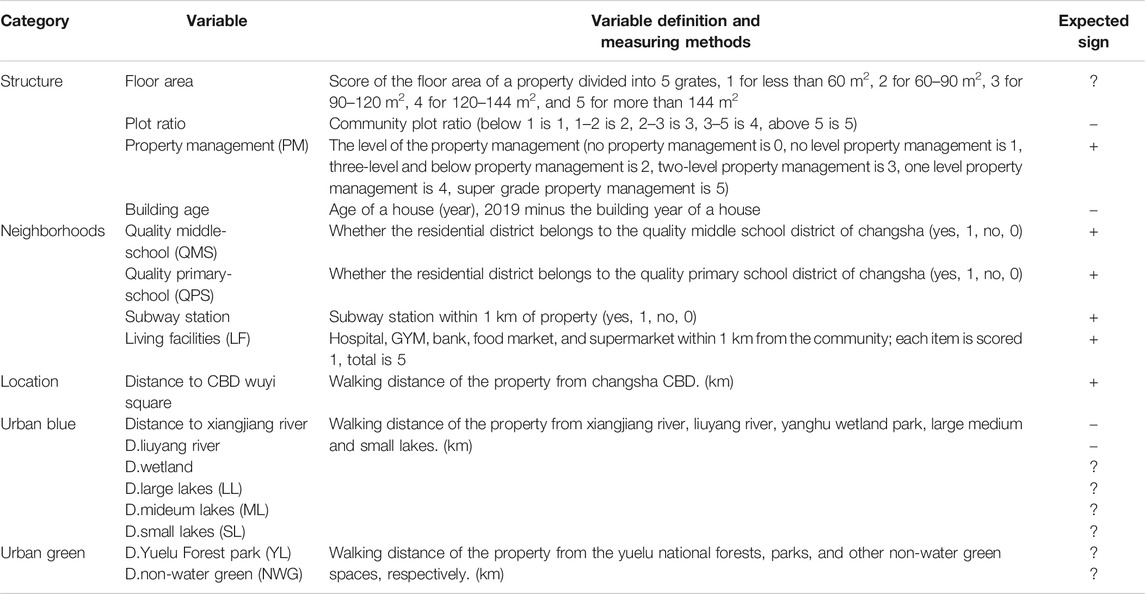
TABLE 1. Variables used in the model.
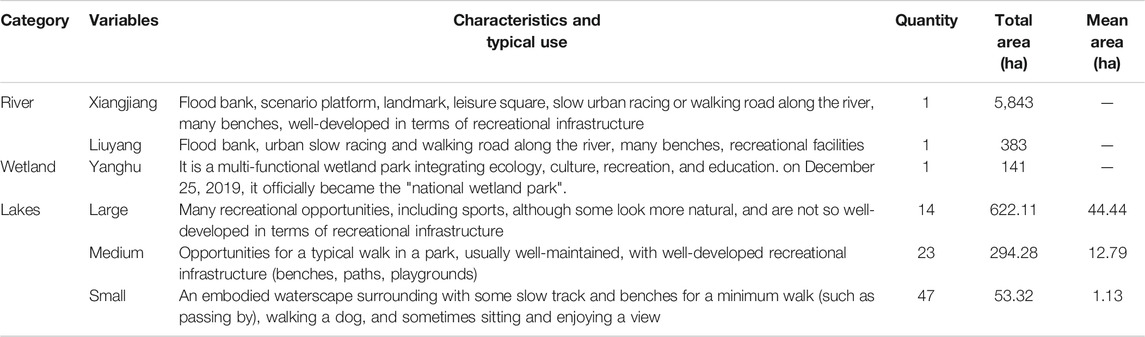
TABLE 2. Urban blue space categories in Changsha identified in our study.
Results
OLS Regression and Quantile Effect
The OLS conditional mean results were consistent with our expectations of the variable. As shown in Table 3, most variables were found to affect house prices, significant at the 10% level. The walking distance from the location center to the nature landscape is inversely proportional to the housing price. Several Structural factors, such as the plot ratio and the age of the house, have negative effects on house prices, while proximity to important public facilities, such as quality schools and subway stations, have a positive impact. The coefficient of determination (R-squared) is 0.52, indicating that the model has moderate explanatory power.

TABLE 3. OLS and QR model results.
The results of quantile regression (QR) under the same set of variables are also presented in Table 3. To explore the heterogeneity across quantiles, the full regression estimation of landscape variables were visualized (Figure 2) using the quantile 0.05 steps. The regression results of 19 quantiles from 0.05 to 0.95 are in solid lines, and the shaded area indicates the 95% confidence interval. The OLS estimate is represented by a dashed line, and the two dashed lines indicate the 95% confidence interval. The results suggest QR explains more changes in real estate prices at different quantiles, revealing the hidden utility of key variables on housing at different price ranges (not observed in OLS). Factors with strong impact on house prices, such as location, neighborhood, and urban blue, have varying effects at different price ranges (some have increasing trends while others have decreasing trends). QR results also showed that some non-significant factors were significant at different quantiles. For example, conditional mean coefficients of some structural and neighborhood variables were not significant overall but were significant for high-priced houses above the 80th quantile. Some variables with significant conditional mean, such as large lakes and Xiangjiang River, were not significant below the 40th and 70th quartile, respectively. With additional information obtained, the QR model was able to provide more depth on the impact of different variables on housing at different price points.

FIGURE 2. Coefficients of blue spaces estimated by QR.
The spatial dependence on house prices was also found to affect the results of the study (Xiao et al., 2020). We used the Moran index and Getis-Ord Gi*(GO) index to detect the spatial effect of housing prices. The Moran index was 0.103, while the GO index was 0.37, indicating pronounced positive spatial effects.
Spatial Quantile Regression
In the OLS regression, we added instrumental variables to perform a spatial two-stage regression. As shown in Table 4 (first column), the adjusted conditional mean 2SLS R2 was 0.53, slightly higher than the OLS model. Columns 2–10 of Table 4 present the 2SQR results and show all pseudo r2 values increasing. These results show that the improved model performed significantly better, similar to the findings of Hui, Liang, Yip (Hui et al., 2018).
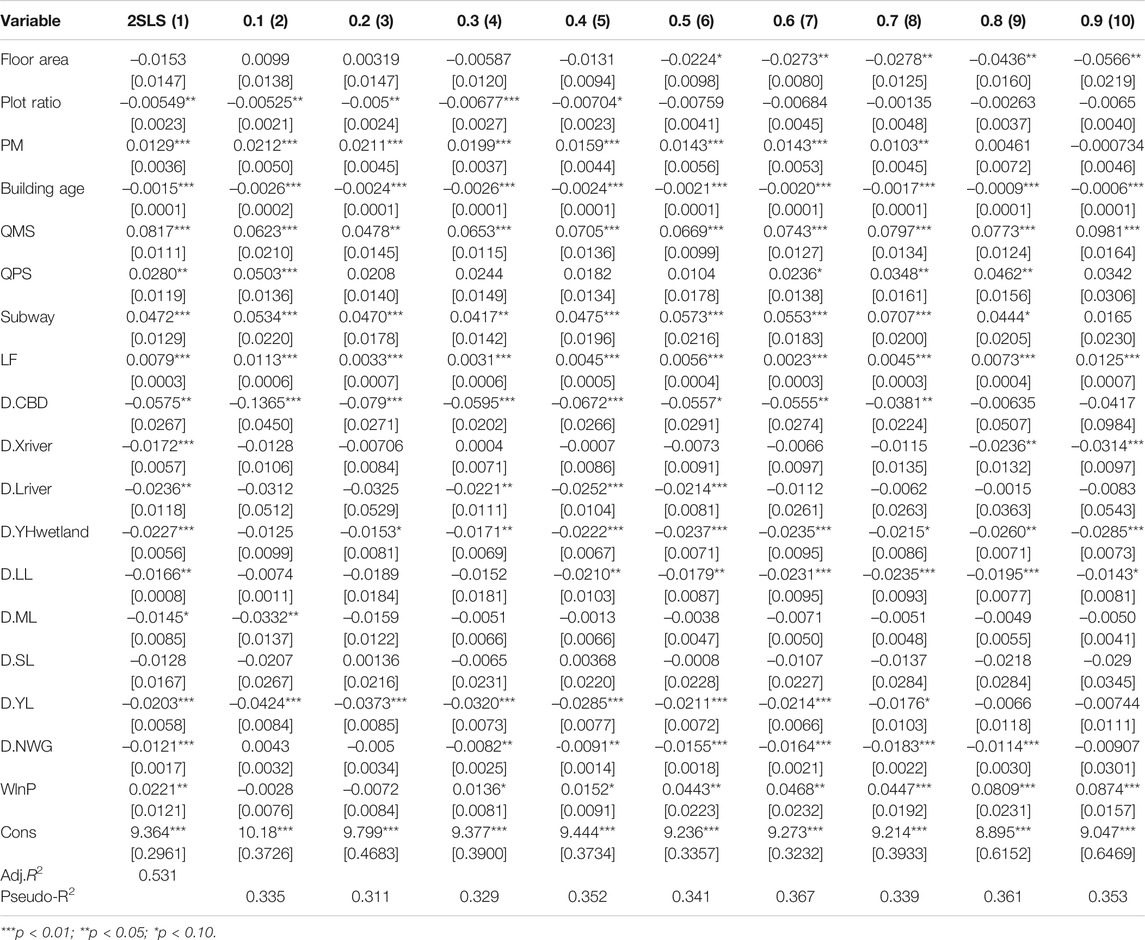
TABLE 4. 2Stage Least Squares and SQR model results.
Figure 3 shows the complete spatial quantile regression estimation of blue facilities with 0.05 quantile increments. In column 1 of Table 4, most of the variables were significant at 10%. Most parameter estimates in the two regression models were very similar. For example, the location, education, and subway parameters were found to significantly affect housing prices in both models. The main difference between the two models was due to the OLS not controlling for the spatial effect. This caused variable overestimation where the coefficients for most of the OLS variables were higher than in the 2SLS. Liao and Wang (2012) also reached a similar conclusion. Combined with the significant effect of the spatial lag factor, we found that the spatial dependence had been corrected to a certain extent in the 2sls model and that the use of instrumental variables in the spatial 2sls model is needed to circumvent endogeneity.
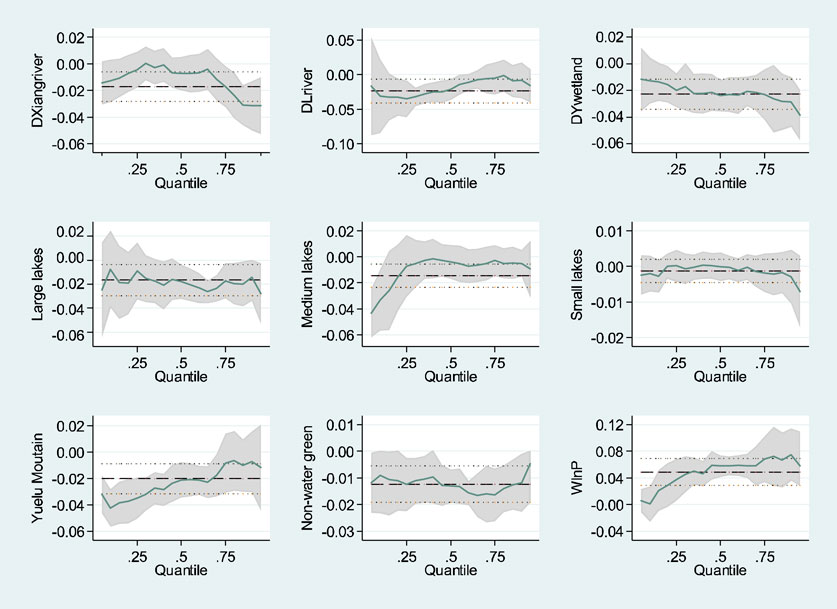
FIGURE 3. Coefficients of blue spaces estimated by 2SQR.
Based on the regression coefficients of the spatial lag term, we found that the 30–90 quantile is significant at the 10% level, and the spatial dependence coefficient increases significantly with the increase of the quantile (from 0.013 to 0.087). This indicates a more pronounced spatial dependence in high-priced housing. The confidence interval above the 50th quantile exceeds the 2SLS conditional mean of 0.022, indicating that the 2SLS results may overestimate the spatial dependence of low-priced houses and underestimate the high-priced houses.
Blue Space of Changsha
The results in Table 4 show that the Xiangjiang River has a significant impact on property value, with distance negatively correlated with price. Each kilometer increase in the distance to Xiangjiang River correlated with a decline of about 1.72% in property value (i.e., 210 RMB per m2). The capitalization effect of the Xiangjiang River (less than Yanghu wetland) was not consistent with its status as the center of the nature landscape in Changsha, which may due to increased flood risk. In 2017, the Xiangjiang River experienced flooding, resulting in economic losses for residents. Recent flood events can significantly alter people’s perception and behavior towards flood risks (Bin and Polasky, 2004). With respect to the different housing prices, proximity to the Xiangjiang only has a significant impact above the 70th quartile, peaking at 90th (from 2.36% to 3.14%, each km). This suggests that nearness to the Xiangjiang river affects mainly house prices for high-value properties. This heterogeneity in proximity effects may be caused by better river scenarios and increased safety found mainly in high-value properties, similar to the conclusions of Wu Q. et al. (2020).
The Liuyang River is a tributary of the Xiangjiang River, flowing through the entire eastern part of the city, and is an important blue space in Changsha. As shown in Table 4, proximity to the Liuyang River has a significant impact on housing prices (at the 10% level), with a 2SLS conditional mean regression coefficient of 2.36% value decline per km. The SQR results show that only low and medium-priced houses (i.e., 30th–50th quantile) are affected by proximity to this river.
Proximity to the Yanghu National Wetland Park was also found to significantly affect housing prices, similar to the findings of Mei et al. (2018), with every kilometer distance correlating with a 2.27% decline in housing prices (equivalent to 277 RMB per m2). Similar to the effects of the Xiangjiang River, the SQR shows that the price effect caused by proximity to the Yanghu wetland increases as the quantile rises and is most pronounced for high-value properties (From 1.53% to 2.85%). Yanghu National Wetland Park was found to have a strong effect on housing prices among the different landscape factors in Changsha and has an estimated coefficient almost higher than any blue and green space. This may suggest wetlands are increasingly becoming more valued in cities.
While urban lake is the most common blue space in the city, our results found noticeable differences between varying sizes. The conditional mean coefficient of large lakes (LL) using 2sls was 1.66% value loss per km (i.e., 202 RMB per m2), significant at the 1% level, and is higher than most landscape coefficients. LL has a significant impact on house prices above the 40th quantile. The estimated LL coefficients increased significantly, especially for mid-to-high-priced housing above the 60–70 range (2.31%, 2.35%, respectively), similar to the impact of wetland parks and the Xiangjiang River landscape. The impact of medium lakes (ML) was significant at the 10% level, resulting in a 1.45% value decline per km. The ML coefficient value was smaller than for large lakes and had a nonlinear trend across quantiles. According to the SQR, ML affected house prices below the 10th quantile but had no significant impact on those above the 10th quantile. Small lake (SL) is the commonest blue space in Changsha city. Although SL has a negative coefficient, the variable was not statistically significant. Housing prices seem to be unaffected by small water bodies, which is in sharp contrast to the impact on price of other kinds of blue space.
Green Spaces in Changsha
For comparison, we used the non-water body green spaces as the control variables. As shown in Table 4, the conditional mean loss of property value for the Yuelu Forest Park was 2.03% per km, relatively similar to some previous studies of forest parks (Czembrowski and Kronenberg, 2016). The SQR results show that proximity to the Yuelu forest does not significantly influence house prices above the 80th quantile. For the other common green spaces, their impact was found to have a noticeable steady trend. The 2SLS results were significant at the 1% level, with a value loss of 1.21%. Most of the quantile coefficients for non-water green spaces were higher. These findings are consistent with existing studies (Liao and Wang, 2012), and the estimated accessibility coefficient is also comparatively similar.
Other Key Variables
The study also found that the housing price gradient can diversify with the distance from the CBD (Wen et al., 2014). By 2SLS, each kilometer away from the CBD leads to a 5.75% decay of house prices. The SQR results showed that the price for accessibility to the CBD decreases for higher quantiles (from 13.65% to 3.81%, each km). Low- and medium-priced properties were influenced more strongly by CBD than high-priced houses. Neighborhood variables, such as proximity to quality primary and middle education facilities (2.80% and 8.17%, respectively) and nearness to a subway station (4.72%), were also found to have significant impact on housing prices. These results suggest education-related factors are becoming important factors affecting property house prices in China.
Density Test of Urban Blue Accessibility
As suggested by Coulson and McMillen (2007), the distribution of house prices varying to the explanatory variables could exam the heterogeneity across dependent variable quantiles. If a change in the value of the independent variable (distance) causes a change in the dependent variable's distribution, this would mean that different quantiles would have varying responses to the independent variable and that heteroscedasticity exists across different quantiles. To investigate this effect, we drew the kernel density curve to compare the distribution of prices among varying accessibility to various urban blue parameters. The results are presented in Figure 4. For the Xiangjiang River, the kernel curve changes its kurtosis as the distance increases. Similarly, the parameters Liuyang river, Yanghu wetland, large lakes, and middle lakes have a significant change in the distribution of housing prices when the value of accessibility independent variable changing. Most have changes in the kurtosis (right tail of the distribution), with some increase in variance distribution, coincident with the SQR results. In contrast, the kernel density curve for small lakes has little distributional change, which means no heteroscedasticity in this variable.
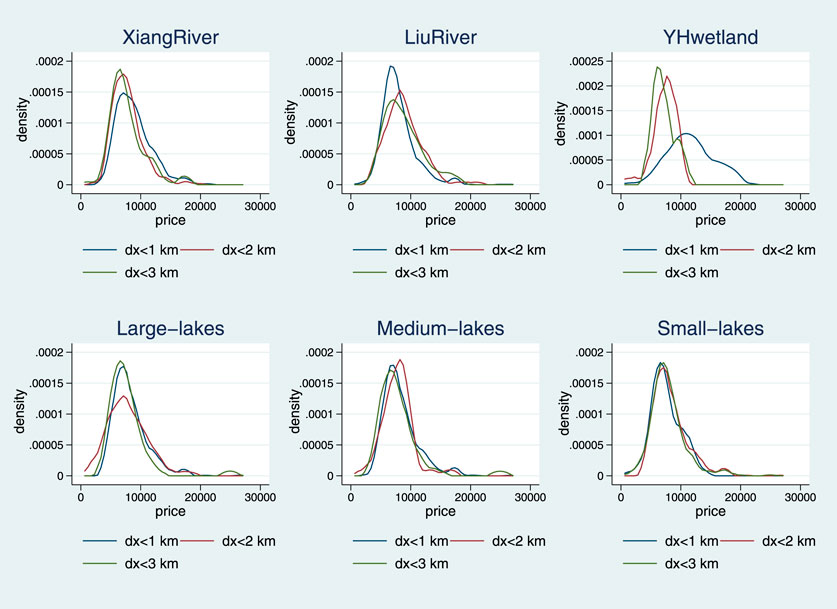
FIGURE 4. Shifts in the distribution of house prices.
Discussion
Effects of Blue Space Type and Size
Accessibility to wetlands, lakes, and rivers all have a positive impact on housing prices, which varies for different types and sizes of blue spaces. Accessibility to wetland parks was found to have the quite strong effect among blue space features, possibly because wetlands provide recreation, biodiversity, ecological conservation, and other ecosystem services that urban residents value. While Xiangjiang River is an important blue landscape in Changsha, its impact on housing prices was less than what we anticipated, coming second to wetlands, possibly due to increased flooding risks. The impact of the Xiangjiang River’s tributary, the Liuyang River, was close to the YangHu wetland. For lakes, which are the blue spaces most frequently used by residents, their accessibility significantly affected housing prices, which varied considerably based on lake size. Accessibility to medium-sized lakes was found to have smaller impact than large-sized lakes, while small-sized lakes did not significantly affect property value.
The empirical results suggest that the larger the size of the water body, the more it affects the surrounding house prices. One possible reason is that larger water spaces are able to provide more (or more perceivable) ecosystem services. One clear example is its reduction of urban heat islands, which is directly related to the size and fragmentation of the water body (Yu et al., 2020). Another possible reason is the water body’s frequency of use. Small urban blue spaces are usually embedded in residential communities, which often means lower transportation costs to use. According to the existing literature, a higher transportation cost to a nature space, a more sensitive of the residents to the perceived walking distance to arrive (Nielsen and Hansen, 2007; Voelker et al., 2018). This explained in part of the independent variable (accessibility of small lakes) has a non-significant effect on the house price because residents’ perceived walking distance to these embedded blue spaces is not as sensitive as the large-sized lakes, which are usually located farther from the residential community with higher transportation costs. Moreover, most small blue spaces are located in the city’s core, where highly dense surrounding communities (commonly high-rise buildings) obstruct their visibility and limit their effect, which further limits the effect of the little blue on house prices. Besides, awareness and familiarity with small and medium urban blue spaces are considerably lower than key water bodies, minimizing their impressions on homebuyers and limiting their effect on property value.
Quantile Effect
In the SQR results, the effect of blue spaces varied considerably across different quantiles. The impact of accessibility to the Xiangjiang River, large lakes, and Yanghu wetland increased linearly with property value, such that blue spaces had greater effect on high-priced houses. In comparison, proximity effects to medium-sized lake parks and the Liuyang River were more pronounced on low- and middle-quantile properties and had a nonlinear trend. Various possible reasons may explain why the proximity effect of these three urban blue spaces intensifies as property value increases. First, high-priced properties generally have better viewshed access, often at higher altitudes, better orientation, and lower flood risks (Wu P.-I. et al., 2020). Second, buyers of high-priced houses are highly concerned about their physical and mental health. Large-scale urban blue spaces are able to address such concerns, providing more perceivable ecosystem services that generate higher marginal utility. Also, better marketing and advertising strategies are able to highlight the attributes of blue spaces, which are often used to entice high-income buyers. This makes higher income groups more aware and perceptive of amenities generated by blue spaces. According to a previous study, familiarity with a landscape positively correlates with the purchase premium (LaRiviere et al., 2014). Homebuyers may even be led to believe that properties around the famous water bodies have higher investment values. In contrast, medium-sized lakes and the Liuyang River have limited appeal to high-income homebuyers due to their smaller extent and less perceivable ecological amenities. High-priced houses are more likely to be located in better environments since high-income residents use their own cars to commute. In contrast, most low- and middle-income homebuyers who use public transport to commute do not choose to live near a large blue space far from the city area, preferring medium-sized blue spaces that are usually distributed in downtown areas, which are more economic for a commute. Therefore, the quantile effects of medium-size blue thus show a lower impact on the high-priced houses while it is significant to low-priced houses.
Outlook for Further Research
Our research found that the type and size of blue spaces have varying influences on house prices. Our results also showed significant differences in the impact on property value across different housing price quantiles. Using the framework presented in Data and Methodology, we assumed that the effect on house prices depends mainly on the ecosystem services provided by the various blue spaces. However, the impact of specific ecosystem services can not be quantified in this study since buyers do not naturally have the cognition or willingness to distinguish between different ecosystem services (Czembrowski and Kronenberg, 2016).
While the SQR results showed that buyers of high-priced houses might be more concerned about the value of these ecosystem services, it does not allow us to explore the impact of individual ecosystem services. SQR also does not analyze how homebuyers consider different ecosystem services offered by different types and sizes of urban blue spaces. Rather, our analysis focused on evaluating the effects of different types and sizes of blue spaces at various quantiles. Hedonic pricing is rarely used to accurately quantify the price effects of individual ecosystem services. To value the impact of specific ecosystem services, more studies are needed using other valuation techniques that are able to explicitly link value effects to particular ecosystem services. Follow-up research can further adopt more metadata, such as questionnaire surveys, and use other quantitative methods to further explore the economic value of different ecosystem serves of blue spaces.
Conclusion and Recommendation
In this era of rising awareness and demands for healthy living standards, access to urban blue spaces is now being demanded by more and more urban dwellers. However, research on how access and proximity of different urban blue spaces affect property value has been largely limited. To address this current research gap, this study employed a spatial quantile hedonic model to evaluate the proximity effects of different types of blue spaces on property prices across different conditional distributions.
Spatial dependence in property value was found to be significant across price quantiles. This suggests that using spatial lag term in hedonic research is needed in order to prevent biased outcomes. We also found that the positive effect of spatial dependence increases in higher price quantiles. High-priced houses were found to cluster together, which confirms the findings of other urban hedonic studies. The results suggest rich homebuyers concern more about scarce public facilities and ecological resources, with a feature of the housing market in China's big cities, which may be one of the cause led to the spatial aggregation of high-priced house.
The 2SLS results show that the type and size of urban blue spaces influence the capitalization effect on property value. Despite possible increases in the flood risks, proximity to rivers was found to have a positive impact on house prices. In terms of proximity effects of the Xiangjiang River, property value declined by about 1.72% per kilometer of walking distance. The proximity effect of the Liuyang River was also found to significantly impact house prices, each kilometer of increased walking distance from it results in about a 2.36% decline in house prices. Wetland park is a new kind of environmental amenity that has recently emerged across many Chinese cities. In our results, property values declined by about 2.27% per kilometer of increased distance from the Yanghu national wetland park. We also found similar proximity effects of large and medium-size urban lakes, with increased distance resulting in house price declines of 1.66% and 1.45% per kilometer, respectively. These proximity effects were found to generally increase with the size of the blue space, possibly because larger blue spaces provide increased and more perceivable ecosystem services.
Under the quantile setting, the SQR model provided more details on blue space effects than the 2SLS. Only proximity effects of the Yanghu wetland were significant almost across all house price ranges in QR and SQR. Since the values of most parameters of blue spaces in 2SLS are all significant, this means property values in different price ranges affected by blue spaces are overestimated. The SQR results suggest that the Xiangjiang River and large lakes have significant influence only with high-value properties and that the 2SLS overestimated the effect of these variables in low-priced houses. In contrast, only low- and medium-priced houses were found significant to the accessibility to medium-sized lakes and the Liuyang River, which means the effect on high-priced houses of these two variables have been overestimated in 2SLS. Different variables also showed varying SQR trends for different price quantiles. The proximity effects of Xiangjiang river, Yanghu wetland, and large lakes are not significant at low-value properties but are significant and increases considerably for higher-priced houses. To some extent, the results suggest that the greater wealth of the homebuyer, the stronger the marginal willingness to pay for accessibility to core blue spaces. In other blue spaces, like the Liuyang River and middle-size lakes, proximity effects had nonlinear trends across different quantiles. Residents in low-priced houses might pay more for the accessibility to these blue spaces.
Based on the findings of this study, we conclude some recommendations for future urban planning. First, more small blue spaces that are effectively embedded in residential communities should be developed. Small blue space should be encouraged owing to its convenience in daily life and no significant influence on house price, which means improving residential well-being without adding to the cost of buying a house. Second, improving the service efficiency of the key blue spaces through better transport network systems and more balanced residential development density planning. Transport departments should improve the accessibility of blue space by renovating some unreasonable road networks and reducing the interchange time. It is also important to construct subway stations near famous blue spaces, which greatly shortens the commuting distance. Besides, since high-priced houses are more affected by the key blue spaces, developers tend to build higher-height houses with better views closer to blue. Therefore, restricting the residential density and building height, setting reasonable prohibit development lines of key blue spaces is necessary to ensure the accessibility and visibility of the water landscapes. In short, the government should create a rational opportunity to enable more residents to enjoy the famous blue spaces amenity value, rather than the monopoly of urban blue by rich homebuyers. Last but not the least, It is important to regulate the land revenue distribution mechanism. As results revealed, the key urban blue has a significant effect on housing price, which most benefit the property developers. However, the increment value created by the key blue spaces is usually invested by the local government. Therefore, it is more reasonable not to gather land rent one-time charging but adjust incremental land revenue according to the pricing effect of key urban blue spaces, which improves the fiscal pattern of public services in cities.
Data Availability Statement
The original contributions presented in the study are included in the article/Supplementary Material, further inquiries can be directed to the corresponding author.
Author Contributions
Conceptualization, methodology, software, and writing: HT and HQ; OX acquired the data; YD analyzed and interpreted the data for the work.
Funding
This research was funded by the Major Program of National Social Science Foundation of China (18ZDAA040) and Natural Science Foundation of Hunan Province (2020JJ5111), Project of Hunan Social Science Achievement Appraisal Committee (XSP20YBZ081), Young Teacher Innovation Drive Project of Hunan University Technology and Business (19QD04).
Conflict of Interest
The authors declare that the research was conducted in the absence of any commercial or financial relationships that could be construed as a potential conflict of interest.
References
Anderson, S. T., and West, S. E. (2006). Open Space, Residential Property Values, and Spatial Context. Reg. Sci. Urban Econ. 36 (6), 773–789. doi:10.1016/j.regsciurbeco.2006.03.007
Anselin, L. (2003). Spatial Externalities, Spatial Multipliers, and Spatial Econometrics. Int. Reg. Sci. Rev. 26, 153–166. doi:10.1177/0160017602250972
Bin, O., and Polasky, S. (2004). Effects of Flood Hazards on Property Values: Evidence before and after Hurricane Floyd. Land Econ. 80, 490–500. doi:10.2307/3655805
Brander, L. M., and Koetse, M. J. (2011). The Value of Urban Open Space: Meta-Analyses of Contingent Valuation and Hedonic Pricing Results. J. Environ. Manage. 92 (10), 2763–2773. doi:10.1016/j.jenvman.2011.06.019
Chernozhukov, V., and Hansen, C. (2006). Instrumental Quantile Regression Inference for Structural and Treatment Effect Models. J. Econom. 132 (2), 491–525. doi:10.1016/j.jeconom.2005.02.009
Conway, D., Li, C. Q., Wolch, J., Kahle, C., and Jerrett, M. (2010). A Spatial Autocorrelation Approach for Examining the Effects of Urban Greenspace on Residential Property Values. J. Real Estate Finan Econ. 41 (2), 150–169. doi:10.1007/s11146-008-9159-6
Coulson, N. E., and McMillen, D. P. (2007). The Dynamics of Intraurban Quantile House Price Indexes. Urban Stud. 44 (8), 1517–1537. doi:10.1080/00420980701373446
Czembrowski, P., and Kronenberg, J. (2016). Hedonic Pricing and Different Urban Green Space Types and Sizes: Insights into the Discussion on Valuing Ecosystem Services. Landscape Urban Plann. 146, 11–19. doi:10.1016/j.landurbplan.2015.10.005
Ebru, Ç., and Eban, A. (2011). Determinants of House Prices in Istanbul: A Quantile Regression Approach. Qual. Quant. 45 (2), 305–317. doi:10.1007/s11135-009-9296-x
Garrett, J. K., White, M. P., Huang, J., Ng, S., Hui, Z., Leung, C., et al. (2019). Urban Blue Space and Health and Wellbeing in Hong Kong: Results from a Survey of Older Adults. Health Place 55, 100–110. doi:10.1016/j.healthplace.2018.11.003
Gascon, M., Triguero-Mas, M., Martínez, D., Dadvand, P., Forns, J., Plasència, A., et al. (2015). Mental Health Benefits of Long-Term Exposure to Residential Green and Blue Spaces: A Systematic Review. Int J Environ Res Public Health. 12 (4), 4354–4379. doi:10.3390/ijerph120404354
Gómez-Baggethun, E., and Barton, D. N. (2013). Classifying and Valuing Ecosystem Services for Urban Planning. Ecol. Econ. 86, 235–245. doi:10.1016/j.ecolecon.2012.08.019
Herbert, D. T., and Thomas, C. J. (1998). School Performance, League Tables and Social Geography. Appl. Geogr. 18 (3), 199–223. doi:10.1016/S0143-6228(98)00015-0
Huang, Z., Chen, R., Xu, D., and Zhou, W. (2017). Spatial and Hedonic Analysis of Housing Prices in Shanghai. Habitat Int. 67, 69–78. doi:10.1016/j.habitatint.2017.07.002
Hui, E. C. M., Liang, C., and Yip, T. L. (2018). Impact of Semi-obnoxious Facilities and Urban Renewal Strategy on Subdivided Units. Appl. Geogr. 91, 144–155. doi:10.1016/j.apgeog.2017.12.020
Jim, C. Y., and Chen, W. Y. (2006). Impacts of Urban Environmental Elements on Residential Housing Prices in Guangzhou (China). Landscape Urban Plann. 78 (4), 422–434. doi:10.1016/j.landurbplan.2005.12.003
Kang, H.-H., and Liu, S.-B. (2014). The Impact of the 2008 Financial Crisis on Housing Prices in China and Taiwan: A Quantile Regression Analysis. Econ. Model. 42, 356–362. doi:10.1016/j.econmod.2014.07.018
Kaplan, R., and Kaplan, S. (1989). The Experience of Nature: A Psychological Perspective. New York: Cambridge University Press, xii-340. doi:10.1037/030621
Kelejian, H. H., and Prucha, I. R. (1999). A Generalized Moments Estimator for the Autoregressive Parameter in a Spatial Model. Int. Econ. Rev. 40 (2), 509–533. doi:10.1111/1468-2354.00027
Kim, T. H., and Muller, C. (2004). Two‐stage Quantile Regression when the First Stage Is Based on Quantile Regression. Econom. J. 7 (1), 218–231. doi:10.1111/j.1368-423x.2004.00128.x
Kong, F., Yin, H., and Nakagoshi, N. (2007). Using GIS and Landscape Metrics in the Hedonic Price Modeling of the Amenity Value of Urban Green Space: A Case Study in Jinan City, China. Landscape Urban Plann. 79 (3–4), 240–252. doi:10.1016/j.landurbplan.2006.02.013
Kostov, P. (2009). A Spatial Quantile Regression Hedonic Model of Agricultural Land Prices. Spat. Econ. Anal. 4 (1), 53–72. doi:10.1080/17421770802625957
Kuethe, T. H., and Keeney, R. (2012). Environmental Externalities and Residential Property Values: Externalized Costs along the House Price Distribution. Land Econ. 88 (2), 241–250. doi:10.3368/le.88.2.241
LaRiviere, J., Czajkowski, M., Hanley, N., Aanesen, M., Falk-Petersen, J., and Tinch, D. (2014). The Value of Familiarity: Effects of Knowledge and Objective Signals on Willingness to Pay for a Public Good. J. Environ. Econ. Management. 68 (2), 376–389. doi:10.1016/j.jeem.2014.07.004
Larson, E. K., and Perrings, C. (2013). The Value of Water-Related Amenities in an Arid City: The Case of the Phoenix Metropolitan Area. Landscape Urban Plann. 109 (1), 45–55. doi:10.1016/j.landurbplan.2012.10.008
LeSage, J. P., and Pace, R. K. (2004). Models for Spatially Dependent Missing Data. J. Real Estate Finance Econ. 29 (2), 233–254. doi:10.1023/B:REAL.0000035312.82241.e4
Li, H., Wei, Y. D., Wu, Y., and Tian, G. (2019a). Analyzing Housing Prices in Shanghai with Open Data: Amenity, Accessibility and Urban Structure. Cities 91, 165–179. doi:10.1016/j.cities.2018.11.016
Li, H., Wei, Y. D., and Wu, Y. (2019b). Urban Amenity, Human Capital and Employment Distribution in Shanghai. Habitat Int. 91, 102025. doi:10.1016/j.habitatint.2019.102025
Lianyong, W., and Eagles, P. F. J. (2009). Some Theoretical Considerations: From Landscape Ecology to Waterscape Ecology. Acta Ecologica Sinica. 29 (3), 176–181. doi:10.1016/j.chnaes.2009.07.006
Liao, W.-C., and Wang, X. (2012). Hedonic House Prices and Spatial Quantile Regression. J. Housing Econ. 21 (1), 16–27. doi:10.1016/j.jhe.2011.11.001
Liebelt, V., Bartke, S., and Schwarz, N. (2019). Urban Green Spaces and Housing Prices: An Alternative Perspective. Sustainability. 11 (13), 3707. doi:10.3390/su11133707
Liu, T., Hu, W., Song, Y., and Zhang, A. (2020). Exploring Spillover Effects of Ecological Lands: A Spatial Multilevel Hedonic Price Model of the Housing Market in Wuhan, China. Ecol. Econ. 170, 106568. doi:10.1016/j.ecolecon.2019.106568
Mak, S., Choy, L., and Ho, W. (2010). Quantile Regression Estimates of Hong Kong Real Estate Prices. Urban Stud. 47 (11), 2461–2472. doi:10.1177/0042098009359032
McMillen, D. P. (2012). Quantile Regression for Spatial Data. Berlin: Springer Science & Business Media.
Mei, Y., Sohngen, B., and Babb, T. (2018). Valuing Urban Wetland Quality with Hedonic Price Model. Ecol. Indicators 84, 535–545. doi:10.1016/j.ecolind.2017.09.022
Mueller, J. M., and Loomis, J. B. (2014). Does the Estimated Impact of Wildfires Vary with the Housing Price Distribution? A Quantile Regression Approach. Land Use Policy. 41, 121–127. doi:10.1016/j.landusepol.2014.05.008
Nielsen, T. S., and Hansen, K. B. (2007). Do green Areas Affect Health? Results from a Danish Survey on the Use of Green Areas and Health Indicators. Health Place 13 (4), 839–850. doi:10.1016/j.healthplace.2007.02.001
Rajapaksa, D., Wilson, C., Hoang, V.-N., Lee, B., and Managi, S. (2017). Who Responds More to Environmental Amenities and Dis-Amenities?. Land Use Policy. 62, 151–158. doi:10.1016/j.landusepol.2016.12.029
Roebeling, P., Saraiva, M., Palla, A., Gnecco, I., Teotonio, C., Fidelis, T., et al. (2017). Assessing the Socio-Economic Impacts of Green/blue Space, Urban Residential and Road Infrastructure Projects in the Confluence (Lyon): A Hedonic Pricing Simulation Approach. J. Environ. Plann. Management. 60 (3), 482–499. doi:10.1080/09640568.2016.1162138
Rosen, S. (1974). Hedonic Prices and Implicit Markets: Product Differentiation in Pure Competition. J. Polit. Economy 82 (1), 34–55. doi:10.1086/260169
Sander, H. A., and Haight, R. G. (2012). Estimating the Economic Value of Cultural Ecosystem Services in an Urbanizing Area Using Hedonic Pricing. J. Environ. Manage. 113, 194–205. doi:10.1016/j.jenvman.2012.08.031
Sander, H. A., and Zhao, C. (2015). Urban Green and Blue: Who Values what and where?. Land Use Policy. 42, 194–209. doi:10.1016/j.landusepol.2014.07.021
Targino, A. C., Coraiola, G. C., and Krecl, P. (2019). Green or Blue Spaces? Assessment of the Effectiveness and Costs to Mitigate the Urban Heat Island in a Latin American City. Theor. Appl. Climatol. 136 (3–4), 971–984. doi:10.1007/s00704-018-2534-1
Voelker, S., Heiler, A., Pollmann, T., Classen, T., Hornberg, C., and Kistemann, T. (2018). Do perceived Walking Distance to and Use of Urban Blue Spaces Affect Self-Reported Physical and Mental Health?. Urban For. Urban Green. 29, 1–9. doi:10.1016/j.ufug.2017.10.014
Voelker, S., and Kistemann, T. (2015). Developing the Urban Blue: Comparative Health Responses to Blue and Green Urban Open Spaces in Germany. Health Place. 35, 196–205. doi:10.1016/j.healthplace.2014.10.015
Wen, H., Zhang, Y., and Zhang, L. (2014). Do educational Facilities Affect Housing Price? an Empirical Study in Hangzhou, China. Habitat Int. 42, 155–163. doi:10.1016/j.habitatint.2013.12.004
Wu, P.-I., Chen, Y., and Liou, J.-L. (2020). Housing Property along Riverbanks in Taipei, Taiwan: A Spatial Quantile Modelling of Landscape Benefits and Flooding Losses. Environ. Dev. Sustain. 23, 2404–2438. doi:10.1007/s10668-020-00680-7
Wu, Q., Cheng, Z. G., and Yang, D. X. (2020). Social Stratification and Housing Inequality in Transitional Urban China. Contemp. Soc. Sci. 537, 1, 16 16. Available at: https://ideas.repec.org/a/eee/phsmap/v537y2020ics0378437119314773.html. doi:10.1080/21582041.2020.1797148
Wu, W-p., Zeng, W-k., Gong, S-w., and Chen, Z-g. (2021). Does Energy Poverty Reduce Rural Labor Wages? Evidence from China's Rural Household Survey. Front. Energ. Res. 9, 670026. Available at: https://ideas.repec.org/a/eee/phsmap/v537y2020ics0378437119314773.html. doi:10.3389/fenrg.2021.670026
Xiao, Y., Hui, E. C. M., and Wen, H. (2020). The Housing Market Impacts of Human Activities in Public Spaces: The Case of the Square Dancing. Urban For. Urban Green. 54, 126769. doi:10.1016/j.ufug.2020.126769
Yu, Z., Yang, G., Zuo, S., Jørgensen, G., Koga, M., and Vejre, H. (2020). Critical Review on the Cooling Effect of Urban Blue-Green Space: A Threshold-Size Perspective. Urban For. Urban Green. 49, 126630. doi:10.1016/j.ufug.2020.126630
Zhang, L. (2016). Flood Hazards Impact on Neighborhood House Prices: A Spatial Quantile Regression Analysis. Reg. Sci. Urban Econ. 60, 12–19. doi:10.1016/j.regsciurbeco.2016.06.005
Keywords: blue space, housing price, spatial quantile regression, accessibility, urban China
Citation: Tuofu H, Qingyun H, Dongxiao Y and Xiao O (2021) Evaluating the Impact of Urban Blue Space Accessibility on Housing Price: A Spatial Quantile Regression Approach Applied in Changsha, China. Front. Environ. Sci. 9:696626. doi: 10.3389/fenvs.2021.696626
Received: 17 April 2021; Accepted: 03 May 2021;
Published: 20 May 2021.
Edited by:
Yanfei Li, Hunan University of Technology and Business, ChinaReviewed by:
Han Li, University of Miami, United StatesHe Nie, National University of Singapore, Singapore
Chen Ziyue, Norwegian University of Science and Technology, Norway
Copyright © 2021 Tuofu, Qingyun, Dongxiao and Xiao. This is an open-access article distributed under the terms of the Creative Commons Attribution License (CC BY). The use, distribution or reproduction in other forums is permitted, provided the original author(s) and the copyright owner(s) are credited and that the original publication in this journal is cited, in accordance with accepted academic practice. No use, distribution or reproduction is permitted which does not comply with these terms.
*Correspondence: He Qingyun, heqingyun1848@gmail.com