Biomass Production Assessment in a Protected Area of Dry Tropical forest Ecosystem of India: A Field to Satellite Observation Approach
 Tarun K. Thakur1
  Digvesh K. Patel1
  Anita Thakur1
  Anirudh Kumar1 Arvind Bijalwan2
  Jahangeer A. Bhat3
  Amit Kumar4
  M. J. Dobriyal3
  Munesh Kumar5
  Amit Kumar6*
- 1Indira Gandhi National Tribal University, Amarkantak, India
- 2College of Forestry, VCSG Uttarakhand University of Horticulture and Forestry, Tehri Garhwal, India
- 3College of Horticulture and Forestry, Rani Lakshmi Bai Central Agricultural University, Jhansi, India
- 4Central MugaEri Research and Training Institute, Central Silk Board, Jorhat, India
- 5Department of Forestry and Natural Resources, H.N.B. Garhwal University, Srinagar Garhwal, India
- 6Nanjing University of Information Science and Technology, School of Hydrology and Water Resources, Nanjing, China
In recent decades, degradation and loss of the world’s forest ecosystems have been key contributors to biodiversity loss and future climate change. This article analyzes plant diversity, biomass, carbon sequestration potential (CSP), and the net primary productivity (NPP) of four vegetation types viz., Dense mixed forest (DMF); Open mixed forest (OMF); Teak plantation (TP), and Sal mixed forest (SMF) in the dry tropical forest ecosystem of central India through remote sensing techniques together with physical ground observations during 2013–2018. The total C storage in trees varied from 16.02 to 47.15 Mg ha−1 in studied vegetation types with the highest in DMF and lowest in OMF. The total C storage in stem wood, branches, and foliage falls in the range of 52.93–78.30%, 9.49–22.99%, and 3.31–12.89% respectively. The total standing biomass varied from 83.77 to 111.21 Mg ha−1 and these variations are due to different vegetation types, with the highest in DMF followed by TP, SMF while the lowest was estimated in OMF. The net primary productivity (NPP) [aboveground (AG) + belowground (BG)] varied from 7.61 to 9.94 Mg ha−1 yr−1 with mean values of 8.74 Mg ha−1 yr−1 where AG shares a maximum contribution of 77.66%. The total biomass production was distributed from 64.09 to 82.91% in AG and 17.08–35.91% in BG components. The present study outlines that the studied forest ecosystem has the substantial potential of carbon sequestration and a great possibility of mitigating local and global climate change.
Introduction
In recent decades, there is a growing concern among the scientific community, researchers, environmentalists, foresters, and policy developers around the globe regarding the sustainable management of natural resources (Kumar et al., 2021a,b). Overexploitation of natural resources is causing severe ecological deprivation and affecting the functioning of various natural ecosystems. Studies have shown that human activities changed carbon stocks in terrestrial pools through rapid land-use transformations (Pan et al., 2011; Thakur et al., 2014; Jones et al., 2019; Jhariya and Singh, 2021). Remote sensing techniques have immense potential in determining carbon and biomass storage, net primary productivity, species diversity, and change in land use land cover (LULC) of the region (FSI, 2015, FSI, 2019; Thakur et al., 2019). In the mainland of Southeast Asia, almost 30% of dry forests are currently in existence, while 60% of Indian forests are considered tropical dry forests (Poffenberger, 2000; Waeber et al., 2012). The current study was designed to objectively assess biomass production along with land use pattern, plant diversity, structure and composition of plant communities, and carbon sequestration potential, in tropical dry forests (TDF) of the protected area of the Achanakmaar Amarkantak Biosphere Reserve (AABR) in central India, using remote sensing techniques assisted by ground-based direct measurements. Biomass production assessment is one of the major criteria for correlating ecosystem functioning and productivity in the forest ecosystem. To scale up the assessment at the landscape level, satellite data coupled with sampled ground verification gives more reliable information more economically and in less time. Furthermore, it helps the forest managers make suitable plans and design the required interventions as a management strategy for the improvement of protected habitats like biosphere reserves.
The flora and fauna of AABR are a key sign of the natural legacy of species diversity. Due to environmental implications, AABR was declared as the 14th biosphere reserve of India in 2005 and UNSECO tagged it as the world’s greatest heritage site in 2012. Ecological degradation by anthropogenic activities like forest cutting, forest fire, overexploitation of overstorey and understorey vegetation, encroachment, mining, site development, and settlements are placing severe pressure on biological resources, leading to loss of biodiversity, the vegetational ecology, and carbon sequestration potential of the tropics of India were also studied and gave similar findings (Jhariya, 2017; Jhariya et al., 2019; Kumar and Kumar, 2020; Thakur et al., 2020; Thakur et al., 2021).
The structure and composition of vegetation play a strong role in controlling many important ecosystem processes like photosynthesis, evapotranspiration, and canopy light interception. The plant communities in any ecosystem largely determine the energy exchange, biomass accumulation, and gaseous exchange between plant canopies, thus regulating atmospheric concentrations of carbon dioxide (CO2) which in turn is useful for understanding the carbon budgets of the vegetation type (Nelson et al., 1999; Houghton et al., 2015; Anderson-Teixeira et al., 2016; Chazdon et al., 2016; Kumar et al., 2017; Wang et al., 2019; Tripati et al., 2020; Chaturvedi et al., 2021). In the past, a few studies have indicated that the multispectral satellite images are useful and can assist in monitoring the structure, and composition of a forest type, its diversity, and spatial arrangements (Lepine et al., 2016; Shiklomanov et al., 2016; Ali et al., 2017; Middinti et al., 2017), before addressing any functional ecological and biophysical processes of an ecosystem (such as above-ground biomass (AGB), net primary production (NPP), evapotranspiration, energy exchange, and biomass allocation patterns). Tropical forests are considered as productive terrestrial environments with a maximum potential of carbon sink and NPP per unit area (Fearnside, 1996; Gaston et al., 1998; Chave et al., 2001; Clark et al., 2001; Malhi et al., 2004; Malhi et al., 2009; Beer et al., 2010; Bijalwan et al., 2010; Mohommad and Joshi, 2015; Anderson-Teixeira et al., 2016; Poorter et al., 2016; Moore et al., 2018; Wallis et al., 2019; Wang et al., 2019). The structure of vegetation helps to facilitate suitable management practices and obtain higher rates of biomass production with maximum economic returns. The structure of vegetation assists with facilitating suitable management practices to obtain higher rates of biomass production with maximum economic returns (Chaturvedi et al., 2011; Chaturvedi and Raghuwanshi, 2015). Therefore, the importance of structural inputs for ecosystem analysis at different spatial scales has been well recognized as hotspots for present research.
There is an increasing need to improve understanding of carbon pools and fluxes in dry tropical ecosystems particularly in the central part of India. The annual loss of forest cover in the tropics ranged between 15–17 million ha (FAO, 1995; Reich, 2012; Popkin, 2018). The biomass burning from forest areas of the world ranged between 12–13 million ha, of which 87% occurs in the tropics region (FAO, 1995). At present, the CO2 levels in the atmosphere are increasing annually at 2 ppm per year triggering a major threat to the functioning of different ecosystems. Tropical forests have a great potential for atmospheric carbon sequestration and currently accumulate 55% of global terrestrial carbon (IPCC, 1996; Pan et al., 2011; Grace et al., 2014; Jones et al., 2019). Thus analysis of vegetation dynamics and LULC are urgently required for formulating constructive policies for biodiversity management, finding the best possible ways of augmenting carbon sequestration rates, and planning progressive management strategies for achieving sustainable development goals (SDGs). For evaluating and understanding the structural and functional processes of different land cover types, geospatial techniques have proved indispensable tools, which provide large spatial, multi-temporal, and synoptic data of dynamic land surface features and frequently monitor the carbon sequestration in space and time (Popkin, 2018). Earlier, several researchers demonstrated the potentials of geospatial technology for monitoring and creating an inventory of vegetation (Swamy, 1998; Mandal and Joshi, 2014). However, satellite remote sensing (RS) when combined with GIS techniques provides improved information and also helps in developing valuable strategies for natural resource management. Therefore, in the backdrop of reviews, we explored the potential of satellite images to forecast species diversity, carbon sequestration potential (CSP), AGB, and forest productivity in the TDF of AABR, India.
Materials and Methods
Study Area
The AABR protected area is located in the central part of India with an area of 626.76 km2 of dry tropical forest. The current study was conducted in the AABR area during 2013–2018 to assess species diversity, carbon sequestration potential, biomass, and NPP in four different vegetation types viz.; TP, SMF, DMF, and OMF. The geo-coordinates of the study area fall between 21°15′ to 21°58′ N and 82°25′ to 82°5′ E. The map along with identified plots at selected sampling sites is presented in Figure 1. The climatic condition of the study area is moderate humid throughout the year, with a peak rainfall from July to September and a dry period from April to June. The rainfall varies from 1,050–1,500 mm yr−1 and the mean annual temperature is 25.8°C. The study area falls under the Biosphere Reserve where all harvesting or felling is banned. The methodologies adopted for various study parameters are described briefly in the sub-section given below.
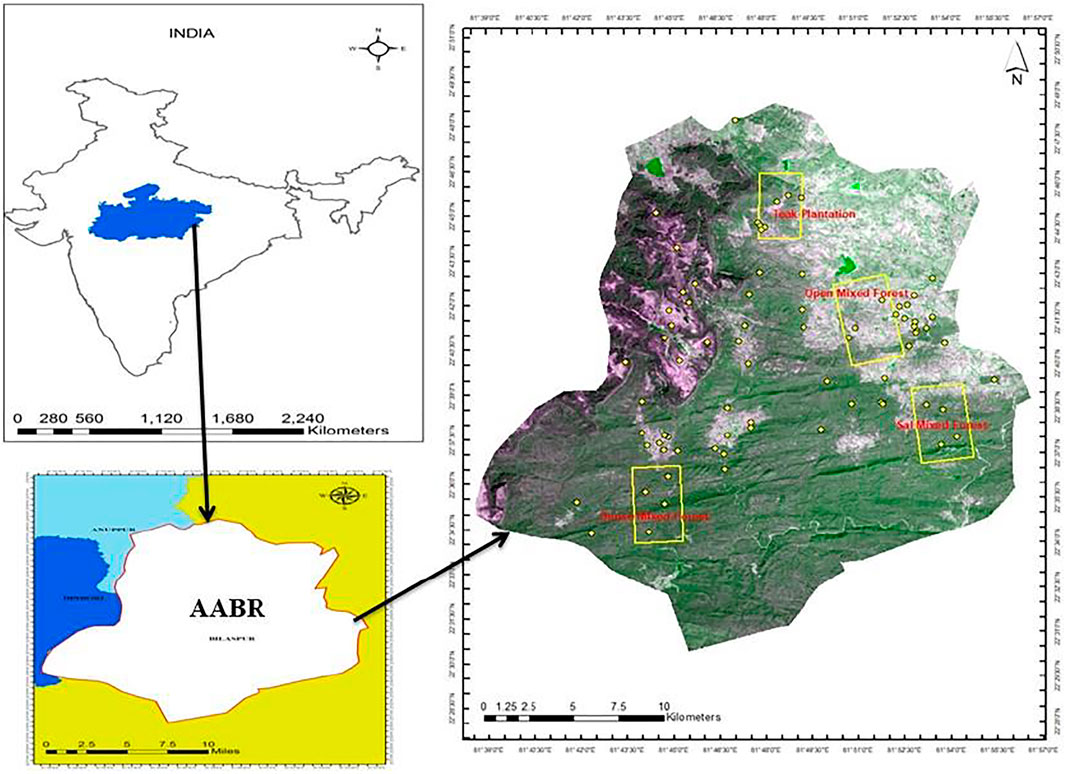
FIGURE 1. Layout map along with identified sample plots, in yellow boxes at different locations in dry tropical forests of AABR.
Satellite Remote Sensing Data Predictors
Resourcesat-2A satellite data were procured from the National Remote Sensing Agency (NRSA), Hyderabad, India. All the electromagnetic wavelength/bands were stacked in Resourcesat-2A satellite data and pre-processed by ERDAS, including geometric and atmospheric corrections. The vegetation indices and climatic factors derived from different vegetation types were charted (Thakur et al., 2014; Wallis et al., 2019; Wang et al., 2019). The generation of spectral vegetation indices such as Advance Vegetation Index (AVI), Ratio Vegetation Index (RVI), Normalized Difference Moisture Index (NDMI), Normalized Difference Vegetation Index (NDVI), Enhanced Vegetation Index (EVI), and Very Dense Vegetation Index (VDVI) map was established using ERDAS Imagine (Version 9.3) software, as illustrated in Table 1.
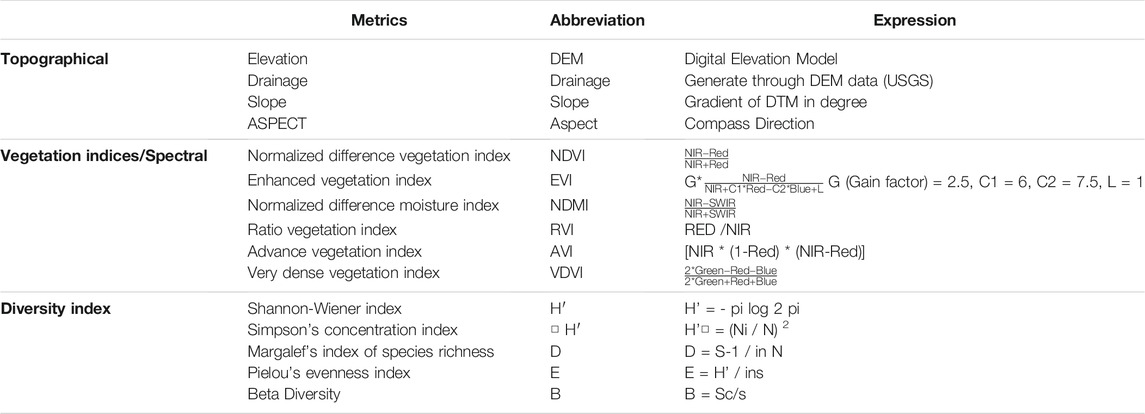
TABLE 1. Topographical, vegetation indices/spectral and diversity index.
Phytosociological, Diversity and Leaf Area Index Analysis
The systematic vegetation characterization was performed by quantifying the different parameters of vegetation composition, structure, and species richness. Phytosociological studies were conducted in two stages viz., in the first stage, different forest vegetation was characterized in terms of its spatial organization of plant communities. The stand or forest level community structural information is useful for local/patch scale simulation process models and also filtering information on structural attributes and variations for regional-scale process models. In the second stage, phyto-sociological studies were conducted on type-level to recognize the overall pattern and organization of plant communities in a given type in the region. The type-level community structural information is essential for regional ecosystem simulation models, primarily for the functional process of an ecosystem. In the second stage, phyto-sociological studies on type-level to recognize the overall pattern and organisation of plant communities and groups in a given type in the region. The type-level community structural information is essential for regional ecosystem simulation models, primarily for the functional process of an ecosystem.
The phytosociological exploration was determined from different sampling plots of 20 m × 20 m for trees (TV; diameter above 20 cm), 5 m × 5 m for shrubs (SV; height up to 5 meter), and 1 m × 1 m size for herbaceous species (HV). In each sampling plot, TV, SV, and HV were enumerated for their diameter values. The diameter of trees measured at 1.37 m above ground level, shrubs 15 cm above ground level, and herbs at color zone. The TV and SV in forty quadrats were marked for periodic measurements of diameter at breast height (dbh) and height increment values for estimation of biomass and its production. The formula used for the analysis of density, abundance, frequency, and basal area were performed according to Curtis and Mc Intosh (1950). Moreover, analysis of the species diversity of various forests of AABR was determined by the formulas used in Table 1. The mortality in different stages of trees was also estimated by considering the deterioration status of the trees. The leaf area index (LAI) of the species was estimated by taking ten sample leaves randomly from respective plots for each tree, shrub, and herb with the help of a leaf area analyzer.
Estimation of Carbon Sequestration Potential
The Muffle furnace combustion methods were used for the determination of carbon concentration in the various components of TV, SV, and HV by adopting the methods of Negi et al. (2003) as follows:
Where;
Where;
Estimation of Biomass
TV and SV biomass, Tybi (Mg ha−1) in different vegetation types was estimated by using the allometric regression model established by Singh and Mishra (1979). Therefore, available biomass allometric equations (Supplementary Tables S1, S2) for dry tropical forests were used to estimate biomass precisely, only those regression equations were taken into consideration which were developed with similar climatic (temperature and rainfall) and edaphic conditions (soil type). The biomass was estimated by the non-harvest method by measuring dbh and height and applying biomass allometric equations. While using equations, dbh and height were used as independent variables while component biomass was used as a dependent variable. The different components of TV, SV, HV (i.e., stem, branch, foliage, and root) biomass, and fine roots were summed up to calculate total standing biomass (Mg ha−1) in each sample plot for different vegetation types and the component-wise biomass was computed and extrapolated. The soil core method was used for the estimation of fine root biomass. The fine roots (<5 mm diameter) were sampled from four monoliths (15 cm × 15 cm x 15 cm) randomly drawn from each forest type at two different depths, i.e., 0–50 and 50–100 cm, during rainy, winter and summer seasons. In total 120 (2 soil depths x 20 samples x 3 seasons) soil cores were drawn for each forest type. The total fine root biomass was obtained by taking the mean fine root biomass of rainy, winter, and summer seasons. All these biomass values were extrapolated on a Mg ha−1 basis. The mean of the biomass of twenty sample plots represents the standing biomass of a particular forest type. To obtain the total existing biomass of different vegetation types, the mean biomass values were multiplied with their respective areas of vegetation types derived from satellite data.
Estimation of Litterfall
The litterfall of dry tropical forests of AABR was measured in different seasons (i.e., rainy, winter, summer) by randomly laying five litter traps (each size of 50 cm × 50 cm x 50 cm) on the forest floor in every identified sample plot. Overall, litterfall was recorded in 50 sample plots (5 traps x 10 quadrats) and collected in each season i.e. rainy, winter and summer from the different vegetation types. The collected litterfall sealed in the polyethylene bags was brought to the laboratory, where the samples were separated into leaf, wood, fruits, flower, and bark components followed by oven-dried at 80°C for 24 h and weighted to determine oven-dry weights. The weights of dried components were added to derive the total litterfall of respective sample plots of a vegetation type. Furthermore, data of all three seasons were added to obtain the total annual litterfall (Mg ha−1), and the mean of the litterfall of ten sample plots represented the litterfall of that vegetation type.
Estimation of Net Primary Productivity
To estimate the annual net primary productivity on a hectare basis, ΔBi (Mg ha−1 yr−1), the dbh of TV and SV were repeatedly measured for three successive years i.e., 2016, 2017, and 2018 in marked sample plots of different vegetation types. The biomass increment of TV and SV were estimated from the dbh values of respective periods using a regression equation. The biomass of herbs was estimated in respective years by harvest procedure using vegetation collection and measurement methods. The average biomass production of individual components (TV, SV) of the sample plots of each vegetation type were calculated using the expression = {(B3 – B2) + (B2 – B1)/2}. The total net production of a given sample plot of vegetation type was measured by adding the respective production of trees, shrubs, herbaceous layers, fine root (peak), and total litterfall of that vegetation type. In order to obtain the total NPP of different vegetation types, the mean NPP values were multiplied with their respective areas of vegetation types, which were derived from satellite data.
Expression used for computing NPP as follows:
Where;
TNPP = Total net productivity,
Correlations Among Vegetation Indices, Shannon Index, Leaf Area Index, Carbon Sequestration Potential, Biomass, Litterfall, and NPP
The correlation relationship was carried out between spectral vegetation indices (NDVI, RVI, AVI, EVI, VDVI, and NDMI) with Shannon index, carbon storage, leaf area index (LAI), biomass, and NPP of all the vegetation types of AABR. The sample points used for the ground survey were overlaid on vegetation indice images to extract spectral vegetation indices data, which was performed in ARC-GIS (Version 10.3). Correlations were drawn between the spectral vegetation indices derived from satellite data and ground measurements. The results acquired from the two parameters were used to determine the strength of the relationship. The correlation between vegetation indices and species diversity was tested at p < 0.01.
Aspect and Slope Maps
Aspect and slope maps were generated by analyzing topographic data in a GIS environment. The map shows eight aspect classes and was merged to form only four major aspect classes (north (N), south (S), east (E), and west (W)). Among different aspects, northern and eastern aspects occupied a large area compared to southern and western aspects. The altitudinal range of the study area varied from 505.43 to 719.65 m in different forests and nine slope classes were delineated between 0–20% slope, which was merged to form a gentle slope class, from 21–40% slopes into a medium slope and slope categories >40% were merged to form steep slope class. The largest area was covered by gentle slope class, while only a relatively small area was occupied by steep slope class. Furthermore, slope, aspect, drainage, and Digital Elevation Model (DEM) were also generated using TIN data (Figure 2).
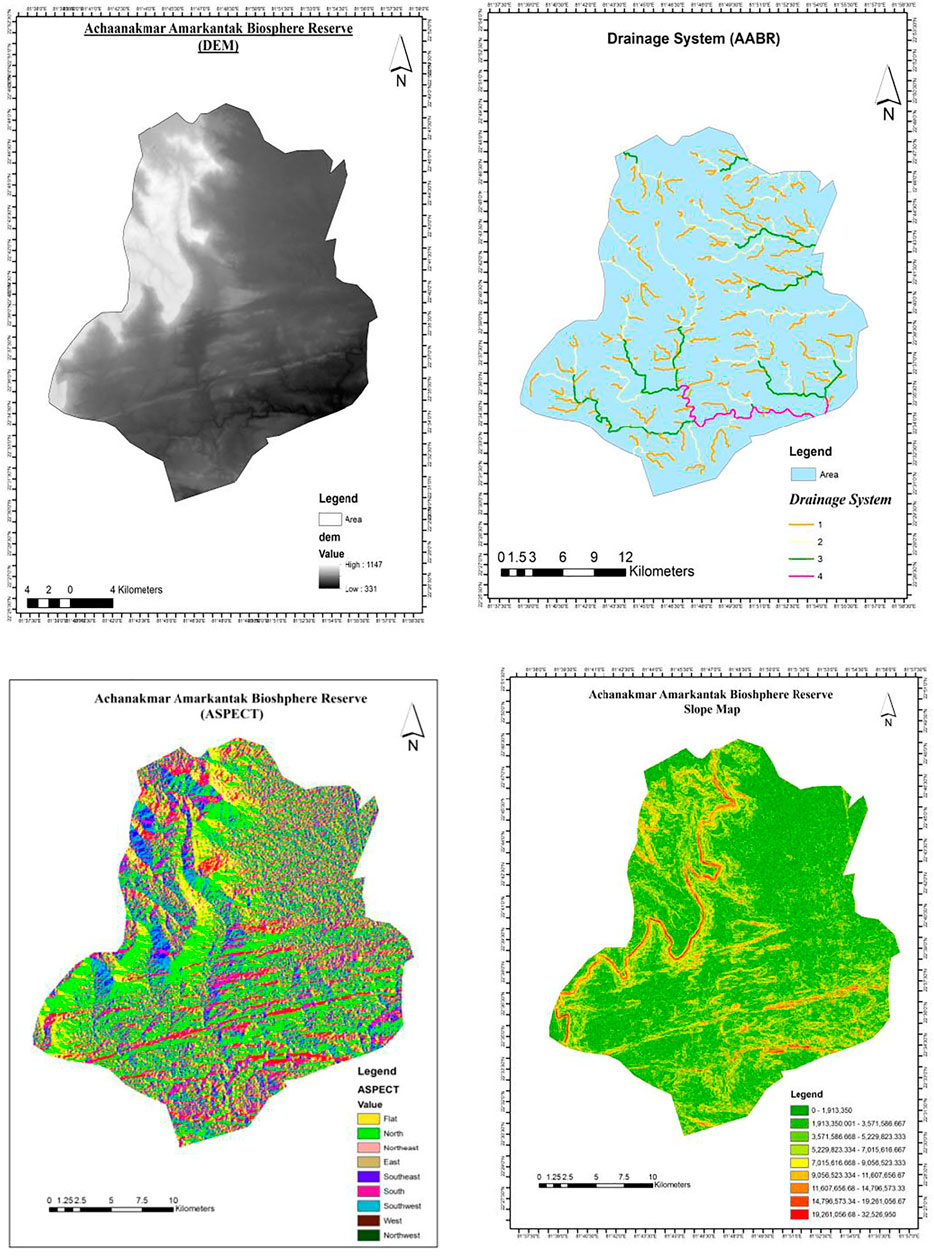
FIGURE 2. Satellite map (A) Digital elevation model (DEM); (B) Drainage pattern; (C) Aspect map of the study area; (D) Slope map of AABR.
Statistical Analysis
Data on structure, composition, diversity, biomass, and carbon sequestration potential were analyzed using one-way analysis of variance. To understand the relationship between stand diversity and the functional parameters in the TDF ecosystem, correlation analysis was performed among diversity indices and functional attributes viz., carbon storage, and net productivity. Correlations were also drawn between spectral vegetation indices (viz. NDVI, AVI, RVI, EVI, VDVI, and NDMI) derived from satellite data and ground measured structural and functional variables. Attempts were also made to develop empirical models for directly estimating the diversity, carbon storage, and biomass production of TDF of AABR from satellite imagery. Towards this, a simple regression analysis was executed and multivariate analysis of the data by using MINITAB version 15.0 software.
Results and Discussion
Structure, Composition, and Diversity
The composition of the flora of dry tropical forest ecosystems of AABR is very diverse. A variety of flora in these forests distributes species in three distinct canopy layers. Thirty-four species were found in TV, thirty species in SV, and sixty-four species were found in HV (Table 2; Supplementary Tables S3, S4, S5). The secondary associated tree species were Terminalia tomentosa and Buchanania lanzan respectively contributing high density, frequency, relative basal area, and IVI in the SMF and TP. The dominant representative of tree species like Shorea robusta, Diospyros melanoxylon, and Terminalia arjuna was observed as predominant in DMF and OMF.
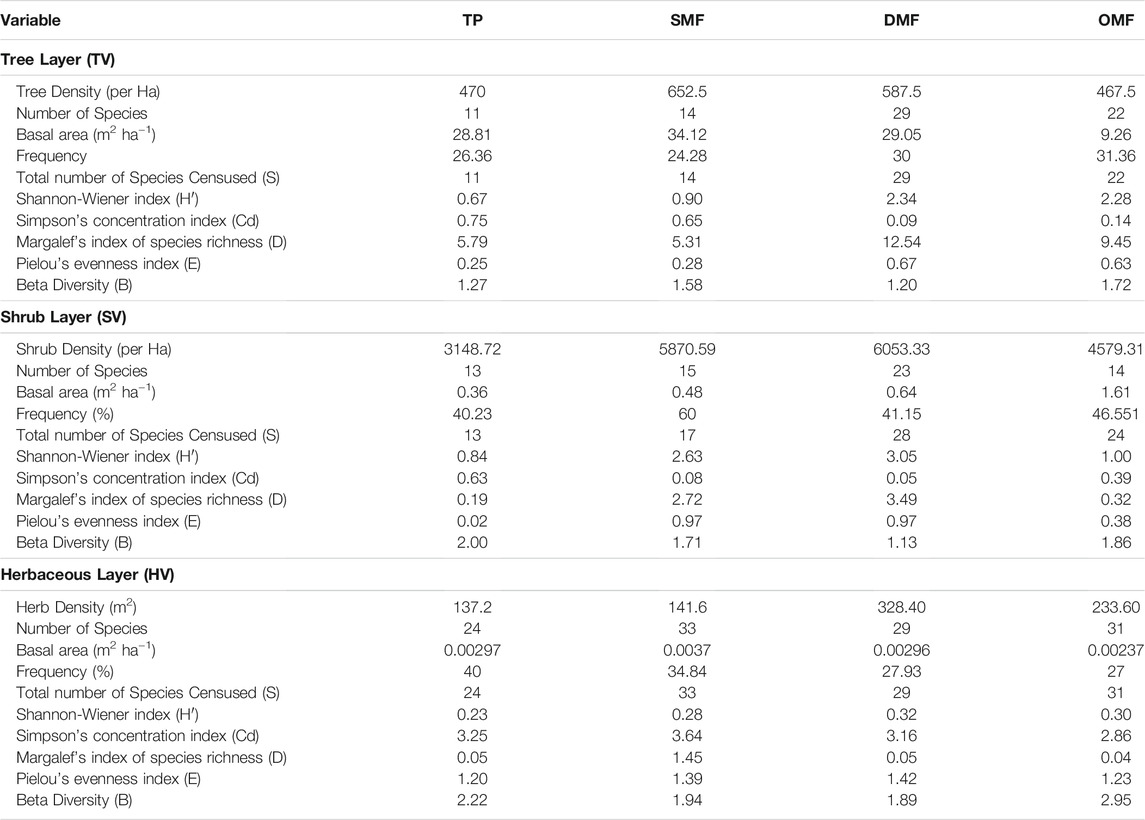
TABLE 2. Species diversity indices in dry tropical forest of AABR.
The results of density, BA distribution, and species richness of different forest types are illustrated in Figures 3A–C. The structural analysis shows that the density of various forests varied from 467.5 to 652.5 stems ha−1 and a maximum in SMF followed by DMF, TP, and a minimum in OMF. BA values lie between 9.26 and 34.12 m2 ha−1 in each vegetation type and SMF exhibited maximum BA followed by DMF and TP while the minimum in OMF. The structural attributes significantly varied among each forest type in the current research. Bijalwan et al. (2010) also reported that the density of TDF ranged from 206 to 812 trees ha−1 and BA from 7.27 to 20.8 m2 ha−1, and the number of tree species in each forest was reported as from 9 to 26. Interestingly, the structural analysis (number of tree species, density, and BA) of the TDF ecosystem has been attempted by several workers (Murphy and Lugo, 1986; Singh and Singh, 1991; Ravan, 1994; Sunderpandian and Swamy, 2000; Chaturvedi et al., 2011; Chaturvedi and Raghubanshi 2014; Kamruzzaman et al., 2017; Thakur, 2018; Darro et al., 2020). Singh and Singh, (1991) reported density 349 to 627 treeha−1, 9.0–14.79 m2 ha−1 BA, and 9 to 14 species in TDF of Uttar Pradesh, India. Murphy and Lugo (1986) also revealed a BA of 17–40 m2 ha−1 in Puerto Rican subtropical dry forests.
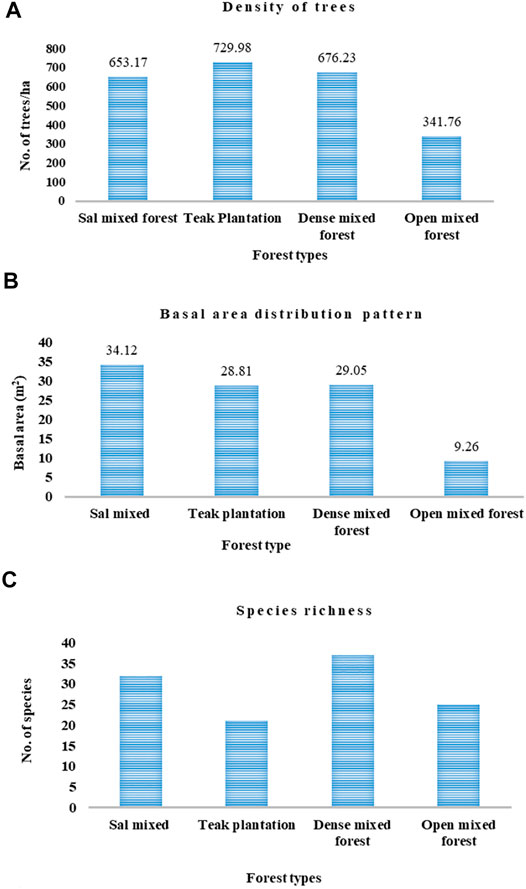
FIGURE 3. Structural parameters of dry tropical forests of AABR. (A) Density of tree layer, (B) Basal area distribution, (C) Species richness.
Various diversity indices viz., species diversity (H′), the concentration of dominance (cd), species richness (d), equitability (e), and beta diversity (bd) were computed for different forest types to analyze the difference in species diversity among each vegetation type. Attempts were also made to compute the different components of the tree, shrub, and herbaceous vegetation. The results for species diversity of different vegetation types are illustrated in Table 2. Species diversity in various vegetation types lies from 0.67 to 2.34 for tree vegetation (TV) with a maximum in DMF and minimum in TP. Similarly, the concentration of dominance values varied from 0.09 to 0.75 in the vegetation of each forest type with a maximum in TP followed by SMF and minimum in DMF. The Margelef index values varied from 5.31 to 12.54 where DMF showed maximum values followed by OMF and SMF. Pielou’s evenness index lies from 0.25 to 0.67 for TV. Beta diversity varied from 1.20 to 1.72 with OMF recorded maximum and DMF minimum. In the SV layer, Shannon-Weiner values varied between 0.84 and 3.05 where DMF recorded higher and TP as lower. Simpson index accounted for maximum values in TP followed by OMF and SMF, while, the Cd values were recorded as a minimum in DMF in shrub layer, where it varied from 0.05 to 0.63. The species richness value was higher in DMF followed by SMF, and OMF. Margalef’s index values were reported in the range of 0.19–3.49 depending on vegetation types, where TP had a minimum value. Equitability accounted for 0.02 to 0.97 in all the vegetation types with the highest equitability in DMF and SMF, and minimum TP under the SV category. TP showed a maximum beta diversity index and the minimum was observed for DMF in SV, which varied from 1.13 to 2.0 in all the forest types in the AABR. For the herbaceous layer (HV), the Shannon-Weiner values were found maximum in DMF followed by OMF and SMF, while it was observed minimum for TP which is ranged from 0.23 to 0.32. On the contrary, Cd was recorded maximum in SMF and OMF, which ranged from 2.86 to 3.25 in different forest types. The species richness was recorded maximum in SMF followed by DMF and OMF and varied from 0.04 to 1.45. Similarly, equitability values in HV ranged from 1.20 to 1.42 in different forest types. DMF and SMF showed maximum values, while TP and OMF with minimum values. The beta diversity ranged from 1.89 to 2.95 with the maximum in OMF exhibited minimum in DMF. The species diversity values in various tropical forests are comparable with the present study as reported by various researchers (Ramprasad and Pandey 1992; Pandey, 2005; Thakur et al., 2019). Singh and Singh (1991) also revealed that the species diversity values range lies between 1.9 and 2.8, Simpson index values from 0.18 to 0.75, Margalef index values range between 0.21 and 0.93 in the U.P state of India. Ramprasad and Pandey (1992) analyzed the sal and teak forests of Madhya Pradesh state in India where Shannon diversity index ranged from 0.32 to 3.76 and Simpson index values from 0.07 to 0.63. However, many plant species are lost due to anthropogenic stress in this region (Thakur et al., 2021). Other workers (Ravan, 1994; Bijalwan et al., 2010; Thakur 2018) have also conducted studies on tropical forest ecosystems and reported similar observations. Swamy (1998), mentioned high precipitation (>2,500 mm), the number of rainy days, and better soil conditions, which resulted in rich diversity and complexity in tropical evergreen forests.
The NDVI values were positively performed with density, basal area, and species diversity (Table 3). The study indicated a positive correlation among the structural attributes and diversity with NDVI and other vegetation indices (Figure 4 and Figure 5). Several researchers demonstrated similar research in TDF ecosystems (Franklin, 1986, Cohen and Spies, 1992 Spanner et al., 1990, Pandey, 2005, Jones et al., 2019, Wallis et al., 2019; Wang et al., 2019).
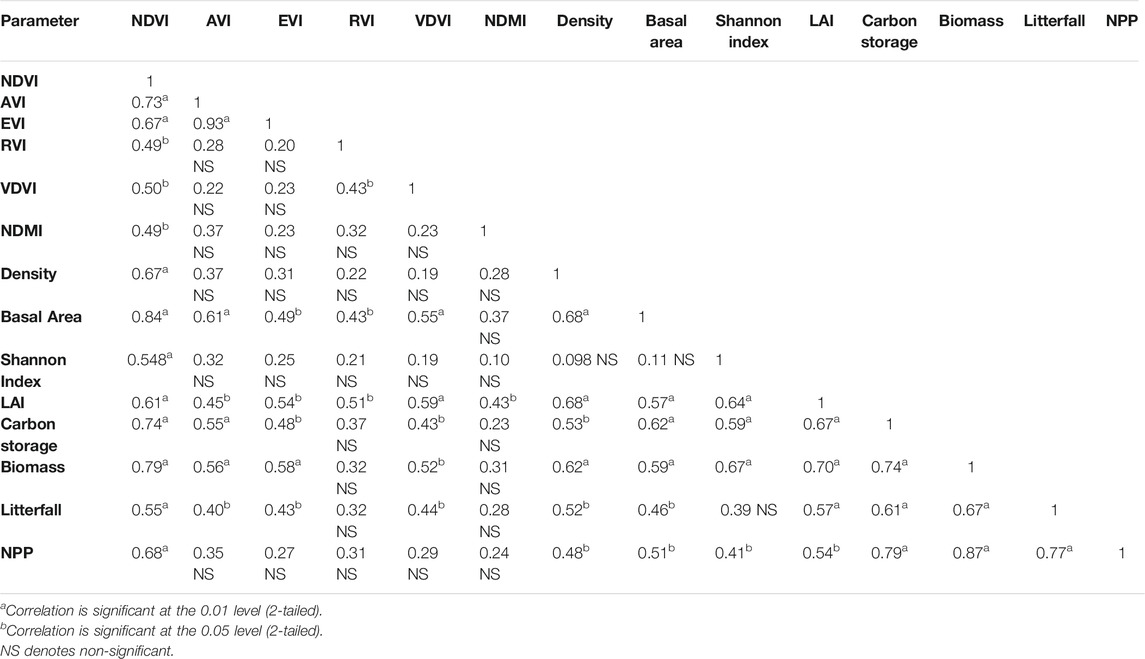
TABLE 3. Pearson correlations among important spectral vegetation indices and structural attributes.
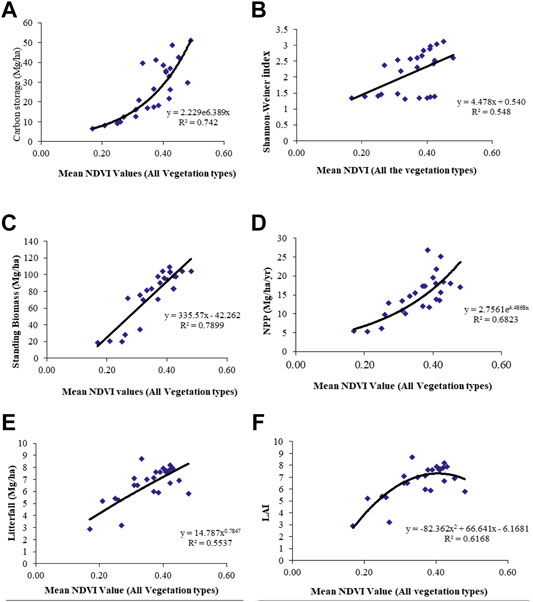
FIGURE 4. (A) Exponential relationship among NDVI and Carbon storage; (B) Relationship between NDVI and Shannon- Weiner Index; (C) Relationship between NDVI and Biomass of dry tropical forests; (D) Exponential relationship between NDVI and Net primary productivity; (E) Relationship between NDVI and Litterfall; (F) Exponential relationship between NDVI and Leaf Area Index of dry tropical forests of AABR.
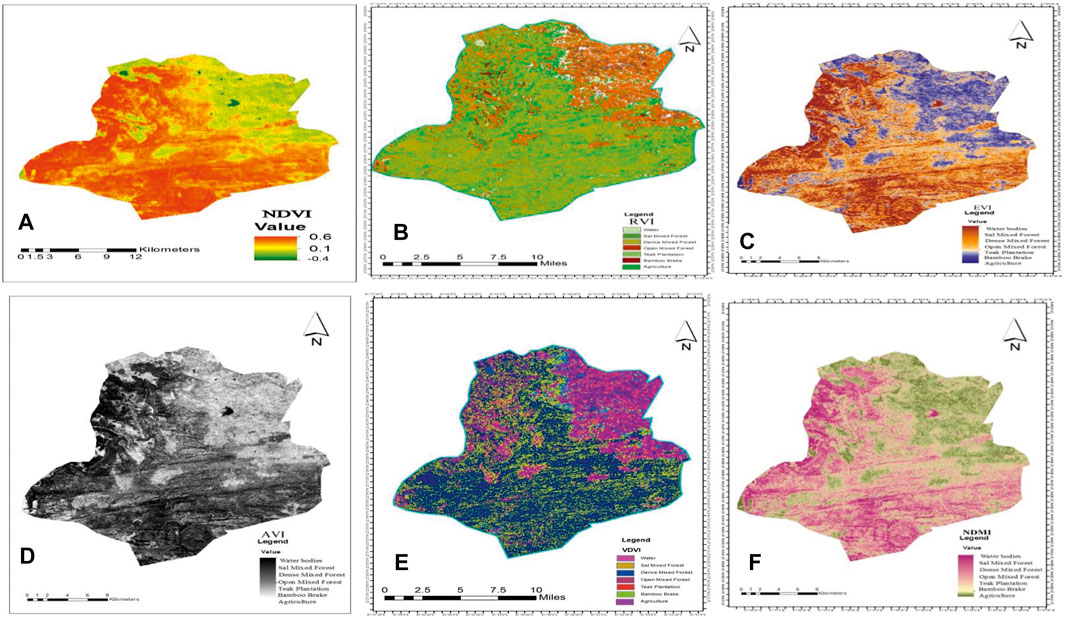
FIGURE 5. Spectral vegetation indices (A) Normalized difference vegetation index (NDVI); (B) Ratio vegetation index (RVI); (C) Enhance vegetation index (EVI); (D) Advance vegetation index (AVI); (E) Very dense vegetation index (VDVI); (F) Normalized difference moisture index (NDMI).
The slope and aspect in the current study showed a marked effect on structure, diversity, volume, and biomass of TDF of Central India (Table 1 and Figure 2). Integration of slope and aspect along with forest types helped in improving the stratification and accounted for the physiographic variation in structure, diversity, volume, and biomass in a given forest type. Cook et al. (1989) reveal the importance of satellite data in the estimation of forest structure the NPP of North American forests. Ravan (1994) also demonstrated the topographical parameters, density, and TDF information in the GIS environment and derived homogenous vegetation strata, which were used for estimating the structural parameters of TDF ecosystems.
Total Carbon Sequestration Potential in Vegetation
Total carbon storage in the tree layer (TV) varied from16.02–47.15 Mg ha−1 where; DMF was recorded with the maximum amount of the C, while OMF had minimum. Total C storage was statistically alike in SMF and OMF. The DMF had 1.22, 1.54, 1.50, and 7.69 times higher C content than TP, SMF, and OMF, respectively. Total C storage ranges in stem wood accounted 52.93–78.30%, branches 9.49–22.99%, foliage 3.31–12.89%, coarse root 1.80–11.22% and fine roots 1.72–3.24% in different forest types. Similarly, in shrub vegetation (SV) the C ranged from 1.88 to 5.18 Mg ha−1 with a maximum in OMF followed by SMF, TP, and minimum in DMF. OMF had 1.67, 1.07, and 1.67 times higher C content than TP, SMF, and DMF, respectively. Further, C in total stem wood ranged between 56.27 and 67.79%, foliage 2.73–3.31%, and coarse root 29.45–41.12% in different forest types whereas in herb layer (HV) it ranged between 0.91–2.73 Mg ha−1, with OMF registering highest C as compared to SMF, TP, and lowest in DMF.
In our study, total C storage accounted for 65.22–75.71% for shoots and 25.64–34.78% for roots in different forest types, while total carbon storage of forest vegetation (TV + SV + HV) i.e. standing biomass ranged between 18.0 – 50.40 Mg ha−1 in different forests. The maximum C storage is reported in DMF while the minimum was in OMF (Table 4; Figure 6). Similar results were also revealed by various researchers (Chaturvedi et al., 2011; Chaturvedi and Raghubanshi, 2015; Bahera et al., 2017; Thakur et al., 2014, Thakur et al., 2019). In the study of Srinivas and Sundarapandian (2019) the C content of trees varied from 44.51 to 218.84 Mg ha−1.
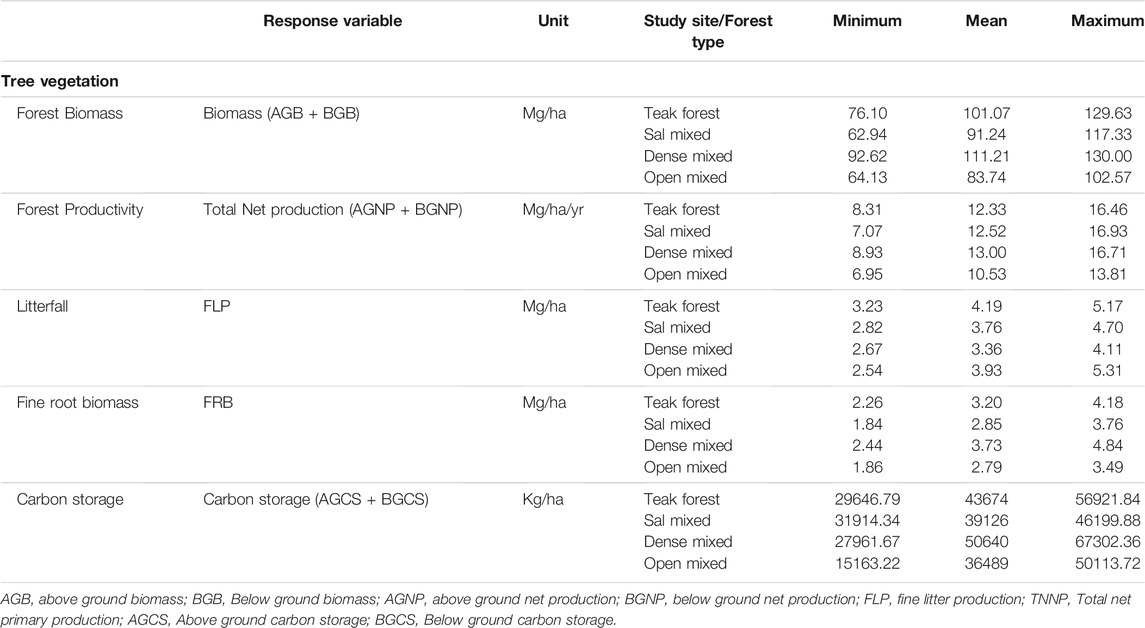
TABLE 4. Consolidated statistics of forest biomass, productivity variables, and carbon storage.
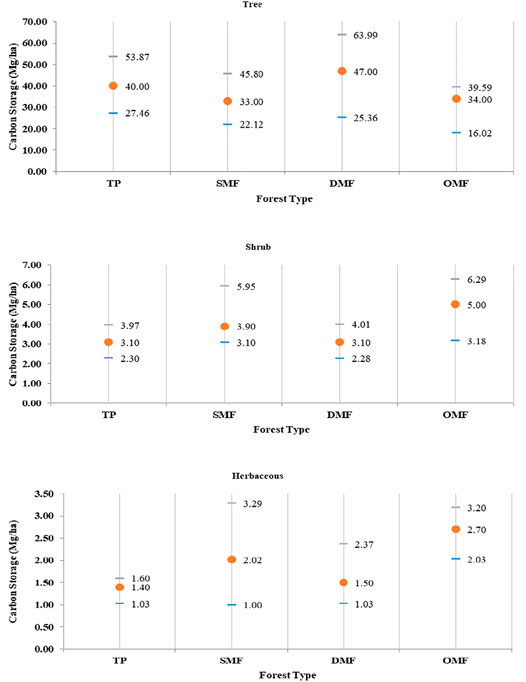
FIGURE 6. Estimates of Carbon storage in tree/shrub/herb vegetation with 95% C.I. in dry tropical forest of AABR (Mg/ha).
Aboveground and Belowground Biomass
The biomass of different forest types for the components of trees, shrubs, and herbaceous flora results revealed that the total biomass (TV + SV + HV) varied from 83.77 to 111.21 Mg ha−1 (Table 4; Figure 7). It was highest in DMF followed by TP, SMF, and lowest in OMF. Total standing biomass (TV + SV + HV) varied significantly in each forest type. The total mean vegetation mass reported 95.85 Mg ha−1 of the total biomass of which 90.23% contributed for AGB and 9.77% for belowground biomass (BGB). TV, SV, and HV contributed 90.42, 8.74, and 0.71% respectively. These standards were more or less analogous to those assessed in other TDF, as Pandey (2005) reported total biomass ranging from 37.12 to 100.88 Mg ha−1 in TDF of Central India. Thakur et al. (2019) also reported biomass in the range of 20.25–103.43 Mg ha−1 in the TDF of Chhattisgarh. The estimated biomass in the current study was lower than other stated tropical dry deciduous forests worldwide. In their study, Murphy and Lugo (1986) reported 30–273 Mg ha−1 AGB for tropical dry forests, and similarly, the AGB varied from 58.04 to 368.39 Mg ha−1 according to Srinivas and Sundarpandian (2019) while Chave et al. (2008) reported 356–398 Mg ha−1 AGB in the rainforest of Eastern America. Likewise, Jaramillo et al. (2003) estimated 143.1 Mg ha−1 ABG and BGB for dry tropical forests in Mexico. Similar results were revealed by Malhi et al. (2004), Raich et al. (2006), Dube and Mutanga (2015), Kamruzzaman et al. (2017), and Wallis et al. (2019). Comparatively erratic rainfall patterns, a lower number of rainy days in a year, harsh hot weather conditions, and poor topsoil conditions might be reasons for lower biomass in the study area. Forest dwellers in these areas are consistently dependent on these forests for their subsistence livelihood, such as via the collection of NTFP’S, fuelwood, etc. Anthropogenic disturbances are moderate to severe in these forests e.g., forest surface fire, unlawful felling, and feeding of livestock are foremost to the squalor of these forests. Fine root biomass was estimated in different depths (0–20 cm, 20–40 cm) in three seasons under four forest types (Figure 8). The results show annual root biomass was more in DMF than others. Similarly comparing the season, the rainy season produced more fine root biomass in all types of forests. The root biomass is an indicator of the growth and productivity of the forests. Ecologically it has a long-term effect, not on the improvement of the rhizosphere but also on the health of total forest biota.
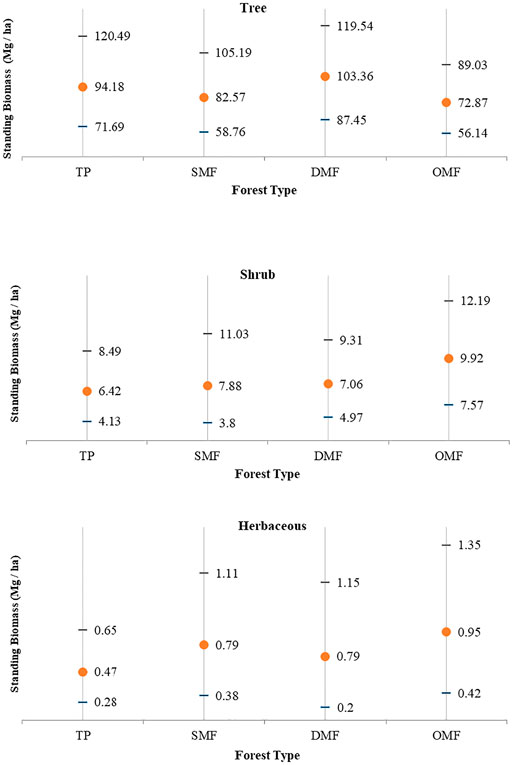
FIGURE 7. Estimates of standing biomass with 95% C.I. of different components of tree, shrub and herb layers in tropical forests of AABR (Mg/ha).
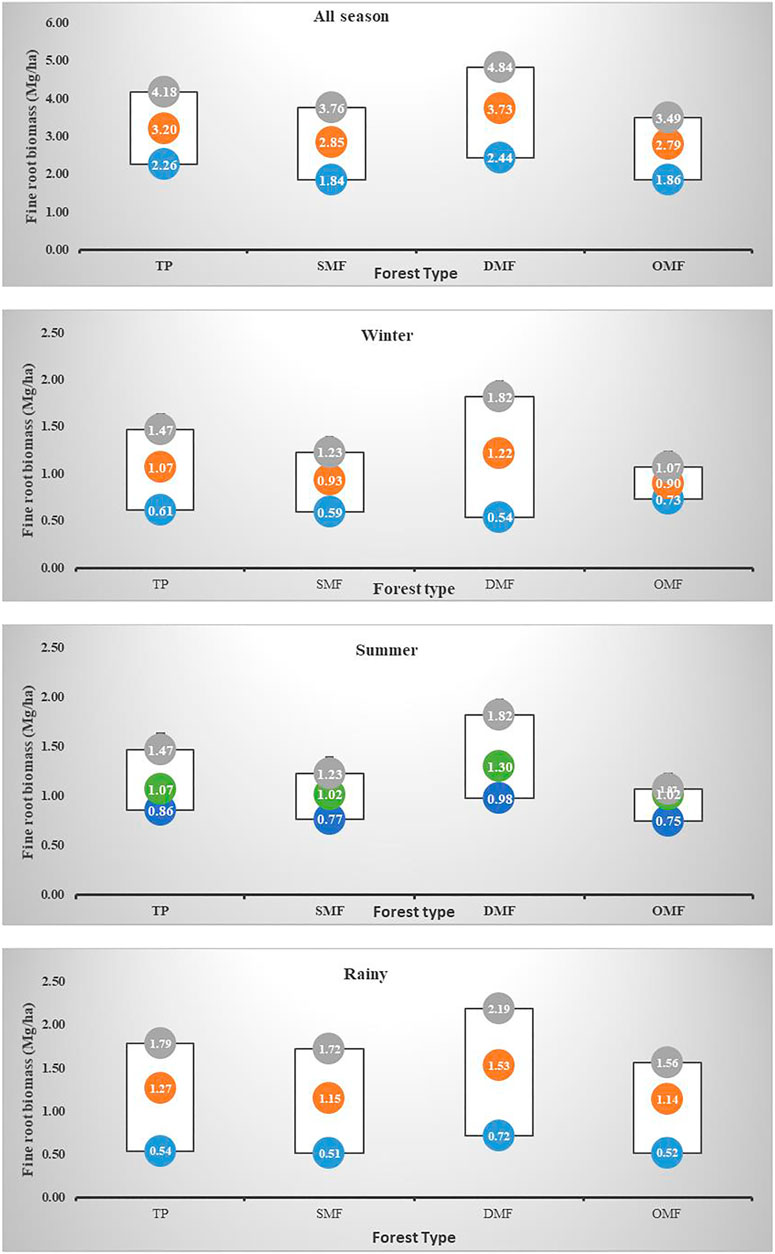
FIGURE 8. Estimates of season wise fine root biomass (Mg/ha) for TP, SMF, DMF and OMF forest types during 2016–2018 with 95% C.I.
Litterfall
The total mean annual litterfall fluxes 1.99–4.15 Mg ha−1 in various forests (Table 4; Figure 9). There was a significant difference in the quantity of litterfall due to seasons and components (wood, leaf, twig). The wood litterfall accounted for between 15.83–18.06% of the total litterfall of different forests. The leaf litterfall values varied from 1.52 to 3.05 Mg ha−1 in different forests. The highest litterfall values were recorded in TP followed by DMF, SMF, and the lowest in OMF. The percentage contribution of leaf fall to the total litterfall was 72.15–76.38% in different forest types. Similarly, the twig litterfall values varied from 0.16 to 0.38 Mg ha−1 which accounted for between 7.79–9.83% of the total litterfall of different forests. The total litterfall distributed in two annual cycles contributed between 39–42.61%, 28.48–29.12%, and 27.21–32.93% in winter, summer, and rainy seasons, respectively in different forest types. A similar finding was also reported by Thakur and Thakur (2014).
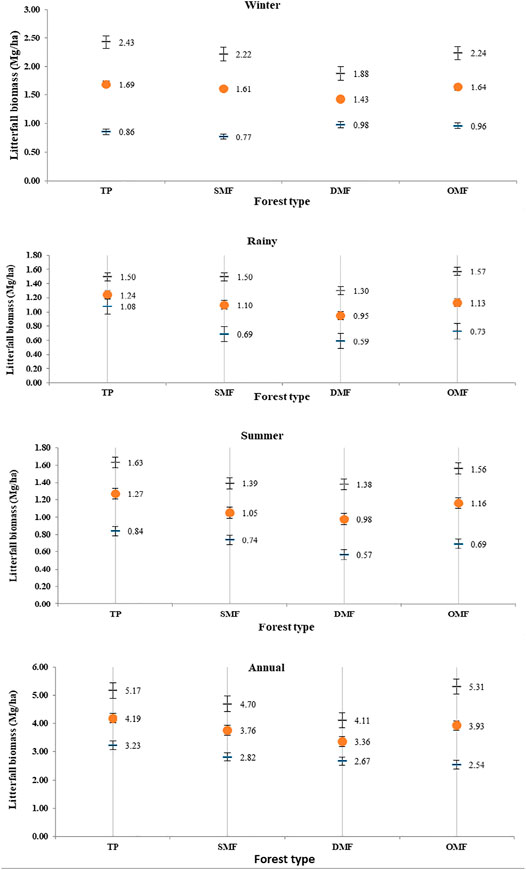
FIGURE 9. Estimate annual litterfall biomass (Mg/ha) with 95% C.I. for TP, SMF, DMF and OMF forest types during 2016–18 for season.
Net Primary Productivity
The total tree biomass production (AGB + BGB) varied from 7.61 to 9.94 Mg ha−1yr−1 (Table 4; Figure 10). The highest tree biomass production was observed in TP followed by DMF, SMF, whereas the lowest was in OMF. The aboveground and belowground net production contributed between 64.09–82.91% and 17.08–35.91%, respectively of the total tree biomass production. The average net production of trees across all the forest types was 8.74 Mg ha−1yr−1, where AGB distributed maximum share as 77.66% and BGB share minimum as 22.34%. The total shrub biomass production (AGB + BGB) varied from 1.88 to 3.77 Mg ha−1yr−1. The highest shrub production was observed in SMF followed by DMF and OMF and it was lowest in TP. The aboveground and belowground net shrub biomass production contributed 56.31–80.08% and 19.91–43.69%, respectively. The average net production of shrubs in different forest types was 2.58 Mg ha−1yr−1fn1 of which 73.45% was contributed by aboveground and 26.54% by belowground biomass. The herbaceous species turnover of less than 1 year was considered equal to net production in these forests. The NPP for herbaceous biomass ranged from 0.51–0.80 Mg ha−1yr−1. The contribution of herbaceous production to the total stand NPP was ranged from 3.0–6.35%.
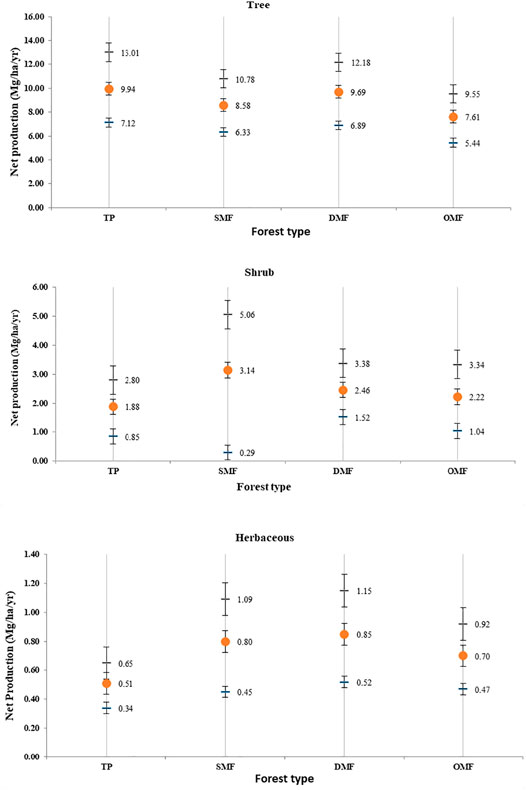
FIGURE 10. Estimates of total production (Mg/ha/yr) with 95% confidence interval of trees, shrubs and herbs for different forest types in tropical forests of AABR.
The total net production (tree, shrub, herb, and litterfall) varied from 10.53 to 13.15 Mg ha−1yr−1 with a mean value of 12.02 Mg ha−1yr−1. It was highest was in SMF followed by TP and DMF while the lowest was in OMF. SMF had 1.06, 1.22, and 2.41 times higher net production than DMF, TP, and OMF. For all the forest type trees, shrub, herb, and litter accounted for 56.43–72.0%, 11.94–23.67%, 2.59–5.82%, and 12.93–14.58%, respectively. The species diversity (H), LAI, litterfall, carbon sequestration, biomass, and NPP generated from the satellite in tropical dry forests are illustrated in Figure 11. All these maps reflect that the coherence will field verified data.The illustrated maps for different layers of parameters are easy to understand at the landscape level and assist forest managers to design proper management plans. These types of satellite-generated maps are more in use globally for better forest ecosystem management.
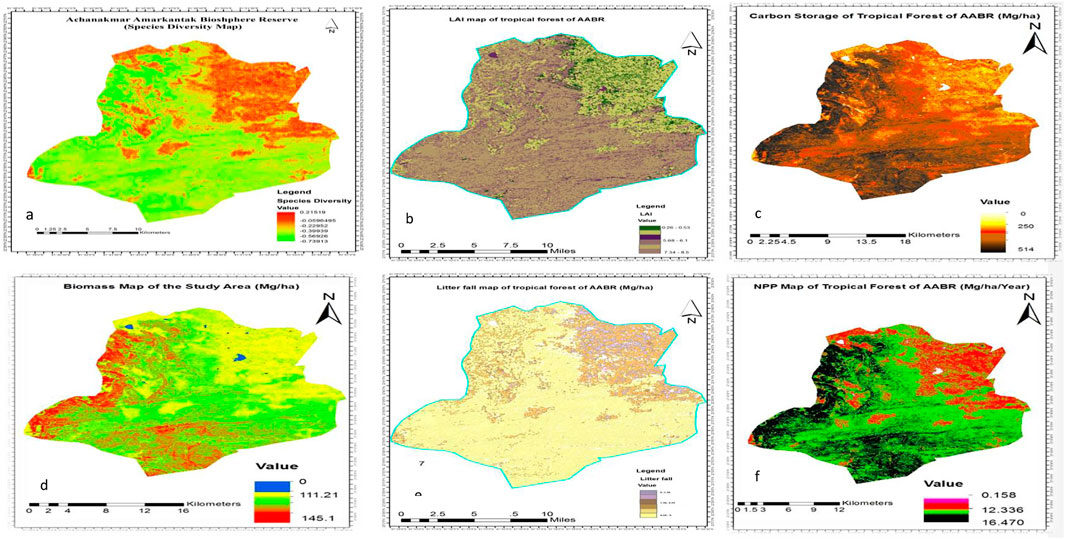
FIGURE 11. (A) Species diversity map of AABR; (B) Leaf area index map of study site; (C) Carbon storage map (Mg/ha); (D) Biomass map (Mg/ha), (E) Litterfall production map (Mg/ha); (F) Net primary productivity map (Mg/ha/yr).
Correlation Between Vegetation Indices, Diversity, Structural Attributes, Leaf Area Index, Carbon Storage, Biomass, and Net Production
Correlation analysis among the structural attributes, vegetation indices, LAI, Carbon sequestration, biomass, and NPP in tropical dry forests are illustrated in Table 3. The correlation relationship among NDVI with pooled data of species diversity, LAI, carbon storage, biomass, litterfall, and NPP is shown in Figure 4. Species diversity values were computed using stratified random sampling and a significant correlation was found between vegetation indices and diversity. It was evident from the result that density, basal area, and diversity were positively correlated with NDVI, whereas it was insignificant with AVI, EVI, NMDI, VDVI, RVI, and density. The present study showed that C storage, biomass, and NPP were positively correlated with NDVI, AVI, EVI, VDVI, NDMI, and RVI indices while NDVI was significantly correlated. The DMF recorded the highest values of NDVI, which is depicted in Figure 5A. The results demonstrated that NDVI from remotely sensed images could identify areas of high species richness, C storage, and biomass production values. In our study, we reported a positive relationship among spectral vegetation index (i.e., NDVI), carbon storage, species diversity, LAI, biomass, litterfall, and NPP (pooled data of TV + SV) for the entire vegetation types of AABR (Figure 5A). The RVI, EVI, AVI, VDVI, and NDMI images are represented in Figures 5B–F, respectively. The present study also indicated a positive and significant correlation between NDVI and Shannon index, C storage, biomass, and NPP for different vegetation types of the study area, which confirms the reports of earlier workers (Swamy, 1998; Thakur et al., 2019) who found NDVI as a key variable strongly correlated to vegetation analysis.
Conclusion
This study concluded that satellite remote sensing techniques are one of the most reliable tools for the assessment of vegetation structure, diversity, carbon storage, biomass, and NPP for the dry tropical forest ecosystems of AABR of India. Biomass and productivity studies contribute significantly to the global carbon pool and, being very young forests, AABR has the potential to mitigate a significant amount of carbon from the atmosphere. Forest degradation by anthropogenic activities (e.g., forest cutting, forest fire, overexploitation of flora, encroachment, mining, human settlements) are placing severe pressure on forest ecosystems. Planting of multipurpose trees and shrubs in SMF could be explored for the enrichment of vegetation cover. These strategies will assist in reducing the biotic pressure and also restoring and conserving the fragile dry tropical forest ecosystems of Central India. The study also indicated that the Resourcesat-2A satellite data is likely to improve the retrieval of carbon values, leaf area index, biomass, and the NPP of the dry tropical forests of India due to their moderate spectral and spatial resolution as compared to IRS and Landsat satellite images. The empirical relationships drawn between structural aspects and spectral responses are important for predicting few important structural attributes of vegetation directly from multispectral satellite data. Therefore, there is a need to have an extensive forest management plan for AABR in India for optimum forest health.
Data Availability Statement
The original contributions presented in the study are included in the article/Supplementary Material, further inquiries can be directed to the corresponding author.
Author Contributions
TT, DP, AT, and ANK contributed to the conceptualization, data collection, and preparation of the first draft. TT, JB, DP, AK (7th author), ANK provided section contributions. AK (10th author), AB, MD, ANK, AK (7th author), and MK undertook editing and provided extra input to improve the quality. All the authors undertook editing and participated in proofreading the article.
Conflict of Interest
The authors declare that the research was conducted in the absence of any commercial or financial relationships that could be construed as a potential conflict of interest.
Publisher’s Note
All claims expressed in this article are solely those of the authors and do not necessarily represent those of their affiliated organizations, or those of the publisher, the editors, and the reviewers. Any product that may be evaluated in this article, or claim that may be made by its manufacturer, is not guaranteed or endorsed by the publisher.
Acknowledgments
The authors are thankful to the authorities of Indira Gandhi National Tribal University, Amarkantak, MP, India for their support and encouragement in carrying out research work. All authors are highly thankful to the reviewers for their constructive comments to improve the article. The permission granted by the state forest department to conduct the study in AABR protected area and their support during the filed investigation is duly acknowledged. We acknowledge the financial support provided by the Ministry of Environment, Forests and Climate Change (MoEF&CC), Government of India, New Delhi (Sanction No. F.13/4/2013- NNRMS/RE)
Supplementary Material
The Supplementary Material for this article can be found online at: https://www.frontiersin.org/articles/10.3389/fenvs.2021.757976/full#supplementary-material
References
Ali, A. M., Darvishzadeh, R., Skidmore, A. K., and van Duren, I. (2017). Specific Leaf Area Estimation from Leaf and Canopy Reflectance through Optimization and Validation of Vegetation Indices. Agric. For. Meteorol. 236, 162–174. doi:10.1016/j.agrformet.2017.01.015
Anderson-Teixeira, K. J., Wang, M. M. H., McGarvey, J. C., and LeBauer, D. S. (2016). Carbon Dynamics of Mature and Regrowth Tropical Forests Derived from a Pantropical Database (TropForC-Db). Glob. Chang. Biol. 22, 1690–1709. doi:10.1111/gcb.13226
Beer, C., Reichstein, M., Tomelleri, E., Ciais, P., Jung, M., Carvalhais, N., et al. (2010). Terrestrial Gross Carbon Dioxide Uptake: Global Distribution and Covariation with Climate. Science 329, 834–838. doi:10.1126/science.1184984
Bijalwan, A., Swamy, S. L., Sharma, C. M., Sharma, N. K., and Tiwari, A. K. (2010). Land Use, Biomass and Carbon Estimation of Chhattisgarh Region in India Using Satellite Remote Sensing and GIS Techniques. J. For. Res. 21 (2), 161–170. doi:10.1007/s11676-010-0026-y
Chaturvedi, R. K., Raghubanshi, A. S., and Singh, J. S. (2011). Effect of Small-Scale Variations in Environmental Factors on the Distribution of Woody Species in Tropical Deciduous Forests of Vindhyan Highlands, India. J. Bot. 297097. doi:10.1155/2011/297097
Chaturvedi, R. K., Tripathi, A., Raghubanshi, A. S., and Singh, A. S. (2021). Functional Traits Indicate a Continuum of Tree Drought Strategies across a Soil Water Availability Gradient in a Tropical Dry forest. For. Ecol. Manag. 118740. doi:10.1016/j.foreco.2020.118740
Chaturvedi, R. K., and Raghubanshi, A. S. (2015). Assessment of Carbon Density and Accumulation in Mono- and Multi-specific Stands in Teak and Sal Forests of a Tropical Dry Region in India. For. Ecol. Manag. 339, 11–21. doi:10.1016/j.foreco.2014.12.002
Chaturvedi, R. K., Raghubanshi, A. S., and Singh, J. S. (2011). Carbon Density and Accumulation in Woody Species of Tropical Dry forest in India. For. Ecol. Manage. 262, 1576–1588. doi:10.1016/j.foreco.2011.07.006
Chaturvedi, R. K., and Raghubanshi, A. S. (2014). Species Composition, Distribution, and Diversity of Woody Species in a Tropical Dry forest of India. J. Sustain. For. 33 (8), 729–756. doi:10.1080/10549811.2014.925402
Chave, J., Olivier, J., Bongers, F., Chatelet, P., Forget, P. M., van der Meer, P., et al. (2008). Above-ground Biomass and Productivity in a Rain forest of Eastern South America. J. Trop. Ecol. 24, 355–366. doi:10.1017/S0266467408005075
Chave, J., Riera, B., and Dubois, M. A. (2001). Estimation of Biomass in a Neotropical forest of French Guiana: Spatial and Temporal Variability. J. Trop. Ecol. 17, 79–96. doi:10.1017/S0266467401001055
Chazdon, R. L., Broadbent, E. N., Rozendaal, D. M. A., Bongers, F., Zambrano, A. M. A., Aide, T. M., et al. (2016). Carbon Sequestration Potential of Second-Growth forest Regenerationin the Latin American Tropics. Sci. Adv. 2 (5), 1–10. doi:10.1126/sciadv.1501639e1501639
Clark, D. A., Brown, S., Kicklighter, D. W., Chambers, J. Q., Thomlinson, J. R., and Ni, J. (2001). Measuring Net Primary Production in Forests: Concepts and Field Methods. Ecol. Appl. 11, 356–370. doi:10.1890/1051-0761(2001)011[0356:MNPPIF]2.0.CO;2
Curtis, J. T., and Mc Intosh, R. P. (1950). And the Interrelationship of Certain Analytic Synthetic Phytosociological Characters. Ecology 31, 434–455. doi:10.2307/1931497
Darro, H., Swamy, S. L., Thakur, T. K., and Mishra, A. (2020). Floristic Composition, Structure, Diversity and Conservation Strategies for Rehabilitation of Dry Tropical Forests in Buffer Zone of Achanakmaar Amarkantak Biosphere Reserve (AABR), India. Int. J. Curr. Microbiol. App. Sci. 9 (4), 650–663. doi:10.20546/ijcmas.2020.904.079
Fearnside, P. M. (1996). Amazonian Deforestation and Global Warming: Carbon Stocksin Vegetation Replacing Brazil’s Amazon forest. For. Ecol. Manag. 80, 21–34. doi:10.1016/0378-1127(95)03647-4
FSI (2015). State of Forest Report 2015. Dehradun India –: Forest Survey of India (Ministry of Forests and Environment) Govt. of India Press.
FSI (2019). State of Forest Report 2019. Dehradun India: Forest Survey of India (Ministry of Forests and Environment) Govt. of India Press.
Gaston, G., Brown, S., Lorenzini, M., and Singh, K. D. (1998). State and Change in Carbon Pools in the Forests of Tropical Africa. Glob. Change Biol 4, 97–114.
Grace, J., Mitchard, E., and Gloor, E. (2014). Perturbations in the Carbon Budget of the Tropics. Glob. Chang. Biol. 20 (10), 3238–3255. doi:10.1111/gcb.12600
Houghton, R. A., Byers, B., and Nassikas, A. A. (2015). A Role for Tropical Forests in Stabilizing Atmospheric CO2. Nat. Clim. Chang. 5 (12), 1022–1023. doi:10.1038/nclimate2869
Jaramillo, V. J., Kaufmann, J. B., Rentarı´a-Rodrı´guez, L., Cummings, D. L., and Ellingson, L. J. (2003). Biomass, Carbon and Nitrogen Pools in Mexican Tropical forest Landscapes. Ecosystems 6, 609–629. doi:10.1017/S0266467408005075
Jhariya, M. K., Banerjee, A., Meena, R. S., and Yadav, D. K. (2019). Sustainable Agriculture, Forest and Environmental Management. Berlin, Germany:Springer. doi:10.1007/978-981-13-6830-1
Jhariya, M. K., and Singh, L. (2021). Herbaceous Diversity and Biomass under Different Fire Regimes in a Seasonally Dry forest Ecosystem. Environ. Dev. Sustain. 23 (5), 6800–6818. doi:10.1007/s10668-020-00892-x
Jhariya, M. K. (2017). Vegetation Ecology and Carbon Sequestration Potential of Shrubs in Tropics of Chhattisgarh, India. Environ. Monit. Assess. 189 (10), 518. doi:10.1007/s10661-017-6246-2
Jones, I. L., DeWalt, S. J., Lopez, O. R., Bunnefeld, L., Pattion, Z., and Dent, D. H. (2019). Above- and Belowground Carbon Stocks Are Decoupled in Secondary Tropical Forests and Are Positively Related to forest Age and Soil Nutrients Respectively. Sci. Total Environ. 697, 133987. doi:10.1016/j.scitotenv.2019.133987
Kumar, A., and Kumar, M. (2020). Estimation of Carbon Stock in the Hydroelectric Catchment of India and its Implementation to Climate Change. J. Sustain. For. 39 (6). doi:10.1080/10549811.2020.1794907
Kumar, A., Kumar, M., and Pandey, R. (2021a). Forest Soil Nutrient Stocks along Altitudinal Range of Uttarakhand Himalayas: An Aid to Nature Based Climate Solutions. CATENA 207, 105667. doi:10.1016/j.catena.2021.105667
Kumar, A., Pinto, M. C., Candeias, C., and Dinis, P. A. (2021b). Baseline Maps of Potentially Toxic Elements in the Soils of Garhwal Himalayas, India: Assessment of Their Eco-Environmental and Human Health Risks. Land Degrad. Develop. 32 (14), 3856–3869. doi:10.1002/ldr.3984
Kumar, Y., Thakur, T., Sahu, M. L., and Thakur, A. (2017). A Multifunctional Wonder Tree: Moringa oleiferaLam Open New Dimensions in Field of Agroforestry in India. Int. J. Curr. Microbiol. App. Sci. 6 (8), 229–235. doi:10.20546/ijcmas.2016.501.031
Lepine, L. C., Ollinger, S. V., Ouimette, A. P., and Martin, M. E. (2016). Examining Spectral Reflectance Features Related to Foliar Nitrogen in Forests: Implications for Broad-Scale Nitrogen Mapping. Remote Sens. Environ. 173, 174–186. doi:10.1016/j.rse.2015.11.028
Malhi, Y., Arag Ão, L. E. O. C., Metcalfe, D. B., Paiva, R., Quesada, C. A., Almeida, S., et al. (2009). Comprehensive Assessment of Carbon Productivity, Allocation and Storage in Three Amazonian Forests. Glob. Chang. Biol. 15, 1255–1274. doi:10.1111/j.1365-2486.2008.01780.x
Malhi, Y., Baker, T. R., Phillips, O. L., Almeid, S., Alvarej, E., Arroyo, L., et al. (2004). The Above-Ground Corse wood Productivity of 104 Neotropical forest Plots. Glob. Change Biol 10, 563–591. doi:10.1111/j.1529-8817.2003.00778.x
Mandal, G., and Joshi, S. P. (2014). Analysis of Vegetation Dynamics and Phytodiversity From Three Dry Deciduous Forests of Doon Valley, Western Himalaya, India. J. Asia Pac. Biodivers 30 (3), 292–304. doi:10.1016/j.japb.2014.07.006
Middinti, S., Thumaty, K. C., Gopalakrishnan, R., Jha, C. S., and Thatiparthi, B. R. (2017). Estimating the Leaf Area index in Indian Tropical Forests Using Landsat-8 OLI Data. Int. J. Remote Sens. 38, 6769–6789. doi:10.1080/01431161.2017.1363436
Mohommad, S., and Joshi, S. P. (2015). Biomass and Carbon Stock Assessment in Moistdeciduous Forests of Doon valley, Western Himalaya, India. Taiwania 60, 71–76. doi:10.6165/tai.2015.60.71
Moore, S., Adu-Bredu, S., Duah-Gyamfi, A., Addo-Danso, S. D., Ibrahim, F., Mbou, A. T., et al. (2018). Forest Biomass, Productivity and Carbon Cycling along a Rainfall Gradient in West Africa. Glob. Chang. Biol. 24, e496–e510. doi:10.1111/gcb.13907
Negi, J. D. S., Manhas, R. K., and Chauhan, P. S. (2003). Carbon Allocation in Different Components of Some Tree Species of India: a New Approach for Carbon Estimation. Curr. Sci. 85, 1528–1531.
Nelson, B. W., Mesquita, R. C. G., Pereira, J. L. G., De Souza, S. G. A., Batista, G. T., and Couto, L. B. (1999). Allometric Regressions for Improved Estimate of Secondary forest Biomass in central Amazon. For. Ecol. Manag. 117, 149–167. doi:10.1016/S0378-1127(98)00475-7
Pan, Y., Birdsey, R. A., Fang, J., Houghton, R., Kauppi, P. E., Kurz, W. A., et al. (2011). A Large and Persistent Carbon Sink in the World's Forests. Science 333, 988–993. doi:10.1126/science.1201609
Pandey, P. K. (2005). Biomass and Productivity in Some Disturbed Tropical Dry Deciduous Teak Forests of Satpura Plateau, Madhya Pradesh. Trop. Ecol. 46 (2), 229–239.
Poorter, L., Bongers, F., Aide, T. M., Almeyda Zambrano, A. M., Balvanera, P., Becknell, J. M., et al. (2016). Biomass Resilience of Neotropical Secondary Forests. Nature, 1–15. doi:10.1038/nature16512
Popkin, G. (2018). US Government Considers Charging for Popular Earth-Observing Data. Nature 556, 417–418. doi:10.1038/d41586-018-04874-y
Raich, J. W., Russell, A. E., Kitayama, K., Parton, W. J., and Vitousek, P. M. (2006). Temperature Influences Carbon Accumulation in Moist Tropical Forests. Ecology 87, 76–87. doi:10.1890/05-0023
Reich, P. B. (2012). Key Canopy Traits Drive forest Productivity. Proc. R. Soc. B Biol. Sci. 279, 2128–2134. doi:10.1098/rspb.2011.2270
Shiklomanov, A. N., Dietze, M. C., Viskari, T., Townsend, P. A., and Serbin, S. P. (2016). Quantifying the Influences of Spectral Resolution on Uncertainty in Leaf Trait Estimates through a Bayesian Approach to RTM Inversion. Remote Sens. Environ. 183, 226–238. doi:10.1016/j.rse.2016.05.023
Swamy, S. L. (1998). Estimation of Net Primary Productivity (NPP) in an Indian Tropical evergreen forest Using Remote Sensing Data. Hyderabad,India: Ph.D. Thesis, Jawaharlal Nehru Technology University.
Thakur, T. K., Patel, D. K., Dutta, J., Kumar, A., Kaushik, S., Bijalwan, A., et al. (2020). Assessment of Decadal Land Use Dynamics of Upper Catchment Area of Narmada River, the Lifeline of Central India. J. King Saud University-Science. doi:10.1016/j.jksus.2020.101322
Thakur, T. K., Swamy, S. L., and Nain, A. S. (2014). Composition, Structure & Diversity Characterization of Dry Tropical Forest of Chhattisgarh Using Satellite Data. J. For. Res. 25 (4), 819–825.
Thakur, T. K. (2018). Diversity, Composition and Structure of Understorey Vegetation in the Tropical forest of Achanakmaar Biosphere Reserve, India. Environ. Sustainability 1 (2), 279–293.
Thakur, T. K., Padwar, G. K., and Patel, D. K. (2019). Monitoring Land Use, Species Composition and Diversity of Dry Tropical Environ in Achanakmaar Amarkantak Biosphere Reserve, India Using Satellite Data. Biodiversity Int. J. 3 (4), 162–172. doi:10.15406/bij.2019.03.00141
Thakur, T., and Thakur, A. (2014). Litterfall Patterns of a Dry Tropical forest Ecosystem of Central India. Eco. Env. Cons. 20 (3), 1325–1328.
Thakur, U., Bisht, N. S., Kumar, M., and Kumar, A. (2021). Influence of Altitude on Diversity and Distribution Pattern of Trees in Himalayan Temperate Forests of Churdhar Wildlife Sanctuary, India. Water Air Soil Pollut. 232, 205. doi:10.1007/s11270-021-05162-8
Tripathi, S., Bhadouria, R., Srivastava, P., Devi, R. S., Chaturvedi, R., and Raghubanshi, A. S. (2020). Effects of Light Availability on Leaf Attributes and Seedling Growth of Four Tree Species in Tropical Dry forest. Ecol. Process. 9, 2. doi:10.1186/s13717-019-0206-4
Wallis, C. I. B., Homeier, J., Pena, J., Brandl, R., and Farwig, N. (2019). Modeling Tropical Montane forest Biomass, Productivity and Canopy Traits with Multispectral Remote Sensing Data. Remote sensing Environ. 225, 77–92. doi:10.1016/j.rse.2019.02.021
Wang, G., Guan, D., Xiao, L., and Peart, M. R. (2019). Forest Biomass-Carbon Variation Affected by the Climatic and Topographic Factors in Pearl River Delta, South China. J. Environ. Manage. 232, 781–788. doi:10.1016/j.jenvman.2018.11.130
Keywords: diversity index, C storage, litterfall, biomass production, remote sensing
Citation: Thakur TK, Patel DK, Thakur A, Kumar A, Bijalwan A, Bhat JA, Kumar A, Dobriyal MJ, Kumar M and Kumar A (2021) Biomass Production Assessment in a Protected Area of Dry Tropical forest Ecosystem of India: A Field to Satellite Observation Approach. Front. Environ. Sci. 9:757976. doi: 10.3389/fenvs.2021.757976
Received: 13 August 2021; Accepted: 14 September 2021;
Published: 29 October 2021.
Edited by:
Valdir Felipe Novello, University of São Paulo, BrazilReviewed by:
Dr. Manoj Kumar Jhariya, Sant Gahira Guru Vishwavidyalaya, IndiaRavi Kant Chaturvedi, Xishuangbanna Tropical Botanical Garden (CAS), China
Copyright © 2021 Thakur, Patel, Thakur, Kumar, Bijalwan, Bhat, Kumar, Dobriyal, Kumar and Kumar. This is an open-access article distributed under the terms of the Creative Commons Attribution License (CC BY). The use, distribution or reproduction in other forums is permitted, provided the original author(s) and the copyright owner(s) are credited and that the original publication in this journal is cited, in accordance with accepted academic practice. No use, distribution or reproduction is permitted which does not comply with these terms.
*Correspondence: Amit Kumar, amitkdah@nuist.edu.cn