Does market integration promote green technology innovation? Evidence from China
 Tao Lin
 Zhao Chen
- 1School of Economics, Shanghai University of Finance and Economics, Shanghai, China
- 2School of Economics and Trade, Guangdong University of Foreign Studies, Guangzhou, China
Understanding how to improve green technology innovation is critical to addressing environmental pollution and climate change. Using data from the annual reports of Chinese listed manufacturing firms from 2002 to 2018, this paper investigates the impact of market integration on firms’ green technology innovation. The research design relies on the instrumental variable approach. The results show that both commodity market integration and factor market integration can significantly promote green technology innovation. However, heterogeneity exists across regions, ownership systems, and industry types. Exploring the mechanisms, we find that commodity market integration affects firms’ green technology innovation mainly by expanding market size, intensifying market competition, and promoting technology spillovers. Factor market integration influences firm green technology innovation by optimizing resource allocation and reducing government intervention.
Highlights
• We investigate the causal impact of market integration on firms’ green technology innovation using an instrumental variable approach.
• Our results show that both the integration of the commodity market and the factor market in China significantly promote the green technology innovation of firms, but heterogeneity exists.
• This study highlights how to promote green technology innovation from a market integration perspective and deepens the understanding of how market and technology can be used to cope with the increasing environmental pollution and climate change.
1 Introduction
Global environmental shocks (e.g., pollution and extreme weather) are increasing. Environmental pollution, including air and water pollution, has a significant negative effect on public health and economic development (Ebenstein et al., 2017; He et al., 2020). Technological innovation, especially in green technologies, is seen as a fundamental solution to environmental problems (Chen et al., 2022). Green technology innovation is an innovation oriented to improve environmental performance, with more emphasis on the green concept of sustainable development, which leads firms to upgrade their production technology and achieve energy savings and emission reduction (Xu et al., 2019). How to promote green technology innovation to address environmental challenges and climate change has attracted the attention of scholars and policymakers.
Existing studies have analyzed the determinants of green technology innovation from various perspectives (e.g., government subsidies and low-carbon policy) (Wangler, 2013; Zhang et al., 2018; Hong et al., 2021; Fang and Shao, 2022). Most of the literature mostly assesses the short-term impact of environmental policies. Another new but growing body of literature is beginning to focus on the long-term impact of market environment and market structure on firms’ green technology innovation behaviour. For example, based on the perspectives of impetus and capability, Gong et al. (2020) investigate the effects of rising labor costs and market environment on green technological innovation. They use the data of high-pollution firms in China from 2009 to 2018 and find that the influence of rising labor costs on green technological innovation has a threshold effect which illustrates an “inversely U-shaped” variation trend with the increase of degree of market monopoly. To fill this research field, we examine the impact of market integration on green technology innovation. In particular, we use firm-level micro data for our analysis, where similar studies have mostly used macro data.
Regional market integration reflects the integration of markets between regions and the smoothness of cross-regional trade of goods and factors. According to the Law of One Price, regional market integration in the full sense generally means that under free trade, the price of a given commodity in the same currency is the same in different regions after removing transaction costs (Eryigit and Karaman, 2011). If the price of a certain commodity is unequal between two regions, the reason may be various forms of institutional barriers or barriers to market accessibility due to geographical distance and transportation (Yuan and Pan, 2022). Increased market integration can encourage firms to operate across regions, which affects their technological innovation decisions; on the other hand, firms have easier access to innovation factors (e.g., talent and finance), which affects their technological innovation costs. So does market integration promote green technology innovation? This requires a comprehensive and accurate economic analysis, and we answer this question in the context of China. China has achieved miraculous economic growth and industrialization since its reform and opening up, but the low-quality development mode has also led to huge energy consumption and serious environmental pollution. According to China’s Ecological Environment Status Bulletin 2018, 217, or 64.2%, of the nation’s 338 cities exceeded ambient air quality pollution limits. To address its severe environmental problem, the Chinese government has intensified efforts to control pollution by implementing strict environmental governance measures and accelerating progress in green technology. On the other hand, new advances in urbanization continue to be made. China used to have severe market segmentation and local market protection (Young, 2000). Due to differences in resource endowments and economic structures, local governments often restrict the entry of outside firms for the development of their own regions. In recent years, along with the reform of China’s market economy system, the degree of market integration has increased (Bian et al., 2019; Yuan and Pan, 2022). The increasing integration of markets has facilitated the free flow of goods and production factors between regions. Thus, the development process in China provides an opportunity to identify the impact of market integration on green technology innovation. Understanding the impact of market integration on green technology innovation is of greater importance in China and provides an insight into pollution control in other developing countries. Using data on listed firms in China from 2002 to 2018, this paper investigates the causal impact of commodity market integration and factor market integration on firms’ green technology innovation using an instrumental variables approach. The challenge of studying the impact of market integration on green technology innovation is that market integration may be endogenous (Bian et al., 2019). Market integration and green technology innovation may be influenced by other socioeconomic conditions simultaneously, or there may be mutual influences. We use an instrumental variable approach to identify their causal effects. We choose the average elevation and density of transportation facilities as the instrumental variables for market integration. Average elevation and density of transportation facilities are strongly associated with market integration. And they are basically not correlated with other determinants that may affect firms’ green technology innovation decisions. By being tested, they become valid instrumental variables.
We have several findings. First, we find that both the integration of the commodity market and the factor market in China significantly promote the green technology innovation of firms. The results show that each 1% increase in commodity market integration and factor market integration will increase firms’ green technology innovation output by 12.5% and 11.0%, respectively. Second, the positive effect of market integration on firms’ green technology innovation is greater for firms in the eastern region, state-owned firms and firms in heavy polluting industries. Third, we find that the integration of commodity markets mainly affects the innovation of firms by expanding the market scale, intensifying market competition and promoting technology spillover. Factor market integration affects the green technology innovation of firms by optimizing resource allocation and improving resource allocation efficiency.
We have three contributions to literature. First, we analyze the impact of different types of market integration on firms’ green technology innovation in two dimensions: the commodity market and the factor market. Most existing studies focus on the impact of commodity markets and ignore factor markets (Que et al., 2018; Bian et al., 2019). Second, most existing studies on the impact of market integration use ordinary least squares (OLS) estimation and obtain only correlation results (Que et al., 2018). In contrast, we use an instrumental variables approach and estimate using a two-stage least squares approach (2SLS) to fully consider the endogeneity of market integration. Third, we provide a new perspective on how to promote green technology innovation. The existing literature mostly studies the impact of R&D investment and policy on firms’ green technology innovation (Alsharkas, 2014). We instead emphasize the role of the market environment and market integration.
The rest of this paper is organized as follows. Section 2 introduces the theoretical framework and puts forward the research hypotheses. Section 3 shows the empirical strategy. Section 4 describes the data and variables. Section 5 reports the empirical results. Section 6 discusses the mechanism. Section 7 concludes.
2 Theoretical background
Market integration is the integration of multiple local markets in a region, which means that products, resources and factors can be free to flow and configure within the region (Yi and Zhou, 2016). Products and factors flow between regions, which are commodity market integration and factor market integration (Yi and Zhou, 2016; Bian et al., 2019). They act at the end and source of production activities, respectively. And there are differences in the paths taken by firms in green technology innovation. Figure 1 illustrates the theoretical framework of the impact for market integration on green technology innovation.
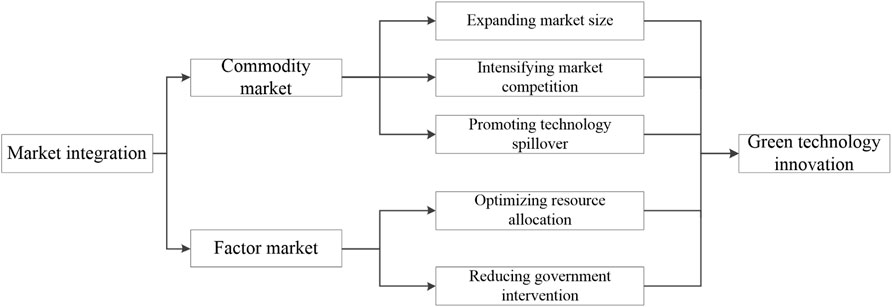
FIGURE 1. Theoretical framework for the impact of market integration on green technology innovation.
2.1 Commodity market integration
First, cross-regional sales of goods directly expand the business scope of firms. The expansion of market scale and the increase in effective demand are conducive to the formation of industrial agglomerations and a scaled economy. On the one hand, both the theory of “local market effect” (Bian et al., 2021) and the hypothesis of “market scope” (Lyu et al., 2022) hold that the expansion of market scale will promote the division of labor, cooperation and specialized production within and among firms. Specialization improves labor productivity, promotes green technology innovation and accelerates industrial agglomeration (Wang et al., 2016). On the other hand, the theory that “demand leads to innovation” (Young, 2000) holds that when the market scale expands, the market demand also increases. Firms can improve profitability. This not only directly affects the green R&D investment of firms but also indirectly enhances their risk-taking ability and innovation willingness (Hilary and Hui, 2009).
Second, the integration of commodity markets enables foreign firms to operate in the local region. This reduces the entry barriers of external firms and increases the number of firms in the region. In order to obtain profits, firms have to face more competition. Firm’ green technology innovation can be effectively promoted by competition (Alsharkas, 2014). To meet the environmental standards required by the government, firms will have to carry out green technology innovation and product upgrading (Fang and Shao, 2022). The Schumpeter hypothesis (Ren et al., 2021) also holds that market competition has the effect of dissipating innovation rent. The weakening of market competition will encourage the “innovation inertia” of firms (Metcalfe, 2006), which is not conducive to improving productivity.
Third, external firms will have significant technology spillover effects on local industries through horizontal spillover and direct spillover (Bloom et al., 2013). When external firms enter the local market, they also bring external technology. On the one hand, firms can imitate and absorb the technology hidden in consumer goods or intermediate goods to form technological transformation and innovation (Kayalvizhi and Thenmozhi, 2018). On the other hand, firms can also directly learn from other firms’ pollution treatment measures and technologies to improve their environmental performance (Bian et al., 2019). Based on the above analysis, we propose the following hypotheses:
2.2 Factor market integration
First, the integration of the factor market can break the barriers to factor flow. The free flow and concentration of innovative factors such as knowledge, creativity and talents can promote the spillover of professional technology and knowledge (Guan and Liu, 2005; Chen and Guan, 2012). Green innovation factors (e.g., highly skilled talents and credit funds) can be distributed to the regions, industries and firms with the highest production efficiency (Yi and Zhou, 2016). The integration of the factor market can alleviate the mismatch of innovation resources and improve the efficiency of using innovation resources (Yun et al., 2019). The segmentation of the factor market will lead to the rise of factor prices, which will increase the cost of innovation and restrain the motivation for innovation. The free flow of factors makes the price of factors determined by market supply and demand, which will reduce the innovation cost of firms (Drejer and Jørgensen, 2005; Ljungwall and Tingvall, 2015), and stimulate the willingness of firms to innovate.
Second, the higher the integration of the factor market, the stronger the market’s ability to allocate resources and the less the government has the right to price and distribute key resources. On the one hand, the integration of the factor market can reduce the intervention of the government (Yi and Zhou, 2016). In pursuit of GDP, taxation and employment, local governments may give large firms more favorable conditions to support their development. These firms can get excess profits through low-cost factors, and they may reduce innovation motivation (Claessens et al., 2008). On the other hand, the integration of the factor market can reduce the rent-seeking activities of firms. From the perspective of investment behavior, if the firm can establish some rent-seeking relationships with government officials, it may obtain low-cost production factors. Firms can get excess profits or rent-seeking income through rent-seeking activities, which are not conducive to firm innovation in green technology (Boldrin and Levine, 2004). In particular, market integration can prevent polluters from circumventing emission limits by moving to other regions. Based on the above analysis, we propose the following hypotheses:
3 Empirical strategy
In order to estimate the impact of commodity market integration and factor market integration on firm’ green technology innovation, we set up an individual fixed effect model as shown in equation (1):
where p, c, i and t represent province, industry, firm and year respectively. The dependent variable, Innovation, is the green technology innovation output of firms. Commi and Facmi represent the integration degrees of the commodity market and factor market, respectively. X is a vector of control variables. λp, λc λt and λi represent the fixed effect of province, industry, year and firm respectively. μ is the error term. The coefficients of interest are β1 and β2, which measure the effects of commodity market integration and factor market integration on firms’ green technology innovation, respectively.
The key challenge of the above model is that market integration is very likely to be endogenous. Despite the inclusion of control variables and multiple fixed effects, there may still be unobservable factors that affect both market integration and green technology innovation (Bian et al., 2019; Zhou et al., 2022). This can lead to omitted variables. And if firms within a province are less able to innovate technologically, this may indicate that they are inherently less economically efficient and thus more likely to be at a competitive disadvantage in the region. This can cause local governments to reinforce local protection to inhibit market integration, thus causing reverse causality (Shao et al., 2019; Bian et al., 2021). Both of these points can bias the identification of key coefficients.
We use an instrumental variable approach to address the above questions. Following Zhang et al. (2020) and Shao et al. (2019), we choose the average elevation and density of transportation facilities as the instrumental variables for market integration. The average elevation and density of transportation facilities affect the cost of trade and exchange between provinces and are strongly associated with provincial market integration. The higher the average elevation of a region and the lower the density of transportation facilities, the higher the cost of trade and factor movement between it and other regions, and then the lower the degree of market integration (Zhang et al., 2020). And there is no evidence that geographic factors determine regional differences, so average elevation and transportation facility density are not correlated with other omitted variables that may affect firms’ green technology innovation decisions. Therefore, these two instrumental variables theoretically satisfy the relevance and exogeneity requirements of the instrumental variables approach. Accordingly, the following equations are developed and estimated by the 2SLS approach:
where Elevation represents the average elevation of the province; Density represents the density of transportation facilities in the province. Eqs 2, 3 are the first-stage regression; Eq. 4 is the second-stage regression.
4 Variables and data
4.1 Green technology innovation output
The existing literature mainly uses R&D input and green patent output to measure firm’ green technology innovation (Yin et al., 2020). However, some literature points out that due to the high failure rate and strong uncertainty of R&D activities, patent output more directly reflects the level of firm’ green technology innovation (Hong et al., 2021; Zhang et al., 2022). There are two main indicators to measure innovation output: one is the number of green patents granted; the other is the number of new green products (Du and Li, 2019). It is difficult to obtain new product data, and not all patent applications will be authorized. Therefore, we use the number of green patents granted (Patent) to measure the green technology innovation output of firms. We also use R&D intensity as a proxy variable to test the robustness. It is important to note that it takes some time from patent application to authorization, typically 2 years in China1 (Jiang et al., 2022). Therefore, we lag the number of green patents granted to companies by 2 years.
4.2 Degree of market integration
Scholars have used various methods to measure market integration (or market segmentation), such as the industrial structure method (Young, 2000), the trade flow method (Poncet, 2003), and the relative price method (Parsley and Wei, 1996, 2001). The relative price method has been used in many studies because of its theoretical basis and ease of calculation. This method is mainly based on the iceberg cost theory (Samuelson, 1952). Icebergs are lost in part by melting during transportation, and product transport is similar. Some products will be consumed in the form of transaction costs during transportation. The transaction cost leads to the price difference between products in two different regional markets. Therefore, the price ratio of the two products will fluctuate within a range. Market segmentation increases transaction costs, which will lead to an expansion of the relative price fluctuation range (Shao et al., 2019). Market integration reduces transaction costs, which will result in a reduction in the relative price fluctuation range. We use the relative price method to measure the integration degree of the commodity market and factor market.
We take commodity market integration as an example, and the specific calculation process is as follows. First, we calculate the relative prices
where k is the commodity, i and j are the provinces. The absolute value can avoid the sign change caused by the location of the two provinces. Finally, we get 435 province pairs and 17 years of time series data. Some data in Tibet is missing, so it is excluded.
Because the difference in commodity types is not eliminated, it is easy to overestimate the degree of market integration between two provinces. After getting the relative price
Finally, we use
Obviously, Commi represents the reciprocal of price fluctuation. The smaller the price fluctuation, the greater the Commi, and the higher the commodity market integration. Commodity prices are measured by the commodity price index. We choose food, beverage, tobacco and wine, clothing, shoes and hats, household appliances and audio-visual equipment, daily necessities, Chinese and Western medicines and medical and healthcare products, books, newspapers and magazines, electronic publications and fuels, eight kinds of goods in total (Bian et al., 2019). We still use the above method to calculate the degree of factor market integration (Facmi) by replacing goods with capital and labor items. The capital factor price is measured by the fixed asset price index. Investment goods of fixed assets include construction and installation engineering, equipment engineering appliances and other capital goods. The labor factor price is measured by the real wage index. The types of wages include the average wages of state-owned departments, urban collective departments and other departments (Yi and Zhou, 2016).
4.3 Instrument variable
As previously mentioned, the key challenge of this study is that market integration may be endogenous. We use an instrumental variable approach for causal identification. Market integration is instrumented by average elevation and density of transportation facilities. The average elevation of the province (Elevation) is based on digital elevation data with a 90-m resolution in China and calculated using ArcGIS software. The density of transportation facilities in the province (Density) data was obtained from the China Statistical Yearbook. It is equal to the ratio of the total length of roads, railroads and waterways to the total area in each province. Existing research suggests that these two instrumental variables are highly correlated with market integration and largely do not influence firms’ technology innovation through other channels.
4.4 Control variable
Firm characteristics may also have an impact on green technology innovation (Hong et al., 2021). We control the following characteristic variables at the company level. The asset liability ratio (Liability) of a firm is expressed as the ratio of total liabilities to total assets. The cash flow rate (Cash) is the ratio of monetary capital to total assets. The level of government subsidies (Subsidy) is measured by the ratio of the total amount of government subsidies received by firms to the sales revenue of products. The scale of a firm (Scale) is expressed by its annual average number of employees. Division of labor in firms (Division) is measured by the ratio of wages payable in the current year to the average number of employees. The profit rate of a firm (Profit) is expressed by the ratio of its total profit to its total assets. The age of the firm (Age) is expressed by the number of years the firm has been listed.
4.5 Data
The green patent application and authorization data of firms come from the China Research Data Service Platform (CNRDS Platform) and the China Stock Market and Accounting Research Database (CSMAR Database). The CNRDS Platform is a high-quality, open and integrated data platform for China’s economic, financial and business research. The CSMAR Database provides accurate economic, financial and security information and is a high-precision research database covering the main fields of China’s economy and finance. The R&D input data and financial data for other control variables are from the CSMAR Database and Wind Database.
China joined the WTO in 2001, which has an important impact on commodity and factor prices. Therefore, 2002 is the starting year of the sample. All data are from 2002 to 2018, allowing us to fully explore the variations and trends in the data. The price index of commodities, fixed asset investment and employees’ real wages are from the China Statistical Yearbook and the China Population and Employment Statistical Yearbook. Definitions of the key variables and descriptive statistics are reported in Table 1. To avoid differences in magnitudes between variables and to facilitate interpretation of the estimates, we take logarithms for some variables2. Figures 2, 3 show that there is a significant positive correlation between market integration and firm green technology innovation.
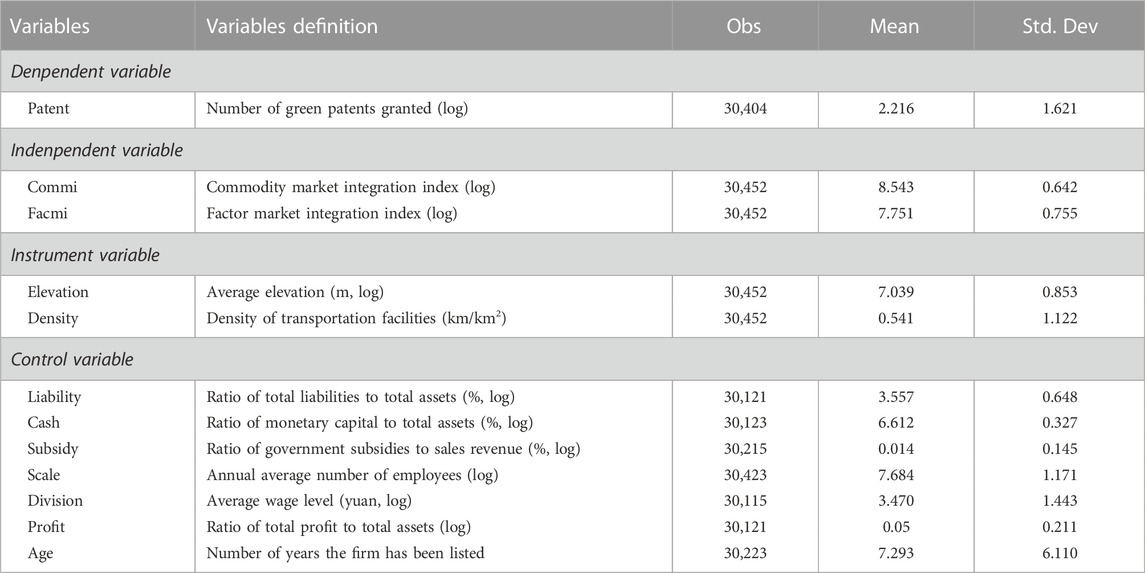
TABLE 1. Descriptive statistics.
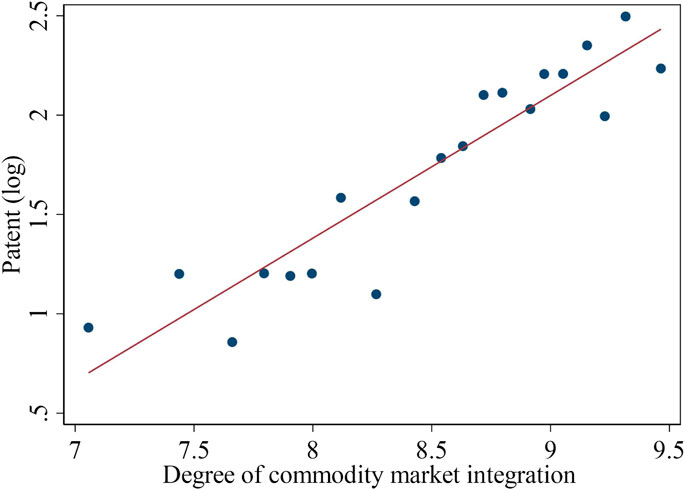
FIGURE 2. Correlation between commodity market integration and green patents.
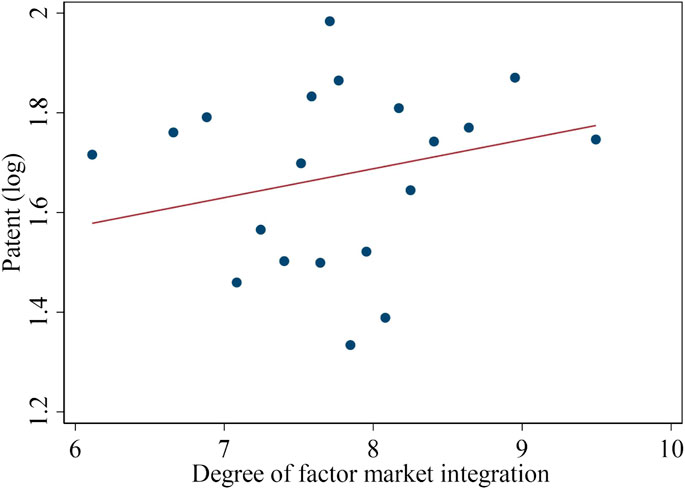
FIGURE 3. Correlation between factor market integration and green patents.
5 Empirical results
5.1 Impact of market integration on green technology innovation
Table 2 shows the OLS estimation results of Eq. 1. Control variables, province, industry, and year fixed effects are added to the model sequentially from Column (1) to Column (5). As it shows, the OLS estimation results change with the addition of control variables and fixed effects. In Columns (3)–(5), the estimated coefficients tend to stabilize when multiple covariates are controlled. The coefficients of both commodity market integration and factor market integration are significantly positive, which indicates a positive relationship between market integration and green technology innovation. However, it is difficult to state that this is a causal impact on green technology innovation.
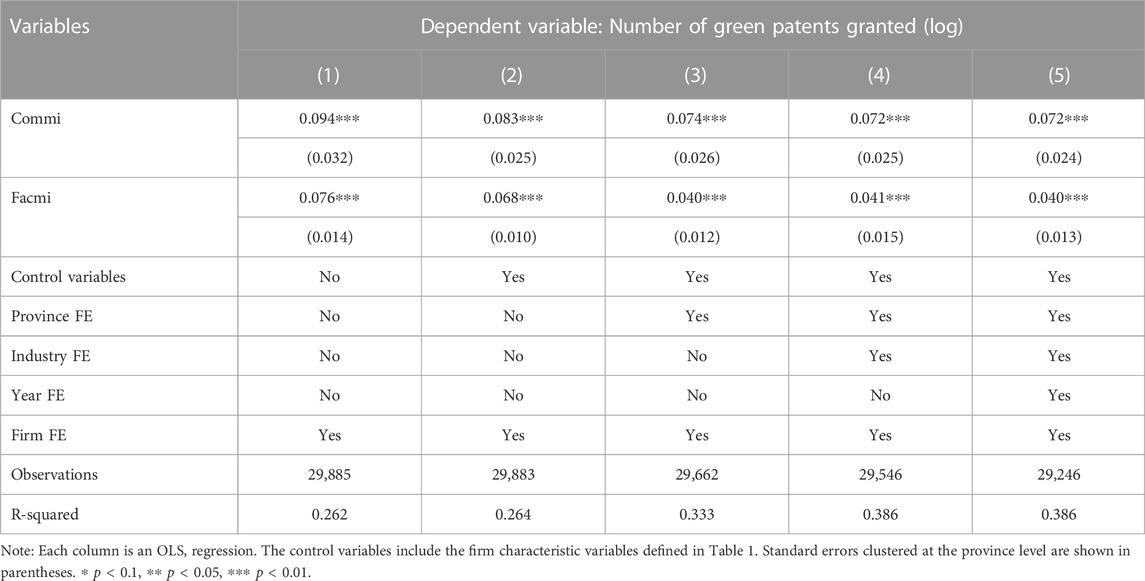
TABLE 2. OLS estimates of the impact of market integration on green technology innovation.
Due to the endogeneity problem of OLS, we further use 2SLS estimation with average elevation and transportation facility density as instrumental variables for market integration. In the first stage, we estimate the effects of the average elevation and density of transportation facilities on the integration of commodity and factor markets, respectively. The corresponding regression results are shown in Table 3. The results show that average elevation is highly negatively correlated with the market integration index and that the density of transportation facilities is highly positively correlated with the market integration index. The F statistics of the first-stage regressions are quite large, which can verify the validity of our instrumental variables. This result is consistent with Zhang et al. (2020).
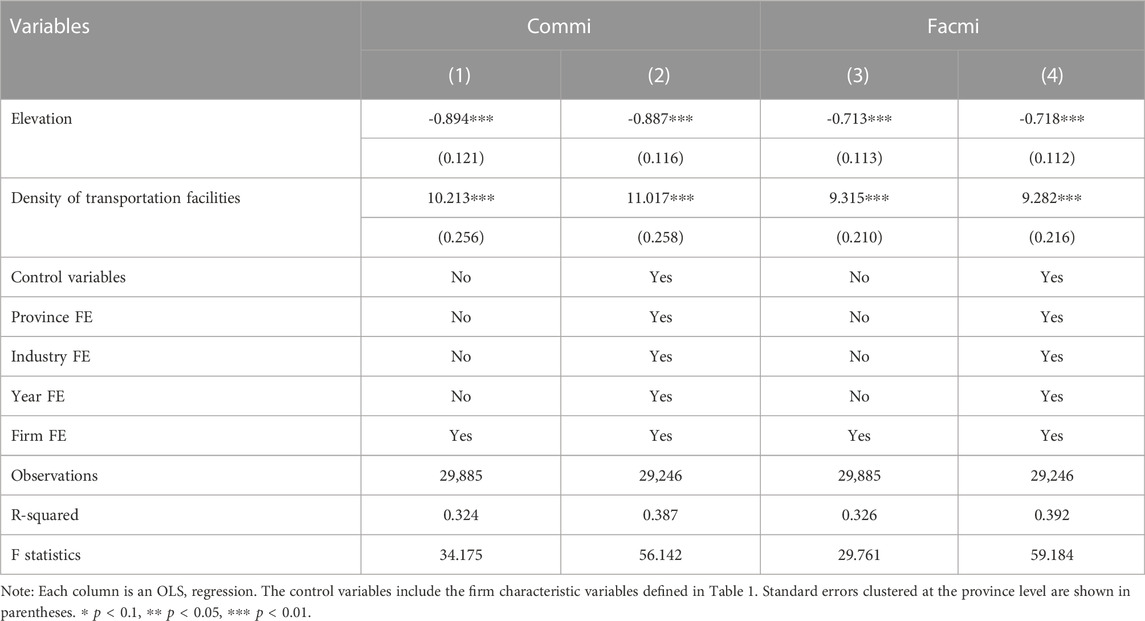
TABLE 3. First-stage estimation: impact of instrumental variables on market integration.
The second stage of the regression estimates the marginal effect of market integration on firms’ green technology innovation, and the results are presented in Table 4. The regression scheme in Columns (1)–(5) of Table 4 corresponds strictly to the regression scheme in Table 2. Column (5) shows the estimation results after controlling for all variables and fixed effects, so it is the most preferable estimate. Column (5) shows that the coefficient of commodity market integration on green technology innovation is 0.125, which is statistically significant at the 1% level. Its economic implication is that each 1% increase in the index of commodity market integration leads to a 12.5% increase in firms’ green technology innovation output. The coefficient of factor market integration on green technology innovation is 0.110, which is also statistically significant at the 1% level. It indicates that each 1% increase in the factor market integration index leads to a 11.0% increase in the firm’s green technology innovation output. The above marginal effects can be interpreted as causal impact when we use instrumental variables to deal with endogeneity. These findings confirm Hypothesis 1 and Hypothesis 3.
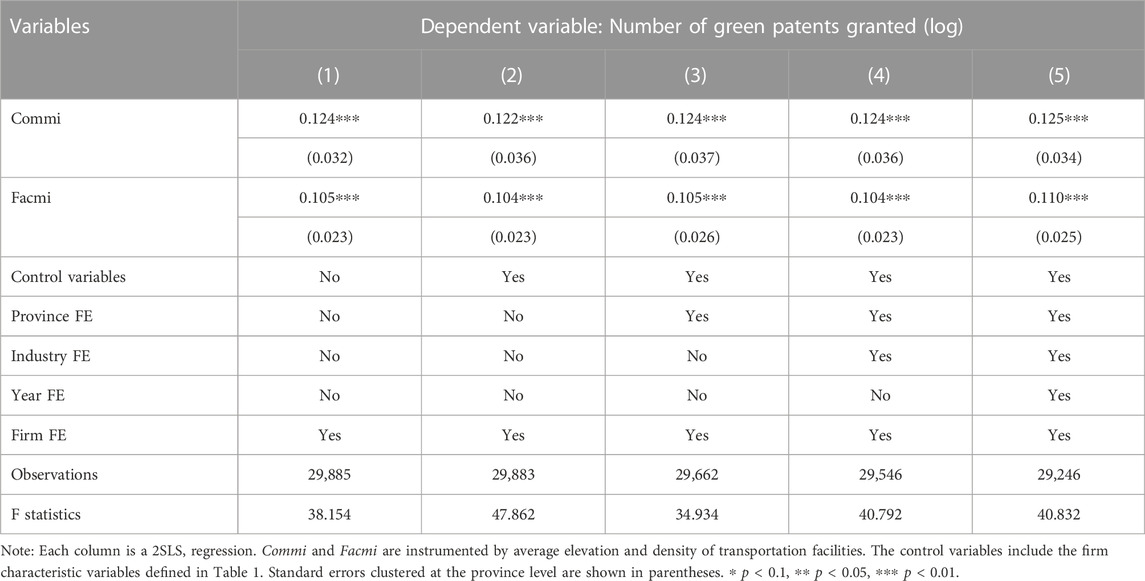
TABLE 4. 2SLS estimates of the impact of market integration on green technology innovation.
Comparing the 2SLS estimates (see Table 4) with the OLS estimates (see Table 2), we find that OLS tends to underestimate the impact of commodity and factor market integration on green innovation output by 1.7 times (0.125/0.072) and 2.7 times (0.110/0.040) of the true impact suggested by the 2SLS, respectively. Such biased estimates may arise from omitted variables or reverse causality, which may lead to an underestimation of the real impact.
5.2 Robustness checks
To ensure the reliability of the analysis results, we use several methods for robustness check. First, we replace the measure of green technology innovation. We use R&D input intensity, which is equal to the ratio of a firm’s R&D input to its total sales revenue, to measure a firm’s green technology innovation output and re-estimate it. The estimated results are shown in Column (1)–(2) of Table 5. It is found that the coefficients of commodity market integration and factor market integration are still significantly positive. The results are consistent with the main results. As an alternative indicator, we also use the number of green patent applications to measure green technology innovation, which is consistent with the study by3 Wang and Wang (2022). The regression results are reported in columns (3)–(4) of Table 5. The results are consistent with our baseline results, which demonstrate the robustness of the findings of this study.
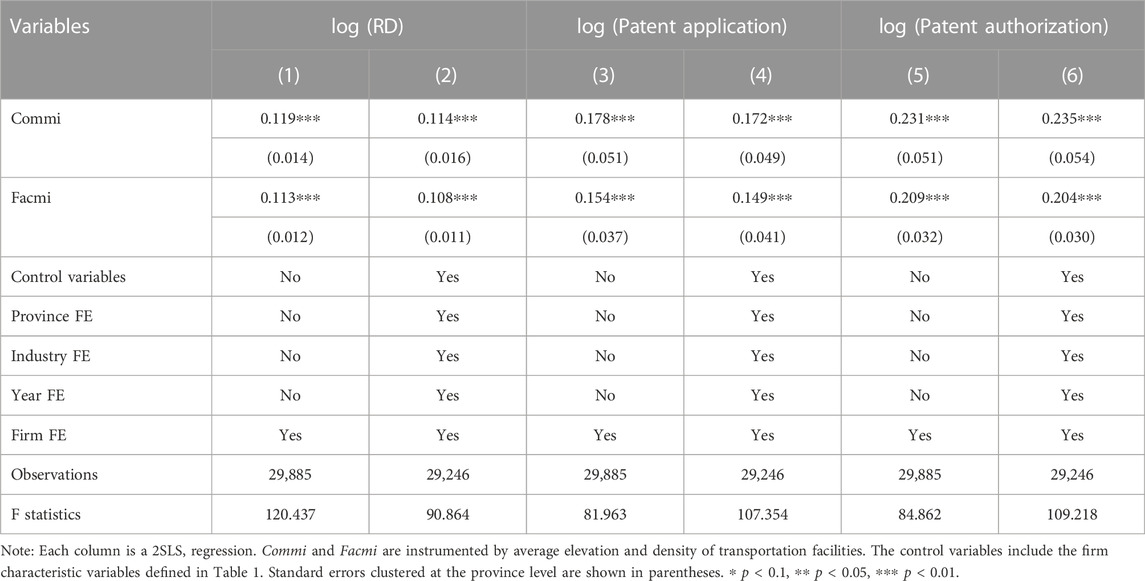
TABLE 5. Robustness checks.
In the main results, we use the market integration index to measure the degree of market integration. We replace the measures of market integration and re-estimate. Commodity market integration is measured by the score of the degree of development of commodity markets, and factor market integration is measured by the score of the degree of development of labor and capital markets. Both score indicators are from the China Market Index Database4. The regression results are shown in Column (5)–(6) of Table 5. The results are consistent with the previous results.
5.3 Heterogeneity
5.3.1 Region heterogeneity
In China’s eastern, central and western regions, there are huge differences in the level of economic development and environmental pollution (Shao et al., 2019). We divide the sample firms into two sub-samples: firms in the eastern region and firms in the central and western regions, and re-estimate. The estimated results are shown in Columns (1)–(2) of Table 6.
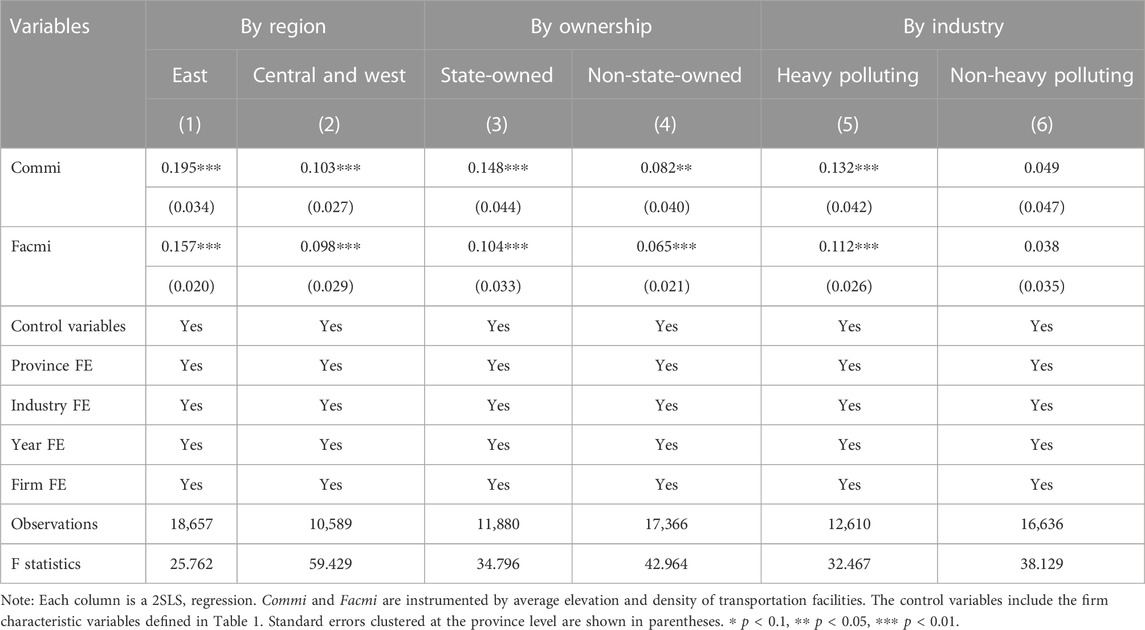
TABLE 6. Heterogeneity.
The results show that for firms in the eastern region and the central and western regions, the coefficients of commodity and factor market integration are all significantly positive. And the estimated coefficient of the eastern region is larger than that of the central and western regions, which indicates that the green innovation effect of market integration is greater in the eastern region than in the central and western regions. This may be due to the fact that firms in the eastern region face domestic and international markets, with larger market sizes, more market competition and more technology spillover. On the other hand, environmental pollution is more serious in the eastern region, and the government is more stringent about the pollution emissions of firms. Therefore, firms in the eastern region have to make more green technological innovations.
5.3.2 Ownership heterogeneity
There are significant differences between state-owned firms and non-state-owned firms in development history, resource capacity and stringency of pollution control (Song et al., 2011). We divide the firms into two sub-samples: state-owned firms and non-state-owned firms. The estimated results are shown in Columns (3)–(4) of Table 6.
The results show that, for state-owned firms, the estimated coefficient of market integration on innovation is significantly positive. For non-state-owned firms, the estimated coefficient of market integration is also positive but much lower. This shows that market integration has a significant positive impact on the green technology innovation of state-owned firms. The possible reason is that after the improvement of market integration and the reform of state-owned firms, the advantages of state-owned firms, such as administrative monopoly and government relations, no longer exist. In the face of more fierce market competition, state-owned firms can only develop through more green technology innovation. And the government has stricter standards for energy consumption and pollution emissions for state-owned firms than for non-state-owned firms (Bian et al., 2019). State-owned firms must make more green innovations to meet the emission standards.
5.3.3 Industry heterogeneity
Firms in different industries also have differences in factor allocation, organizational management and pollution emissions (Lai et al., 2022). We divide the firms into firms in heavy polluting industries and firms in non-heavy polluting industries. The estimated results are shown in Columns (5)–(6) of Table 6.
The results show that for firms in heavy polluting industries, the estimated coefficient of market integration on green technology innovation is significantly positive, which is much higher than the coefficient for firms in non-heavy polluting industries. This suggests that the higher the level of pollution, the stronger the green innovation effect of market integration. This may be because firms in high-polluting industries have higher requirements to reduce emissions. Firms must make more green technology innovations for pollution control. After market integration is improved, high-polluting firms have higher environmental benefits and can obtain more green innovation factor inputs (like green credit priority support for heavy polluters) (Bian et al., 2019), which in turn increase green technology innovation outputs.
6 Mechanism analysis
According to the theoretical analysis in Section 2, we develop the hypothesis that commodity market integration would promote firm green technology innovation by expanding market scale, intensifying market competition effect and promoting technology spillover, and that factor market integration would promote the innovation activities of firms by optimizing resource allocation and reducing government intervention. We test and verify these hypotheses in this section.
First, we construct three mechanism variables for the commodity market. The size of the market (Size) is measured by the proportion of firm sales in the whole industry. Market competition degree (Competition) is measured by the Herfindahl Hirschman index based on firm sales5. The technology spillover level (Spillover) is measured by the proportion of technology import expenditure to total expenditure. We then estimate the effect of commodity market integration on the above three mechanism variables using the 2SLS approach based on Eq. 4. The results are shown in Table 7. All the coefficients of commodity market segmentation are significantly positive, which indicates that commodity market integration expands the market scale, intensifies market competition and promotes technology spillover. These results support our Hypothesis 2 presented in Section 2.
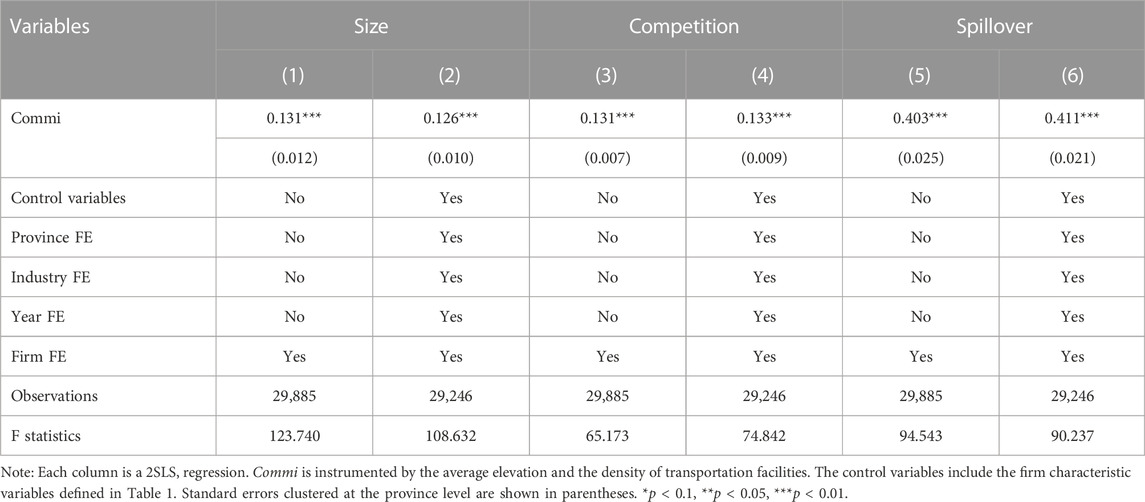
TABLE 7. The mechanism of the impact of commodity market integration.
Then, for the factor market, we construct two mechanism variables: degree of resource allocation (Market) and level of government intervention (Government). The degree of resource allocation is measured by the score of the share of economic resources allocated by the market. The level of government intervention is measured by the score of reduced government intervention in the firm. Both score indicators are from the China Market Index Database6. We estimated the effect of factor market integration on Market and Government using average elevation and transportation facility density as instrumental variables. The results are shown in Table 8. The positive and significant coefficients indicate that factor market integration helps optimize the allocation of innovation resources and weakens government intervention in the market. This confirms Hypothesis 4.
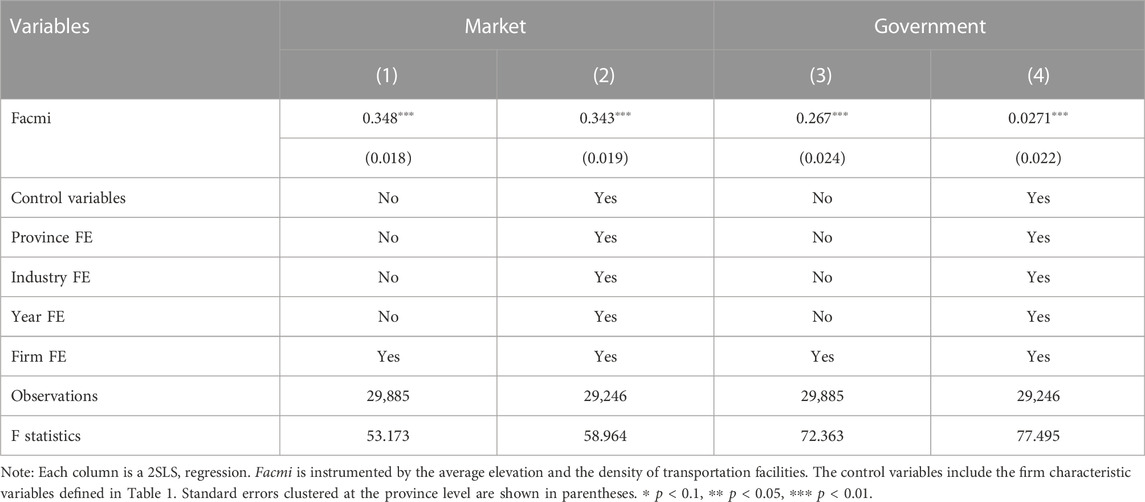
TABLE 8. The mechanism of the impact of factor market integration.
7 Conclusion
Increasing environmental pollution and climate change have made how to improve green technology innovation a focus of attention for governments and scholars. Understanding the impact of market integration on green technology innovation is crucial for the design of development policies. We theoretically analyze the impact of regional market integration on green technology innovation. Then, we empirically estimate the impact of regional market integration on green technology innovation by using the data of China’s listed manufacturing firms from 2002 to 2018. The key challenge in the identification of causal effects is that market integration is very likely to be endogenous. We use an instrumental variables approach and estimate using the 2SLS approach to fully consider the endogeneity of market integration. Average elevation and density of transportation facilities are shown to be effective instrumental variables for market integration.
We find that both commodity market integration and factor market integration significantly promote green technology innovation. Each 1% increase in the index of commodity market integration leads to a 12.5% increase in firms’ green technology innovation output. And a 1% increase in factor market integration will increase firms’ green technology innovation output by 11.0%. The results remain robust after replacing key variables. The heterogeneity study finds that the green technology innovation effect of market integration is greater for eastern firms, state-owned firms and heavily polluting firms. We further explore the channels through which market integration affects firm green technology innovation and find that commodity market integration affects firm’ green technology innovation mainly by expanding market scale, intensifying market competition and promoting technology spillover. The factor market integration affects firm green technology innovation by optimizing resource allocation and reducing government intervention.
The above conclusions provide important policy implications for the selection of the path of green technology innovation and also have important significance for developing countries to achieve structural adjustment and industrial transformation. Promoting green technology innovation through increased market integration may be one of the most effective ways to achieve a win-win situation between economic development and environmental protection. A policy implication is that when environmental policies are not sustainable in the long term, promoting product and factor market integration and optimizing the market environment may effectively improve the green technology innovation ability of firms. This paper deepens our understanding of the sources of green technology innovation in terms of the market environment and regional economies, and highlights the beneficial spillover effects of regional economic integration. One shortcomings of this study may be that it does not consider the impact of the interaction between environmental regulation and market integration on firm behavior. If a region has strict environmental regulations and a high degree of market integration, firms can move to areas with weak environmental regulations. At this time, firms have little incentive to carry out green technology innovation. This will be our next research topic.
Data availability statement
The data that support the findings of this study are publicly available. Most of the data for this study comes from the China Statistical Yearbook and the annual reports of listed firms. These data are publicly available. Publicly available datasets were analyzed in this study. This data can be found here: https://www.cnrds.com/Home/Login.
Author contributions
All authors contributed to the study conception and design. Material preparation, data collection and analysis were performed by TL and ZC. The first draft of the manuscript was written by TL and ZC, and all authors commented on previous versions of the manuscript.
Funding
This work was supported by the Social Science Projects of the Chinese Ministry of Education (16JZD018); the Graduate Innovation Fund of Shanghai University of Finance and Economics (kycx-2020-05).
Acknowledgments
The authors would like to express their gratitude for the project team of The China Market Index Database. The authors would like to thank the School of Economics, Shanghai University of Finance and Economics, for providing the datasets.
Conflict of interest
The authors declare that the research was conducted in the absence of any commercial or financial relationships that could be construed as a potential conflict of interest.
Publisher’s note
All claims expressed in this article are solely those of the authors and do not necessarily represent those of their affiliated organizations, or those of the publisher, the editors and the reviewers. Any product that may be evaluated in this article, or claim that may be made by its manufacturer, is not guaranteed or endorsed by the publisher.
Footnotes
1In fact, in China, it takes an average of 3 years for an invention patent to be granted; 1 year for a utility model patent; and 0.5 years for a design patent. Green patents are generally invention patents and utility model patents. We take the average value of their granting time, which is 2 years.
2To avoid the impact of a zero value, the logarithm is taken after adding one to the indicator.
3Wang and Song (2017) and Wang et al. (2018) measured an indicator of green technological progress using the ML index approach and the ACF method respectively. According to their definition, green technological progress places more emphasis on the efficiency characteristics of green technologies, such as the implementation effects and output changes of energy saving and emission reduction technologies, which differs from the innovation of green technologies themselves as emphasised in this paper.
4The China Market Index Database is compiled and calculated by the Beijing Institute of National Economy. They have established a system of indicators for the degree of marketization in China. This system includes five aspects: government-market relationship, non-state economy, product market, factor market and institutional environment. The score datas used in our paper come from the product and factor market sections of this database. We are grateful to them for providing the data. For more details, please see https://cmi.ssap.com.cn/.
5Herfindahl Hirschman index is calculated by:
6Please see the previous footnote for this database and indicator descriptions. For more details, please see https://cmi.ssap.com.cn/.
References
Alsharkas, Z. (2014). Firm size, competition, financing and innovation. Int. J. Manag. Econ. 44, 51–73. doi:10.1515/ijme-2015-0009
Bian, Y. C., Song, K. Y., and Bai, J. H. (2021). Impact of Chinese market segmentation on regional collaborative governance of environmental pollution: A new approach to complex system theory. Growth Change 52, 283–309. doi:10.1111/grow.12446
Bian, Y. C., Song, K. Y., and Bai, J. H. (2019). Market segmentation, resource misallocation and environmental pollution. J. Clean. Prod. 228, 376–387.
Bloom, N., Schankerman, M., and Van Reenen, J. (2013). Identifying technology spillovers and product market rivalry. Econometrica 81, 1347–1393.
Boldrin, M., and Levine, D. K. (2004). Rent-seeking and innovation. J. Monetary Econ. 51, 127–160. doi:10.1016/j.jmoneco.2003.07.006
Chen, F. L., Wang, M. C., and Pu, Z. N. (2022). The impact of technological innovation on air pollution: Firm-level evidence from China. Technol. Forecast. Soc. Change 177, 121521. doi:10.1016/j.techfore.2022.121521
Chen, K., and Guan, J. (2012). Measuring the efficiency of China's regional innovation systems: Application of network data envelopment analysis (DEA). Reg. Stud. 46, 355–377. doi:10.1080/00343404.2010.497479
Claessens, S., Feijen, E., and Laeven, L. (2008). Political connections and preferential access to finance: The role of campaign contributions. J. Financial Econ. 88, 554–580. doi:10.1016/j.jfineco.2006.11.003
Drejer, I., and Jørgensen, B. H. (2005). The dynamic creation of knowledge: Analysing public–private collaborations. Technovation 25, 83–94. doi:10.1016/s0166-4972(03)00075-0
Du, K. R., and Li, J. L. (2019). Towards a green world: How do green technology innovations affect total-factor carbon productivity. Energy Policy 131, 240–250. doi:10.1016/j.enpol.2019.04.033
Ebenstein, A., Fan, M., Greenstone, M., He, G., and Zhou, M. (2017). New evidence on the impact of sustained exposure to air pollution on life expectancy from China’s Huai River Policy. Proc. Natl. Acad. Sci. U. S. A. 114, 10384–10389. doi:10.1073/pnas.1616784114
Eryigit, K. Y., and Karaman, S. (2011). Testing for spatial market integration and law of one price in Turkish wheat markets. Qual. Quant. 45, 1519–1530. doi:10.1007/s11135-010-9320-1
Fang, Y., and Shao, Z. Q. (2022). Whether green finance can effectively moderate the green technology innovation effect of heterogeneous environmental regulation. Int. J. Environ. Res. Public Health 19, 3646. doi:10.3390/ijerph19063646
Gong, R., Wu, Y. Q., Chen, F. W., and Yan, T. H. (2020). Labor costs, market environment and green technological innovation: Evidence from high-pollution firms. Int. J. Environ. Res. Public Health 17, 522. doi:10.3390/ijerph17020522
Guan, J., and Liu, S. (2005). Comparing regional innovative capacities of PR China based on data analysis of the national patents. Int. J. Technol. Manag. 32, 225–245. doi:10.1504/ijtm.2005.007331
He, G., Wang, S., and Zhang, B. (2020). Watering down environmental regulation in China. Q. J. Econ. 135, 2135–2185. doi:10.1093/qje/qjaa024
Hilary, G., and Hui, K. W. (2009). Does religion matter in corporate decision making in America? J. Financial Econ. 93, 455–473. doi:10.1016/j.jfineco.2008.10.001
Hong, M., Li, Z. H., and Drakeford, B. (2021). Do the green credit guidelines affect corporate green technology innovation? Empirical research from China. Int. J. Environ. Res. Public Health 18, 1682. doi:10.3390/ijerph18041682
Jiang, S. S., Liu, X. J., Liu, Z. L., Shi, H., and Xu, H. D. (2022). Does green finance promote enterprises' green technology innovation in China? Front. Environ. Sci. 10. doi:10.3389/fenvs.2022.981013
Kayalvizhi, P., and Thenmozhi, M. (2018). Does quality of innovation, culture and governance drive FDI?: Evidence from emerging markets. Emerg. Mark. Rev. 34, 175–191. doi:10.1016/j.ememar.2017.11.007
Lai, A. L., Yang, Z. H., and Cui, L. B. (2022). Can environmental regulations break down domestic market segmentation? Evidence from China. Environ. Sci. Pollut. Res. 29, 10157–10172. doi:10.1007/s11356-021-16387-9
Ljungwall, C., and Tingvall, P. G. (2015). Is China different? A meta-analysis of the growth-enhancing effect from R&D spending in China. China Econ. Rev. 36, 272–278. doi:10.1016/j.chieco.2015.10.001
Lyu, X. J., Ni, J. L., and Yuan, J. (2022). Market segmentation and firm survival. Growth Change 53, 1243–1266. doi:10.1111/grow.12590
Metcalfe, J. S. (2006). Innovation, competition and enterprise: Foundations for economic evolution in learning economies. Innovation, Sci. Institutional Change, 105–121.
Parsley, D. C., and Wei, S.-J. (1996). Convergence to the law of one price without trade barriers or currency fluctuations. Q. J. Econ. 111, 1211–1236. doi:10.2307/2946713
Parsley, D. C., and Wei, S.-J. (2001). Explaining the border effect: The role of exchange rate variability, shipping costs, and geography. J. Int. Econ. 55, 87–105. doi:10.1016/s0022-1996(01)00096-4
Poncet, S. (2003). Measuring Chinese domestic and international integration. China Econ. Rev. 14, 1–21. doi:10.1016/s1043-951x(02)00083-4
Que, W., Zhang, Y. B., Liu, S. B., and Yang, C. P. (2018). The spatial effect of fiscal decentralization and factor market segmentation on environmental pollution. J. Clean. Prod. 184, 402–413. doi:10.1016/j.jclepro.2018.02.285
Ren, S. Y., Hao, Y., and Wu, H. T. (2021). Government corruption, market segmentation and renewable energy technology innovation: Evidence from China. J. Environ. Manag. 300, 113686. doi:10.1016/j.jenvman.2021.113686
Samuelson, P. A. (1952). The transfer problem and transport costs: The terms of trade when impediments are absent. Econ. J. 62, 278–304. doi:10.2307/2227005
Shao, S., Chen, Y., Li, K., and Yang, L. L. (2019). Market segmentation and urban CO2 emissions in China: Evidence from the yangtze river delta region. J. Environ. Manag. 248, 109324. doi:10.1016/j.jenvman.2019.109324
Song, Z., Storesletten, K., and Zilibotti, F. (2011). Growing like China. Am. Econ. Rev. 101, 196–233. doi:10.1257/aer.101.1.196
Wang, S. H., Chen, M., and Song, M. L. (2018). Energy constraints, green technological progress and business profit ratios: Evidence from big data of Chinese enterprises. Int. J. Prod. Res. 56, 2963–2974. doi:10.1080/00207543.2018.1454613
Wang, S. H., and Song, M. L. (2017). Influences of reverse outsourcing on green technological progress from the perspective of a global supply chain. Sci. Total Environ. 595, 201–208. doi:10.1016/j.scitotenv.2017.03.243
Wang, S. H., and Wang, H. K. (2022). Factor market distortion, technological innovation, and environmental pollution. Environ. Sci. Pollut. Res. 29, 87692–87705. doi:10.1007/s11356-022-21940-1
Wang, Y. D., Ning, L. T., Li, J., and Prevezer, M. (2016). Foreign direct investment spillovers and the geography of innovation in Chinese regions: The role of regional industrial specialization and diversity. Reg. Stud. 50, 805–822. doi:10.1080/00343404.2014.933800
Wangler, L. U. (2013). Renewables and innovation: Did policy induced structural change in the energy sector effect innovation in green technologies? J. Environ. Plan. Manag. 56, 211–237. doi:10.1080/09640568.2012.662464
Xu, R., Chen, X. D., and Zhang, F. F. (2019). Green technology innovation and sustainable development based on data fusion mining. Ekoloji 28, 1825–1833.
Yi, M., and Zhou, S. (2016). China's labor market integration and the effect of economic openness. Rev. Dev. Econ. 20, 164–175. doi:10.1111/rode.12215
Yin, S., Zhang, N., and Li, B. Z. (2020). Improving the effectiveness of multi-agent cooperation for green manufacturing in China: A theoretical framework to measure the performance of green technology innovation. Int. J. Environ. Res. Public Health 17, 3211. doi:10.3390/ijerph17093211
Young, A. (2000). The razor's edge: Distortions and incremental reform in the People's Republic of China. Q. J. Econ. 115, 1091–1135. doi:10.1162/003355300555024
Yuan, S., and Pan, X. F. (2022). Nonlinear impact of market segmentation on the upgrading of Chinese manufacturing enterprises. Chin. Manag. Stud. 8, 19. doi:10.1108/cms-08-2021-0334
Yun, S., Lee, J., and Lee, S. (2019). Technology development strategies and policy support for the solar energy industry under technological turbulence. Energy Policy 124, 206–214. doi:10.1016/j.enpol.2018.09.003
Zhang, K., Shao, S., and Fan, S. Y. (2020). Market integration and environmental quality: Evidence from the Yangtze river delta region of China. J. Environ. Manag. 261, 110208. doi:10.1016/j.jenvman.2020.110208
Zhang, Y., Hu, H. Y., Zhu, G. J., and You, D. M. (2022). The impact of environmental regulation on enterprises' green innovation under the constraint of external financing: Evidence from China's industrial firms. Environ. Sci. Pollut. Res. Int. 22. doi:10.1007/s11356-022-18712-2
Zhang, Y., Wang, J. R., Xue, Y. J., and Yang, J. (2018). Impact of environmental regulations on green technological innovative behavior: An empirical study in China. J. Clean. Prod. 188, 763–773. doi:10.1016/j.jclepro.2018.04.013
Keywords: market integration, green technology innovation, environmental pollution, regional economy, China
Citation: Lin T and Chen Z (2022) Does market integration promote green technology innovation? Evidence from China. Front. Environ. Sci. 10:1097616. doi: 10.3389/fenvs.2022.1097616
Received: 14 November 2022; Accepted: 30 November 2022;
Published: 09 December 2022.
Edited by:
Khurram Shehzad, Southeast University, ChinaReviewed by:
Shuhong Wang, Shandong University of Finance and Economics, ChinaXin Zhao, Anhui University of Finance and Economics, China
Copyright © 2022 Lin and Chen. This is an open-access article distributed under the terms of the Creative Commons Attribution License (CC BY). The use, distribution or reproduction in other forums is permitted, provided the original author(s) and the copyright owner(s) are credited and that the original publication in this journal is cited, in accordance with accepted academic practice. No use, distribution or reproduction is permitted which does not comply with these terms.
*Correspondence: Zhao Chen, chenzhao2002@gdufs.edu.cn