Evaluating the effectiveness and robustness of machine learning models with varied geo-environmental factors for determining vulnerability to water flow-induced gully erosion
 Fatima Aboutaib1
  Samira Krimissa1
  Biswajeet Pradhan2,3 Abdenbi Elaloui1
  Maryem Ismaili1*
  Kamal Abdelrahman4 Hasna Eloudi5 Mustapha Ouayah1 Malika Ourribane1
  Mustapha Namous1
- 1Data Science for Sustainable Earth Laboratory (Data4Earth), Sultan Moulay Slimane University, Beni Mellal, Morocco
- 2Centre for Advanced Modelling and Geospatial Information Systems (CAMGIS), School of Civil and Environmental Engineering, Faculty of Engineering and Information Technology, University of Technology Sydney, Sydney, NSW, Australia
- 3Earth Observation Center, Institute of Climate Change, Universiti Kebangsaan Malaysia (UKM), Selangor, Malaysia
- 4Department of Geology and Geophysics, College of Science, King Saud University, Riyadh, Saudi Arabia
- 5Applied Geology and Geoenvironment Laboratory, Faculty of Sciences, Ibn Zohr University, Agadir, Morocco
Assessing and mapping the vulnerability of gully erosion in mountainous and semi-arid areas is a crucial field of research due to the significant environmental degradation observed in such regions. In order to tackle this problem, the present study aims to evaluate the effectiveness of three commonly used machine learning models: Random Forest, Support Vector Machine, and Logistic Regression. Several geographic and environmental factors including topographic, geomorphological, environmental, and hydrologic factors that can contribute to gully erosion were considered as predictor variables of gully erosion susceptibility. Based on an existing differential GPS survey inventory of gully erosion, a total of 191 eroded gullies were spatially randomly split in a 70:30 ratio for use in model calibration and validation, respectively. The models’ performance was assessed by calculating the area under the ROC curve (AUC). The findings indicate that the RF model exhibited the highest performance (AUC = 89%), followed by the SVM (AUC = 87%) and LR (AUC = 87%) models. Furthermore, the results highlight those factors such as NDVI, lithology, drainage, and density were the most influential, as determined by the RF, SVM, and LR methods. This study provides a valuable tool for enhancing the mapping of soil erosion and identifying the most important influencing factors that primarily cause soil deterioration in mountainous and semi-arid regions.
1 Introduction
Degradation of the soil is amongst of the world’s prevalent serious natural hazards, mainly in semi-arid regions (Bou-imajjane et al., 2020). Furthermore, it negatively affects soil quality, wreaking havoc on ecosystems, agriculture income, water availability and quality, and carbon reservoirs (Panos et al., 2015). Gully erosion (GE), which is foremost typical of soil erosion in semi-arid lands, is described as the eroding and washing away of the soil by a deep channel eroded by flowing surface water (Poesen et al., 2018). Gully means a deep and usually permanent channel with vertical walls on both sides. The generated gullies induce soil degradation, modify landforms and topography, and eventually lead to an abundance of river ramification, dam siltation, and land degradation. Over the past few decades, approximately one-third of the world’s cultivable land has been impacted by this phenomenon (Gupta et al., 2019). According to available literature, soil erosion has an annual impact on over ten million hectares of agricultural land, at a rate of approximately 43 Pg per year worldwide (Borrelli et al., 2020). As stated by the Food and Agriculture Organization (FAO), the economic ramifications of soil erosion are estimated to amount to a significant $1 billion loss (FAO, 2015). In Morocco, approximately 40% of the country’s land is impacted by soil erosion, with average annual loss rates ranging from 23 to 55 tons per hectare per year. In certain locations, the erosion reaches extreme levels, with values as high as 524 tons per hectare per year (Acharki et al., 2022). Moreover, agriculture serves as the primary livelihood for the inhabitants of Morocco’s mountainous regions. Unfortunately, these areas face significant challenges due to soil erosion, leading to a reduction in arable land, compromised water quality and quantity, and substantial economic and social consequences (Markhi et al., 2019). In relation to this matter, the Ahmed Elhansali watershed situated in the Moroccan High Atlas is among the regions profoundly affected by substantial soil degradation. This degradation can be attributed to the region’s intricate physical characteristics, including its elevated topography and steep slopes occupied by rocks exhibiting diverse properties. For this purpose, the qualitative aspects of gully erosion can be studied to predict the durability of hydraulic structures and to understand the geometry of the upper watershed and the downstream area (Castillo et al., 2007).
In recent decades, the modelling of gully erosion susceptibility has shown its usefulness in developing accurate maps of vulnerable areas, based on technological development and computer tools. Three main approaches were used: Expert knowledge-based methods, Statistical methods and Machine Learning methods. Among the most widely used expert-based methods are the hierarchical analytical process (AHP) and multi-criteria decision making (MCMD). The particularity of these approaches lies in the fact that they did not require an inventory of gully erosion locations (Arabameri et al., 2019), however they showed a general lack of accuracy in detecting areas susceptible to gully erosion (Eloudi et al., 2022). Statistical methods ranging from the most basic such as descriptive statistics (Sadeghi and Saeidi, 2010) bivariate such as frequency ratio (FR) (Meliho et al., 2018) to multivariate parametric models (i.e., logistic regression, boosted regression tree, etc.) are tested (Rahmati et al., 2016). Also, these models are easy to use and interpret (Magliulo, 2012). Nevertheless, traditional statistical approaches, exhibit certain limitations in detecting the link between geographical features and gully erosion rates on account of the establishment of pre-existing hypotheses (e.g., data distribution hypotheses). More recently, Machine Learning (ML) and Deep Learning (DL) methods have made significant contributions to gully erosion susceptibility modelling, such as Decision Tree (DT) (Lei et al., 2020), C5.0 (Catani et al., 2013; Oh and Lee, 2011; Eloudi et al., 2023), Support Vector Machine (SVM) (Aouragh et al., 2023), Naive Bayes (NB) (Lana et al., 2022) Logistic Regression (LR) (Were et al., 2023), Random Forest (RF) (Lei et al., 2020), Maximum Entropy (ME) (Tien Bui et al., 2019), Artificial Neural Networks (Anns) (Liu et al., 2023), Convolutional Neural Network (CNN) (Liu et al., 2023), Multilayer Perceptrons (MLPs) (Roy et al., 2022) and Particle Swarm Optimization (PSO) (Band et al., 2020). The findings showed that ML and DL models had a superior prediction performance of gully initiation points than traditional techniques (Conforti et al., 2011; Garosi et al., 2018).
Among these methods, three have been widely used in the literature, namely, RF, SVM and LR. In the majority of cases, their performance was excellent, and the susceptibility maps produced were highly accurate. For example, Lei et al., 2020 using the RF method obtained an (AUC = 0.893) in the Robat Turk watershed in Iran, Arabameri et al. (2019) obtained an AUC of 0.90 using the SVM method in the Golestan dam basin (Iran), and Bouramtane et al. (2022) an AUC of 0.86 using the LR method in southern Mato Grosso, Brazil. Even though these methods have proved highly effective, the modelling results differ not only between regions but even between different models, emphasizing that the outcomes of a model are specific to its particular case study (Azareh et al., 2019). For this reason, it is so important to test these powerful models in different case study environments, taking into account the varying importance of causal factors from one area to another, especially in the mountainous context.
In spatial prediction mapping, it is crucial to account for the many variables that may influence the growth and development of gullies. Numerous researchers have included factors that can influence the gully formation such as topographic, geologic, hydrologic and anthropogenic factors (Rahmati et al., 2017; Azareh et al., 2019). However, a review of the literature found that assessing the influence of geo-environmental conditioning factors (GECFs) and their impact on the performance of gully erosion vulnerability mapping (GEVM) should be examined further. This is especially important in areas where gully genesis is influenced by a variety of factors. Indeed, when the lithology is widely diversified and the topography is highly rugged, the human effect may be seen in soil deterioration and soil uses, in this case, further investigation into the various factors that influence the formation and development of gullies is required. Therefore, in order to develop optimized and effective models for the prediction of gully-vulnerable areas, it is necessary to identify and emphasize the contribution of each factor category to the effectiveness of the models. Furthermore, it is indeed acknowledged that the factors contributing to the formation of gullies have been extensively examined in certain regions. However, there is a considerable need for further investigation and exploration in numerous environmental contexts, especially in the southern Mediterranean areas overall and specifically in the Moroccan Atlas. In these regions, the influencing factors have only received limited attention. Therefore, this research aims to bridge this gap and shed light on these factors within a crucial area that amalgamates the mountainous and semi-arid characteristics of Mediterranean regions.
To serve this objective, this study makes a valuable contribution by proposing an approach that involves testing various categories of factors to identify the most pertinent ones for precise prediction mapping. As a result, the main objective of this research is to gain insight into the impact of selecting geo-environmental conditioning factors (GECFs) on the performance of ML models for spatially predicting Gully Erosion (GE) in an exceptionally intricate region. To fulfill our study goal, we employed twenty GECFs with a total of 191 gully inventory sites (191 for gully and 191 for non-gully), divided into training and testing datasets 70/30%. Then, the GECFs were categorized into the following 5 groups: topographic (elevation, aspect, slope, Slope Length (LS), curvature, profile curvature, plan curvature, convergence index, Stream power index (SPI), Terrain Roughness Index (TRI), Topographic Position Index (TPI)and Topographic Wetness Index (TWI)), hydrologic (drainage density and distance to rivers), geologic (lithology), anthropogenic (normalized difference vegetation index (NDVI), LULC and distance to roads), and climatic (rainfall). Then, three powerful ML models are used to evaluate the stability of the models with regard to the change of variables included in each modeling test. This research can provide important and significant answers in relation to the factors to be incorporated in soil erosion studies for specialists, policymakers, cartographers, and various stakeholders in the management of natural resources.
2 Materials and methods
2.1 Study area
The Ahmed Elhansali watershed is situated in the centre of Morocco, and is an integral part of the great basin of Oum Er-Rbiaa river (32°35′-33°N, 5°05′-5°50′W) (Figure 1). The area surrounded by mountainous terrain with structural features such as closed depressions, ravines, and accumulation forms, indeed, the relief is quite contrasted, with watersheds reaching extreme altitudes of 2400 m and medium to steep slopes. The geology of the region is complex with different lithotypes, such as liasic limestones and Trias formations that are primarily clayey and saliferous. The region is semi-arid to arid, with seasonal rainfall whose maximum is recorded in wintertime. Total precipitation fluctuates between 160mm and 790 mm and observed average temperatures vary from 4°C (January) to 35°C (July) (July-August) (El-Jazouli et al., 2019). The watershed is mostly covered by bare soil (56%), forest plantations (16%), cultivated land (12%), and grassland (12%). Physical, biological, and agronomic soil and water protection strategies and measures (such as dykes and dams) have been implemented in the watershed to reduce soil degradation.

FIGURE 1. Study region. (A) Geography situation of the investigated region in Morocco; (B) in the Oum Rabiaa 696 watershed; and (C) digital elevation model of the research region area.
All these features combine to make the chosen region a key area for understanding erosive processes and highlighting the importance of the factors that cause them. Indeed, the steep slopes, particularly upstream, combined with the friable Triassic clays, favor rapid and deep gully formation. Precipitation, which is generally concentrated in space and time in this semi-arid mountain climate, plays an additional role. As a result, Gully erosion has led to increased sediment production in the reservoir of the Ahmed El Hanssali dam (volume of sediments that attains the Ahmed El Hanssali dam in 2014 was around 76 MCM), which represents a source of drinking water and irrigation for the Tadla agricultural plain downstream and the surrounding cities, and is, therefore, a potential concern for the region’s water supply.
2.2 Methodology
This research applies an approach founded on combining statistical and ML models, remote sensing and GIS by using several conditioning factors; topographic, geological, geomorphological, hydrologic, climatic and anthropogenic; in order to understand the gully erosion problem and create prediction maps. The flowchart summarizes the study’s methodology (Figure 2). The following are the five steps: 1) Mapping of a gullies inventory and conditioning factors; 2) Identifying the spatial correlation between inventory data and factors; 4) ML models’ application and validation of the results; and finally 5) Producing of gully erosion vulnerability maps.
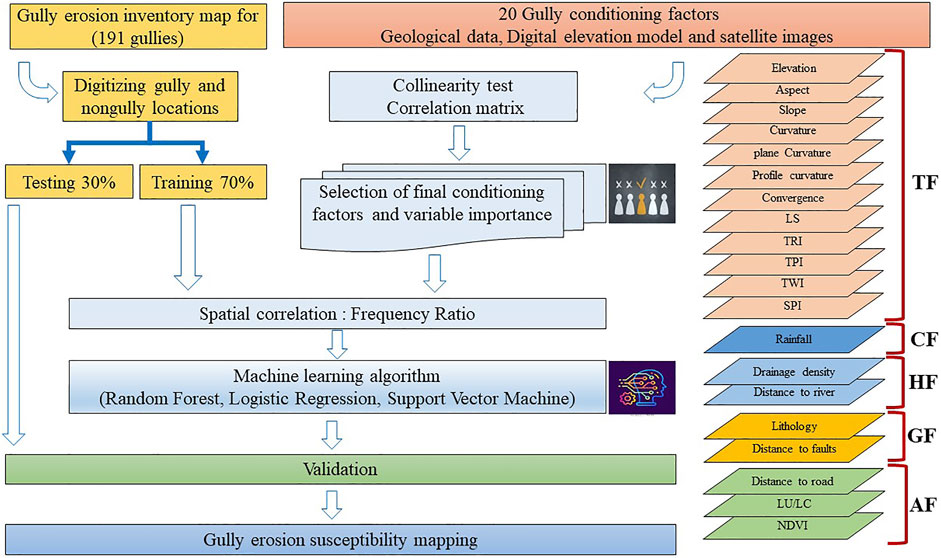
FIGURE 2. Flow chart of the methodology of the research. TF: Topographical factors; CF: Climatic factors; HF: Hydrological factors; GF: Geological factors; AF: Anthropogenic factors.
2.2.1 Inventory data
The inventory of the sites of gully erosion was created by combining field data through field missions conducted in 2020 using a global positioning system (Figure 3), and an analysis of Google Earth images. Then, 191 gully erosion locations were identified and located (Figures 1, 3). In addition, according to the literature, partitioning locations into gullies and non-gullies is essential for a reliable analysis process (Chaplot et al., 2005; Conoscenti et al., 2014; Rahmati et al., 2016). ML models frequently require two types of data to estimate gully vulnerability: the first should be typical of gully formation (positive occurrences), and the next should be characteristic of stable situations (negative occurrences) (Debanshi and Pal, 2020). In order to get a reliable result, it is suggested that the presence-to-absence ratio be equal to 1 (Süzen and Doyuran, 2004; Nefeslioglu et al., 2008a; Nefeslioglu et al., 2008b; Schicker and Moon, 2012; Rahmati et al., 2016). Non-gullied points are chosen at random and are located distant from gully points. While applying ML models, the data for testing must be different from the data for training (Lee et al., 2007). As a result, the data is typically separated in two groups: training and testing. Based on information from the literature, we found that around 70% of the training and validation subsets were randomly picked for training/calibration, and 30% for validation reasons (Debanshi and Pal, 2020). In addition.
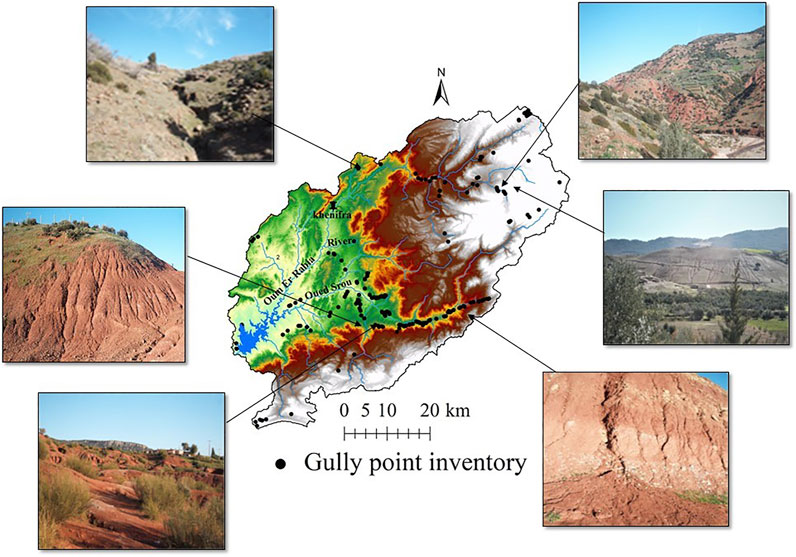
FIGURE 3. Field photographs illustrating some location of gullies in the studied area.
2.2.2 Analysis of conditioning factors
Various variables participate on gullies formation, including geological, hydrological, topographical, and anthropogenic factors (Avand et al., 2019), among which 20 were chosen to be included during modeling (Table 1; Figure 4). The multicollinearity test was performed on all 20 GECFs.
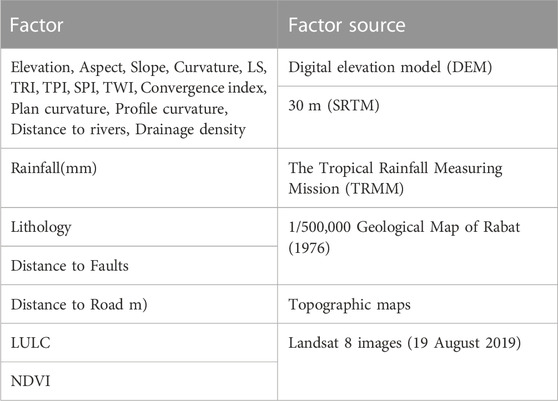
TABLE 1. Gully erosion conditioning factors sources.
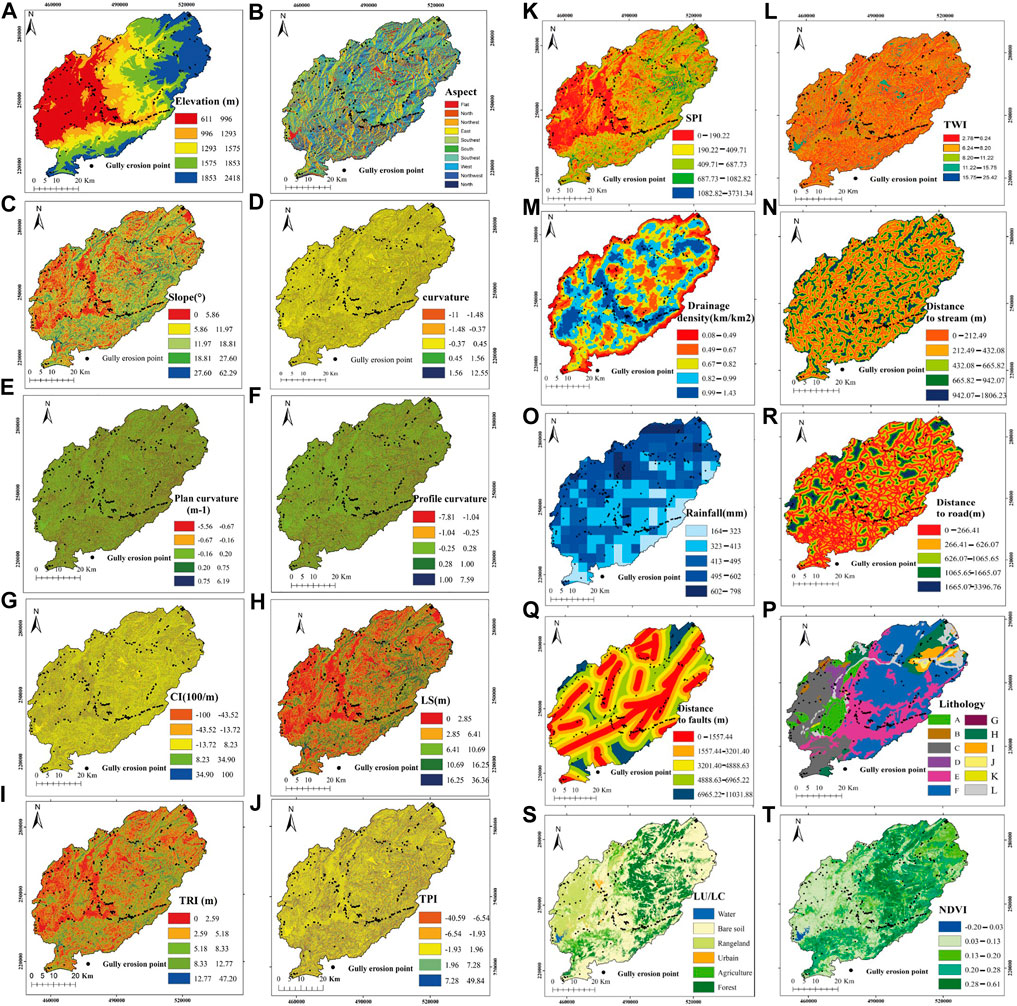
FIGURE 4. Maps of the factors considered in this research: (A) elevation, (B) aspect, (C) slope (°), (D) curvature, (E) plan of curvature, (F) profile of curvature, (G) convergence index, (H) LS, (I) TRI, (J) TPI, (K) SPI, (L) TWI, (M) precipitation, (N) lithology (A. Ordovician: Metamorphic rocks, B. Devonian: Metamorphic limestones, C. Upper Visean: Schists, D. Permian: Clays, Sandstones, E. Trias: Clays, Sandstones, F. Jurassic: Limestone, G. Jurassic: Jbel Hadid Rhyolites, H. Cretaceous: Red detrital facies and Marls, I. Eocene: Continental deposits, J. Miocene:Continental deposits, K. Pliocene: Continental deposits, L. Quaternany: Alluvium and scree), (O) drainage density, (P) distance to rivers, (Q) distance to roads, (R) distance to faults, (S) land cover, and (T) NDVI.
2.2.2.1 Collinearity test
Multi-collinearity exists if two or more explanatory variables have a perfect or nearly perfect linear correlation (Avand et al., 2019). The Variance Inflation Factor is one of the approaches for testing multicollinearity (VIF). The VIF is an easy-to-use and increasingly common measure of multicollinearity (Ghosh and Dey, 2021), which is based on the principle of assessing the explanatory ability of a given variable by the other variables in an equation. Therefore, high values (VIF>5) imply the presence of multicollinearity (Studenmund, 2000). The VIF is defined in Eq. 1
where, is the
In addition to VIF, a correlation matrix is utilized to group the correlations of multiple variables, with coefficients indicating the influence that the variables have on one another. The objective is to analyze and estimate the redundancy between conditioning factors and measure the degree of linear relationship between each pair of variables (Table 2) (Tenenhaus, 1998).

TABLE 2. Results if Multi-Collinearity analysis.
2.2.3 Spatial mapping of the gully erosion vulnerability
2.2.3.1 Spatial correlation
The bivariate statistical technique of frequency ratio (FR) was employed to investigate the relationships between ravine locations and various conditioning factors. The following equation is used to calculate FR (Pregibon, 1981; Carroll and Pederson, 1993):
The FR values obtained are normalized using the following formula:
FR = Each factor class frequency ratio value;
Max (FR) = maximum of all FR values;
Min (FR) = minimum of all FR values.
2.2.3.2 Random forests (RF)
RF represent a group of DT in which the values of a random vector are selected separately and evenly throughout all trees in the forest to calculate the value of each tree. As the total of trees within a forest increases, the overfitting approaches a limit. Therefore, the generalized error of a forest is reliant on the potential importance and correlation of the trees. Consequently, the error rate is deduced using a random selection of parameters to segregate each node. In order to control the inaccuracy, estimates are made of the model’s response to an rise in the number of considered factors in the investigation, as well as their relative relevance (Breiman, 1996).
Several hyperparameters must be determined before implementing random forest, including the overall amount of the forest’s trees (ntree), the number of factors selected at random at every node (mtry), the sample size (sampsize), in addition to the total potential number of each tree nodes (maxnodes).
2.2.3.3 Support Vector Machine (SVM)
SVM are ML techniques applicable to classification and regression problems. Their goal is to separate the data into classes using a separator called “boundary” that maximizes the distance between these classes, called “margin”. The optimal separation hyperplane is the Frontier that maximizes the margin. This “Frontier” assumption, however, assumes that the data are linearly separable, which is rarely the case. SVMs will thus move the data into a higher dimensional vector space to allow for better data separation (Mahesh, 2019).
2.2.3.4 Logistic regression (LR)
LR is among the most used techniques of multivariate statistics. It is employed to estimate the multivariate regression relationship between an explanatory variable and a number of independent ones. Variables may be continuous, categorical, or a composite of both (Mahesh, 2019). The primary objective of this study’s use of an LR method is to evaluate the correlations between gullies and causative factors via the following formulae (Pregibon, 1981; Carroll and Pederson, 1993):
Where:
LR is the manifestation probability of gullies.
Z is a linear sum of constants (-∞, +∞), calculated by the equation:
where:
2.2.3.5 Validation of results
In this analysis, we compare 3 ML techniques using the receiver operating curve (ROC) and the area under the curve (AUC) as a performance metric on two diagnostic testing and training datasets of water erosion by gullying in the Ahmed El Hanssali watershed, as well as the validation of results. In addition, several terms are commonly used to describe the sensitivity, specificity, and accuracy of performance measures of ML algorithms (Angileri et al., 2016). These are true positives values (TP), false positives values (FP), true negatives values (TN), and false negative values (FN). Then, performance measures are computed using the following formulas:
3 Results
3.1 Conducting multicollinearity analysis to evaluate the factors of influence
A factor analysis was performed to identify the utmost valuable conditioning factors and to reject those that had high multi-collinearity. The multi-collinearity tests revealed that the VIF values range from 1.115 for the Lithology factor to 8.599 for the LS factor (Table 1). Additionally, a high value is observed for the TRI factor (5.705). Nevertheless, the other components have values below 5, indicating that multicollinearity does not exist between these variables. The findings suggest that NDVI and Land Use are greatly correlated, and that slope, TRI, and LS are also highly correlated. Afterwards, TRI and LS were eliminated from the analysis based on the correlation matrix and VIF findings (VIF >5). Furthermore, a correlation matrix between conditioning factors was performed to test the redundancy of some factors in order to eliminate redundant ones and improve the analysis’ performance (Figure 5), and the efficiency of the methods was evaluated by reducing the used factors and comparing their linear correlation. After eliminating redundant factors (LS and TRI), it was found that there was no significant linear correlation (Figure 5).
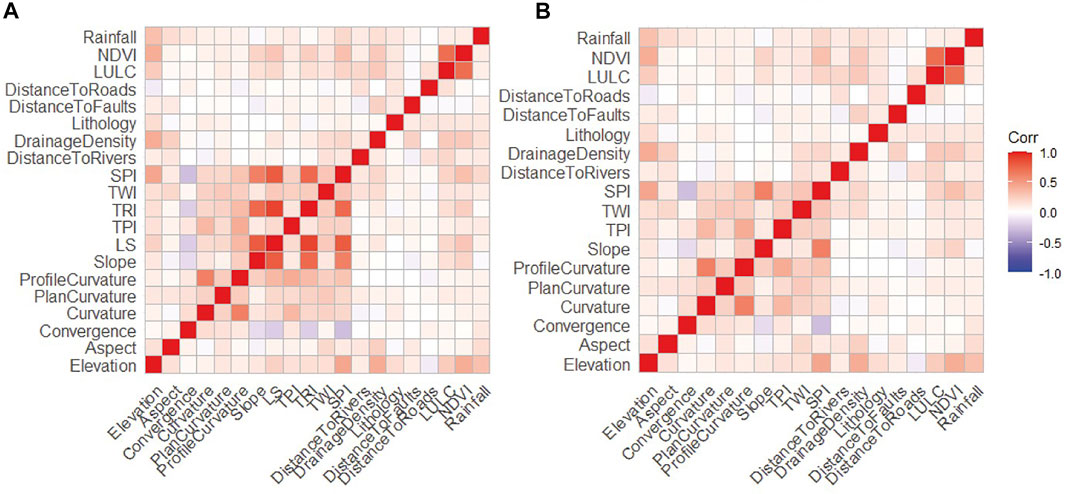
FIGURE 5. Correlation matrix of causative factors. (A) Existence of significant correlations (B) Non-existence of significant correlations after removing 2 factors (LS and TRI).
3.2 Spatial correlation using FR analysis
The frequency ratio (FR) approach was employed in this study to investigate the spatial correlation amongst each of the categories of variables and the gully erosion point, and each class of variables was given an appropriate weight (Lei et al., 2020). According to the analyses of FR results, GECF classes with FR > 1 are vulnerable to this type of erosion (Rahmati et al., 2017). The results of this correlation are presented in Figure 6. The results exposed that the factor class with the highest correlation is the TWI between 15.75 and 25.43 with the maximum value (FR = 2.97) follow-up by the lithological unit of Miocene continental deposits with (FR = 2.72), and the Flat Slope aspect (FR = 2.38). Among the greatest values are also Clays and Sandstones of the Triassic period (FR = 1.83), NDVI class of Bare soil (FR = 1.73), Southwest slope aspect (FR = 1.68), and located near to rivers (FR = 1.67). The lowest FR values (Fr = 0) are found on Devonian Metamorphic limestone, Jurassic Rhyolites, Pliocene Continental deposits (Lithology factor), Forest land and water (LULC), and areas with high NDVI values (>0.28). In addition, there is a negative correlation observed for the TPI, distance to rivers, LS, distance to roads, SPI, NDVI, and elevation factors. However, the correlation is positive for TWI and drainage density. These results show that topographical factors in addition to lithology appear to have the major controlling effect on the initiation of gullies in the region.
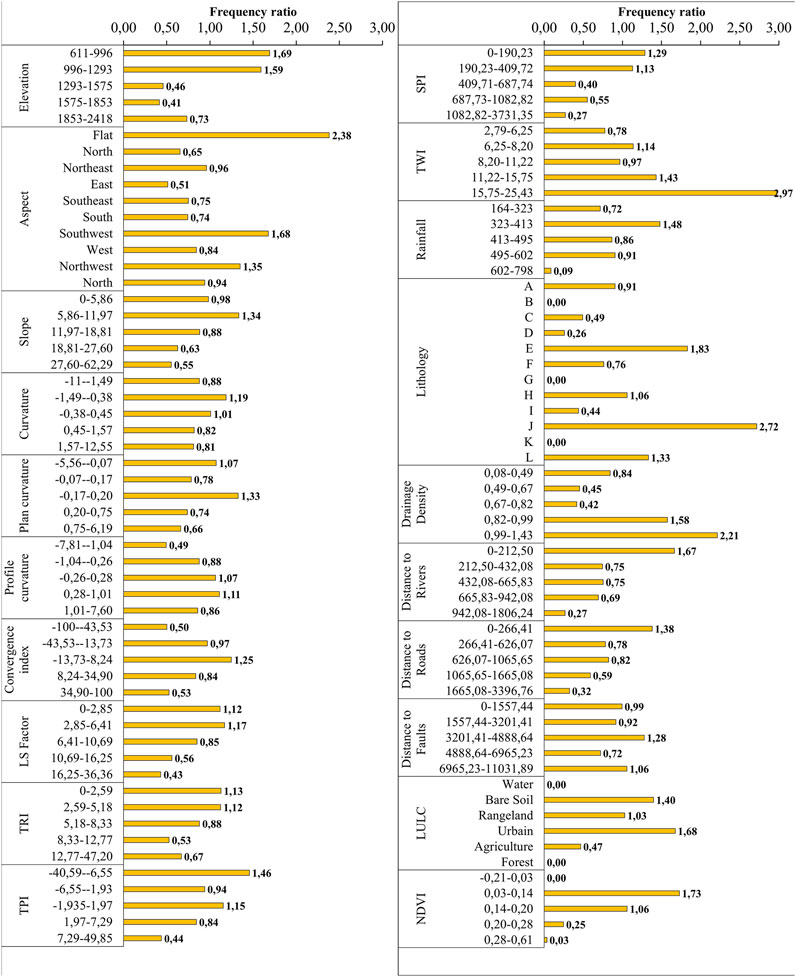
FIGURE 6. Results of FR statistic method.
3.3 Fcators relative importance
The GECF importance was performed by applying the 3 ML methods (RF, SVM and LR) (Figure 7). According to RF, the primary factors responsible for gully formation are NDVI, lithology, drainage density, LULC and SPI. Nonetheless, the least significant are TPI, TWI, distance to faults and curvature factors. According to the SVM results, the most significant factors are rainfall, lithology, NDVI, drainage density, and SPI. Curvature, distance to faults, and TWI are, however, the least significant. According to LR findings, NDVI has the greatest influence on gullies formation, followed by aspect, drainage density, distance to rivers, lithology, slope, distance to roads, plan curvature, convergence, rainfall, LULC, and SPI. All three methods highlighted the fact that several factors types collectively influence the development of gully erosion, namely, anthropogenic (NDVI), geology (Lithology), topography (Aspect) and hydrology (Drainage density).
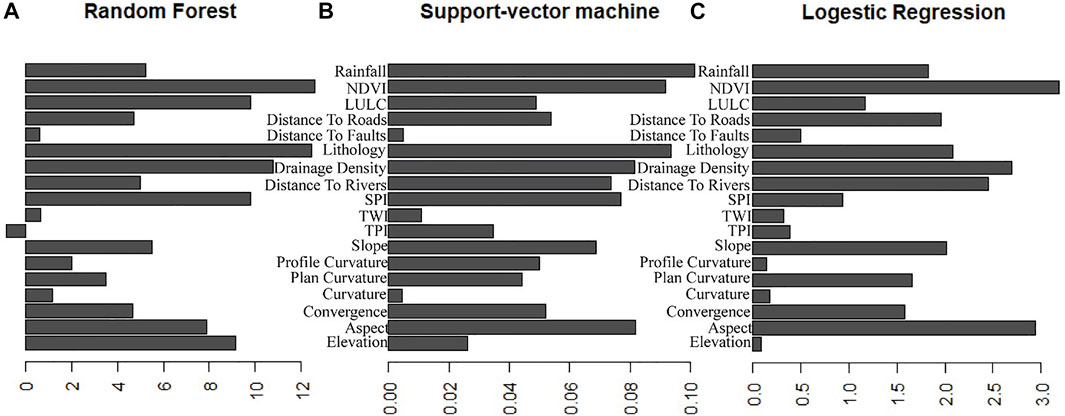
FIGURE 7. RF (A), SVM (B) and LR (C) analysis of the relative relevance of conditioning factors.
3.4 Model performace evaluation
In this study, using three well-known ML models, we were able to determine the effect of each category of causal factors on the detection of areas susceptible to gully erosion. After analyzing the input data, in particular the redundancy and multicollinearity of the factors, the different performances and stabilities of the models were tested by varying each time the categories of conditioning factors involved in the modeling. Topographical factors (elevation, convergence, aspect, slope, curvature, plan curvature, profile curvature, TWI, TPI, and SPI), hydrological factors (drainage density, distance to rivers), geological factors (distance to faults, lithology), and anthropogenic influences (distance to roads, LULC, and NDVI) are the four most important types of factors considered in this study. As a result, five tests were conducted, and for each, one category of factors was omitted to demonstrate its effect on the model’s performance and stability: test 1 (all factors included), test 2 (excluding topographical factors), test 3 (excluding hydrological factor), test 4 (excluding geological factor), and test 5 (excluding geological factor) (excluding anthropogenic factors). The first test is conducted with the set of variables as a reference to simplify comparison. Five metrics were utilized to evaluate the performance of various methods: ROC/AUC curve, Accuracy, Sensitivity, Specificity, Kappa index, and Specificity (Figures 8, 9).
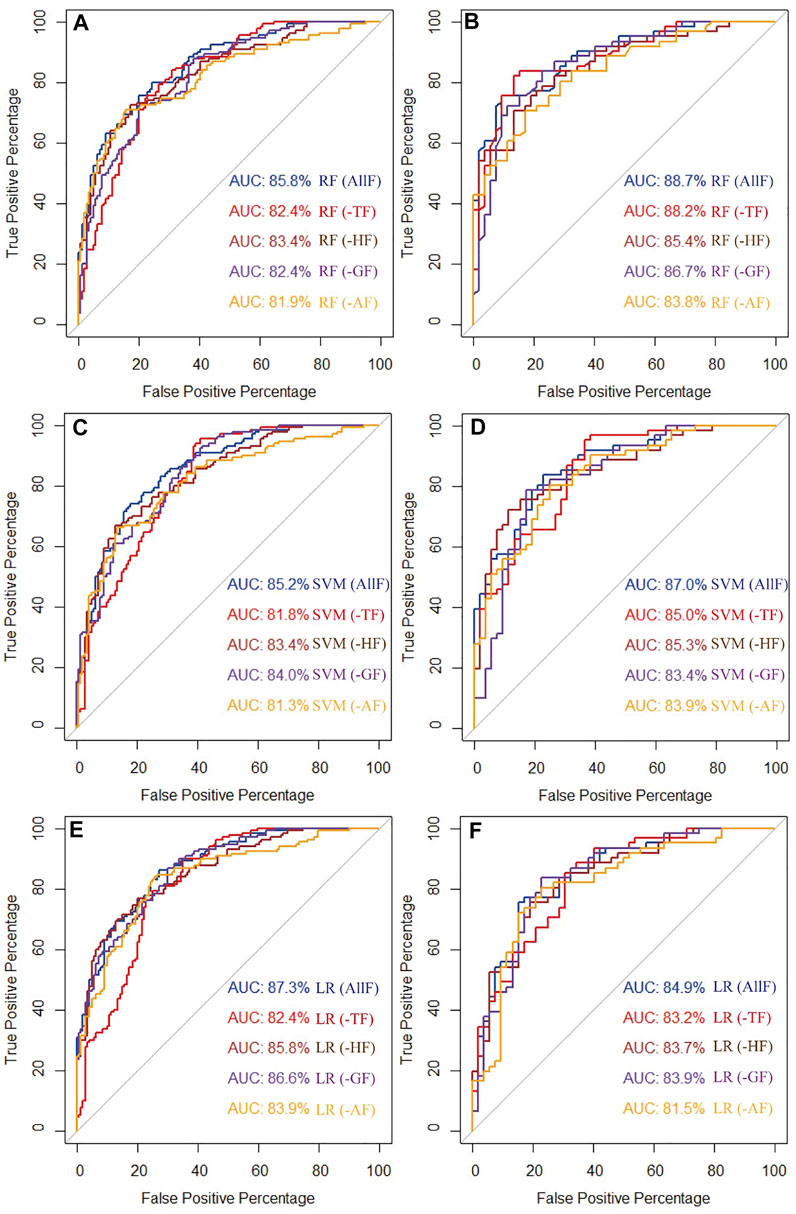
FIGURE 8. Comparison of ML models performance based on Accuracy, AUC, Specificity, Sensitivity, and Kappa. ALLF: all factors incorporated; -TF: excluding topographical factors; -HF: excluding hydrological factors; -GF: excluding geological factors; -AF: excluding anthropogenic factors.

FIGURE 9. Success and Prediction Rates of Different Models; (A) shows the success rate using the RF model, (C) shows the success rate using SVM, and (E) shows the success rate using LR. Similarly, (B) depicts the prediction rate using the RF model, (D) shows the prediction rate using SVM, and (F) shows the prediction rate using LR. Where ALLF: All factors incorporated; -TF: excluding topographical factors; -HF: Excluding hydrological factors; -GF: Excluding geological factors; -AF: Excluding anthropogenic factors.
In general, the evaluated models exhibited above-average precision (>80%) for success and prediction rate curves in all assessments. Using training data, the RF results (Figures 8A,B) reveal that including all factors in the analysis offers the greatest results (AUC = 85.8%), followed by eliminating hydrological factors (AUC = 83%). When anthropogenic effects are excluded, the AUC falls to 81%. Using testing data, the greatest values (>88%) are seen in the first two tests (1 and 2), but the RF performances are always drastically reduced when anthropogenic influences are omitted (81%). The results are nearly identical for the SVM model (Figures 8C,D), as the best performance is found when all factors are used in the modelling (85.2% in the training and 87% in the testing), but in this instance, the lowest value is recorded when geological (81.3%) and topographical (81.8%) factors are removed for the training data, and geological (83.4%) and anthropogenic (83.4%) factors are removed for the testing data. Finally, LR results (Figures 8E,F) indicate that maximum performance is always observed when all factors are considered (87.3% and 84.9% for training and testing data respectively), and that these results decline significantly when topographical (82.4% for training and 83.2% for testing) and anthropogenic (83.9% for training and 81.5% for testing) factors are excluded. In general, the results demonstrate that the RF algorithm achieved efficient results utilizing the validation data.
The comparison of ML models performance based on Accuracy, AUC, Specificity, Sensitivity, and Kappa is presented in Figure 9. The results clearly show that for training data, the LR model is more stable during modeling, in fact after elimination of anthropogenic and hydrological factors, accuracy and Kappa remained stable (0.77 and 054 successively). On the other hand, by eliminating topographical factors, specificity reached its maximum value (0.80), while maximum sensitivity was achieved by eliminating anthropogenic factors. More generally, the lowest performance is observed when topographical factors are eliminated, a fact that testifies to their importance in the mountain environment under investigation. However, the remaining models showed a more significant responsiveness to the elimination of factors. Indeed, the accuracy for the RF and SVM models decreased from 0.76 (RF) and 0.77 (SVM), when considering all factors, to 0.75 (RF) and 0.73 (SVM) after eliminating topographical, hydrological and geological factors, and only 0.74 (RF) and 0.72 after eliminating anthropogenic factors. Similarly, minimum specificity is found when anthropogenic factors are not taken into account (0.72 for Rf and 0.70 for SVM). For sensitivity, the SVM model shows a remarkable decrease from 0.71 when considering all factors to 0.66 after excluding geological or topographical factors, and the Kappa rises from 0.53 to 0.44 only when eliminating anthropogenic factors.
Based on the testing data, the RF model performs remarkably well compared to other models. The accuracy was close to 0.80 even after eliminating topographical and geological factors, and the specificity exceeded 0.86. Only anthropogenic factors had a major impact on this performance, by reducing accuracy to 0.74, specificity to 0.73 and Kappa to 0.49. However, the accuracy of the SVM model is more sensitive to the elimination of topographical factors, since the values decreased from 0.80 when considering all factors to 0.76 after eliminating geological, 0.75 hydrological, 0.74 anthropogenic and 0.70 topographical factors. Similarly, the accuracy values of the LR model fell to 0.72 after excluding topographical factors. We also note that the incorporation of topographical factors in the analysis remains to have a significant effect on modeling performance: for example, Kappa rises from 0.59 to 0.41 for SVM and from 0.53 to 0.44 for LR. In addition, sensitivity drops from 0.80 to 0.71 for SVM and from 0.76 to 0.69 for LR. Specificity drops from 0.78 to 0.70 and from 0.77 to 0.75 (for SVM and LR consecutively).
3.5 Generating susceptibility maps using RF, SVM, and LR models incorporating diverse factors
The maps of GEV were produced by the 3 ML methods (RF, SVM, and LR) in accordance with an approach designed to illustrate the influence of various types of factors on the modelling performance. Figures 10,11,12 show the GEV maps generated using the 3 ML methods (RF, SVM, and LR). The GEVM values were reclassified by the natural break (NB) technique into five categories: very low, low, moderate, high and very high. A higher index indicates that the location is greater vulnerable to gully erosion. The NB method, is a simple classification technique that defines the optimal distribution of values across distinct classes, this method was used in the classification of several environmental issues (Basofi et al., 2015; Kamal et al., 2015; Fariza et al., 2017).
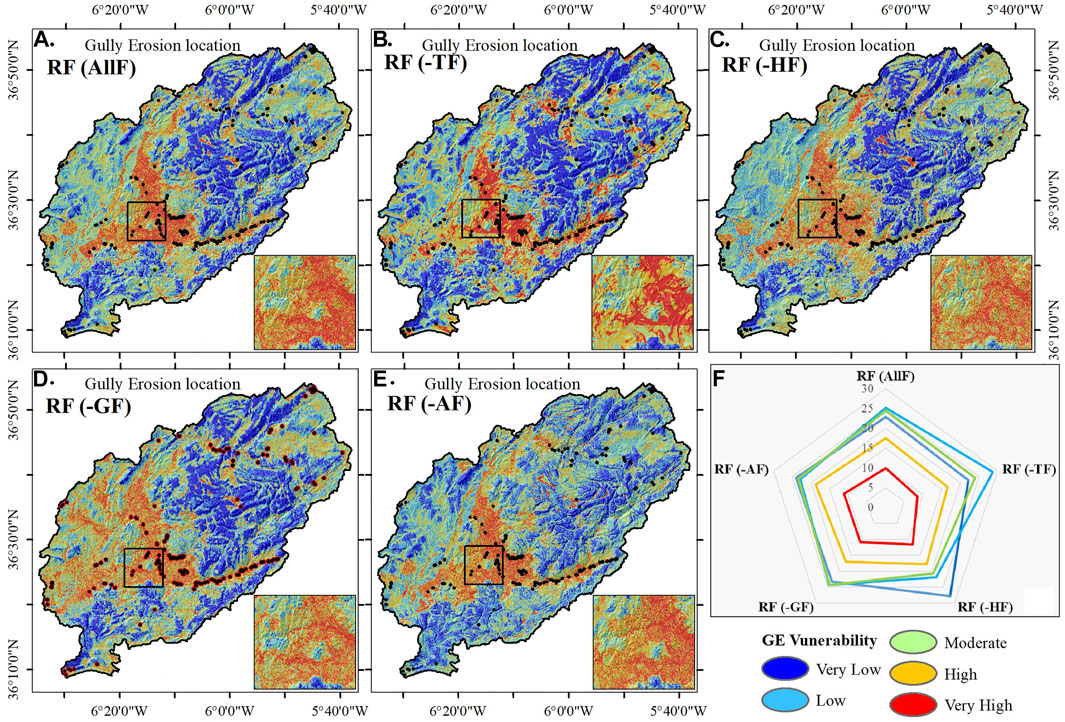
FIGURE 10. RF model-generated maps of gully erosion vulnerability (GEVM). (A) test 1: all factors incorporated; (B) test 2: excluding topographical factors (-TF); (C) excluding hydrological factors (-HF); (D) excluding geological factors (-GF); (E) excluding anthropogenic factors (-AF); and (F) Proportion of different GEVM classes.
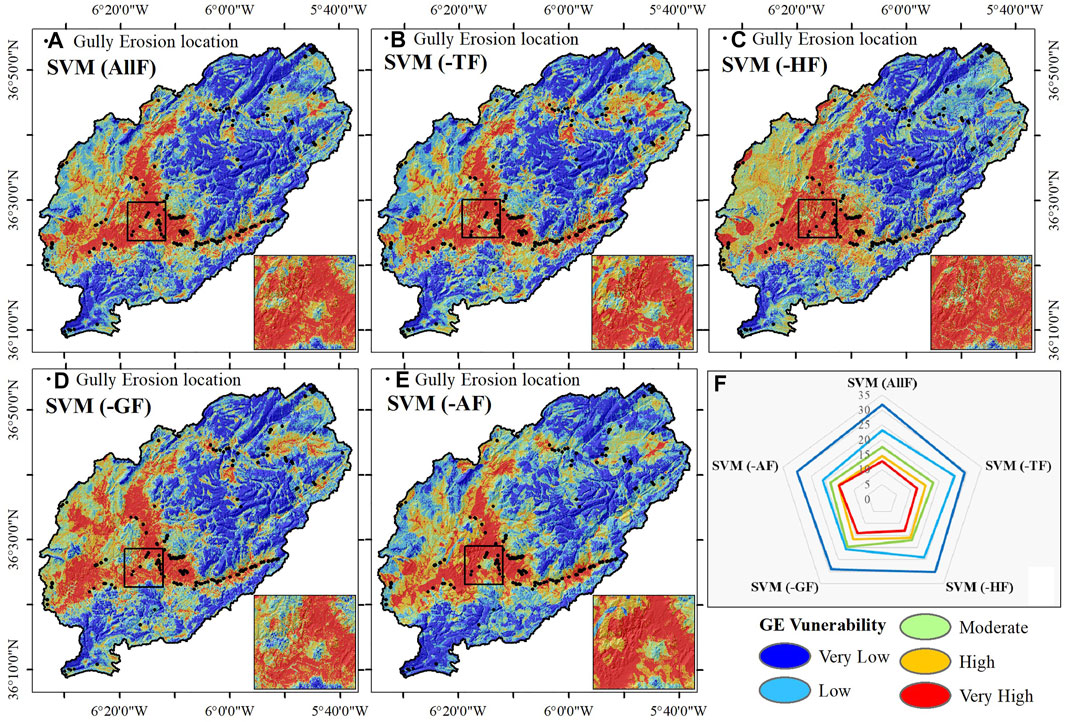
FIGURE 11. SVM model-generated maps of gully erosion vulnerability (GEVM). (A) test 1: all factors 721 incorporated; (B) test 2: excluding topographical factors (-TF); (C) excluding hydrological factors (-HF); (D) 722 excluding geological factors (-GF); (E) excluding anthropogenic factors (-AF); and (F) Proportion of different 723 GEVM classes.
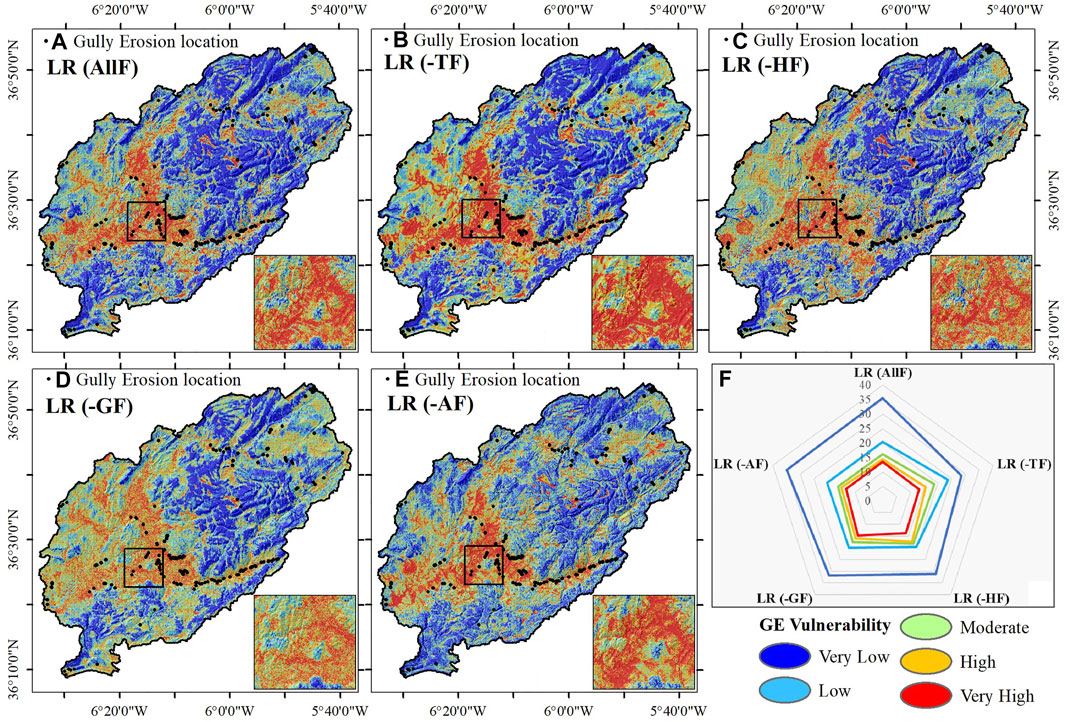
FIGURE 12. LR model-generated maps of gully erosion vulnerability (GEVM). (A) test 1: all factors incorporated; (B) test 2: excluding topographical factors (-TF); (C) excluding hydrological factors (-HF); (D) excluding geological factors (-GF); (E) excluding anthropogenic factors (-AF); and (F) Proportion of different classes.
The RF model results (Figure 10) reveal that the low class dominates the watershed area for four tests, including 25.24, 28.77, 24.42, and 22.83 percent of the total area for test 1, test 2, test 4, and test 5, respectively. Only the third test reveals a predominance of very low class (27.85%). However, the high class occupies around 17% of the total area for tests 1, 4, and 5, 16% for test 2, and 18% for test 5. Furthermore, the very high class occupies 9.94% (test 1), 8.56% (test 2), 11.69% (test 3), 10.88% (test 4) and 11.11% (test 5) of the total area. The SVM results (Figure 11) indicate that very low class predominates (31,76, 28,99, 30,19, 29,05 and 30,09% for tests 1, 2, 3, 4, and 5, respectively), followed by low class (23,19, 25,46, 23,95, 20,71, and 20,95% for tests 1, 2, 3, 4, and 5, respectively), moderate class (17,66% (test 1), 18,06% (test 2), 16,96% (test 3), 19,71% (test 4), and 18,24% (test 5), high class 14,52% (test 1), 15,28% (test 2), 16,02% (test 3), 16,48% (test 4), and 15,49% (test 5), and very high class reflect the lowest proportions by 12,87% (test 1), 12.21% (test 2), 12.88% (test 3), 14.04% (test 4), and 15.22% (test 5). Finally, the findings of the LR method (Figure 12) indicate that the extremely low classes predominate, accounting for more than 30 percent of the total area for all tests, except for test 2 (28%). Moreover, only 13 to 14 percent of the overall watershed area is occupied by very high class. Regarding the spatial distribution of vulnerability, all models and exploration of various tests of factor categories indicate that the most susceptible sites are situated in the watershed’s center and in the western regions, whereas the upstream portions, particularly those dominated by forests and dense vegetation, demonstrate the least vulnerability.
4 Discussion
The fundamental purpose of this research is to evaluate the efficiency of well-known ML methods (RF, SVM, and LR) in the predicting GE vulnerability under various types of conditioning factors in a semi-arid mountain environment. To accomplish this, we used 191 inventories location of GE and several categories of variables (20 factors) representing topographical, hydrological, geological, and anthropogenic influences on the formation and development of gullies have been examined. These factors’ collinearity was confirmed using statistical measures, specifically the VIF and the correlation matrix. As a result, in order to avoid redundancy issues and improve the performance of our models, we used the 18 factors in the final modeling phase. In addition, it is necessary to evaluate the relevance of factors to identify the most influential ones in gully formation. This enables the consideration of only the most relevant variables and the optimization of data processing effort. In this study, we used RF, SVM, and LR models to identify the factors importance. The results indicate that GE is primarily influenced by all kinds of factors, particularly anthropogenic influences (NDVI), geological factors (lithology), hydrological factors (drainage density and distance to rivers), topographical factors (Aspect, Slope, Elevation and SPI), and rainfall.
4.1 Geo-environmental factors consideration
The most of previous research identified topography as the fundamental determinant in the initiation and development of soil erosion, especially in mountainous environments. Elevation, Slope, Aspect, and SPI are identified as the four most influential topographical variables on gully development in the region. Indeed, altitudes below 1,000 m seem to be more subject to gully erosion due to a preference for liquid precipitation over solid precipitation at these low mountain altitudes. Comparable conclusions were made by Amiri et al. (2019) (Arabameri et al., 2019), who concluded that altitudes below 829 m were very susceptible to GE in the Mazandran Province of Iran. The FR results revealed that slopes inferior than 12° (as well as flates) have been the most probable gully locations. In general, greater soil depths characterize low slope locations (Zabihi et al., 2018), ensuring the development of deeper gullies, which further grow due to the increasing convergence of gullies downslope. Regarding slope aspect categories, southwest and northwest-facing slopes are the most susceptible to slope instability. This result is most likely explained by the effect of raindrops coming from the West and North-West most of the time (disturbance of Atlantic origin). Regarding the SPI, its spatial correlation with the inventory of gullies is really noticeable. This can be explained by the effect of this factor on runoff, as regions with high SPI values have a high concentration of runoff. The TWI index identifies regions where rainwater is expected to accumulate due to drainage depressions, then, TWI values are greater, the possibility of gullying increase (Arunbose et al., 2021). This confirms that the formation of channels and the development of gully tunnels is caused by a positive correlation using FR method between TWI values and the infiltration rate.
From a hydrological viewpoint, areas closer to a river are more susceptible to gully formation. This research found that sites just under 200 m from rivers were more prone to gully creation and development. Numerous investigations have demonstrated similar findings (Zabihi et al., 2018). Furthermore, Ollobarren Del Barrio et al. (2018) established that moisture-related factors have a direct impact on gully formation(Ollobarren Del Barrio et al., 2018). In this regard, our research has highlighted the significance of drainage density as a moisture-related factor by promoting the appearance of gullies using the three methods of RF, SVM, and LR calculations. In addition, using the potential erosion method (EPM), Oguchi, 1997 show that there is a high correlation between drainage density and water erosion (Oguchi, 1997). In this case, and according to the analysis of the five drainage density classes, there is a critical minimum value (=0.82) above which the effect of gullies becomes noticeable.
The vulnerability of gullies to erosion is controlled by the lithological features of the subsoil, particularly in less developed soil areas). Among the lithotypes most affected by gully formation are clays and sandstones and continental deposits. These findings could be interpreted by the erodibility of soil particles generated on clays. This outcome is in line with previous results of (Ollobarren Del Barrio et al., 2018) and Rahmati et al. (2017). In fact, when these formations are exposed to heavy rains, which degrade their structural stability, they become less compact and their cohesion rapidly weakens. However, the extremely dense magmatic and metamorphic formations mitigate the impact of surface processes by delaying gully excavation.
The NDVI, LULC, and distance to roads factors demonstrate that vegetation and human activities play a crucial impact in preventing or promoting GE. In general, Bare land and thinly vegetated places seem to be more likely to erode than woodlands, where foliage cover considerably reduces surface erosive action (Rahmati et al., 2017). The significance given here to the NDVI factor, which emphasizes the density of vegetation, clearly explains the high vulnerability obtained by the three models in areas without vegetation (class of bare soil) and the lower vulnerability limited to areas with more developed vegetation (forest area) upstream of the basin. This is due to the protective effect that the forest in particular and plants in general have on the soil. These results corroborate to those of Bennett and Wells, 2019 and Garosi and al. (2018) (Garosi et al., 2018; Bennett and Wells, 2019). Gully location was positively correlated with distances less than 266 m from roads, indicating that road construction operations and human activity in general have a significant impact on GE (Rahmati et al., 2017). It should be noted, however, that roads construction is often based on topographical considerations in mountainous regions, as it follows the valleys sculpted by rivers, which may result in a positive correlation that is connected to the distance to rivers rather than roads.
According to the literature review, extreme rainfall events provide energy for gully development and result in increased annual soil loss (Hamed et al., 2002). The annual rainfall analysis in our case shows that there is no significant positive correlation between rainfall and GE (FR method), which is due probably to a lack of instantaneous rainfall data of which extreme events are a major trigger, however, the effect is more pronounced when calculating the importance, indicating the significance of this factor in gully initiation, particularly when using the LR method. The classes with annual amounts between 323 and 413 mm were the most likely to cause gullying, according to the correlation with the spatial distribution of rainfall. This suggests that, while precipitation is important in ravine development, might not be the most key component. Similar findings have been discovered in locations with very similar climates, with lower precipitation values being positively correlated with gully development (Rahmati et al., 2017).
4.2 Modelling performance
The performance of modelling was evaluated using various metrics included ROC/AUC, Accuracy, Specificity, Sensitivity and Kappa index (Figure 9). The finding indicate that the RF model performed excellently in both training and testing dataset. In addition to this, the models exhibit a significant degree of sensitivity to the categorization of the factors. When training the model, the RF accuracy, AUC, and Kappa index all decrease when geological components are eliminated from the dataset; however, the specificity of the method is highly sensitive to the presence of anthropogenic factors (from 0.75 to 0.72). However, when tested, anthropogenic influences are found to have the greatest effect. In addition to anthropogenic and topographic influences, the performance of the SVM model is very sensitive to hydrological parameters. During testing, the exclusion of these variables significantly reduces the kappa index values from 0.59 to 0.50 and the sensitivity from 0.81 to 0.67. Despite the fact that it is least efficient model, the LR model exhibits greater stability than the other models, with the exception of topographical features that have a modest influence on the performance. In general, the model RF outperformed the other two models, the SVM and LR, in detecting prone areas to GE. These findings are in line with previous GE vulnerability assessment (Lee et al., 2007; Nicodemus, 2011), which has shown the RF model to be a strong and successful model. Additionally, RF’s predictive power in applications to some environmental problems has been confirmed by numerous scientists (Gomez and Kavzoglu, 2005; Pham et al., 2017; Shahab et al., 2020; Segoni et al., 2020).
5 Conclusion
Considering the disastrous character of GE, scientists and planners have concentrated on spatial vulnerability mapping and risk analysis of this phenomenon. In this study, we used RF, SVM, and LR methods for assessing the effect of geo-environmental factors on GE and identifying vulnerable locations. Twenty gully conditioning factors were used: elevation, slope, aspect, plan of curvature, profile of curvature, convergence index, TWI, TPI, precipitation, drainage density, distance to rivers, roads and faults, lithology, land use, NDVI, curvature, SPI, TRI, and LS. However, the prediction of GE using these models revealed that utilizing all eighteen non-collinear variables provided the maximum level of precision and performance. In terms of model performance, it was found that RF and SVM have the best performance compared to LR. In addition, approximately 10 percent of the study area, according to RF, and over 12 percent, according to SVM and LR, are extremely vulnerable to GE and require immediate intervention.
In our case, the topographical, geological, and anthropogenic factors have the most influence on the detection precision of vulnerable areas. Thus, this complex phenomenon is more frequently influenced by topographical factors like SPI, Aspect, and slope. However, when anthropogenic variables are considered, NDVI takes priority over the other factors. Additionally, lithology has a significant impact on where vulnerable areas are located. These findings add significantly to our understanding of soil erosion in mountainous regions generally and in the Mediterranean context specifically. Finally, the results show that it is preferable to incorporate the maximum of factors and to take into account each type when modelling gully erosion, especially in the mountainous region.
Data availability statement
The raw data supporting the conclusions of this article will be made available by the authors, without undue reservation.
Author contributions
Conceptualization, FA and MN; Data curation, FA, SK, BP, AE, HE, MuO, and MN; Formal analysis, FA, BP, AE, MI, MaO, and MN; Funding acquisition, FA and MN; Investigation, AE and HE; Methodology, MN; Resources, AE, KA, HE, MuO, and MaO; Software, FA, MI, HE, and MN; Supervision, SK; Validation, SK, BP, MI, and MN; Visualization, BP, MI, KA, MuO, and MaO; Writing–original draft, FA; Writing–review and editing, SK, BP, AE, MI, KA, and HE. All authors contributed to the article and approved the submitted version.
Funding
This article is funded by Researchers Supporting Project number (RSP 2023R351), King Saud University, Riyadh, Saudi Arabia.
Acknowledgments
Deep thanks and gratitude to the Researchers Supporting Project number (RSP 2023R351), King Saud University, Riyadh, Saudi Arabia for funding this re-search article.
Conflict of interest
The authors declare that the research was conducted in the absence of any commercial or financial relationships that could be construed as a potential conflict of interest.
Publisher’s note
All claims expressed in this article are solely those of the authors and do not necessarily represent those of their affiliated organizations, or those of the publisher, the editors and the reviewers. Any product that may be evaluated in this article, or claim that may be made by its manufacturer, is not guaranteed or endorsed by the publisher.
Abbreviations
AF, Anthropogenic Factors; Anns, Artificial Neural Networks; CF, Climatic Factors; CNN, Convolutional Neural Network; DL, Deep Learning; DT, Decision Tree; FR, Frequency Ratio; GE, Gully Erosion; GECFs, Geoenvironmental Conditioning Factors; GEVM, Gully Erosion Vulnerability Mapping; GF, Geological Factors; GIS, Geographical Information Systems; HF, Hydrological Factors; LR, Logistic Regression; LS, Slope Length; LULC, LandUse/LandCover; ML, Machine Learning; MLPs, Multilayer Perceptrons; NB, Naive Bayes; NDVI, Normalized Difference Vegetation Index; PSO, Particle Swarm Optimization; RF, Random Forest; SPI, Stream Power Index; SVM, Support Vector Machine; TF, Topographical Factors; TOL, Tolerance; TPI, Topographic Position Index; TRI, Terrain Roughness Index; TWI, Topographic Wetness Index; VIF, Variance Inflation Factors.
References
Acharki, S., El Qorchi, F., Arjdal, Y., Amharref, M., Bernoussi, A. S., Aissa, H. B., et al. (2022). Soil erosion assessment in Northwestern Morocco. Remote Sens. Appl.: Soc. Environ. 25, 100663. doi:10.1016/j.rsase.2021.100663
Amiri, M., Pourghasemi, H. R., Ghanbarian, G. A., and Afzali, S. F. (2019). Assessment of the importance of gully erosion effective factors using Boruta algorithm and its spatial modeling and mapping using three machine learning algorithms. Geoderma 340, 55–69. doi:10.1016/j.geoderma.2018.12.042
Angileri, S. E., Conoscenti, C., Hochschild, V., Märker, M., Rotigliano, E., and Agnesi, V. (2016). Water erosion susceptibility mapping by applying stochastic gradient treeboost to the Imera Meridionale river basin (Sicily, Italy). Geomorphology 262, 61–76. doi:10.1016/j.geomorph.2016.03.018
Aouragh, M. H., Ijlil, S., Essahlaoui, N., Essahlaoui, A., El Hmaidi, A., El Ouali, A., et al. (2023). Remote sensing and GIS-based machine learning models for spatial gully erosion prediction: A case study of rdat watershed in sebou basin, Morocco. Remote Sens. Appl. Soc. Environ. 30, 100939. doi:10.1016/j.rsase.2023.100939
Arabameri, A., Rezaei, K., Cerdà, A., Conoscenti, C., and Kalantari, Z. (2019). A comparison of statistical methods and multi-criteria decision making to map flood hazard susceptibility in Northern Iran. Sci. Total Environ. 660, 443–458. doi:10.1016/j.scitotenv.2019.01.021
Arunbose, S., Srinivas, Y., Rajkumar, S., Nair, N. C., and Kaliraj, S. (2021). Remote sensing, GIS and AHP techniques based investigation of groundwater potential zones in the Karumeniyar river basin, Tamil Nadu, southern India. Groundw. Sustain. Dev. 14, 100586. doi:10.1016/j.gsd.2021.100586
Avand, M., Janizadeh, S., Naghibi, S. A., Pourghasemi, H. R., Khosrobeigi Bozchaloei, S., and Blaschke, T. (2019). A comparative assessment of random forest and k-nearest neighbor classifiers for gully erosion susceptibility mapping. Water 11 (10), 2076. doi:10.3390/w11102076
Azareh, A., Rahmati, O., Rafiei-Sardooi, E., Sankey, J. B., Lee, S., Shahabi, H., et al. (2019). Modelling gully-erosion susceptibility in a semi-arid region, Iran: Investigation of applicability of certainty factor and maximum entropy models. Sci. Total Environ. 655, 684–696. doi:10.1016/j.scitotenv.2018.11.235
Band, S. S., Janizadeh, S., Chandra Pal, S., Saha, A., Chakrabortty, R., Shokri, M., et al. (2020). Novel ensemble approach of deep learning neural network (DLNN) model and particle swarm optimization (PSO) algorithm for prediction of gully erosion susceptibility. Sensors 20 (19), 5609. doi:10.3390/s20195609
Basofi, A., Fariza, A., Ahsan, A. S., and Kamal, I. M. (2015). “A comparison between natural and head/tail breaks in lsi (landslide susceptibility index) classification for landslide susceptibility mapping: A case study in ponorogo, east java, Indonesia,” in International Conference on Science in Information Technology (ICSITech), Yogyakarta, Indonesia, 27-28 October 2015 (IEEE), 337–342.
Bennett, S. J., and Wells, R. R. (2019). Gully erosion processes, disciplinary fragmentation, and technological innovation. Earth Surf. Process. landforms 44 (1), 46–53. doi:10.1002/esp.4522
Borrelli, P., Robinson, D. A., Panagos, P., Lugato, E., Yang, J. E., Alewell, C., et al. (2020). Land use and climate change impacts on global soil erosion by water (2015-2070). Proc. Natl. Acad. Sci. 117 (36), 21994–22001. doi:10.1073/pnas.2001403117
Bou-imajjane, L., Belfoul, M. A., Elkadiri, R., and Stokes, M. (2020). Soil erosion assessment in a semi-arid environment: A case study from the argana corridor, Morocco. Environ. Earth Sci. 79, 409–414. doi:10.1007/s12665-020-09127-8
Bouramtane, T., Hilal, H., Rezende-Filho, A. T., Bouramtane, K., Barbiero, L., Abraham, S., et al. (2022). Mapping gully erosion variability and susceptibility using remote sensing, multivariate statistical analysis, and machine learning in South Mato Grosso, Brazil. Geosciences 12 (6), 235. doi:10.3390/geosciences12060235
Carroll, R. J., and Pederson, S. (1993). On robustness in the logistic regression model. J. R. Stat. Soc. Ser. B Methodol. 55 (3), 693–706. doi:10.1111/j.2517-6161.1993.tb01934.x
Castillo, V. M., Mosch, W. M., García, C. C., Barberá, G. G., Cano, J. N., and López-Bermúdez, F. (2007). Effectiveness and geomorphological impacts of check dams for soil erosion control in a semiarid Mediterranean catchment: El Cárcavo (Murcia, Spain). Catena 70 (3), 416–427. doi:10.1016/j.catena.2006.11.009
Catani, F., Lagomarsino, D., Segoni, S., and Tofani, V. (2013). Landslide susceptibility estimation by random forests technique: Sensitivity and scaling issues. Nat. Hazards Earth Syst. Sci. 13, 2815–2831. doi:10.5194/nhess-13-2815-2013
Chaplot, V., Le Brozec, E. C., Silvera, N., and Valentin, C. (2005). Spatial and temporal assessment of linear erosion in catchments under sloping lands of northern Laos. Catena 63 (2-3), 167–184. doi:10.1016/j.catena.2005.06.003
Conforti, M., Aucelli, P. P. C., Robustelli, G., and Scarciglia, F. (2011). Geomorphology and GIS analysis for mapping gully erosion susceptibility in the Turbolo stream catchment (Northern Calabria, Italy). Nat. Hazards 56 (3), 881–898. doi:10.1007/s11069-010-9598-2
Conoscenti, C., Angileri, S., Cappadonia, C., Rotigliano, E., Agnesi, V., and Märker, M. (2014). Gully erosion susceptibility assessment by means of GIS-based logistic regression: A case of sicily (Italy). Geomorphology 204, 399–411. doi:10.1016/j.geomorph.2013.08.021
Debanshi, S., and Pal, S. (2020). Assessing gully erosion susceptibility in Mayurakshi river basin of eastern India. Environ. Dev. Sustain. 22, 883–914. doi:10.1007/s10668-018-0224-x
El Jazouli, A., Barakat, A., Khellouk, R., Rais, J., and El Baghdadi, M. (2019). Remote sensing and GIS techniques for prediction of land use land cover change effects on soil erosion in the high basin of the Oum Er Rbia River (Morocco). Remote Sens. Appl. Soc. Environ. 13, 361–374. doi:10.1016/j.rsase.2018.12.004
Eloudi, H., Hssaisoune, M., Reddad, H., Namous, M., Ismaili, M., Krimissa, S., et al. (2023). Robustness of optimized decision tree-based machine learning models to map gully erosion vulnerability. Soil Syst. 7 (2), 50. doi:10.3390/soilsystems7020050
Eloudi, H., Reddad, H., Hssaisoune, M., Estrany, J., Krimissa, S., Elaloui, A., et al. (2022). Assessing the performance of MCDM, statistical and machine learning ensemble models for gully sensitivity mapping in a semi-arid context. Geocarto Int. 37, 17435–17464. doi:10.1080/10106049.2022.2129818
FAO (2015). Status of the world’s soil resources (SWSR)—main report. Food and agriculture Organization of the United Nations and Intergovernmental Technical Panel on soils, Rome, Italy. Available at: http://www.fao.org/3/a-i5199e.pdf.
Fariza, A., Rusydi, I., Hasim, J. A. N., and Basofi, A. (2017). “Spatial flood risk mapping in east java, Indonesia, using analytic hierarchy process—natural breaks classification,” in 2nd International conferences on Information Technology, Information Systems and Electrical Engineering (ICITISEE), Yogyakarta, Indonesia, 01-02 November 2017 (IEEE), 406–411.
Garosi, Y., Sheklabadi, M., Pourghasemi, H. R., Besalatpour, A. A., Conoscenti, C., and Van Oost, K. (2018). Comparison of differences in resolution and sources of controlling factors for gully erosion susceptibility mapping. Geoderma 330, 65–78. doi:10.1016/j.geoderma.2018.05.027
Ghosh, A., and Dey, P. (2021). Flood severity assessment of the coastal tract situated between muriganga and saptamukhi estuaries of sundarban delta of India using frequency ratio (FR), fuzzy logic (FL), logistic regression (LR) and random forest (RF) models. Regional Stud. Mar. Sci. 42, 101624. doi:10.1016/j.rsma.2021.101624
Gomez, H., and Kavzoglu, T. (2005). Assessment of shallow landslide susceptibility using artificial neural networks in Jabonosa River Basin, Venezuela. Venezuela. Eng. Geol. 78 (1-2), 11–27. doi:10.1016/j.enggeo.2004.10.004
Gupta, A. K., Rudra, R. P., Gharabaghi, B., Daggupati, P., Goel, P. K., Shukla, R., et al. (2019). CoBAGNPS: A toolbox for simulating water and sediment control basin, WASCoB through AGNPS model. Catena 179, 49–65. doi:10.1016/j.catena.2019.02.003
Hamed, Y., Albergel, J., Pépin, Y., Asseline, J., Nasri, S., Zante, P., et al. (2002). Comparison between rainfall simulator erosion and observed reservoir sedimentation in an erosion-sensitive semiarid catchment. Catena 50 (1), 1–16. doi:10.1016/S0341-8162(02)00089-9
Kamal, I. M., Fariza, A., and Basofi, A. (2015). “Assessment of landslide susceptibility area in ponorogo, east java, Indonesia using analytical hierarchy process and natural breaks classification assessment of landslide susceptibility area in ponorogo, east java, Indonesia using analytical hierarchy,” in Proc. Of in the fourth Indonesian-Japanese conference on knowledge creation and intelligent computing (Surabaya: KCIC), 25–26.
Lana, J. C., Castro, P. D., and Lana, C. E. (2022). Assessing gully erosion susceptibility and its conditioning factors in southeastern Brazil using machine learning algorithms and bivariate statistical methods: A regional approach. Geomorphology 402, 108159. doi:10.1016/j.geomorph.2022.108159
Lee, S., Ryu, J.-H., and Kim, I.-S. (2007). Landslide susceptibility analysis and its verification using likelihood ratio, logistic regression, and artificial neural network models: Case study of youngin, korea. Landslides 4 (4), 327–338. doi:10.1007/s10346-007-0088-x
Lei, X., Chen, W., Avand, M., Janizadeh, S., Kariminejad, N., Shahabi, H., et al. (2020). GIS-based machine learning algorithms for gully erosion susceptibility mapping in a semi-arid region of Iran. Remote Sens. 12, 2478. doi:10.3390/rs12152478
Liu, C., Fan, H., Jiang, Y., Ma, R., and Song, S. (2023b). Gully erosion susceptibility assessment based on machine learning-A case study of watersheds in Tuquan County in the black soil region of Northeast China. CATENA 222, 106798. doi:10.1016/j.catena.2022.106798
Liu, G., Arabameri, A., Santosh, M., and Nalivan, O. A. (2023a). Optimizing machine learning algorithms for spatial prediction of gully erosion susceptibility with four training scenarios. Environ. Sci. Pollut. Res. 30 (16), 46979–46996. doi:10.1007/s11356-022-25090-2
Magliulo, P. (2012). Assessing the susceptibility to water-induced soil erosion using a geomorphological, bivariate statistics-based approach. Environ. earth Sci. 67, 1801–1820. doi:10.1007/s12665-012-1634-y
Mahesh, B. (2019). Machine learning algorithms-a review. Int. J. Sci. Res. (IJSR). 9, 381–386. doi:10.21275/ART20203995
Markhi, A., Laftouhi, N., Grusson, Y., and Soulaimani, A. (2019). Assessment of potential soil erosion and sediment yield in the semi-arid N′ fis basin (High Atlas, Morocco) using the SWAT model. Acta Geophys. 67, 263–272. doi:10.1007/s11600-019-00251-z
Meliho, M., Khattabi, A., and Mhammdi, N. (2018). A GIS-based approach for gully erosion susceptibility modelling using bivariate statistics methods in the Ourika watershed, Morocco. Environ. Earth Sci. 77, 655–714. doi:10.1007/s12665-018-7844-1
Nefeslioglu, H. A., Duman, T. Y., and Durmaz, S. (2008a). Landslide susceptibility mapping for a part of tectonic kelkit valley (eastern black sea region of Turkey). Geomorphology 94 (3-4), 401–418. doi:10.1016/j.geomorph.2006.10.036
Nefeslioglu, H. A., Gokceoglu, C., and Sonmez, H. (2008b). An assessment on the use of logistic regression and artificial neural networks with different sampling strategies for the preparation of landslide susceptibility maps. Eng. Geol. 97 (3-4), 171–191. doi:10.1016/j.enggeo.2008.01.004
Nicodemus, K. K. (2011). Letter to the Editor: On the stability and ranking of predictors from random forest variable importance measures. Briefings Bioinforma. 12 (4), 369–373. doi:10.1093/bib/bbr016
Oguchi, T. (1997). Drainage density and relative relief in humid steep mountains with frequent slope failure. J. Br. Geomorphol. Group 22 (2), 107–120. doi:10.1002/(SICI)1096-9837(199702)22:2<107::AID-ESP680>3.0.CO;2-U
Oh, H. J., and Lee, S. (2011). Integration of ground subsidence hazard maps of abandoned coal mines in Samcheok, Korea. Int. J. Coal Geol. 86 (1), 58–72. doi:10.1016/j.coal.2010.11.009
Ollobarren Del Barrio, P., Campo-Bescós, M. A., Giménez, R., and Casalí, J. (2018). Assessment of soil factors controlling ephemeral gully erosion on agricultural fields. Earth Surf. Process. Landforms 43 (9), 1993–2008. doi:10.1002/esp.4347
Panos, P., Pasquale, B., Jean, P., Cristiano, B., Emanuele, L., Katrin, M., et al. (2015). The new assessment of soil loss by water erosion in Europe. Environ. Sci. Policy 54, 438–447. doi:10.1016/j.envsci.2015.08.012
Pham, B. T., Bui, D. T., Dholakia, M. B., Prakash, I., Pham, H. V., Mehmood, K., et al. (2017). A novel ensemble classifier of rotation forest and Naïve Bayer for landslide susceptibility assessment at the Luc Yen district, Yen Bai Province (Viet Nam) using GIS. Geomatics, Nat. Hazards Risk 8 (2), 649–671. doi:10.1080/19475705.2016.1255667
Poesen, J., Vanwalleghem, T., and Deckers, J. (2018). “Gullies and closed depressions in the loess belt: Scars of human–environment interactions,” in Landscapes and landforms of Belgium and Luxembourg (Belgium: Springer International Publishing), 253–267. doi:10.1007/978-3-319-58239-9_15
Pregibon, D. (1981). Logistic regression diagnostics. Ann. statistics 9 (4), 705–724. doi:10.1214/aos/1176345513
Rahmati, O., Haghizadeh, A., Pourghasemi, H. R., and Noormohamadi, F. (2016). Gully erosion susceptibility mapping: The role of GIS-based bivariate statistical models and their comparison. Nat. Hazards 82, 1231–1258. doi:10.1007/s11069-016-2239-7
Rahmati, O., Tahmasebipour, N., Haghizadeh, A., Pourghasemi, H. R., and Feizizadeh, B. (2017). Evaluation of different machine learning models for predicting and mapping the susceptibility of gully erosion. Geomorphology 298, 118–137. doi:10.1016/j.geomorph.2017.09.006
Roy, P., Pal, S. C., Janizadeh, S., Chakrabortty, R., Islam, A. R. M. T., Chowdhuri, I., et al. (2022). Evaluation of climate change impacts on future gully erosion using deep learning and soft computational approaches. Geocarto Int. 37 (26), 12709–12745. doi:10.1080/10106049.2022.2071473
Sadeghi, S. H., and Saeidi, P. (2010). Reliability of sediment rating curves for a deciduous forest watershed in Iran. Hydrological Sci. J. 55 (5), 821–831. doi:10.1080/02626667.2010.489797
Schicker, R., and Moon, V. (2012). Comparison of bivariate and multivariate statistical approaches in landslide susceptibility mapping at a regional scale. Geomorphology 161, 40–57. doi:10.1016/j.geomorph.2012.03.036
Segoni, S., Pappafico, G., Luti, T., and Catani, F. (2020). Landslide susceptibility assessment in complex geological settings: Sensitivity to geological information and insights on its parameterization. Landslides 17, 2443–2453. doi:10.1007/s10346-019-01340-2
Shahab, S. B., Saeid, J., Subodh, C. P., Asish, S., Rabin, C., Assefa, M. M., et al. (2020). Flash flood susceptibility modeling using new approaches of hybrid and ensemble tree-based machine learning algorithms. Remote Sens. 12 (21), 3568. doi:10.3390/rs12213568
Süzen, M. L., and Doyuran, V. (2004). A comparison of the GIS based landslide susceptibility assessment methods: Multivariate versus bivariate. Environ. Geol. 45, 665–679. doi:10.1007/s00254-003-0917-8
Tien Bui, D., Shirzadi, A., Shahabi, H., Chapi, K., Omidavr, E., Pham, B. T., et al. (2019). A novel ensemble artificial intelligence approach for gully erosion mapping in a semi-arid watershed (Iran). Sensors 19, 2444. doi:10.3390/s19112444
Were, K., Kebeney, S., Churu, H., Mutio, J. M., Njoroge, R., Mugaa, D., et al. (2023). Spatial prediction and mapping of gully erosion susceptibility using machine learning techniques in a degraded semi-arid region of Kenya. Land 12 (4), 890. doi:10.3390/land12040890
Keywords: gully erosion vulnerability, machine learning, conditioning factors, Ahmed El Hanssali watershed, mountainous region, vulnerability mapping, El Hanssali watershed
Citation: Aboutaib F, Krimissa S, Pradhan B, Elaloui A, Ismaili M, Abdelrahman K, Eloudi H, Ouayah M, Ourribane M and Namous M (2023) Evaluating the effectiveness and robustness of machine learning models with varied geo-environmental factors for determining vulnerability to water flow-induced gully erosion. Front. Environ. Sci. 11:1207027. doi: 10.3389/fenvs.2023.1207027
Received: 17 April 2023; Accepted: 26 June 2023;
Published: 18 July 2023.
Edited by:
Dominika Dąbrowska, University of Silesia in Katowice, PolandCopyright © 2023 Aboutaib, Krimissa, Pradhan, Elaloui, Ismaili, Abdelrahman, Eloudi, Ouayah, Ourribane and Namous. This is an open-access article distributed under the terms of the Creative Commons Attribution License (CC BY). The use, distribution or reproduction in other forums is permitted, provided the original author(s) and the copyright owner(s) are credited and that the original publication in this journal is cited, in accordance with accepted academic practice. No use, distribution or reproduction is permitted which does not comply with these terms.
*Correspondence: Maryem Ismaili, maryem.ismaili@usms.ma