Spatial pattern of land use along the terrain gradient of Qinghai Tibet Plateau: a case study of Qiangtang Plateau, China
 Kai Bian
 Lihua Tan3*
  Yulong Shen
- 1MOE Engineering Center of Desertification and Blown-sand Control, Beijing Normal University, Beijing, China
- 2State Key Laboratory of Earth Surface Processes and Resource Ecology, Beijing Normal University, Beijing, China
- 3Faculty of Geographical Science, Beijing Normal University, Beijing, China
- 4School of Geography and Environmental Sciences, Zhejiang Normal University, Jinhua, China
Understanding the land use and land cover (LULC) pattern of the Qinghai Tibet Plateau in China is crucial to support the structural and functional integrity of the ecological barrier of the plateau. This information has significant implications not only for the ecological environment and regional development of the plateau but also for the broader environmental impact at regional and global levels. It is critical to comprehend the spatial pattern and ascertain the underlying causes of land use and land cover in significant areas of the Qinghai Tibet Plateau. This can enable the formulation and implementation of context-specific policies and measures that can contribute to enhancing the ecological security barrier function of the plateau. This study focused on the core area of the Qinghai Tibet Plateau - the Qiangtang Plateau. Based on surface cover data from 2020 and ASTER GDEMV3 data, distribution indices and geographic detectors were used to explore the quantitative impact of land use/cover spatial patterns and terrain factors on land use/cover spatial distribution. The results showed the following: 1) The land use/cover space of the Qiangtang Plateau was dominated by grassland and bare land. Specifically, grassland had the greatest area, accounting for approximately 63.94% of the plateau area and covering an area of 449,983 km2. Grassland was widely distributed in most areas of the plateau. Bare land was the second-largest land cover type, with an area of 186,302 km2, accounting for 26.47% of the plateau area. Bare land was primarily located in the western and northern parts of the plateau. 2) The spatial differentiation of land use/cover in the Qiangtang Plateau was significant. Grasslands were primarily distributed in low mountainous areas characterized by high relief, gentle slopes, and low roughness. In contrast, bare land was mainly distributed in low mountainous areas with high relief, steep slopes, and low roughness. 3) The main drivers of the spatial distribution of land use/cover on the Qiangtang Plateau were elevation, roughness, and relief. Moreover, the interactions between these three terrain factors and other environmental variables significantly influenced the land use/cover pattern in the study area.
1 Introduction
As a complex entity of nature and the social economy, land is an indispensable basic element of human production and life (Chen et al., 2013). It is the basic means of production for agricultural production and the labor means of labor for social production. It is also an important factor affecting the structure and function of ecosystems, which are of great significance for human survival and development (Schomberg et al., 2005; Zhong, et al., 2012). Since the 1990s, land use/cover change research has become a popular Frontier field in global environmental change and sustainable development (Verburg et al., 1999; Yu and Yang, 2002; Lu et al., 2005). It is also a core issue of modern geographical research (Su, et al., 2012; Guo, et al., 2013).
Land use patterns can reflect the spatial distribution of various land use types and are the spatial projection of land use types and land use structures (Song and Wang, 2017). The land use pattern is subject to the comprehensive influence of natural factors and various human activities, among which the terrain factor is important in the natural environment (Sun et al., 2014; Gong et al., 2013; Song et al., 2015). Its changes affect the biological, hydrological and energy processes of the Earth’s surface and to some extent determine the basic framework of geographical elements such as regional population, hydrology, geology and land use types (Zhang et al., 2013). As the most fundamental natural element, the terrain determines the choice of direction and type of land use, and thus determining land use; as a result, the land use pattern shows characteristics of gradient changes in the horizontal and vertical directions (Yang et al., 2005; Verburg et al., 1999; Ispikoudis et al., 1993). The influence of land surface morphology on land use/cover change is a hot topic in land use/cover change research (Liu et al., 2018). The important topographic factors of land resources, such as elevation, slope and slope direction, are the basic factors affecting land use and distribution (Mottet et al., 2006) and play leading roles in the formation of land use/cover. In topographically dominated mountain and hill systems, the vertical gradient of land use landscape change is approximately 1,000 times greater than the horizontal gradient and contains rich ecological and geographic information (Lauer, 1993; Korner, 2007). Many types of agricultural land and construction land that are highly disturbed by human activities are distributed in areas with a low altitude and a low urban degree, while woodland and grassland, which are less disturbed by human activities, are more commonly distributed in areas with a high altitude and a large slope (Shen et al., 2011).
In-depth research on the relationship between land use/cover distribution patterns and topographic factors is helpful to discover the spatial distribution law of land use and the relationship between human activities and environmental factors (Di et al., 2015), and this information is of great significance for regional land use planning and agricultural structure adjustment (Liu and Li, 2015). Domestic and foreign scholars have conducted many studies on the relationship between topographic features and land use/cover (Chen et al., 2020; Zang et al., 2019), and commonly used methods include spatial overlay analysis (Wang et al., 2018), land use/cover transfer change analysis (Zang et al., 2019), and the selection of comprehensive topographic factors such as elevation, slope, aspect, relief and topographic position index. The changes in land use/cover on different topographic gradients in special topographic areas (Huang et al., 2003), river basins (Wang et al., 2018) and agricultural areas (Zhou et al., 2020) have been analyzed. Most of the existing studies selected topographic factors from the perspective of qualitative analysis, focusing on the analysis of the spatial distribution characteristics of land use/cover on the topographic gradient. However, the topographic factors selected in previous studies, such as elevation, topographic relief, slope, surface roughness and topographic position index, can all be used to represent the macro-surface relief shape. Existing studies lack a quantitative analysis of the effect of these topographic factors on the spatial distribution of land use/cover.
The Qinghai-Tibet Plateau is known as the “world house reputation” and the “third pole of the Earth”. Its unique natural pattern and rich ecosystem play an important role in protecting the ecological security and stability of China and even East Asia (Sun et al., 2012). In recent years, with global climate change and the intensification of human activities, the ecological environment and ecological security of the Qinghai-Tibet Plateau have been under great pressure (Zhang et al., 2013). Land use and land cover change (LUCC) is an important field of global change research. Approximately 1/3–1/2 of the Earth’s surface land use/cover is altered by land use (Millennium Ecosystem Assessment, 2005). LUCC has become an important part and main driving force of global environmental change. The pattern of land use land cover (LULC) on the Qinghai-Tibet Plateau is an important basis for supporting the structure and function of the plateau ecological barrier, which not only affects the ecological environmental status and regional development of the plateau itself but also has a very large environmental impact on the region and the world (Zhang et al., 2014; Zhang et al., 2017). Its vast area leads to great differences in internal natural conditions and resource use. It is necessary to understand and grasp the spatial pattern and causes of land use/cover in key areas of the Qinghai-Tibet Plateau and implement policies and measures according to local conditions. There is an urgent need to improve the function of the ecological safety barrier on the Qinghai-Tibet Plateau (Zhang et al., 2013).
The Qiangtang Plateau, as the main part of the Qinghai-Tibet Plateau, has attracted much attention from scholars due to its special geographical location, cold and dry climatic conditions and fragile grassland ecosystem (Song et al., 2012; Wang et al., 2007; Gao et al., 2005) In recent years, under the dual influence of climate change and human activities, profound changes have occurred and affected the structure and function of the Qinghai-Tibet Plateau ecosystem as well as in the population number and structure of important species (Zhang et al., 2015). Problems such as grassland degradation, worsening desertification, glacier retreat and lake expansion have become increasingly prominent. They not only directly threaten local livestock husbandry production and the security of our ecological barriers but also seriously affect the sustainable development of grassland ecosystems (Wang et al., 2013; Gao et al., 2010). As one of the major pastoral areas in China, the Qiangtang Plateau is the main animal husbandry production base in Tibet and a key area for the construction of ecological security barriers in Tibet and even the whole country. Therefore, a series of negative impacts caused by the degradation of its ecological system function have become a bottleneck affecting local economic and social development. Moreover, this degradation poses a great challenge to the construction of ecological security barriers (Xu and Chen, 2016). Currently, land use/cover studies in the Qinghai-Tibet Plateau have been concentrated in urban areas that are highly affected by human activities (Feng et al., 2012; Chu et al., 2010) and some ecologically fragile areas, such as the Sanjiangyuan area (Zhao et al., 2010) and Qaidam area (Ma et al., 2018), while relatively few studies have been conducted in the Qiangtang Plateau region.
Therefore, using open source land cover data and the terrain factor classification system (Zhang et al., 2013), this study aimed to explore the effect of the topographic relief gradient on the spatial distribution of land use/cover in the Qiangtang Plateau by using the distribution index method and quantitatively analyze the degree of influence of different terrain factors on the spatial distribution of land use/cover by using the geographic detector method. It can provide a scientific basis for the selection of terrain factors for regional topographic geomorphology and land use/cover research.
2 Materials and methods
2.1 Study area
The Qiangtang Plateau, located in the hinterland of the Tibetan Plateau, consists mainly of low mountains and gentle hills and wide valleys in the lake basin (Figure 1). Its terrain is high in the northwest and low in the southeast, with an average elevation of 4,800 m. It is the highest and most typical plateau in the Qinghai-Tibet Plateau region (Chen and Fan, 1983), and it is known as “the roof of the roof of the world” and has the highest terrain in China. Due to its harsh environment, extreme cold, and anoxic conditions, the Qiangtang Plateau region has long been referred to as “no man’s land” (Xu and Zuo, 2020; Du et al., 2021). The Qiangtang Plateau is dotted with numerous lakes, covering an area of more than 2 × 10⁴ km2, and these lakes account for 48% of the total lake area of the Qinghai-Tibet Plateau, making it one of the regions with the largest and most concentrated lake area in China (Ma et al., 2011). The region has strong solar radiation, low temperature, and large annual and daily temperature ranges. The mean annual temperature is typically below 0°C, and the temperature decreases from the southwest to the northeast of the plateau. There is little interannual variation in precipitation, and the dry and wet seasons are distinct. More than 80% of the precipitation is concentrated from June to September, which is representative of a typical plateau monsoon climate (De Ji Y.Z., 2022). This area is an important area with strong wind in China, and the annual average number of days with strong in all regions is more than 80 days, the highest of which is 164.5 days; however, the maximum number of days in some years in certain regions is 284 days (Dong, 2001). Precipitation mainly comes in the form of solid precipitation, such as snow, graupel, and hail, and the plateau experiences strong winds and high frequency winds (Hao, 2021). In general, the area is sparsely populated, and the scope and scale of human activities are limited. The natural conditions are poor, and the ecological environment is fragile, which is demonstrated by the cold, dry, windy climate, surface-covered sand, and sparse and low vegetation.
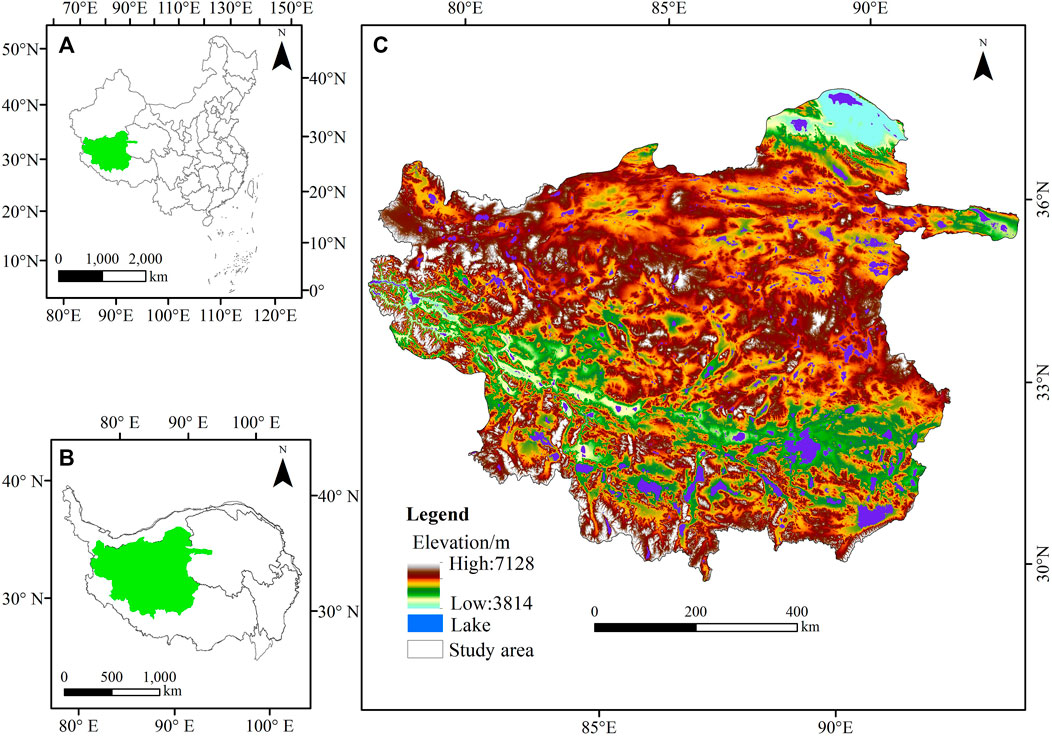
FIGURE 1. Sketch map of the Qiangtang Plateau (C) and its location in China (A) and the Qinghai Tibet Plateau (B).
2.2 Data description
The land use/cover data used in this study were obtained from the Global Land Cover Data 2020 Edition (Globeland 30) with a resolution of 30 m published by the National Basic Geographic Information Center. The spatial distribution data of land use/cover types in the Qiangtang Plateau were obtained by using ArcGIS10.7 software for clipping, projection conversion and reclassification (Figure 2).
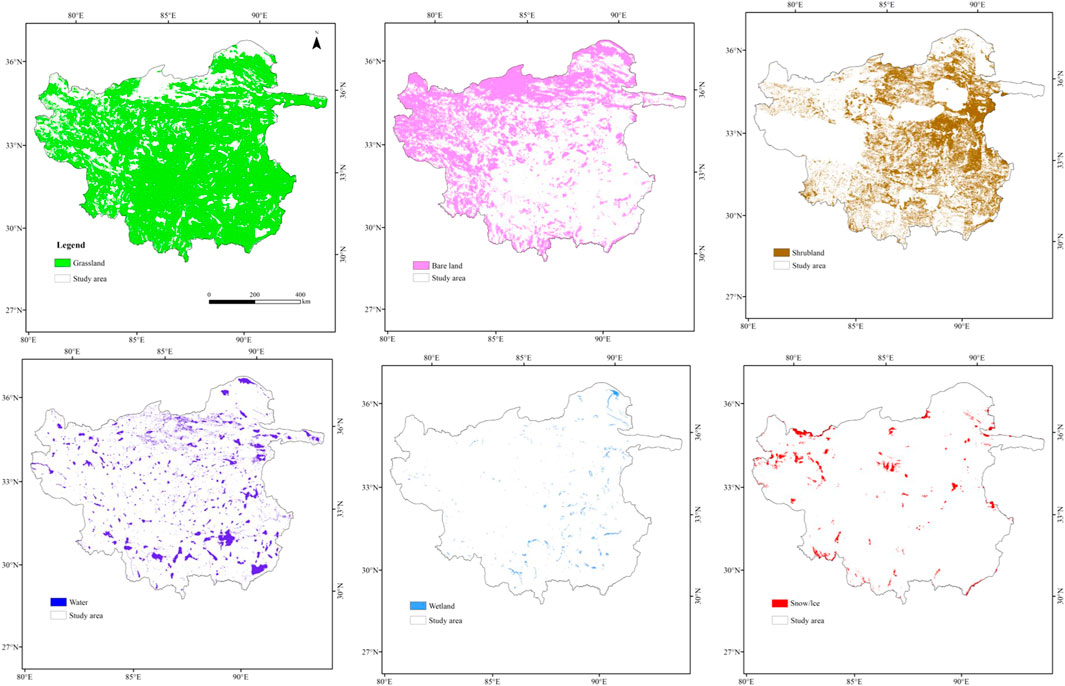
FIGURE 2. Spatial distribution of land use/cover in the Qiangtang Plateau.
The DEM data were obtained from the US National Aeronautics and Space Administration (NASA, http://reverb.echo.nasa.gov/reverb/) Advanced Spaceborne Thermal Emission and Reflection Radiometer Global Digital Elevation Model (ASTERGDEM) and had a resolution of 30 m. The dataset was processed using ArcGIS10.7 software for inlay, clipping and resampling. DEM data were generated for the study area, and the elevation, slope, and aspect of the Qiangtang Plateau were extracted using ArcGIS 10.7 software (Figure 1).
The topographic data were obtained from ASTER GDEM V3 with a spatial resolution of approximately 30 m. ArcGIS10.7 software was used to obtain the topographic data of the Qiangtang Plateau through resampling, clipping and projection conversion.
2.3 Terrain factor extraction
Based on the existing classification system of terrain factors (Zhang, 2013), this study selected common terrain factors reflecting topographic relief. Using ASTERGDEM V3 data, the five terrain factors of elevation, slope, relief, surface roughness and topographic position index were extracted for terrain analysis using the raster calculator and neighborhood analysis tools in ArcGIS.
2.3.1 Relief
Relief can describe the macro-topographic changes in a region based on the size of the control unit and is widely used in habitability assessment (Tang et al., 2019), natural disaster assessment (Liu et al., 2001), topographic and geomorphic classification (Zhou et al., 2009), and other fields. The calculation formula is as follows:
where R is the topographic relief of the region; Maxheight is the maximum elevation in the region; and Minheight is the minimum elevation in the region.
The extraction of relief needs to determine the best research unit of the study area, and the current mainstream extraction method is mean change point analysis (Chen et al., 2016; Feng et al., 2020). In this paper, this method was used to extract the relief of the Tibetan Plateau through the best analysis window of 41 × 41 (Feng et al., 2020).
2.3.2 Surface roughness
The surface roughness of large macro areas is generally represented by the ratio of the real surface area
Formula R = 1/cos (slope) is usually used to obtain the regional surface roughness.
2.3.3 Terrain position index
The terrain slope reflects the spatial distribution characteristics of environmental elements such as elevation, slope, aspect, topographic relief, and terrain position. Elevation and slope represent the absolute height and the degree of steepness of the surface unit, respectively. The terrain position index (TPI) comprehensively describes the elevation and slope of a region and can be used to quantitatively analyze the ecological environmental characteristics and landscape pattern changes under different terrain conditions. The calculation formula is as follows:
where TPI is the topographic position index, Q and Q0 are the elevation of a point and the average elevation m) of the study area, respectively, and P and P0 are the slope of a point and the average slope (°) of the study area, respectively. The smaller the elevation and slope are, the smaller the topographic index and vice versa. The formula above was input into the Raster Calculator function of the Spatial Analyst module of ArcGIS10.7 to obtain the results.
2.4 Terrain factor classification
Topographic factors include elevation, slope and relief. The ArcGIS spatial analysis function was used to generate slope and surface relief data for the study area from the DEM data, and then the topographic factors were graded. As the elevation of the study area is greater than 3,800 m, to better reflect the characteristics of land use/cover distribution changes with elevation, the equal interval division method in ArcGIS was applied to select the elevation difference of 500 m as the first level and divide the elevation of the study area into five levels (Table 1). The slope gradient was divided according to the relevant classification standards (Zhou et al., 2009) and was successively divided into five levels: <2°, 2°–6°, 6°–15°, 15°–25° and >25°. Since the topographic relief of the study area ranges from 0 to 408 m, the classification standard of China 1:1 million digital geomorphic mapping and the existing studies referred to (Zhou et al., 2009; Feng et al., 2020). The relief of the study area was successively divided into four levels: 0–30 m, 30–200 m, 200–400 m, 400–600 m and above 600 m. The roughness and TPI were classified according to the natural breakpoint method (Jenks) (Table 1). The spatial resolution of the topographic data was 30 m, and the coordinates were in the WGS-1984 coordinate system. The terrain layers were ordered from small to large.
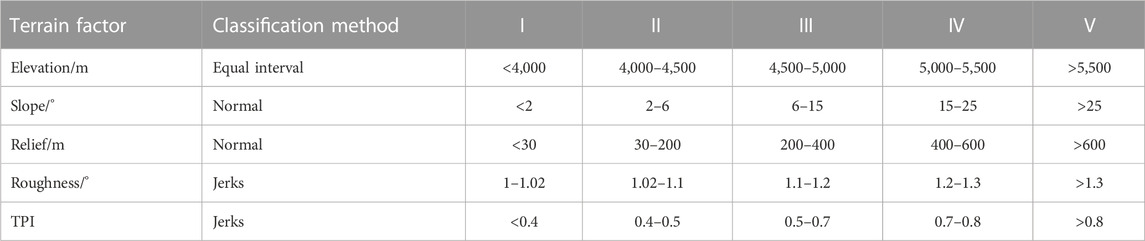
TABLE 1. Classification and classification method of terrain factors.
2.5 Methods
2.5.1 Terrain distribution index
The response of the ecological environment to LULC changes can vary due to different terrain gradient sections and different area scales. The terrain distribution index (TDI) can effectively eliminate this effect. To describe the probability distribution of different response types on each terrain gradient, the following calculation formula is used (Ha et al., 2015):
where TDI is the terrain distribution index; Sna is the area of land use transfer of type n under a given level of terrain factors; Sn is the total land use area of type n in the study area; Sa is the area of a terrain factor at a given level; and S is the total area of the study area. The TDI is a standardized and dimensionless index; a higher value indicates higher dominance. If TDI >1, land use transfer occupies the dominant position under the classification of terrain factors; otherwise, it does not occupy the dominant position.
2.5.2 Geographic detector model
The geographic detector model is a statistical method proposed by Wang and Xu. (2017) to detect spatial differentiation and explain the driving force behind it. In addition to identifying the contribution rate of a single factor, it can be used to identify the interactions between multiple factors, including factor detection, interaction detection, risk detection and ecological detection (Zhang et al., 2020). The first two detectors were used in this study.
(1) Factor detector. Factor detection is used to analyze the influence of the trend of each influencing factor on the spatial differentiation of LUCC. LUCC was taken as the dependent variable, and each factor was taken as the independent variable, with its magnitude measured by the q value. The formula is as follows:
where D is the study area divided into n subregions Di (i = 1, 2,. . . , n; n is the number of subregions for one driving factor); N is the number of samples in the whole study area;
(2) Interaction detector. The influence of pairwise interactions between driving factors on the spatial distribution of Y in LUCC was calculated using the interaction detector (Luo et al., 2015; Wang and Xu, 2017). The principle is to superimpose any two driving factors, calculate the superimposed q value, and compare the superimposed q value with the sum of the individual q values of the two driving factors to obtain the quantitative results of driving factor interactions on the spatial distribution of LUCC. Taken together, the results can indicate whether the two variables weaken or strengthen each other or are mutually independent of the spatial distribution of LUCC. The specific types of interactions are shown in Table 2 (Wang et al., 2010; Wang and Xu, 2017). Wang and Hu (2012) provided a detailed description of the geographic detector model. The model version in Excel-GeoDetector is available online (http://www.geodetector.cn/).
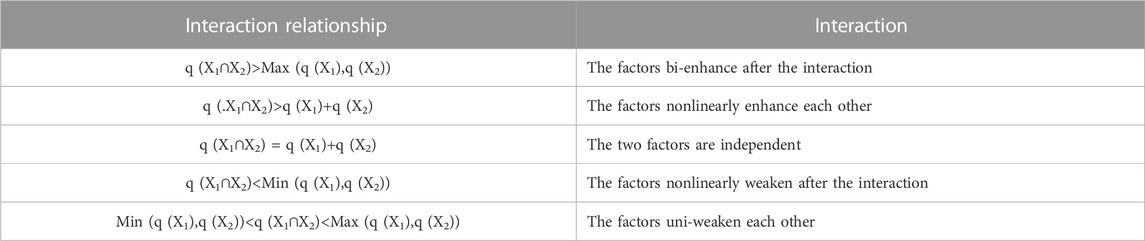
TABLE 2. Types of interaction between two variables and their interactive impacts.
3 Results and analysis
3.1 Spatial pattern of land use/cover types
According to the classification system of Globeland30, the land feature information of the Qiangtang Plateau was divided into 10 categories, including cultivated land, grassland, shrubland, wetland, water, tundra, artificial surface, bare land and ice/snow (Figure 2). The larger proportions of cover types were grassland, bare land, water, shrubland, ice/snow, and wetland, accounting for 63.94%, 26.47%, 2.42%, 5.24%, 1.36%, and 0.55%, respectively. The other types of coverage areas were too small and were ignored (Table 3).
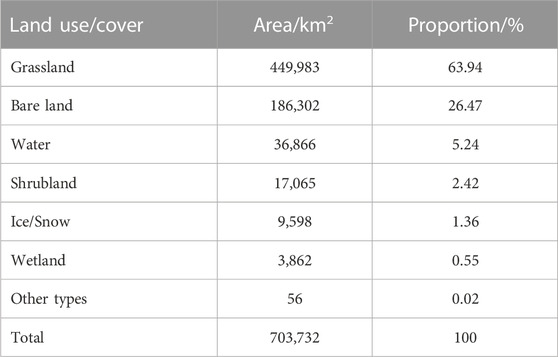
TABLE 3. Statistics of land use/cover in Qiangtang Plateau.
The spatial differentiation of land use types in the Qiangtang Plateau was significant (Figure 2). The grassland area was 449,983 km2, accounting for approximately 63.94% of the total area. Grassland was the largest land use/cover type in the Qiangtang Plateau and was widespread in most areas of the plateau. Bare land covered an area of 186,302 km2, accounting for approximately 26.47% of the plateau area. It was the second largest land use/cover type on the Qiangtang Plateau and was mainly distributed in the western and northern parts of the plateau. The water area was 36,866 km2, accounting for approximately 5.24% of the plateau area. It was mainly distributed in the eastern and southern parts of the plateau and included large lakes such as Selin Co, Namco, Dangjiayong Co, and Ulan Ula Lake. Shrubland covered an area of 17,065 km2, accounting for approximately 2.42% of the plateau area, and was mainly distributed in the eastern and southern parts of the plateau. Ice/snow covered an area of 9,598 km2 and was mainly distributed in high mountain areas such as the Kunlun Mountains, Karakoram Mountains, and Gangdise Mountains. Wetlands covered a small area and were mainly distributed around water bodies.
3.2 Terrain gradient effect of land use spatial distribution
To verify the basic relationship between various terrain factors and the spatial distribution of land use/cover in the Qiangtang Plateau, the extracted elevation, slope, relief, surface roughness and TPI were combined with the graded results of the natural discontinuity method and the quantile method to divide them into five grades according to the principle of rounding. By spatially overlaying the different terrain factors with the land use/cover data of the Qiangtang Plateau, the distribution index results of different degrees of land use/cover on the terrain factor level of the Qiangtang Plateau were obtained (Figure 3).
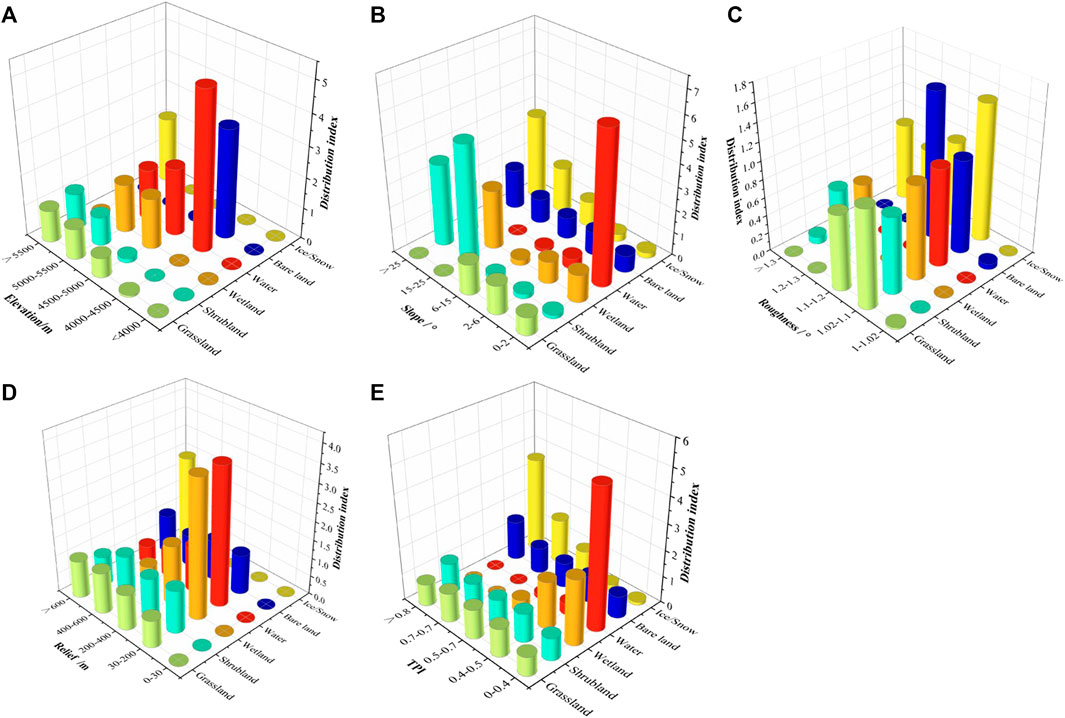
FIGURE 3. The distribution of land use/cover in various terrain sections ((A): Elevation, (B): Slop, (C): Roughness, (D): Relief, (E): TPI).
Figure 3 shows that the spatial distribution of land use/cover on the Qiangtang Plateau exhibited certain patterns across different terrain gradients.
Grassland was mainly distributed in areas with an altitude >4,500 m, a slopes of 2°–6°, a relief of 400–600 m, a roughness of 1.02–1.1, and a TPI of 0.5–0.7. The distribution index of grassland was relatively flat at different relief and TPI values, and the distribution index changed significantly at different elevation and roughness terrain intervals, with concentrated distribution intervals. This result indicates that grassland was greatly affected by elevation and slope roughness.
Shrubland was mainly distributed in areas with an altitude >5,500 m, a slope of 15°–25°, a relief of 400–600 m, a roughness of 1.02–1.1, and a TPI of 0.4–0.5. The distribution index of shrubland was relatively flat at different relief and TPI values, and the distribution index changed significantly at different terrain intervals, with concentrated distribution intervals. This result indicates that shrubland was greatly affected by elevation, slope, and roughness.
Wetland and water were concentrated in areas with an elevation of 4,500–5,000 m, a slope of <2°, a relief of 30–200 m, a roughness of 1.02–1.1, and a TPI of <0.4. With increasing relief, the distribution index decreased significantly, indicating that water and wetlands were strongly affected by relief and were concentrated in low relief areas.
Bare land was mainly distributed in areas with an elevation of 4,000 to 4,500 m, a slope greater than 25°, a relief ranging from 200 to 400 m, a roughness ranging from 1.2 to 1.3, and a TPI of 0.5–0.7. As the relief increased, the distribution index of bare land fluctuated, indicating that bare land was strongly influenced by the terrain factors of the Qiangtang Plateau and was mainly distributed in areas with medium to low relief.
Ice/snow was mainly distributed in areas with an elevation >5,500 m, a slope >25°, a relief >600 m, a roughness of 1.02–1.1, and a TPI >0.8. As the ruggedness of the terrain increased, the distribution index of ice/snow increased, indicating that ice/snow was greatly affected by the terrain factors of the Qiangtang Plateau and was mainly distributed in areas with high relief.
From the terrain gradient characteristics of land use/cover spatial distribution in the Qiangtang Plateau, it can be seen that the land use/cover spatial distribution in the Qiangtang Plateau is closely related to the degree of terrain undulation, which provides the possibility for using geographic detectors to quantitatively analyze the effect of terrain undulation on land use/cover spatial distribution.
3.3 Quantitative analysis of terrain factors on the spatial distribution of land use/cover
Based on the area of the Qiangtang Plateau and the computational power of the geographic detector software, the fishing net analysis tool in ArcGIS10.7 was used to generate grid points with an interval of 3 km–10 km, extract the terrain and land cover of the grid points, and perform the factor detection of the geographic detector. The detection results were best at the scale of 7 km. Using a total of 13,862 grid points at the 7 km scale, we analyzed the quantitative impact of individual factors and their interactions on the spatial distribution and change in land cover.
3.3.1 Quantitative impact of terrain factors
From the results of factor detection (Figure 4), the following was determined.
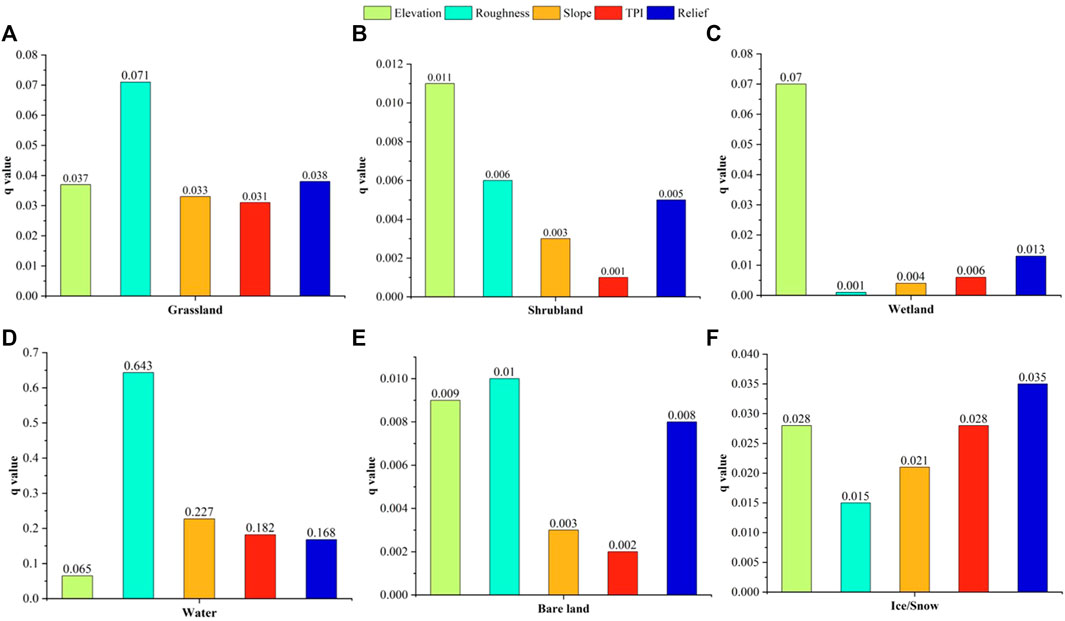
FIGURE 4. Differentiation and factor detection results of land use/cover ((A): Grassland, (B): Shrubland, (C): Wetland, (D): Water, (E): Bare land, (F): Ice/Snow).
Among the factors of the spatial distribution of grassland, the most influential was roughness (0.071), followed by relief (0.038), elevation (0.037), slope (0.033), and TPI (0.031). This result indicates that the strongest correlation between different terrain factors and grassland area was found for roughness, while the smallest was found for the TPI.
Among the factors of the spatial distribution of shrubland, the most influential was elevation (0.011), followed by roughness (0.006), relief (0.005), slope (0.003) and TPI (0.001). This result indicates that the strongest correlation between different terrain factors and shrubland was found for elevation, while the smallest was found for the TPI.
Among the factors of the spatial distribution of wetlands, the most factor was elevation (0.07), followed by relief (0.013), TPI (0.006), slope (0.004), and roughness (0.001). This result indicates that the strongest correlation between different terrain factors and shrubland was found for elevation, while the smallest was found for roughness.
Among the factors of the spatial distribution of water, the most influential was roughness (0.643), followed by slope (0.227), TPI (0.182), relief (0.168), and elevation (0.065). This result indicates that the strongest correlation between different terrain factors and water was found for roughness, while the smallest was found for elevation.
Among the factors of the spatial distribution of ice/snow, the most influential was relief (0.035), followed by elevation (0.028), TPI (0.028), slope (0.021) and roughness (0.015). This result indicates that the strongest correlation between different terrain factors and ice/snow was found for relief, while the smallest was found for roughness.
Therefore, the main driving factors affecting the spatial pattern of land use/cover on the Qiangtang Plateau are elevation, roughness, and relief.
3.3.2 Interaction of terrain factors
The interaction detector mainly identifies the interaction between different terrain factors and spatial changes in land use/cover and analyses whether the interaction enhances or weakens the explanatory power of the dependent variable and the spatial distribution of the land use/cover, or whether the effects of these factors on land use/cover are independent of each other. By comparing the q-statistics of the interaction between two terrain factors and the sum of their statistics, it was determined whether the spatial relationship between the two terrain factors was linear or nonlinear enhancement, weakening, or mutual independence.
Taking grassland as an example, in the interactions involving grassland, the interaction between roughness, elevation, and other driving factors had a strong explanatory power, with a two-factor enhancement effect being the main factor (Figure 5). The interaction between roughness and other factors was the strongest, and both were factorially enhanced by two factors, with an explanatory power greater than 7.4%. The value of roughness and elevation was the highest (q = 0.105). Second, there was an interaction between elevation and other factors, with an explanatory power greater than 6.9%. Thus, roughness and elevation are the main factors influencing the spatial distribution of grasslands.
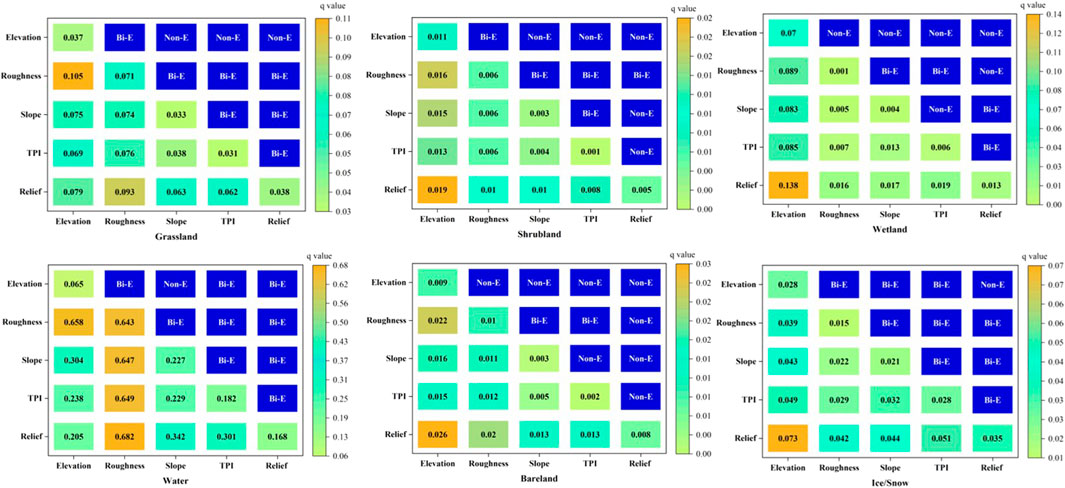
FIGURE 5. Detection results of terrain factor interaction. Bi-E = Bi-enhancement; Non-E = Nonlinear enhancement.
In summary, the q value of the interaction between different terrain factors on the Qiangtang Plateau was greater than the q value of any single factor, indicating that the pairwise interaction of terrain factors increased the explanatory power of the spatial distribution of land use types. The interaction between terrain factors was mainly characterized by two-factor enhancement and nonlinear enhancement, with no independent factors, indicating that the interaction between terrain factors had a stronger explanatory power for land use/cover than did single factors. Among them, the interactions between elevation, roughness, and relief with other factors played dominant roles in the spatial pattern of land use/cover in the study area.
4 Discussion
4.1 Analysis of the spatial change in sandy land on the Qiangtang Plateau
The spatial differentiation of land use/cover on the Qiangtang Plateau was significant, with the main land use/cover types ranked as grassland, bare land, water, shrubland, ice/snow, and wetland. Among them, the grassland area was the largest, with an area of 449,983 km2, accounting for approximately 63.94% of the plateau area, and grassland was widely distributed in most areas of the plateau. Bare land was ranked second, with an area of 186,302 km2, accounting for 26.47% of the plateau area, and it was mainly distributed in the western and northern parts of the plateau (Table 2; Figure 2). This result was consistent with studies by Li (1980), Chen and Fan. (1983), and Chen and Guan. (1989).
Terrain factors, as important influencing factors affecting the formation and change of plateau land use patterns, have a significant impact on the evolution of landscape structure in the region (Zheng et al., 2016; Dong et al., 2017). During the research process, this study found that by introducing quantitative analysis methods, the spatial distribution patterns of land use patterns in the study area could be intuitively revealed from five dimensions: elevation, slope, relief, roughness, and TPI. In addition, by analyzing the distribution index of land types and identifying the main controlling factors in different terrain level areas, it was found that there were significant differences in land use patterns under different terrain factor conditions (Table 3).
Elevation is an important factor influencing the distribution of land use types. With increasing elevation, there will be significant changes in atmospheric temperature and humidity, resulting in regular changes in the direction and type of land use with elevation (Zhou et al., 2007). Constrained by elevation factors, there were significant differences in the spatial distribution of land cover. Grassland was mostly distributed in areas above 4,500 m, while shrubland was distributed in areas above 5,000 m. Wetland was distributed at elevations between 4,500 and 5,500 m, while water and bare land were concentrated between 4,500 and 5,000 m. Ice/snow was found in high mountain areas above 5,500 m. However, because the average elevation of the Qiangtang Plateau is above 4,500 m, and it is mainly composed of low mountainous rolling hills and wide lake basins (Li, 1980), except for the distribution of ice/snow distribution in mountainous areas, the other land types were distributed in relatively low mountainous areas.
Relief is the most important single terrain factor that affects the spatial distribution of land use, and it plays an important role in the spatial distribution of land use along with elevation (Zhao, 2020). The land use/cover of the Qiangtang Plateau was mainly distributed in areas with a relief greater than 30 m, and grassland, shrubland, and bare land were widely distributed in areas with a relief greater than 30 m. Wetland and water were concentrated in areas with a relief between 30 and 200 m, while ice/snow was found in high mountain areas with a relief greater than 600 m.
Slope is one of the inherent environmental factors of land resources and directly affects land use and land carrying capacity (Xian et al., 2007), influences surface material flow and energy conversion, and plays a crucial role in the direction and type of land use. Grassland was mostly distributed in areas below 15°, while wetland, shrubland, and ice/snow were mostly distributed in areas with slopes greater than 15°, while water was concentrated in areas with slopes less than 2°.
Surface roughness is an important parameter that describes the aerodynamic characteristics of the surface. The higher the value is, the more difficult it is for the surface to generate sand and dust. The value can accurately reflect the ability of the surface to resist wind erosion. Increasing the surface roughness value can effectively prevent the occurrence of wind erosion (Wang et al., 2007). Surface roughness varies significantly among different land use types, and even within the same land use/cover, there are significant differences in roughness due to different surface conditions (Wang et al., 2007). The land use/cover of the Qiangtang Plateau was not distributed in the roughness level I area, while grassland and bare land were mainly distributed in level II and III areas. Wetland and water were concentrated in level II areas. Shrubland and ice/snow were distributed in both roughness level II and level V areas (Table 4).
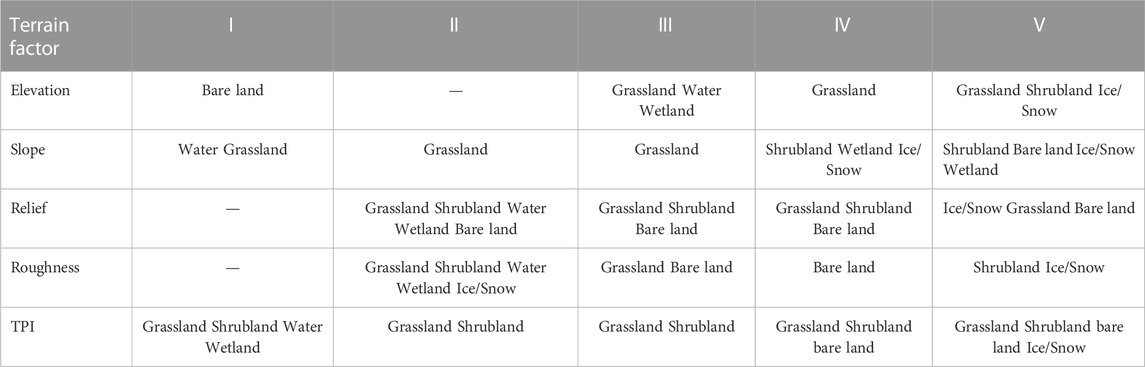
TABLE 4. Distribution statistics of land use/cover in Qiangtang Plateau.
The TPI is an important factor that represents the undulating morphology of the macro-surface and influences the spatial pattern changes in land use/cover (Wang and Hu, 2022). In the land use/cover of the Qiangtang Plateau, grassland, shrubland, and bare land were distributed in each TPI classification. Wetland and water were concentrated in level I areas, while ice/snow was mostly distributed in level V areas.
In summary, this study enriches the theoretical system of land use spatial patterns and fills a gap in the systematic description of the overall spatial patterns of the Qiangtang Plateau’s land use.
4.2 Spatial pattern of land use in other regions in relation to topographic factors
Topographic factors have a certain restrictive effect on the formation of and changes in the spatial patterns of land use, especially in mountainous and hilly areas, where topography directly affects the migration of surface materials and energy conversion and influences the distribution of vegetation types (Sümeyra, 2013; Wu et al., 2010). As an important factor influencing the formation of and change in land use patterns in mountainous hilly areas, three topographic factors, namely, elevation, slope and slope direction, largely determine light, moisture, temperature and soil conditions and to a certain extent determine the direction and mode of land use and have a significant impact on the distribution and change in the spatial pattern of land use (Cui et al., 2011; Liang and Liu, 2010).
In the North China Plain (Guo et al., 2013), arable land, residential land, transportation land and water area were mainly located in the area with a slope of 0–2° as well as an altitude of less than 200 m, and the changed area of these types of land also mainly occurred in this range. Moreover, arable land, orchard land, residential land, transportation land and water area were mainly distributed in the area with a low terrain niche index; grassland was mainly distributed in the area with a medium terrain niche index; and woodland and unused land were in a high terrain niche index area. The land use degree composite index decreased as the grade of the terrain niche increased.
In Northeast China (Sheng et al., 2014), terrain factors play a dominant role in the spatial pattern of land use in the vertical direction. With an increase in elevation, woodland changes into the main land use type, the relative area of cultivated land in various elevation ranges increases initially and then decreases, and the proportions of urban villages, industrial and mining lands, traffic and transportation lands, water areas, and water conservancy facilities lands decrease gradually. Meanwhile, the diversity of land use declines.
In southern China (Zang et al., 2019), the land use spatial pattern was affected by topographical factors. Cultivated land, construction land and water areas were concentrated in plains and gentle rolling hills with altitudes <400 m and slopes <15°, while forest and meadow were mainly distributed in mountains with altitudes >400 m and slopes >15°. Moreover, land use transitions had close relations with terrain factors, and transitions mainly occurred in plains and gentle rolling hills with altitudes <800 m and slopes <15°.
On the Loess Plateau of China (Zhong et al., 2012), the spatial pattern of land use has a close relationship with terrain factors that influence land cover and distribution. With the increase in altitude, the area of forestland appears to first increase and then decrease, the area of grassland increases, and the areas of cultivated land, orchard, water body and industrial land decrease. Flat areas are advantageous for cultivated land, orchards, water bodies and industrial land, while areas with a steep slope are advantageous for forestland and grassland. When an aspect gradient from shady to sunny slope, the areas of cultivated land, orchard, grassland and industrial land increase, the area of forestland decreases, and the aspect has less of an impact on water bodies.
In the Bailongjang Watershed of Northwest China (Gao et al., 2014), construction land has extended to higher altitudes and slopes in the last 30 years, the cultivated land of slope land first increased and then decreased, and the forestland distribution changed from shrinking to gradual recovery. Because of human disturbance, the areas of grassland, unused land and waters decreased. The basic form of the terrain distribution index curve of each land use type from 1977 to 2010 was similar, but the distribution index of individual terrains changed obviously. The superiority of construction land at lower terrains increased and extended to higher terrains, and cultivated land also extended to higher terrains.
5 Conclusion
This study selected terrain factors and used the distribution index method to investigate the gradient effect of terrain variations on the spatial distribution of land use/cover in the Qiangtang Plateau. The geographic detector method was used to quantitatively analyze the influence of different terrain factors on the spatial distribution of land use/cover. The conclusions are as follows.
(1) The land use/cover area of the Qiangtang Plateau was mainly grassland and bare land, with grassland having the largest area of 449,983 km2, accounting for approximately 63.94% of the plateau area, and grassland was widely distributed in most areas of the plateau. Bare land ranked second, with an area of 186,302 km2, accounting for 26.47% of the plateau area, and it mainly distributed in the western and northern parts of the plateau. Other land cover areas were relatively small, such as a water area of 36,866 km2, which represents approximately 5.24% of the plateau area, and water was mainly distributed in the eastern and southern parts of the plateau. Shrubland covered an area of 17,065 km2, accounting for approximately 2.42% of the plateau area, and it was mainly distributed in the eastern and southern parts of the plateau. Ice/snow covered an area of 9,598 km2 and was mainly distributed in high mountainous areas such as the Kunlun, Karakoram, and Gangdise Mountains. Wetlands covered a small area and were mainly distributed around water bodies.
(2) The spatial differentiation of land use/cover in the Qiangtang Plateau was significant. Grasslands were mainly distributed in low mountainous areas with high undulation, gentle slopes, and low roughness; bare land was mainly distributed in low mountainous areas with a high relief, steep slopes, and a low roughness. Water often occurred in lowland areas with a low relief, gentle slopes, and a low roughness and TPI. Wetlands occurred mainly in lowland areas with a small relief, gentle slopes, a low roughness and a low TPI. Most shrublands were found in mountainous areas with a high relief, steep slopes, and a high roughness. Ice/snow was concentrated in highly undulating mountain areas with steep slopes, a high roughness, and a high TPI.
(3) The main driving factors of the spatial pattern of land use/cover in the Qiangtang Plateau were elevation, roughness and relief. Compared to a single factor, the interaction of multiple terrain factors had a stronger explanatory power for land use/cover. The interactions between elevation, roughness, and relief with other factors played dominant roles in the spatial pattern of land use/cover in this study area.
The land use structure should be adjusted according to the terrain gradient, and unreasonable land use and human disturbance should be avoided. Ecological construction and governance of human activities should be optimized continuously.
Data availability statement
The original contributions presented in the study are included in the article/supplementary material, further inquiries can be directed to the corresponding authors.
Author contributions
LT and YS designed the research; KB and XC wrote the initial draft of the manuscript; JX and XG revised the manuscript. All authors contributed to the article and approved the submitted version.
Funding
This research was supported by the Second Tibetan Plateau Scientific Expedition and Research Program (STEP) (Grant No. 2019QZKK0306).
Acknowledgments
This research was supported by the Second Tibetan Plateau Scientific Expedition and Research Program (STEP) (Grant No. 2019QZKK0306). We greatly appreciate the comments of anonymous reviewers for their valuable suggestions for improving the manuscript.
Conflict of interest
The authors declare that the research was conducted in the absence of any commercial or financial relationships that could be construed as a potential conflict of interest.
Publisher’s note
All claims expressed in this article are solely those of the authors and do not necessarily represent those of their affiliated organizations, or those of the publisher, the editors and the reviewers. Any product that may be evaluated in this article, or claim that may be made by its manufacturer, is not guaranteed or endorsed by the publisher.
References
Bi, X. L. (2011). Applicability analysis of terrain factors in sensitivity evaluation of landslide disasters in Sichuan Province. Capital Normal University.
Chen, C. Y., and Fan, Y. Q. (1983). Rivers, lakes and water resources in the Qiangtang Plateau. Resour. Sci. 2, 38–44.
Chen, C. Y., and Guan, Z. H. (1989). The water resources of the Qiangtang Plateau. And their development and use. J. Nat. Resour. 4 (4), 298–307. doi:10.11849/zrzyxb.1989.04.002
Chen, D., Zhou, Q. G., He, C. H., and Liu, L. L. (2013). Research on the differentiation of land use terrain feature from 1985 to 2010 in Chongqing Mountainous metropolitan area. Res. Soil Water Conservation 20 (5), 210–215.
Chen, X. X., Zhang, X. J., and Chang, Q. R. (2016). A Study on optimal statistical unit for relief amplitude of land surface in Shaanxi Province. Bull. Soil Water Conservation 6, 265–270. doi:10.13961/j.cnki.stbctb.2016.03.046
Chen, X. X., Zhang, X. J., and Han, W. H. (2020). Land use change with topographic gradients in the Yuci District rapid urbanization area. Chin. J. Eco-Agriculture 28 (10), 1637–1648. doi:10.13930/j.cnki.cjea.200224
Chu, D., Zhang, Y. L., BianBa, C. R., and Liu, L. S. (2010). Land use dynamics in Lhasa area, Tibetan Plateau. J. Geogr. Sci. 20 (6), 899–912. doi:10.1007/s11442-010-0819-0
Cui, B. L., Li, X. Y., Jiang, G. H., Zhang, S. Y., and Huang, Y. K. (2011). Study on land use/cover in mountain area based on the DEM:taking the Qinghai Lake Basin as an example. J. Nat. Resour. 26 (5), 871–880. doi:10.11849/zrzyxb.2011.05.014
De Ji, Y. Z. (2022). Lake area change and its response to climate change. Plateau. China: Nanjing University of Information Science and Technology.
Di, L., Ma, Y. X., Li, H. M., and Sun, Y. C. (2015). Relationship between land use and topographic factors in Liushahe Watershed. Bull. Soil Water Conservation 35 (6), 296–300. doi:10.13961/j.cnki.stbctb.2015.06.051
Dong, S. Z., Zhao, Y. L., and Li, X. B. (2017). Spatio-temporal patterns of land use change in plateau region based on the terrain gradient:A case study in Panxian County, Guizhou Province. Res. Soil Water Conservation 24 (2), 213–222. doi:10.13869/j.cnki.rswc.2017.02.036
Dong, Y. X. (2001). Quantitative identification of driving factors of desertification in semi-arid areas of China. J. Desert Res. 21 (4), 412–417. doi:10.3321/j.issn:1000-694X.2001.04.017
Du, J., Zhou, Z. S., and Yuan, L. (2021). Climate change tendency of surface humidity index in chang tang nature reserve of Tibet from 1971 to 2018. Sci. Soil Water Conservation China 19 (04), 13–23. doi:10.16843/j.sswc.2021.04.002
Feng, S. C., Gao, X. H., Kang, J., Wu, G. L., Zou, C., et al. (2012). Research on land use/cover change and urban expansion in Xining City in recent 30 years. Arid Land Res. 29 (1), 129–136. doi:10.7666/d.d205220
Feng, Z. M., Li, W. J., Li, P., and Xiao, C. W. (2012). Relief degree of land surface and its geographical meanings in the Qinghai-Tibet Plateau, China. Acta Geogr. Sin. 75 (7), 1359–1372. doi:10.11821/dlxb202007003
Gao, Q. Z., Li, Y. E., Lin, E. D., Jiang Cun, W. Z., Wan, Y. F., Xiong, W., et al. (2005). Temporal and spatial distribution of grassland degradation in Northern Tibet. Acta Geogr. Sin. 60 (6), 965–973. doi:10.3321/j.issn:0375-5444.2005.06.009
Gao, Q. Z., Duan, M. J., Wan, Y. F., Li, Y. E., Guo, Y. Q., et al. (2010). Comprehensive evaluation of eco-environmental sensitivity in Northern Tibet. Acta Ecol. Sin. 30 (15), 4129–4136. doi:10.1038/nrmicro1917
Gao, Y. J., Gong, J., Jia, Z. Z., Xie, Y. C., and Qian, D. W. (2014). Spatial distribution of land-use on terrain gradient in bailongjiang watershedof gansu province. J. Lanzhou Univ. Nat. Sci. 50 (05), 680–686. doi:10.13885/issn.0455-2059.2014.05.017
Gong, W. F., Yuan, L., and Fan, W. Y. (2013). Analysis on land use pattern changes in Harbin based on terrain gradient. Trans. Chin. Soc. Agric. Eng. 29 (2), 250–259. doi:10.3969/j.issn.1002-6819.2013.02.034
Guo, H. F., Xu, Y. Q., and Wu, Y. F. (2013). Analysis of the land use spatial pattern and spatio-temporal changes based on Terrain Gradient:A case study of Pingqu District in Beiiing. Econ. Geogr. 33 (1), 160–166.
Ha, K., Ding, Q. L., Men, M. X., and Xu, G. (2015). Spatial distribution of land use and its relationship with terrain factors in hilly area. Geogr. Res. 34 (05), 909–921. doi:10.11821/dlyj201505010
Hao, N. (2021). Summary of climate change and alpine grassland on the Qinghai-Tibet Plateau. Agric. Henan 08, 59–60. doi:10.15904/j.cnki.hnny.2021.08.028
Huang, Y. L., Chen, L. D., Fu, B. J., Huang, Z. L., and Gui, L. D. (2003). The influence of topography land use on soil moisture spatial-temporal patiern in the hilly area of Loess. Quat. Sci. 23 (3), 334–342. doi:10.3321/j.issn:1001-7410.2003.03.012
Ispikoudis, I., Lyrintzis, G., and Kyriakakis, S. (1993). Impact of human activities on mediterranean land scapes in Western Crete. Landsc. Urban Plan. 24 (1-4), 259–271. doi:10.1016/0169-2046(93)90105-M
Körner, C. (2007). The use of 'altitude' in ecological research. Trends Ecol. Evol. Nov. 22 (11), 569–574. doi:10.1016/j.tree.2007.09.006
Lauer, W. (1993). Human development and environment in the Andes:a geoecological overview. Mt. Res. Dev. 13 (2), 157–166. doi:10.2307/3673633
Li, M. S. (1980). Soil characteristics and utilization of Qiangtang Plateau. J. Nat. Resour. 4, 60–69.
Liang, F. C., and Liu, L. M. (2010). Analysis on distribution characteristics of land use types based on terrain gradient: A case of liuyang city in hunan province. Resour. Sci. 32(11), 2138–2144.
Liu, X. H., Yang, Q. K., and Tang, G. A. (2001). Extraction and application of relief of China based on DEM and GIS method. Bull. Soil and Water Conserv. 62(1), 57–59. doi:10.3969/j.issn.1000-288X.2001.01.015
Liu, Y. L., and Li, Y. (2015). Study on the relationship between land use and landform factors——Taking hangzhou as an example. J. Anhui Normal Univ. Nat. Sci. 38 (6), 576–582. doi:10.14182/J.cnki.1001-2443.2015.06.015
Liu, J. Y., Ning, J., Kuang, W. H., Xu, X. L., Zhang, S. W., Yan, C. Z., et al. (2018). Spatio-temporal patterns and characteristics of land-use change in China during 2010-2015. Acta Geogr. Sin. 73 (5), 547–562. doi:10.1007/s11442-018-1490-0
Luo, W., Jasiewicz, J., Stepinski, T., Wang, J., Xu, C., et al. (2015). Spatial association between dissection density and environmental factors over the entire conterminous United States. Geophys. Res. Lett. 43 (2), 692–700.
Lu, Y. G., Xu, Y. Q., and Cai, Y. L. (2005). Analysis on land use/land cover changes of small drainage basins based on RS and GIS. Prog. Geogr. 24 (1), 79–86. doi:10.11820/dlkxjz.2005.01.009
Ma, J. F., Lv, C. H., and Wang, Q. (2008). Land-cover classification of the Qaidam Basin based on MODIS NDVI time series data. Arid Land Geogr. 31 (3), 442–448.
Ma, R. H., Yang, G. S., Duan, H. T., Jiang, J., Wang, S., Feng, X., et al. (2011). China's lakes at present: Number, area and spatial distribution. Sci. China Earth Sci. 4, 283–289. doi:10.1007/s11430-010-4052-6
Millennium Ecosystem Assessment (2005). Ecosystems and human well-being—our human planet summary for decision makers. Washington DC: Island Press.
Mottet, A., Ladet, S., Coqué, N., and Gibon, A. (2006). Agricultural land-use change and its drivers in mountain landscapes: A case study in the pyrenees. Agric. Ecosystems&Environment. 14 (2), 296–310. doi:10.1016/j.agee.2005.11.017
Schomberg, J. D., Host, G., Johnson, L. B., and Richards, C. (2005). Evaluating the influence of landform surficial geology and land use on streams using hydrologic simulation modeling. Aquat. Sci. 67 (4), 528–540. doi:10.1007/s00027-005-0785-2
Shen, H. F., Fu, K., Ding, S. Y., and Liang, G. F. (2011). Spatial pattern of land use along the terrain gradient in Yellow River Basin in west Henan Province. Resour. Dev. Mark. 8, 719–722. doi:10.3969/j.issn.1005-8141.2011.08.014
Sheng, Y., Yao, Y. F., and Qin, F. C. (2014). Spatial pattern changes of land use based on terrain factors in Chengzi Township in Chifeng City. J. Hohai Univ. Sci. 5, 388–393. doi:10.3876/j.issn.1000-1980.2014.05.003
Song, G., and Wang, P. P. (2017). Spatial pattern of land use along the terrain gradient of county in songnen high plain: A case study of bayan county. Sci. Geogr. Sin. 37 (8), 1218–1225. doi:10.13249/j.cnki.sgs.2017.08.012
Song, C. Q., You, S. C., Ke, L., Liu, G. H., and Zhong, X. K. (2012). Phenological variation of typical vegetation types in northern Tibet and its response to climate changes. Acta Ecol. Sin. 04, 41–51. doi:10.5846/stxb201101050014
Song, G., Wang, P. P., Wang, Y., Zhou, C. F., Zhang, X., and Yan, F. (2015). Land-use types change characteristics and spatial heterogeneity in bayan of Heilongjiang Province. Econ. Geogr. 35 (3), 163–170. doi:10.15957/j.cnki.jjdl.2015.03.024
Su, X. K., Jian, S. Y., Li, M., and NaZhao, X. D. W. J. (2012). The TUPU analysis of land-use pattern in Suihua. Chin. Agric. Sci. Bull. 28 (2), 214–222. doi:10.3969/j.issn.1000-6850.2012.02.043
Sümeyra, K. (2013). Land use changes in Istanbul’s Black Sea coastal regions between 1987 and 2007. J. Geogr. Sci. 23 (2), 271–279. doi:10.1007/s11442-013-1009-7
Sun, H. L., Zheng, D., Yao, T. D., and Zhang, Y. L. (2012). Protection and construction of the national ecological security shelter zone on Tibetan Plateau. Acta Geogr. Sin. 67 (01), 3–12. doi:10.11821/xb201201001
Sun, P. L., Xu, Y. Q., and Wang, S. (2014). Terrain gradient effect analysis of land use change in poverty area around Beijing and Tianjin. Trans. Chin. Soc. 30 (14), 277–288. doi:10.3969/j.issn.1002-6819.2014.14.035
Tang, Q., Li, X. K., Zhong, B. X., and Wang, K. Y. (2019). GIS-Based research on the evaluation of spatial distribution of villages and human settlements environment suitability in Chengkou County of Chongqing. Res. Soil Water Conservation 26 (02), 305–311.
Verburg, P. H., Velkamp, T., A., and Bouma, J. (1999). Land use change under conditions of high population pressure, the case of Java. Glob. Environ. Change 9, 303–312. doi:10.1016/S0959-3780(99)00175-2
Wang, J. F., and Hu, Y. (2012). Environmental health risk detection with Geogdetector. Environ. Modell. Softw. 33, 114–115. doi:10.1016/j.envsoft.2012.01.015
Wang, G., and Liu, H. J. (2022). Quantitative influence of topographic relief characteristics on land cover distribution in Guangdong Province. Trop. Geomorphol. 1, 16–21.
Wang, J. F., and Xu, C. D. (2017). Geodetector: Principle and prospective. Acta Geogr. Sin. 72, 116–134. doi:10.11821/dlxb201701010
Wang, S. T., Zou, X. Y., Cheng, H., and Zhao, T. Z. (2007). Primary study on the blown sand-dust of farmland and its control in Beijing Region. Res. Soil Water Conservation 61 (02), 1–3.
Wang, J. F., Li, X. H., Christakos, G., Liao, Y. L., Zhang, T., Gu, X., et al. (2010). Geographical detectors-based health risk assessment and its application in the neural tube defects study of the heshun region, China. China. Int. J. Geogr. Inf. Sci. 24, 107–127. doi:10.1080/13658810802443457
Wang, J. S., Zhang, X. Z., Chen, B. X., Shi, P. L., Zhang, J. L., Shen, Z. X., et al. (2013). Causes and restoration of degraded alpine grassland in northern Tibet. J. Resour. Ecol. 4 (01), 43–49. doi:10.5814/j.issn.1674-764x.2013.01.006
Wang, J. F., Zhang, T. L., and Fu, B. J. (2016). A measure of spatial stratified heterogeneity. Ecol. Indic. 67, 250–256. doi:10.1016/j.ecolind.2016.02.052
Wang, Q. M., Yang, K., Xu, Q. L., Li, M. C., and Xiao, Q. (2018). Effect of terrain gradient on geo-spectrum of land use change in Dianchi Basin. Res. Soil Water Conservation 25 (03), 237–244. doi:10.13961/j.cnki.stbctb.2017.04.018
Wu, N., Gao, J. X., SudebiligeLuo, Z. L., and Li, D. Q. (2010). On land use/cover changes of diferent topographic conditions in the Upper Yangtze River Basin. Resour. Environ. Yangtze Basin 19 (3), 268–275.
Xian, W., Shao, H. Y., and Zhou, W. C. (2007). Research on the landscape pattern of slopes with different gradients and directions in the area of three gorges area based on 3S—a case study from wuxi county. Chin. J. Eco-Agriculture 15 (1), 140–144. doi:10.3724/SP.J.1011.year_id].0140
Xu, Y., and Chen, T. (2016). Dynamic monitoring of grassland degradation on the Northern Tibetan Plateau and loss assessment of its ecological service value,by using Shenza County as a case study. Acta Ecol. Sin. 36 (16), 10. doi:10.5846/stxb201501290229
Xu, Z. R., and Zou, X. P. (2020). Evaluation of social-ecological effectiveness of protected areas on the Chang tang Plateau. Acta Ecol. Sin. 40 (23), 8743–8752. doi:10.5846/stxb201912312852
Yang, L., Xie, G. D., Zhen, L., Leng, Y. F., and Guo, G. M. (2005). Spatio-temporal changes of land use in Jinghe Watershed. Resour. Sci. 27 (4), 26–32. doi:10.3321/j.issn:1007-7588.2005.04.006
Yu, X. X., and Yang, G. S. (2002). The advances and problems of land use and land cover change researth in China. Prog. Geogr. 21(1), 51–57. doi:10.11820/dlkxjz.2002.01.006
Zang, Y. Z., Liu, Y. S., and Yang, Y. Y. (2019). Land use pattern change and its topographic gradient effect in the mountainous areas:A case study of Jinggangshan City. J. Nat. Resour. 34 (07), 1391–1404. doi:10.31497/zrzyxb.20190704
Zhang, S. C., Li, Z. M., Wei, C. F., Zhang, W. H., and Shao, J. A. (2013). Spatial pattern of pural poads system and its change characteristics along the terrain gradient by GIS:A case study of Zhongxian County,Chongqing. Areal Res. Dev. 32 (1), 158–164. doi:10.3969/j.issn.1003-2363.2013.01.031
Zhang, Y. L., Wang, Z. F., Wang, X. H., Ding, M. J., and Ding, B. H. (2013). Land cover changes in the key regions and selfreflection on ecological construction of the Tibetan Plateau. Chin. J. Nat. 35 (03), 187–192. doi:10.3969/j.issn.0253-9608.2013.03.005
Zhang, Y. L., Cheng, S. K., and Bai, W. Q. (2014). Land system change and regional development strategy on the Tibetan Plateau in the China Society on Tibet Plateau, ed. Report on advances in Tibetan plateau research. Beijing: China Science and Technology Press.240–263.
Zhang, X. Z., Yang, Y. P., Piao, S. L., Bao, W. K., and Wang, S. P. (2015). Ecological change on the Tibetan plateau. Chin. Sci. Bull. 60 (32), 3048–3056. doi:10.1360/n972014-01339
Zhang, Y. L., Li, L. H., Ding, M. J., and Zheng, D. (2017). Greening of the Tibetan Plateau and its drivers since 2000. Chin. J. Nat. 9, 173–178. doi:10.3969/j.issn.0253-9608.2017.03.003
Zhang, S., Zha, X. C., and Liu, K. Y. (2020). Research on the influence of topographic relief on the spatial distribution pattern of population and economy in Hanzhong City. J. Southwest Univ. Nat. Sci. Ed. 2 (08), 138–148. doi:10.13718/j.cnki.xdzk.2020.08.018
Zhang, L. (2013). Study on spatial pattern of loess landform based on analysis of core topographic factors. Nanjing: Nanjing Normal University.
Zhao, Z. P., Liu, J. Y., and Shao, Q. Q. (2010). Characteristic analysis of land cover change in nature reserve of Three River's Source Regions. Sci. Geogr. Sin. 30 (03), 415–420. doi:10.3969/j.issn.1560-8999.2009.03.019
Zhao, S. M. (2020). Quantitative effects of digital terrain features on land use spatial distribution. Sci. Technol. Rev. 38 (13), 57–64. doi:10.3981/j.issn.1000-7857.2020.13.007
Zheng, Y. Y., Zhao, Q., Huang, Q. H., and Zheng, G. Q. (2016). Research on relationship between land use change and terrain factors in the south mountain area of Ji′nan,Shandong Province,China. Res. Soil Water Conservation 23 (4), 149–153. doi:10.13869/j.cnki.rswc.20160513.004
Zhong, D. Y., Chang, Q. R., and Song, F. J. (2012). Relationship between terrain factors and spatial distribution of land use in loess hilly and gully area. J. Arid Land Resour. Environ. 26 (6), 102–107. doi:10.13448/j.cnki.jalre.2012.06.009
Zhou, M., Wu, Q. Y., and Peng, J. W. (2007). Analysis of the land use spatial pattern and spatio-temporal changes in the area of Longkou based on DEM. Sci. Surv. Mapp. 32 (6), 173–175. doi:10.3771/j.issn.1009-2307.2007.06.063
Zhou, C. H., Cheng, W. M., Qian, J. K., Li, B. Y., and Zhang, B. P. (2009). Research on the classification system of digitalland geomorphology of 1:1000000 in China. Geo-Information Sci. 11 (06), 707–724. doi:10.3724/sp.j.1047.2009.00707
Keywords: land use, spatial pattern, terrain gradient, geodetector, Qiangtang Plateau, Qinghai Tibet Plateau
Citation: Bian K, Tan L, Shen Y, Chen X and Xu J (2023) Spatial pattern of land use along the terrain gradient of Qinghai Tibet Plateau: a case study of Qiangtang Plateau, China. Front. Environ. Sci. 11:1217225. doi: 10.3389/fenvs.2023.1217225
Received: 05 May 2023; Accepted: 15 June 2023;
Published: 07 July 2023.
Edited by:
Tao Wang, Chinese Academy of Sciences (CAS), ChinaReviewed by:
Zhiyong Ding, Chengdu University of Technology, ChinaJianhua Xiao, Chinese Academy of Sciences (CAS), China
Copyright © 2023 Bian, Tan, Shen, Chen and Xu. This is an open-access article distributed under the terms of the Creative Commons Attribution License (CC BY). The use, distribution or reproduction in other forums is permitted, provided the original author(s) and the copyright owner(s) are credited and that the original publication in this journal is cited, in accordance with accepted academic practice. No use, distribution or reproduction is permitted which does not comply with these terms.
*Correspondence: Lihua Tan, lihuatan@bnu.edu.cn; Yulong Shen, 949988294@qq.com