Generality and Shifts in Leaf Trait Relationships Between Alpine Aquatic and Terrestrial Herbaceous Plants on the Tibetan Plateau
 Lei Yang
 Haocun Zhao
 Zhenjun Zuo
 Xiangyan Li
  Zhong Wang
- Department of Ecology, College of Life Sciences, Wuhan University, Wuhan, China
Plant traits mirror both evolutionary and environmental filtering process with universal trait-trait relationships across plant groups. However, plants also develop unique traits precisely to different habitats, inducing deviations of the trait coupling relations. In this study, we aimed to compare the differences in leaf traits and examine the generality and shifts of trait-trait relationships between alpine aquatic and terrestrial herbaceous plants on the Tibetan Plateau, to explore the precise adaptive strategies of aquatic and terrestrial plants for its habitats. We measured mass-based and area-based leaf N and P concentrations, N:P ratios and specific leaf area (SLA) of aquatic and terrestrial herbaceous plants. Standardized major axis analysis were applied to build the correlations for every trait pairs of each plant group, and then to compare the differences in the trait-trait correlations among different plant groups. Leaf Nmass and Pmass of two groups of aquatic plants (emergent and submerged plants) were higher, but N:P ratios were lower than those of two groups of terrestrial plants (sedges and grasses). Submerged plants had extremely high SLA, while grasses had the lowest SLA. Nmass positively correlated with Pmass in three out of four plant groups. The two terrestrial plant groups had positive Nmass-SLA relationships but these two traits coupled weakly in aquatic plants. Pmass showed positive relationships to SLA in three out of four plant groups. Significant shifts of trait-trait relationships between aquatic and terrestrial plants were observed. In general, aquatic plants, especially submerged plants, are characterized by higher SLA, greater leaf nutrientmass than terrestrial plants, tend to pursue fast-return investment strategies, and represent the acquisitive end of leaf economics spectrum. The deviations of trait-trait relationships between different plant groups reveal the precise adaptions of submerged plants to the unique aquatic habitats.
Introduction
Functional traits are known as quantitative indicators of plant fitness that developed from both evolution and ecological filtering (Chapin et al., 1993), of which leaf nitrogen (N) and phosphorus (P) concentrations, N:P ratios and specific leaf area (SLA) attract the most attention (Díaz et al., 2016; Moor et al., 2017). Leaf N and P concentrations (mass-based or area-based) represent the total amounts of N and P per unit dry mass (mass-based, mg g–1) or per unit leaf area (area-based, g m–2), while SLA is the one-sided leaf area per unit dry mass (cm2 g–1) (Pérez-Harguindeguy et al., 2013), reflecting the expected return (light-intercepting area) on per unit of resource (carbon and nutrients) investments (Poorter et al., 2009). Both SLA and leaf nutrient concentrations are species-specific traits, but meanwhile, vary along environmental gradients (Güsewell and Koerselman, 2002; Poorter et al., 2009). Species (or populations) native to cold or arid habitats often have greater leaf Nmass and Pmass (Reich and Oleksyn, 2004; He et al., 2008; Wang et al., 2015), and lower SLA (Poorter et al., 2009). Plants evolve a suite of trait combinations acclimatizing itself to native habitats.
Despite the significant differences in leaf traits among species and habitats, the bivariate traits relationships are often similar and species-independent, indicating the convergent evolution and generality in plant adaptation (Reich et al., 1997). Numerous reviews and study cases described the generally accepted correlations of leaf trait pairs (Chapin et al., 1993; Reich et al., 1999, 2010; Wright et al., 2004; He et al., 2006; Reich, 2014; Díaz et al., 2016; Pan et al., 2020a; Thomas et al., 2020). High SLA always couples with greater leaf Nmass and Pmass, while the two photosynthesis-related leaf nutrients (N and P) show a positive relationship with each other. Such acquisitive traits have faster return on investment of resources and make plants growing with high rate. On the contrary, lower SLA and lower leaf nutrients are conservative traits with longer leaf life span, result in lower photosynthetic rate and growth rate. Variations in leaf traits from conservative to acquisitive ones form a continuous gradient of leaf economics spectrum (LES). Each plant species has its position on the universal trade-off surface (Reich et al., 1997).
Most studies of LES focused on terrestrial ecosystems. Although aquatic habitats are special, plants surviving in water show common physiological and structural adaptive strategies that reflect fundamental trade-offs in economics, and can be compared with terrestrial species directly in perspective of LES (Pierce et al., 2012; Onoda et al., 2017). In aquatic habitats, plants, especially submerged species, have developed strategies to maximize the ability for carbon gain and light interception, maintaining high return on investment (Moor et al., 2017; Maberly and Gontero, 2018). Aquatic plants suffer from very different environmental stressors from those in terrestrial habitats, such as low light intensity, slow diffusion of gases (CO2 in water and O2 in water-saturated substrate), drastic water-level fluctuation caused by flooding, competition with phytoplankton, concentrated N, P and other substances in substrate and surrounding water that leached from soil and anthropic pollutants. In previous studies, aquatic plants showed greater leaf Nmass and Pmass (Xia et al., 2014; Wang et al., 2015), extremely high SLA (Poorter et al., 2009; Liu et al., 2021), and extended the acquisitive end of LES (Pierce et al., 2012; Pan et al., 2020a). However, variations in different leaf traits along a same environmental gradient or among plant species should be allometric. For example, SLA increased several hundred-fold from xerophyte to submerged plants (Poorter et al., 2009), while leaf N varied 32-fold and P by 200-fold in mean values among different plant functional groups globally (Reich et al., 2010). Therefore, although all plants followed the fundamental rules of bivariate traits relationships, differences should also exist among plant functional groups, especially between terrestrial and aquatic plants. Such deviations can mirror the precise adaptive strategies of plants to the unique environmental stressors of local habitats. Pan et al. (2020a) compared the general relationships of leaf traits among two plant groups in wetland and non-wetland species on a global scale, and found significant shifts along the common slopes between different plant groups. However, limited by data availability, aquatic plants in alpine wetlands on the Tibetan Plateau were absent in the global analysis.
Alpine Kobresia meadow and Stipa steppe constitute the major vegetation types of alpine grassland regions along large environmental gradients on the Tibetan Plateau (Tibetan Plateau Scientific Expedition and Research Team (TPSERT).,, 1992; Zhao, 2009). Alpine wetlands that embedded in grassland regions provide an ideal platform for comparative studies on the different adaptive strategies between aquatic and terrestrial plants in the same climatic but different habitat conditions (Wang et al., 2015). We hypothesized that aquatic plants had similar trends but different scales of trait-trait correlations from terrestrial herbaceous plants. Variations in SLA were involved, as the most reactive trait, in plant adaptation to the different conditions between aquatic and terrestrial habitats, resulting in different scaling trait-trait correlations. In this study, we aimed to (1) compare the differences in leaf traits, and (2) examine the generality of trait-trait relationships and the shifts of common slopes among two aquatic plant groups (emergent plants and submerged plants) and two terrestrial plant groups (sedges, mainly Kobresia species and grasses, mainly Stipa species), to explore the adaptive strategies of aquatic and terrestrial plants for its habitats.
Materials and Methods
Study Area
This study was carried out on the Tibetan Plateau, which is the highest plateau with an average elevation of 4000 m a.s.l. and an area of 2.5 million km2. On Tibetan Plateau, low temperature, low precipitation, strong wind and strong solar radiation together characterize the alpine climate. Detailed topographical feature and climatic characteristics were described in Wang et al. (2015). Briefly, obstruction of the Himalayas along the southern edge of the plateau to oceanic warm and humid air current, together with the northwestward lifted elevation, form the decreasing trends of both annual precipitation (800 mm to 20 mm) and annual mean air temperature (11°C to −5°C), resulting in a series of vegetation type of montane forest, shrub, alpine meadow, alpine grassland, and alpine desert from southeast to northwest (Zheng and Zhao, 2017).
The sample sites in this study covered 23° (79.7 E–102.7 E) in longitude, 10.7° (27.5 N–38.2 N) in latitude and 2991 m (2194–5185 m) in altitude (Figure 1). We mainly focused on the regions dominated by herbaceous plants. Therefore, we modified the original vegetation regionalization scheme of the whole plateau to four vegetation regions: forest region, meadow region, steppe region, and desert region, which roughly reflected the water availability and the species composition. The raw data for vegetation regionalization were applied from Resource and Environment Science and Data Center1 in October 2020. The meadow region is comprised of alpine meadow and alpine shrub mixed zones and typical alpine meadow zones, where the dominant herbaceous species are sedges of genera Kobresia or Carex. The steppe region includes alpine grassland zones and temperate steppe zones, and is dominated by grasses of genera Stipa or Poa. The desert region consists of alpine desert zones and temperate desert zones, which is covered by sparse vegetation of shrubs and grasses.
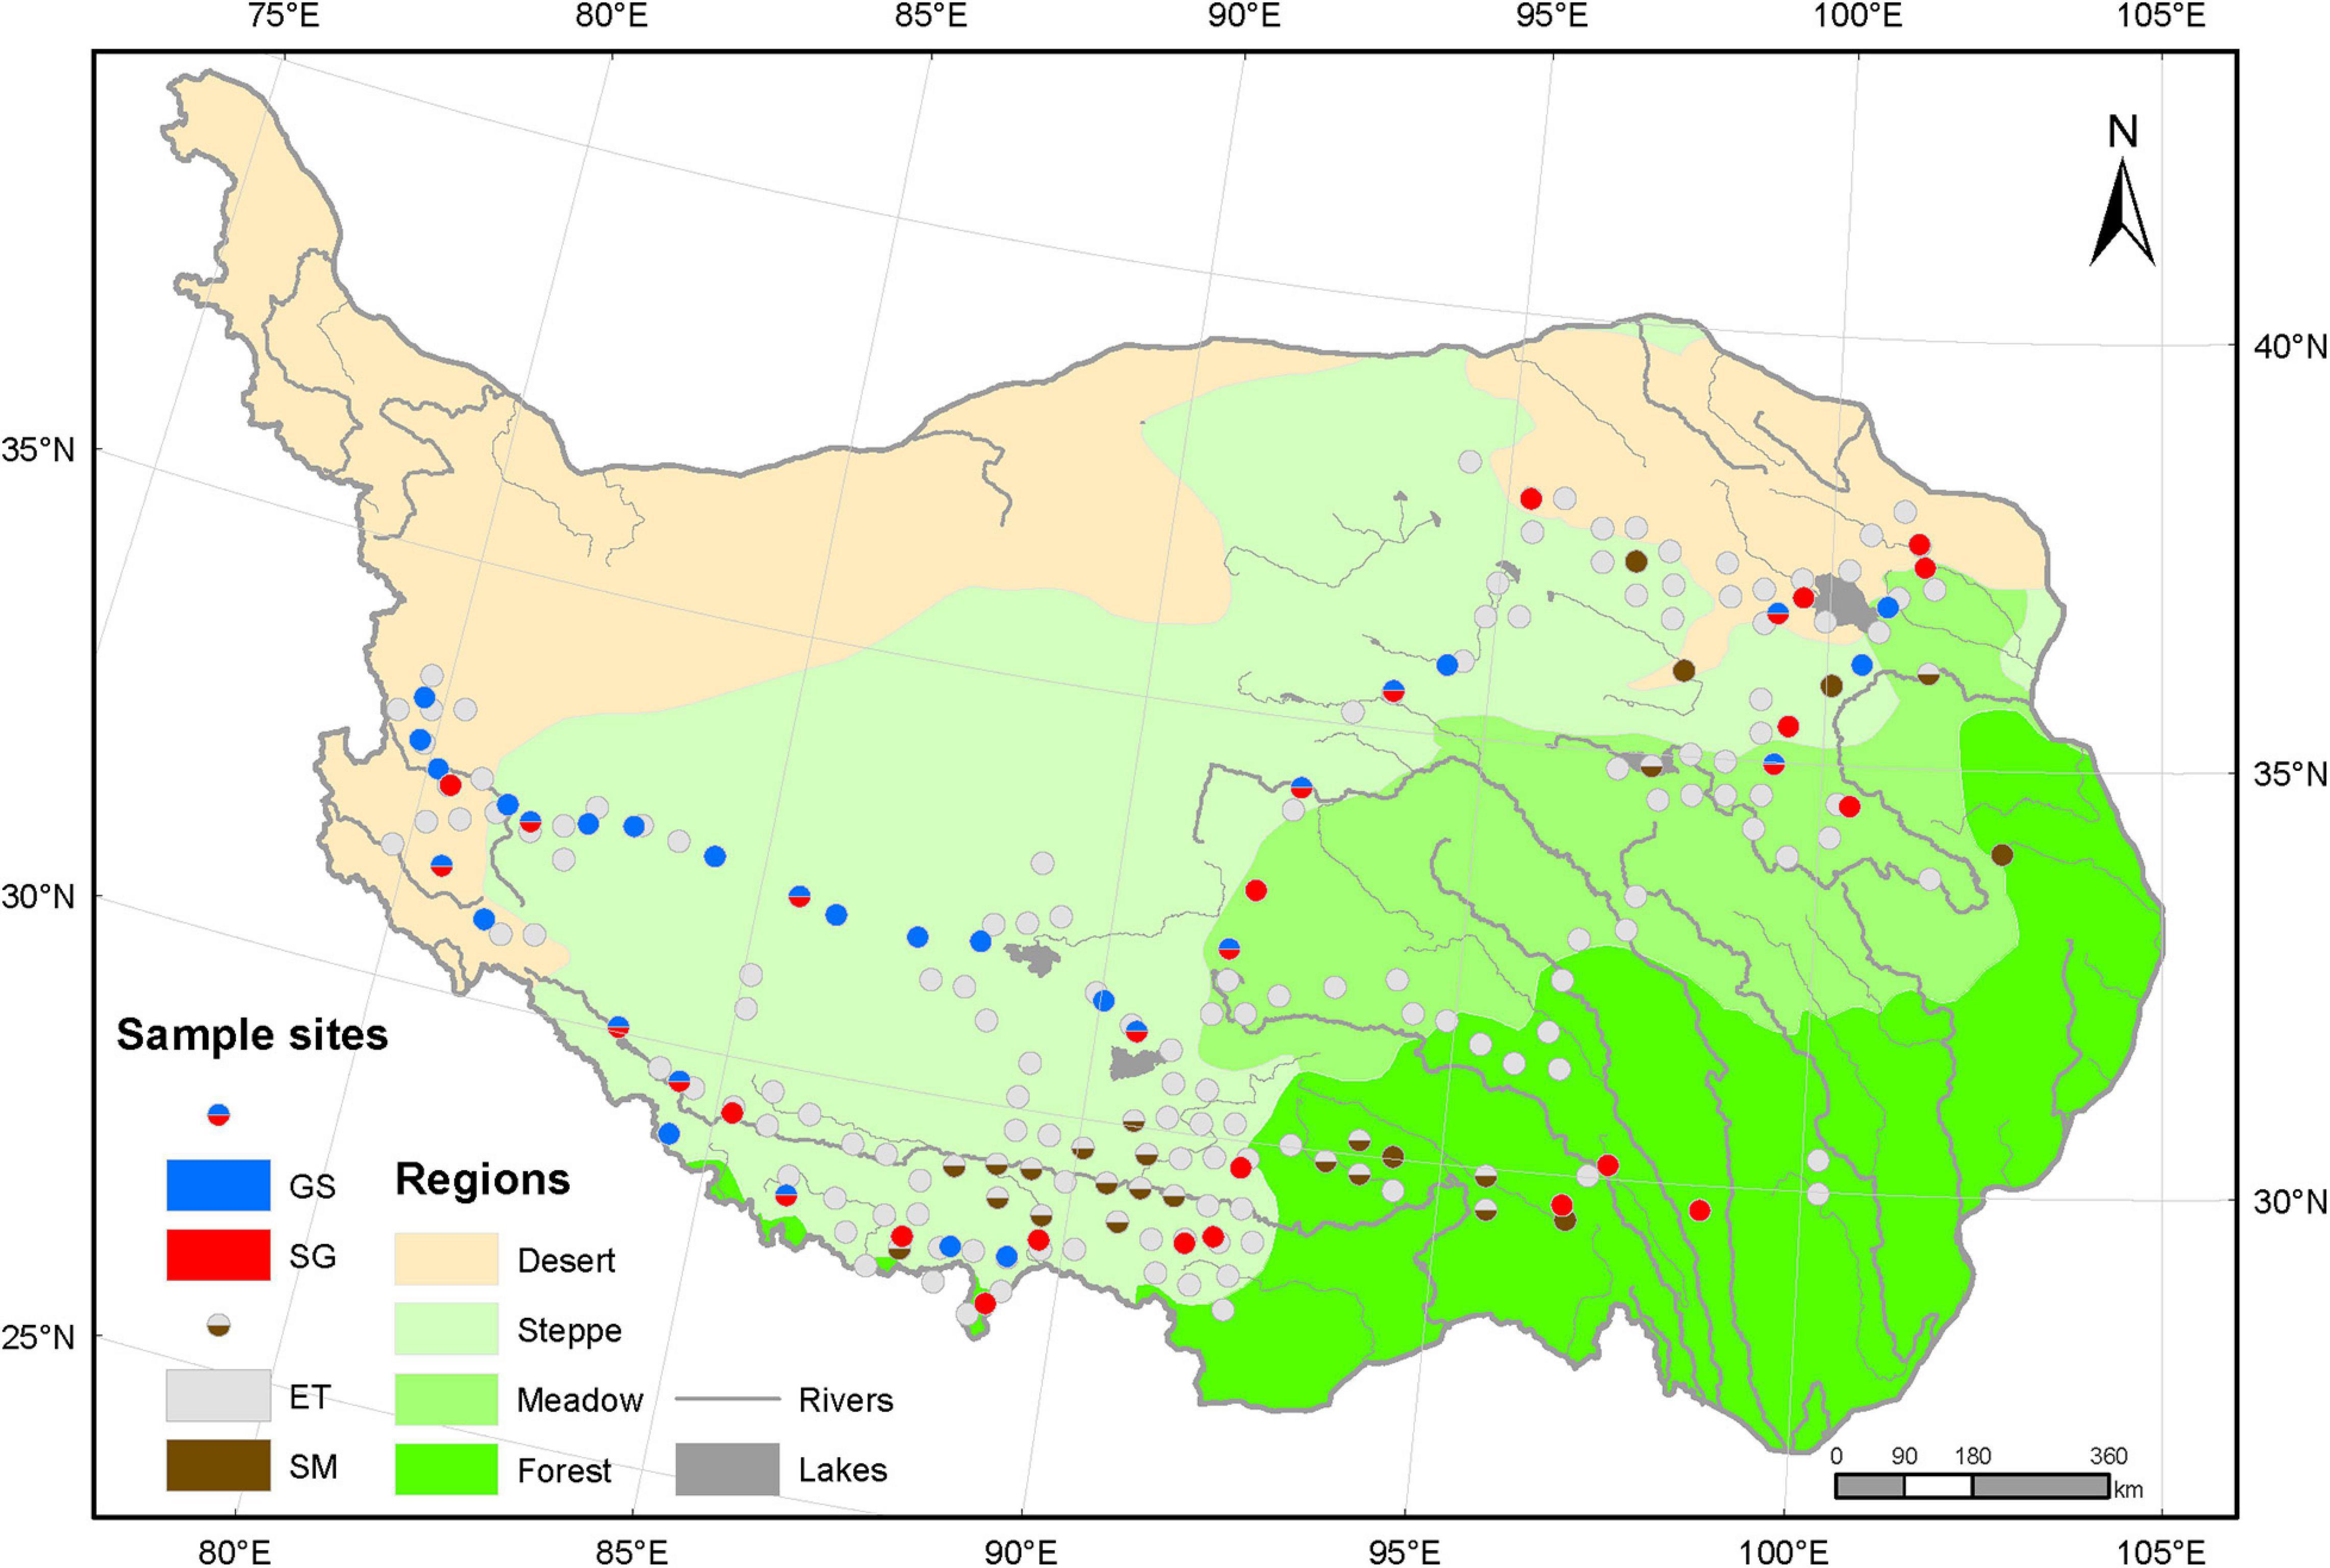
Figure 1. Sample sites on the Tibetan Plateau. Based on the vegetation regionalization scheme, the Tibetan Plateau was modified to four vegetation regions: forest, meadow, steppe grassland, and desert. The raw data for the origin scheme were download from the Resource and Environment Science and Data Center (http://www.resdc.cn). All 218 sample sites were divided into two groups: aquatic plots (170) and terrestrial plots (48). Aquatic plots were tagged as three types: emergent plants (ET) only, submerged plants (SM) only and ET and SM mixed plots, depending on whether a certain group of plants are present or not. The different portions in each terrestrial plot indicated the important values of sedges (SG) versus grasses (GS) and reflect the relative importance of the plant type in this plot. The SG and GS plots in forest region located in alpine meadow belt at high altitude above treeline, and the aquatic plots there were non-forest wetland habitats.
Field Sampling
In total, we investigated 218 1 m × 1 m plots in July and August of 2018. According to soil water level and species composition, the 218 plots were classified into two groups: aquatic plots (170) and terrestrial plots (48). All aquatic plots were in water-saturated habitats with overlying water while terrestrial ones were not.
For terrestrial plots, each 1 m × 1 m plot was divided into 100 10 cm × 10 cm grids. The plant percentage coverage of each species in each grid was estimated by eye and plant height was measured by a ruler. Alpine grassland communities are floristically rich. However, such communities are dominated by a few species while the other species play relatively weaker roles in community structure and function than dominant species. In this study, two indices were introduced to identify the dominant species. The first index was the importance value (IV) of each species and its proportions in the total IV. The importance values were calculated as follows (Fang et al., 2009).
The second one was plant volume of each species and its proportion in the total volume. As a surrogate of plant aboveground biomass, the plant volumes were calculated by multiplying plant coverage by height (Wang et al., 2013). According to the important values and plant volumes, two groups of plants were identified as dominant species: sedges of genera Kobresia, Carex, or Scirpus and grasses of genera Stipa or Poa (Supplementary Appendix Table 1). Aboveground materials of the dominant species (three of grasses and five of sedges) were collected for further analysis.
The aquatic habitats we investigated included the shallow areas (generally no deeper than 1.5 m) of lakes, rivers, marshes as well as streams, ponds, and channels. Temporary water bodies were excluded during field sampling, ensuring that aquatic plants could complete their life cycles. For aquatic plots, it cannot be divided into 10 cm × 10 cm grids. We estimated the percentage coverage and measured the height of each species at the whole 1 m × 1 m plot level, and collected all the aboveground materials. There were two plant forms in aquatic plots: submerged plants and emergent plants. Submerged plants are defined as the rooted aquatic macrophytes with root systems in sediments. The whole body of submerged plants, include leaves, are submersed in water while only lift the reproductive organs out of the water. Emergent plants are those growing in waterlogged soil with roots submerging in water and leaves in air. Finally, aboveground materials were collected from four common submerged species and 15 common emergent species.
Soil samples were collected in each plot at depth of 0–20 cm by a soil auger with the diameter of 38 mm. Because all aquatic plots were investigated in shallow areas, we waded into the water to dig the sediments using the same soil auger. Three soil samples were cored randomly in the plot, mixed and air dried for soil nutrients analysis.
Laboratory Analysis
The aboveground materials were separated by species. Firstly, 30–40 mature and intact fresh leaves of each species were picked out and expanded on a scanner (Canon Inc., Japan), to scan the flat area (cm2) of each species. The leaves were then oven dried at 70°C for 72 h to constant weight. The specific leaf area (SLA) was determined as leaf area per unit dry weight (cm2 g–1). Then, all the other biomass materials were also oven dried at 70°C for 72 h, ground and sieved through a 0.15 mm mesh sieve to measure the mass-based leaf total nitrogen concentration (Nmass, mg g–1) and phosphorus concentration (Pmass, mg g–1), respectively. Nmass were determined using Vario MACRO cube elemental analyzer (Elementar Analysensysteme GmbH, Germany), while Pmass were measured via the molybdate/stannous chloride method (Kuo, 1997) following H2SO4-H2O2-HF digestion (Bowman, 1988). The area-based leaf nitrogen contents (Narea, g m–2) and leaf phosphorus contents (Parea, g m–2) were calculated via mass-based element concentrations divided by SLA.
The air-dried soil samples for nutrients analysis were ground, sieved by 0.15 mm mesh sieve to measure soil total nitrogen content (STN) and soil total phosphorus content (STP). Methods of STN and STP analysis were the same for plant samples, respectively.
Climate Variables
Growing season mean air temperature (GST, °C), growing season precipitation (GSP, mm), and growing season mean solar radiation (GSR, kJ m–2 day–1) were introduced to explain the effects of climate variables on plant traits and their bivariate traits correlations. Growing season on the Tibetan Plateau was defined as the 5 months from May to September (Wang et al., 2013). The climate variables were extracted from the climatic raster database that was download from the world climate website2.
Data Analysis
Plant Grouping
Terrestrial plots dominated by sedges mainly locate in east part of the Tibetan Plateau, while the plots dominated by grasses in west part, reflecting the decreased trends of water availability from east to west (Zheng and Zhao, 2017). Aquatic plots are habitat-dependent and embed in all vegetation regions. According to plant life forms, we further divided all plants into four groups: emergent plants and submerged plants from aquatic plots, sedges, and grasses from terrestrial plots. Then, we compared the mean values of the three climatic variables (GST, GSP, and GSR) and three soil properties (N, P contents and N:P ratios) among the plots dominated by different plants. The results showed that GST of aquatic plants were higher than that of terrestrial plots, while the lowest GSP but highest GSR were observed in plots of grasses (Figures 2A–C). Aquatic substrates concentrated more N and P than terrestrial soil but the N:P ratios did not show significant differences between the four types of plots (Figures 2D–F). Thus, we considered that these four plant groups face different combinations of environmental factors, and may evolve varied adaptive strategies. Because aquatic substrates are always water-saturated, GSP was not suitable as a climatic factor for both emergent plants and submerged plants. Meanwhile, considering that solar radiation is influenced by a variety of factors (water depth, turbidity, etc.) and loses rapidly in water, GSR was excluded when analyzing the effects of climatic factors on traits of submerged plants.
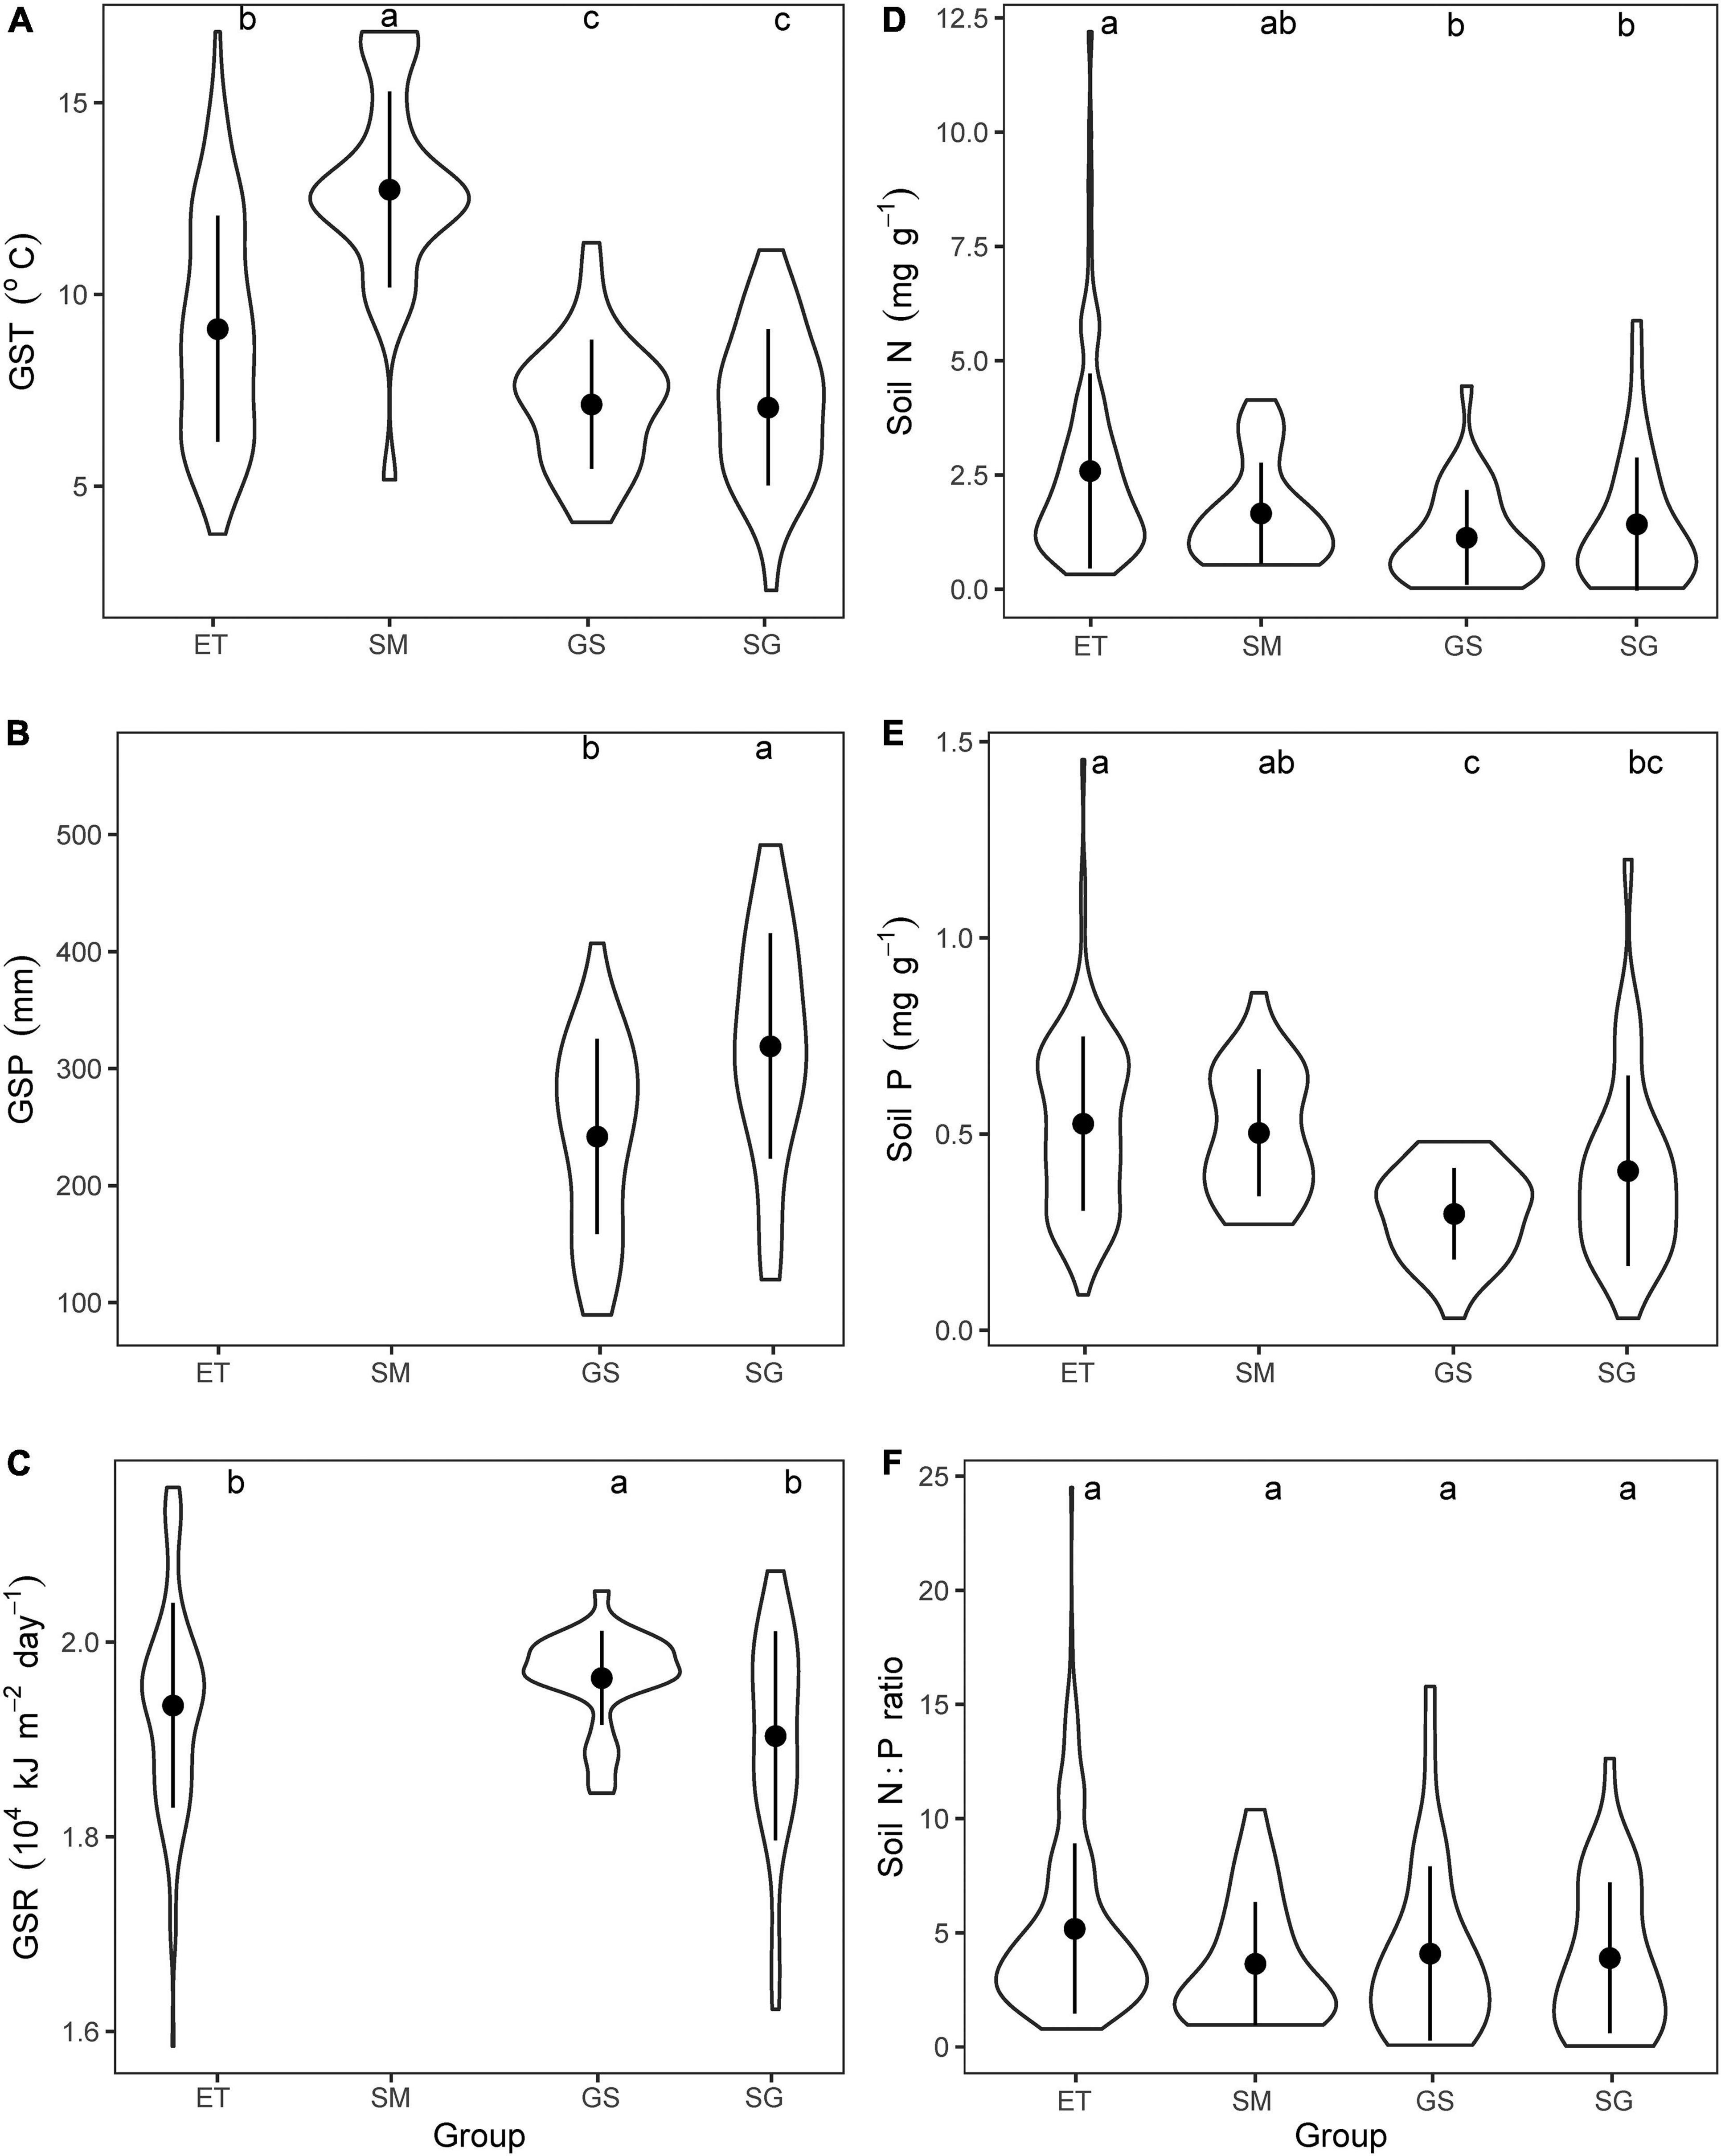
Figure 2. Comparing the mean values of climatic variables and soil properties of nutrients. (A) Growing season mean air temperature (GST), (B) growing season precipitation, (C) growing season mean solar radiation, (D) soil total N contents, (E) soil total P contents, (F) soil N:P ratios for plots dominated by the four plant groups. ET, emergent plants, GS, grasses, SG, sedges, and SM, submerged plants. GSP for both emergent plants and submerged plants, and GSR for submerged plants were excluded. The lowercase letters on the top of each panel showed the results of Kruskal–Wallis test and Dunn’s Post Hoc Multiple Comparisons (p < 0.05).
Comparison of Mean Values
In terms of plant traits, leaf Nmass, Pmass, and SLA were measured by plant sample analysis directly, while N:P ratios, Narea, and Parea were calculated by mass-based traits. We defined the first three traits as measured plant traits, and the last three ones as transformed traits. We firstly tested if the plant traits data within each plant group followed normal distribution by Shapiro–Wilk normality test. The results showed that all traits were non-normal distribution (p < 0.05). Then, we compared the mean values of leaf Nmass, Pmass, SLA, N:P ratios, Narea, and Parea among the four plant groups by Kruskal–Wallis test and Dunn’s Post Hoc Multiple Comparisons with R (version 3.6.3) packages stats and PMCMR (Pohlert, 2014).
Standardized Major Axis (SMA) Analysis
To compare the differences in the trait-trait correlations among the four plant groups, and the differences in the effects of environmental factors on plant traits, we applied SMA analysis using software R (version 3.6.3) with its package smatr (Warton et al., 2012). The analyses were performed by following the steps below.
(i) All the plant traits data were log-transformed before analysis. Then, we built bivariate correlations within the three measured traits for each plant group, respectively, and tested if the correlations were significant (p < 0.05). If a certain correlation was non-significant, this correlation should be excluded from further analysis of slopes comparisons among plant groups.
(ii) We further fitted all six plant traits against climatic variables to explore the effects of environmental factors on plant traits. Similarly, slopes were compared only if the regressions were significant (p < 0.05).
(iii) Three steps were performed in SMA analysis (Warton et al., 2006; Pan et al., 2020a). Test 1 for comparing the differences in slopes by running code sma(y∼x × groups, multcomp = TRUE). Only if the correlation lines among groups were different significantly (p < 0.05), the multiple pair-wise comparisons (the argument multcomp = TRUE) in slopes were applied. If the slopes between plant groups were equal (p > 0.05), we then tested the shifts along the common slope and elevation differences among the parallel slopes.
Test 2 for testing the shifts along the common slope by sma(y∼x + groups, type = “shift,” multcomp = TRUE).
Test 3 for comparing the differences in elevations among the parallel slopes between groups, by sma(y∼x + groups, type = “elevation,” multcomp = TRUE).
Only if all three tests were non-significant, should we define that one fit curve was not differ from the other one significantly.
Results
Traits Values of Different Plant Groups
The mean values of leaf traits (Nmass, Pmass, and SLA) showed significant differences (p < 0.001) among different groups (Figure 3 and Table 1).
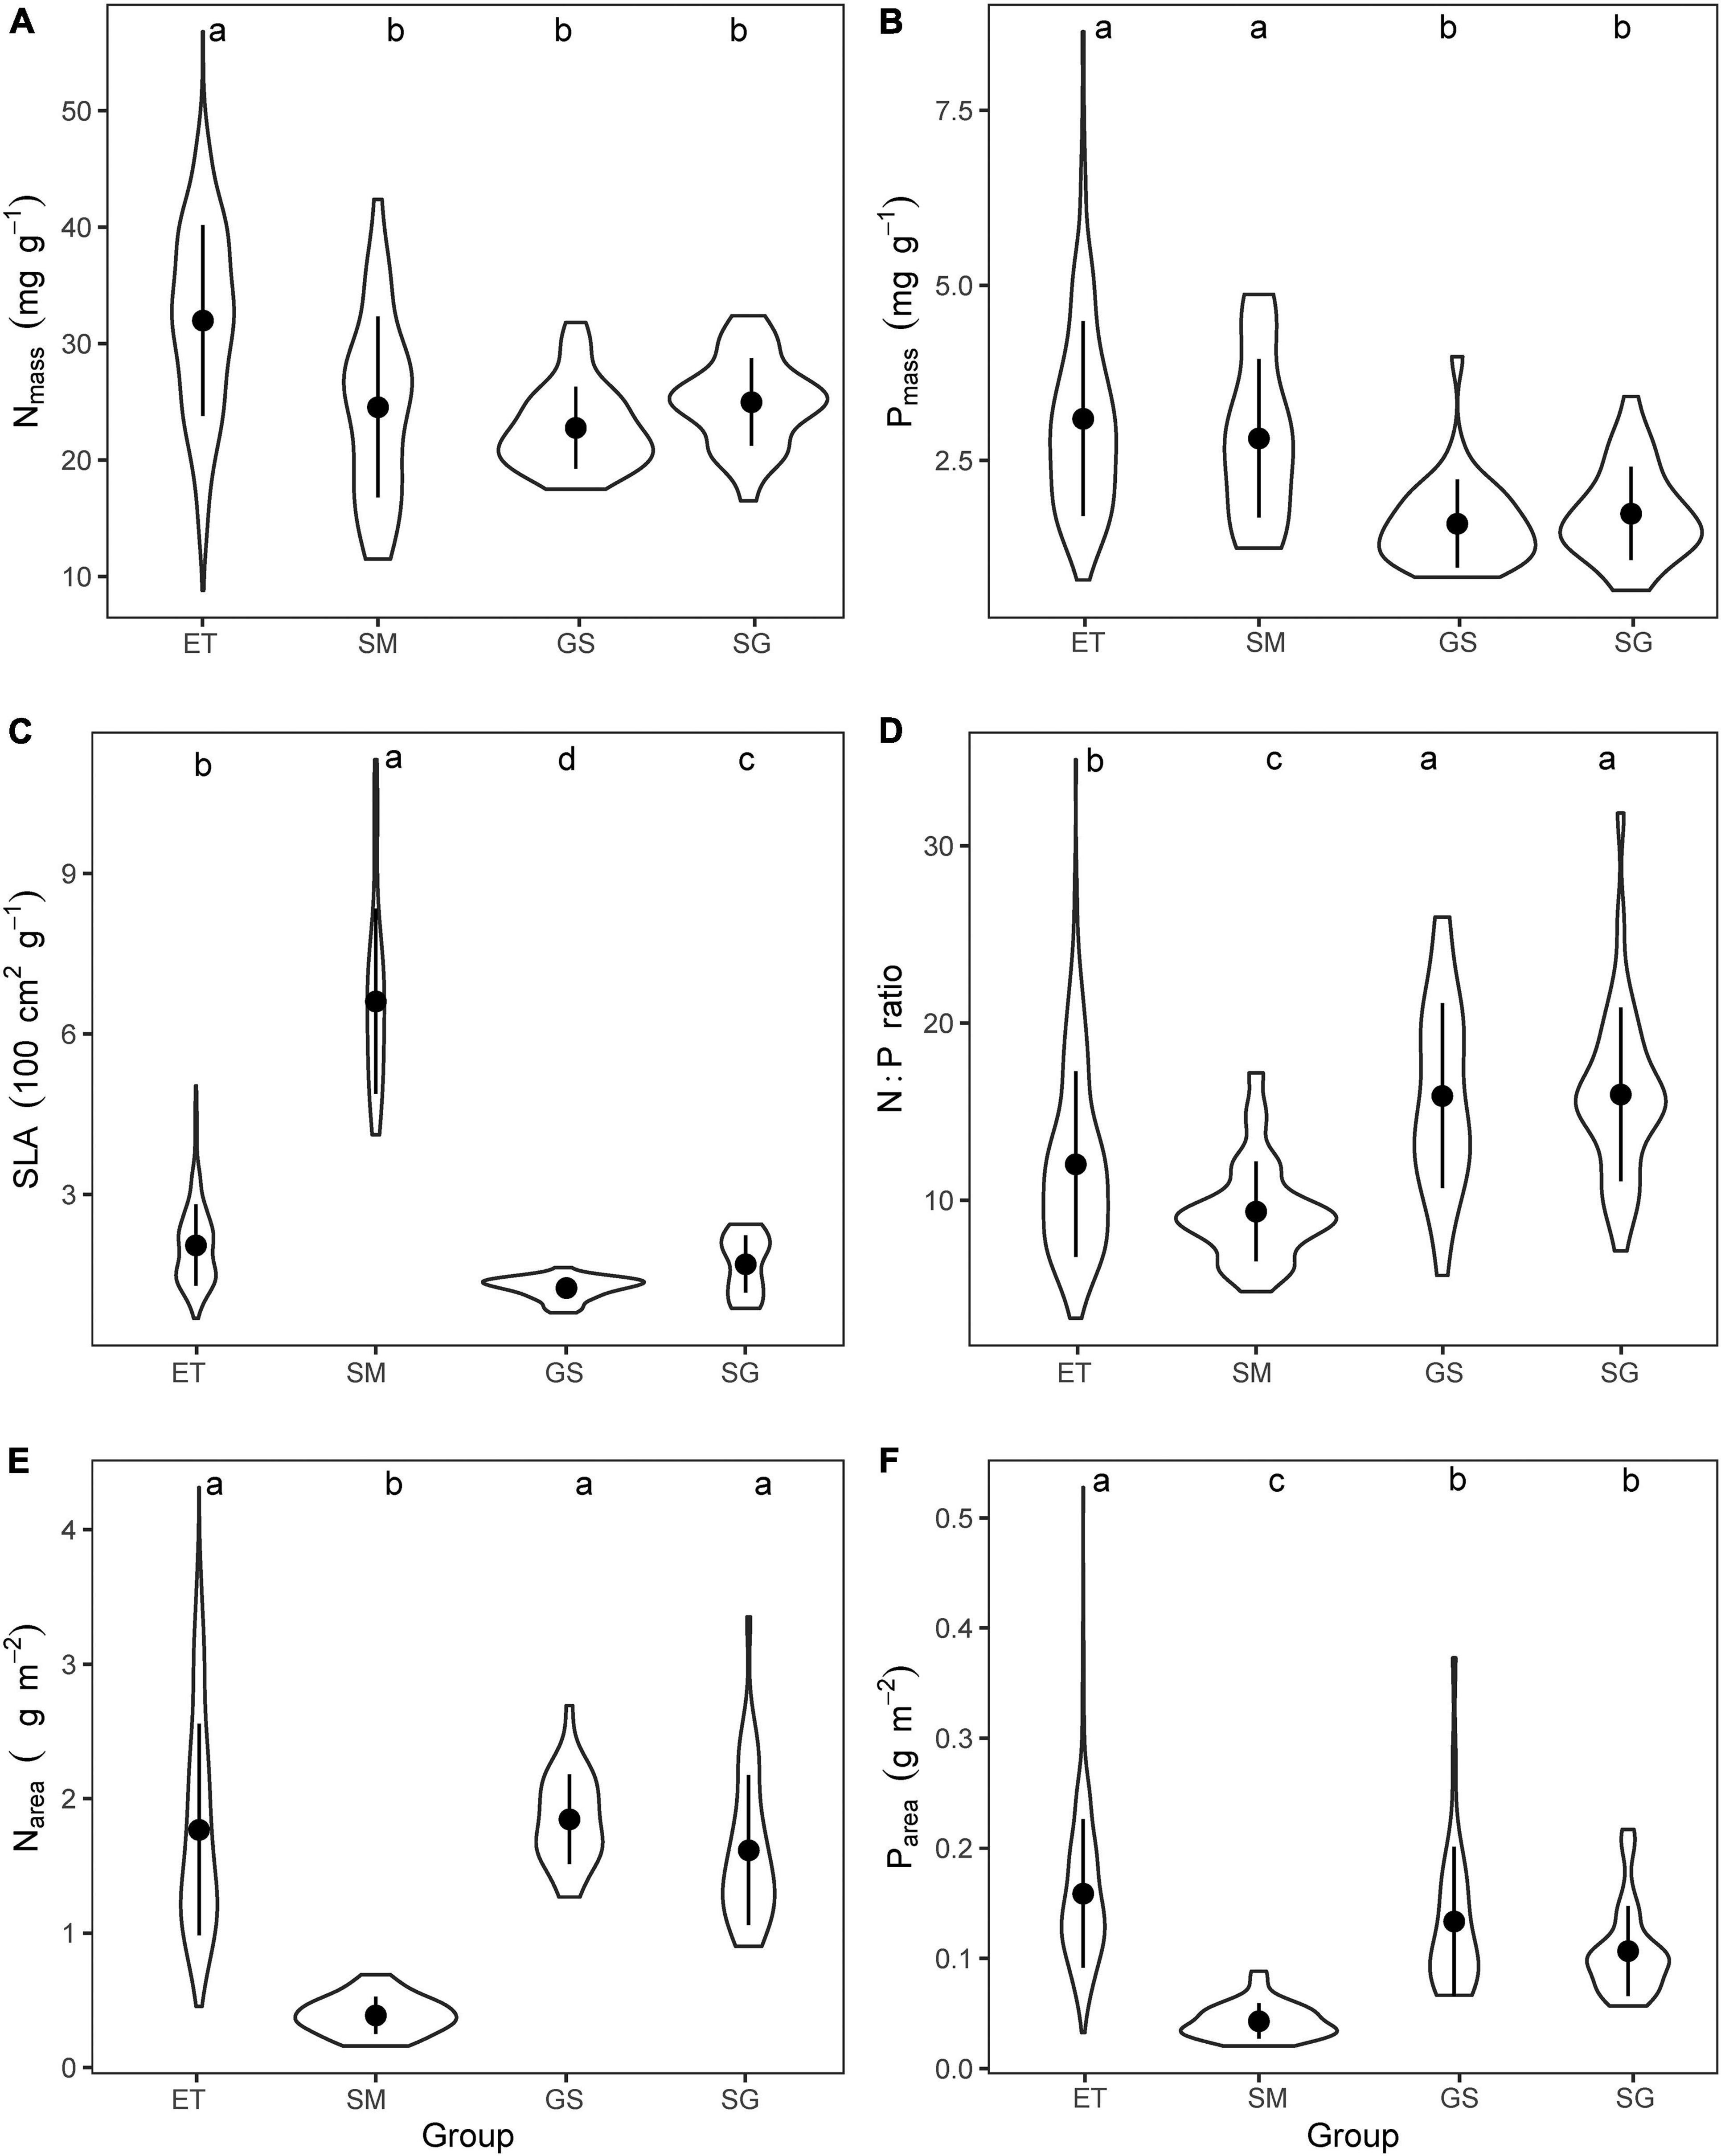
Figure 3. Comparing the mean values of (A) mass-based leaf nitrogen concentration (Nmass), (B) mass-based leaf phosphorus concentration (Pmass), (C) specific leaf area (SLA), (D) mass-based N:P ratios, (E) area-based leaf nitrogen content (Narea), and (F) area-based leaf phosphorus content (Parea) for the four plant groups. ET, emergent plants, GS, grasses, SG, sedges, and SM, submerged plants. The lowercase letters on the top of each panel showed the results of Kruskal–Wallis test and Dunn’s Post Hoc Multiple Comparisons (p < 0.05).
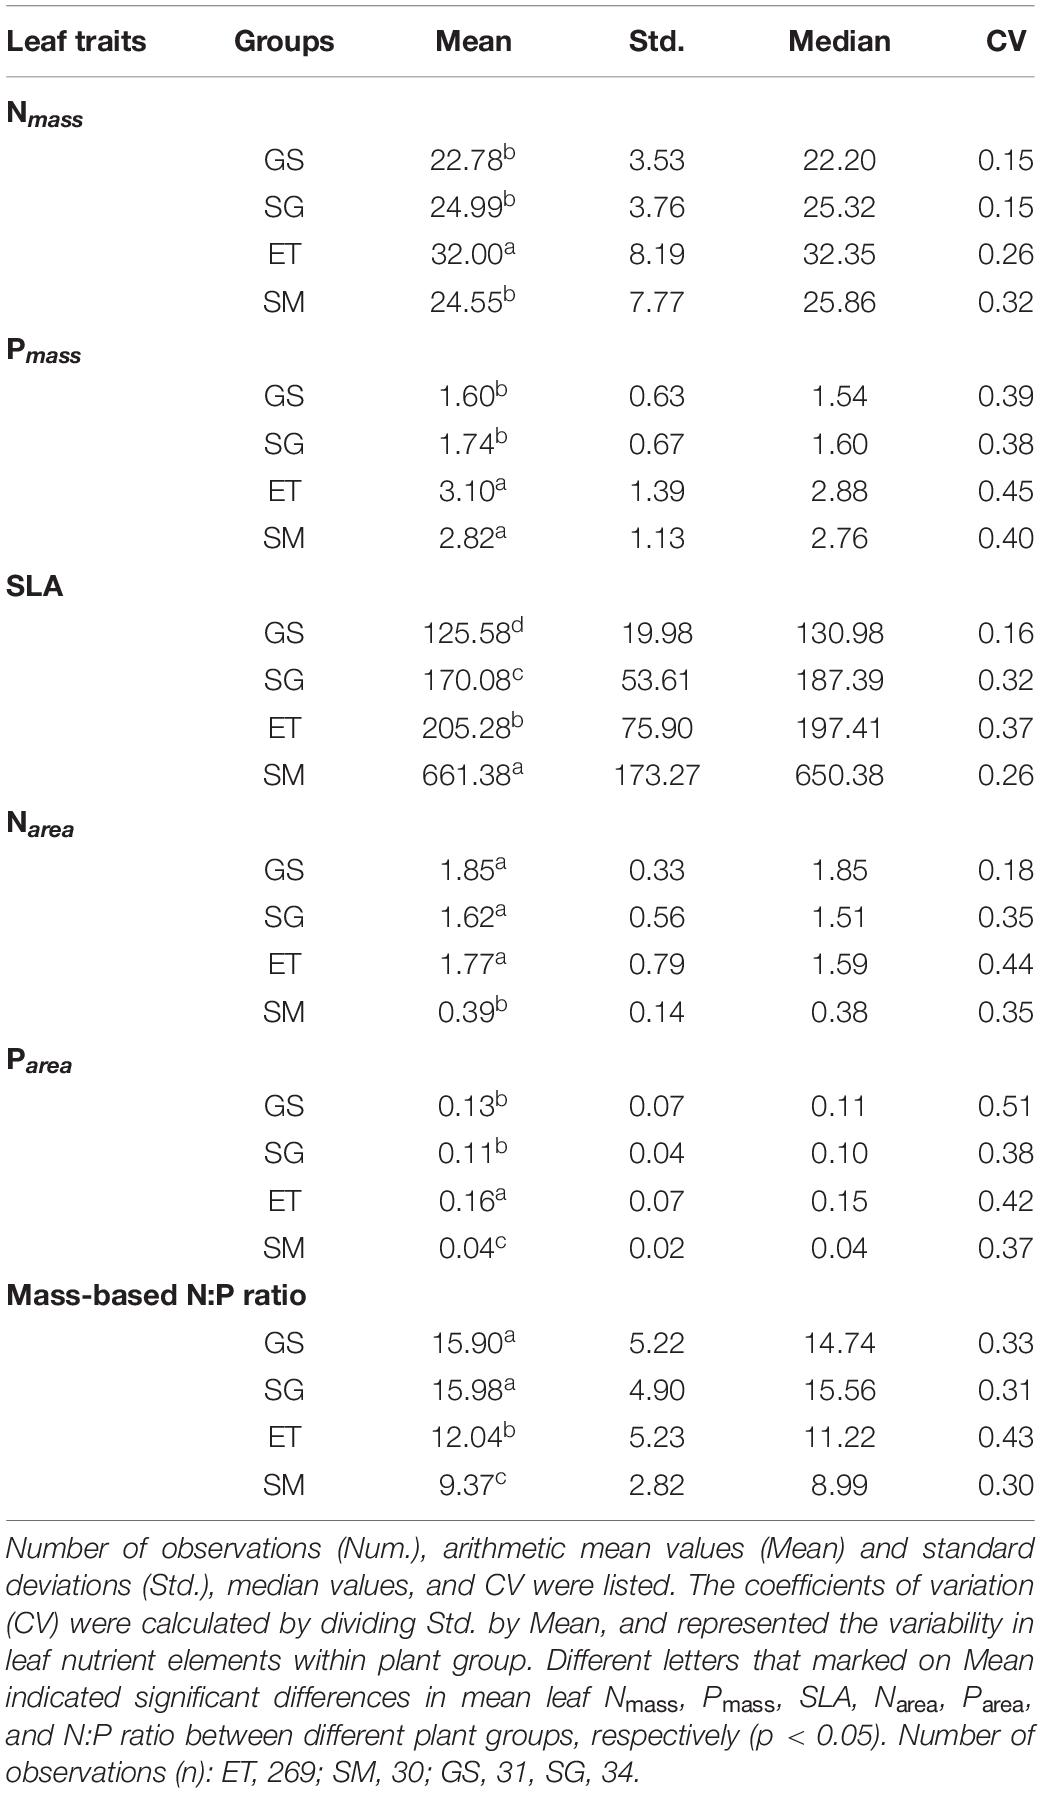
Table 1. Leaf N, P concentrations on mass-based (mg g–1) and area-based (g m–2), Specific leaf area (SLA, cm2 g–1) and N:P ratios for two groups of aquatic plants (emergent, ET and submerged, SM) and two groups of terrestrial plants (grasses, GS and sedges, SG).
(i) Emergent plants had significantly higher leaf Nmass than those of other groups, but there were no significant differences between submerged plants and their terrestrial counterparts (Figure 3A). Aquatic plants had higher leaf Pmass (Figure 3B) and lower leaf N:P ratios (Figure 3D) than terrestrial grassland species.
(ii) Grasses that well adapted to arid and semiarid climate had the lowest SLA, while the submerged plants showed extremely high SLA (Figure 3C). Therefore, when mass-based leaf N and P were transformed to area-based traits via dividing by SLA, submerged plants showed significantly lower leaf Narea and Parea (Figures 3E,F). SLA and area-based traits of emergent plants were closer to those of terrestrial plants than submerged plants.
Trait-Trait Correlations Between Leaf Nmass, Pmass and SLA
By applying the standardized major axis (SMA) analysis, we built the correlations for every trait pairs (Figure 4) and compared the pair-wise differences in slopes of the four groups (Table 2).
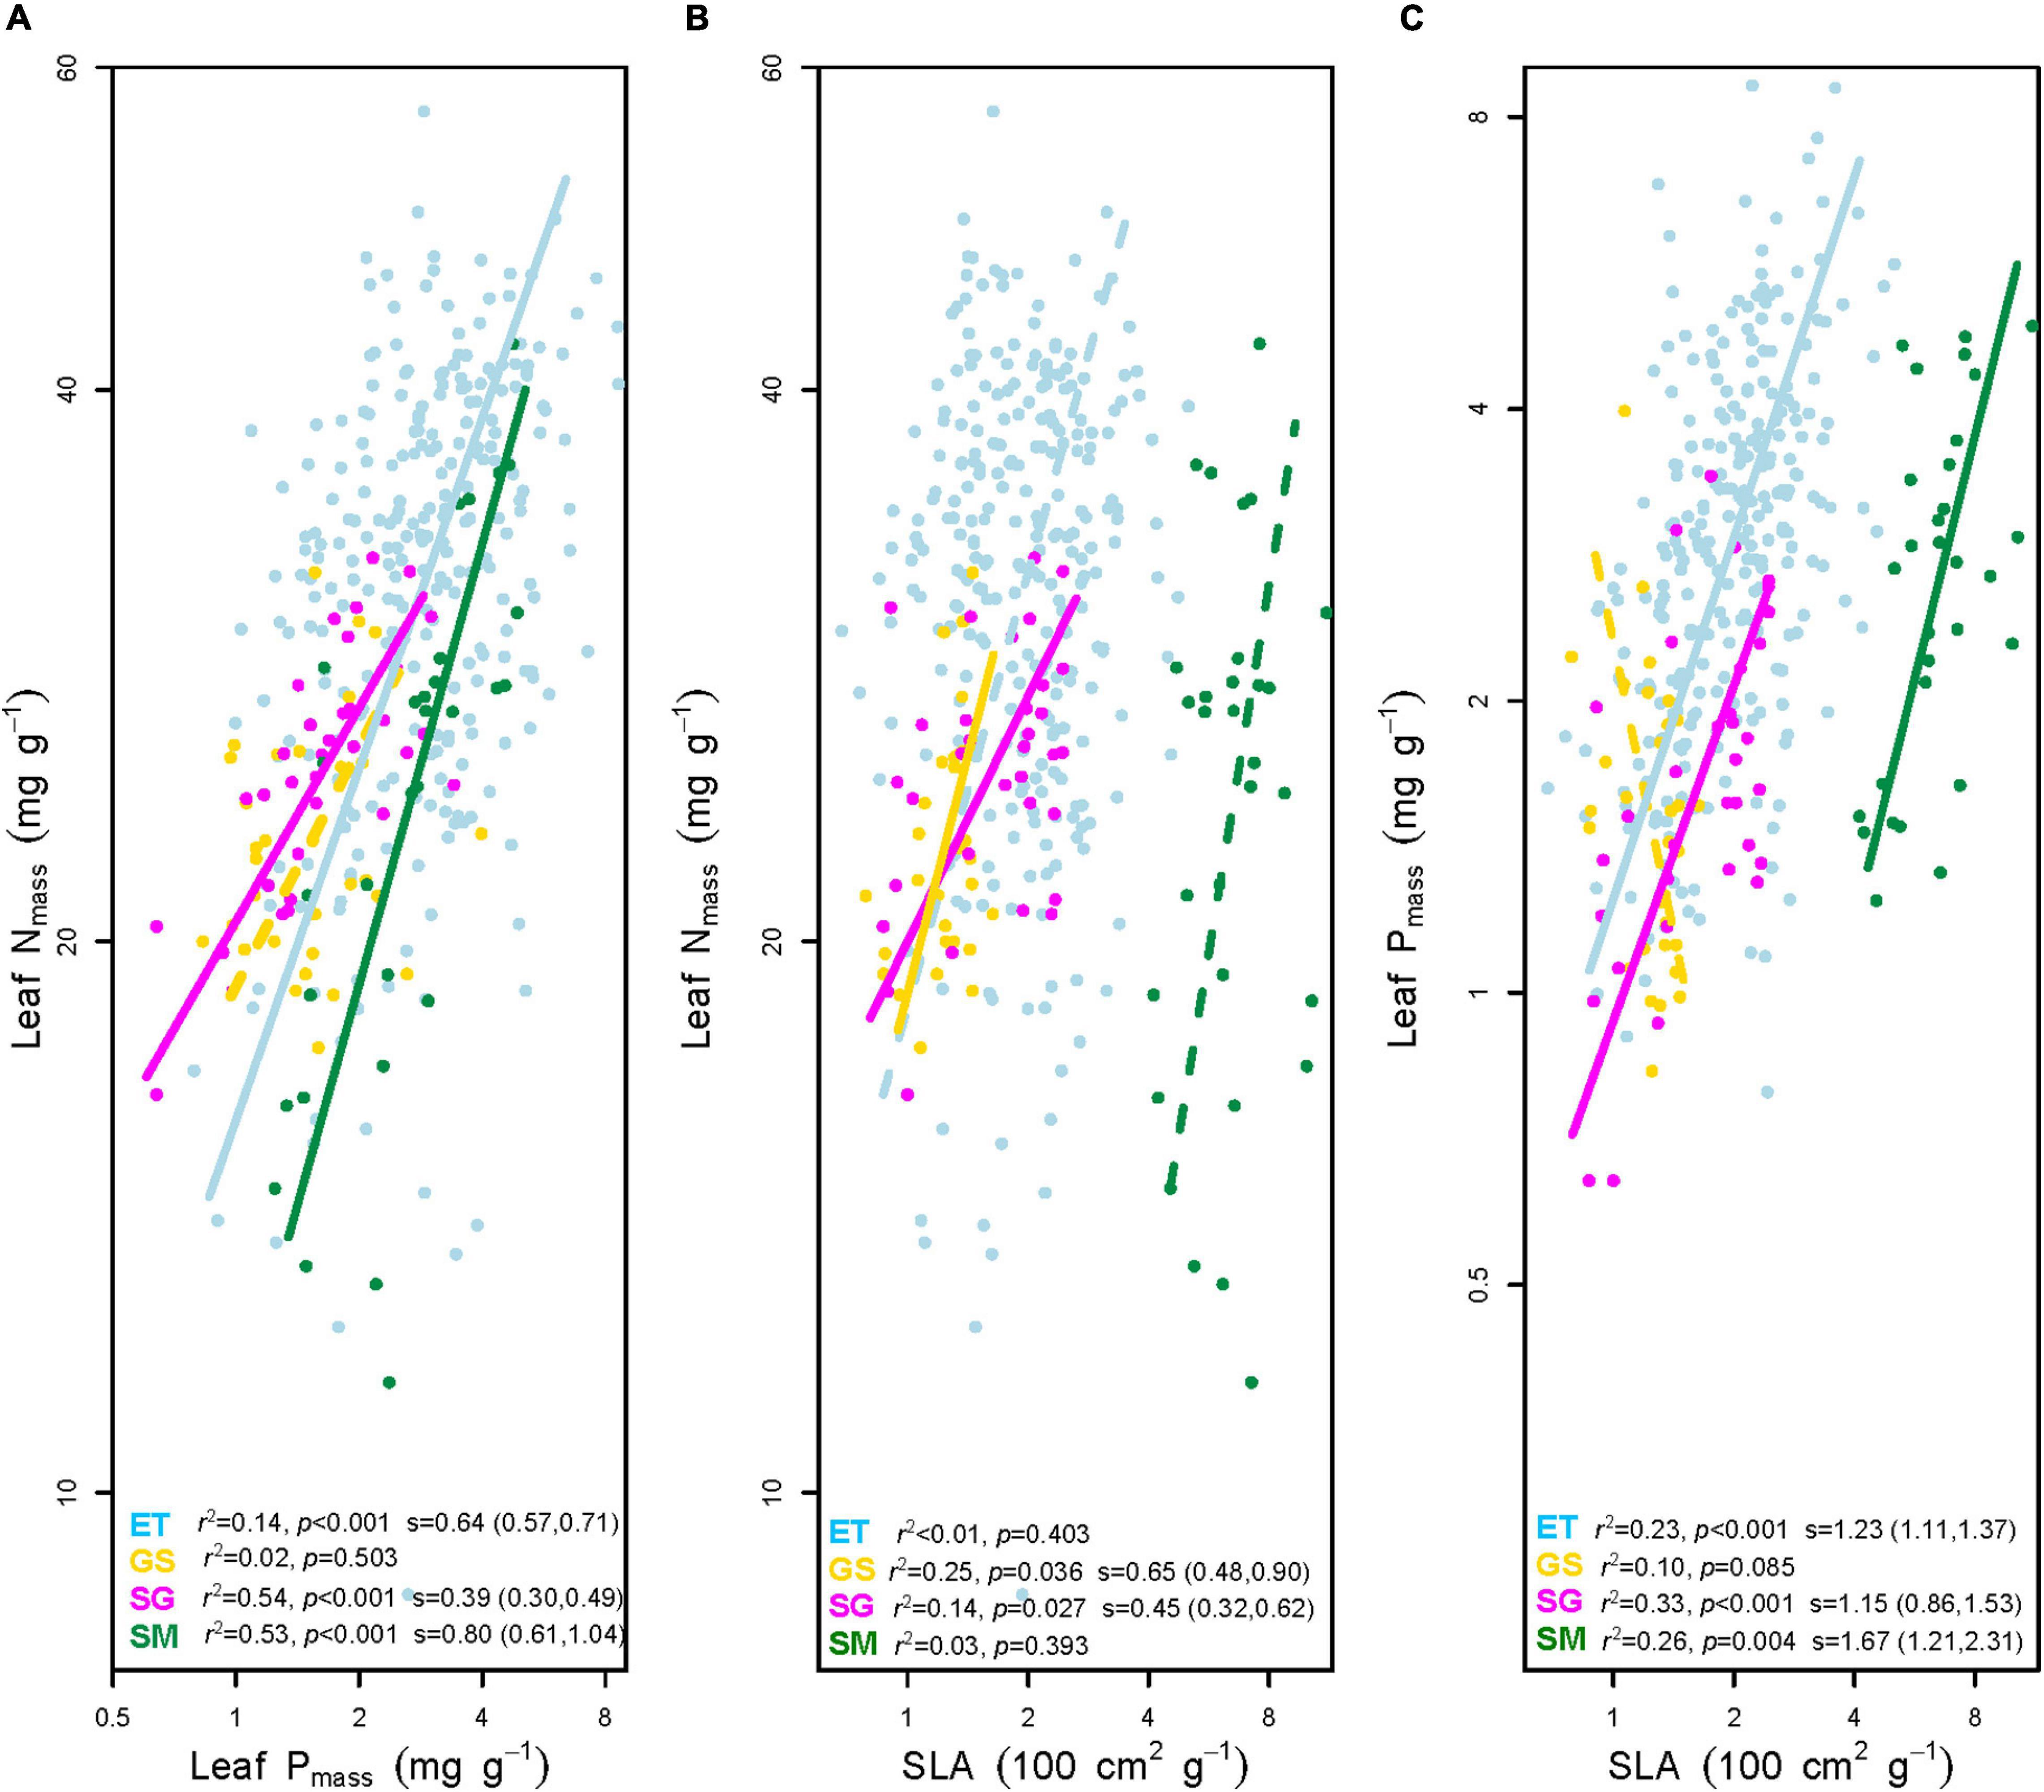
Figure 4. Bivariate correlations between mass-based leaf nitrogen concentration (Nmass), mass-based leaf phosphorus concentration (Pmass), and specific leaf area (SLA). (A) Leaf Nmass vs. leaf Pmass. (B) Leaf Nmass vs. SLA. (C) Leaf Pmass vs. SLA. ET, emergent plants, GS, grasses, SG, sedges, and SM, submerged plants. Solid lines denoted that the two traits correlated with each other at significance level p < 0.05, while the dashed lines showed non-significant correlations. The coefficients of determination (r2) and p values for trait-trait correlations were given on the bottom of each panel. The slopes (s) with 95% confidence interval of each regression line were added only if p < 0.05.
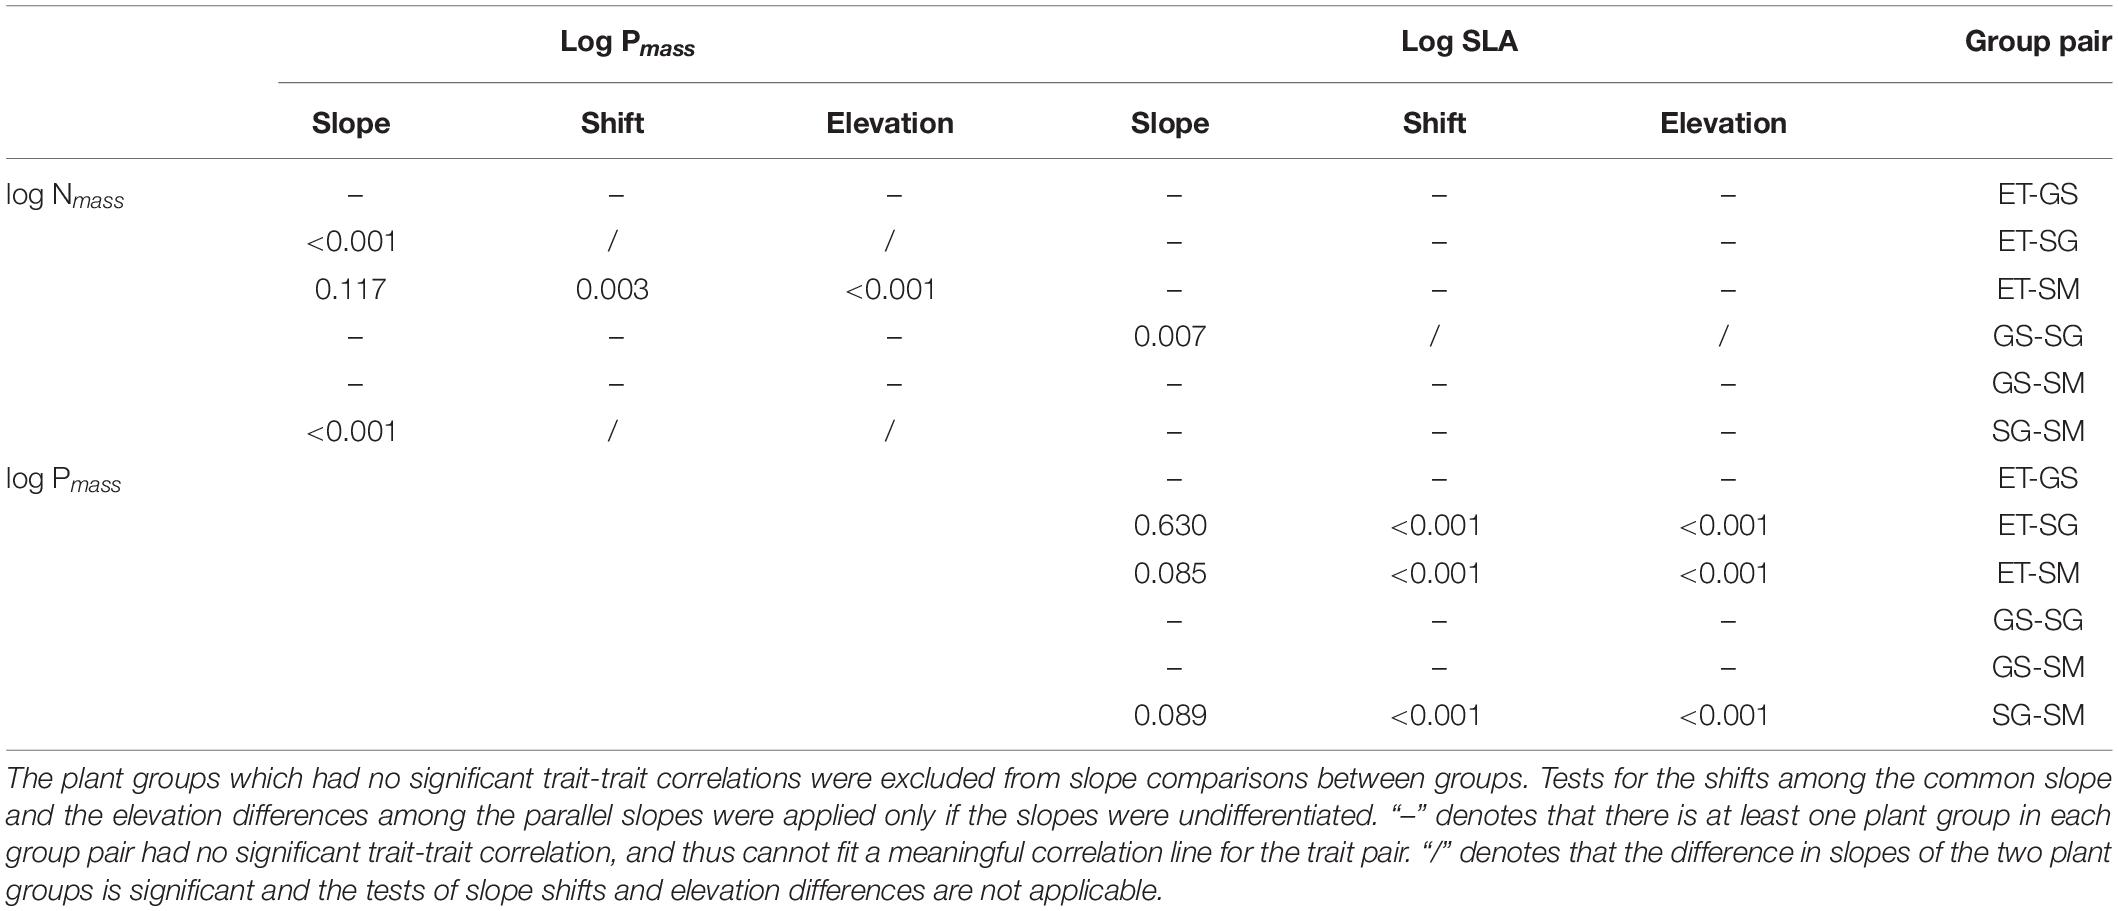
Table 2. The multiple comparisons of the trait-trait correlations between every two plant groups.
(i) Three out of four groups showed significantly positive leaf Nmass – Pmass correlations. In general, SMA slopes of the three groups were unequal (p < 0.01). The multiple comparisons revealed that the slope of sedges was significantly flatter (p < 0.01), while those of the other two plant groups did not differ from each other (p > 0.05).
(ii) Leaf Nmass of grasses and sedges was positively correlated to SLA (p < 0.05). SMA slopes were significantly different between the two groups (p = 0.007).
(iii) In terms of the bivariate traits of leaf Pmass-SLA, three out of four groups were positive (p < 0.01). All SMA slopes of the three groups were equal (p = 0.247), which means there were no significant differences among them. Tests of the slope shifts and elevation differences for all undifferentiated slopes showed that the fit curves were different significantly (p < 0.05 for shift and/or elevation in Table 1), indicating that the trait-trait correlations of different plant groups were separate from each other.
Effects of Environmental Factors on Plant Traits
We further tested the effects of GST, GSP, and GSR on measured plant traits (Figure 5) and transformed plant traits (Figure 6).
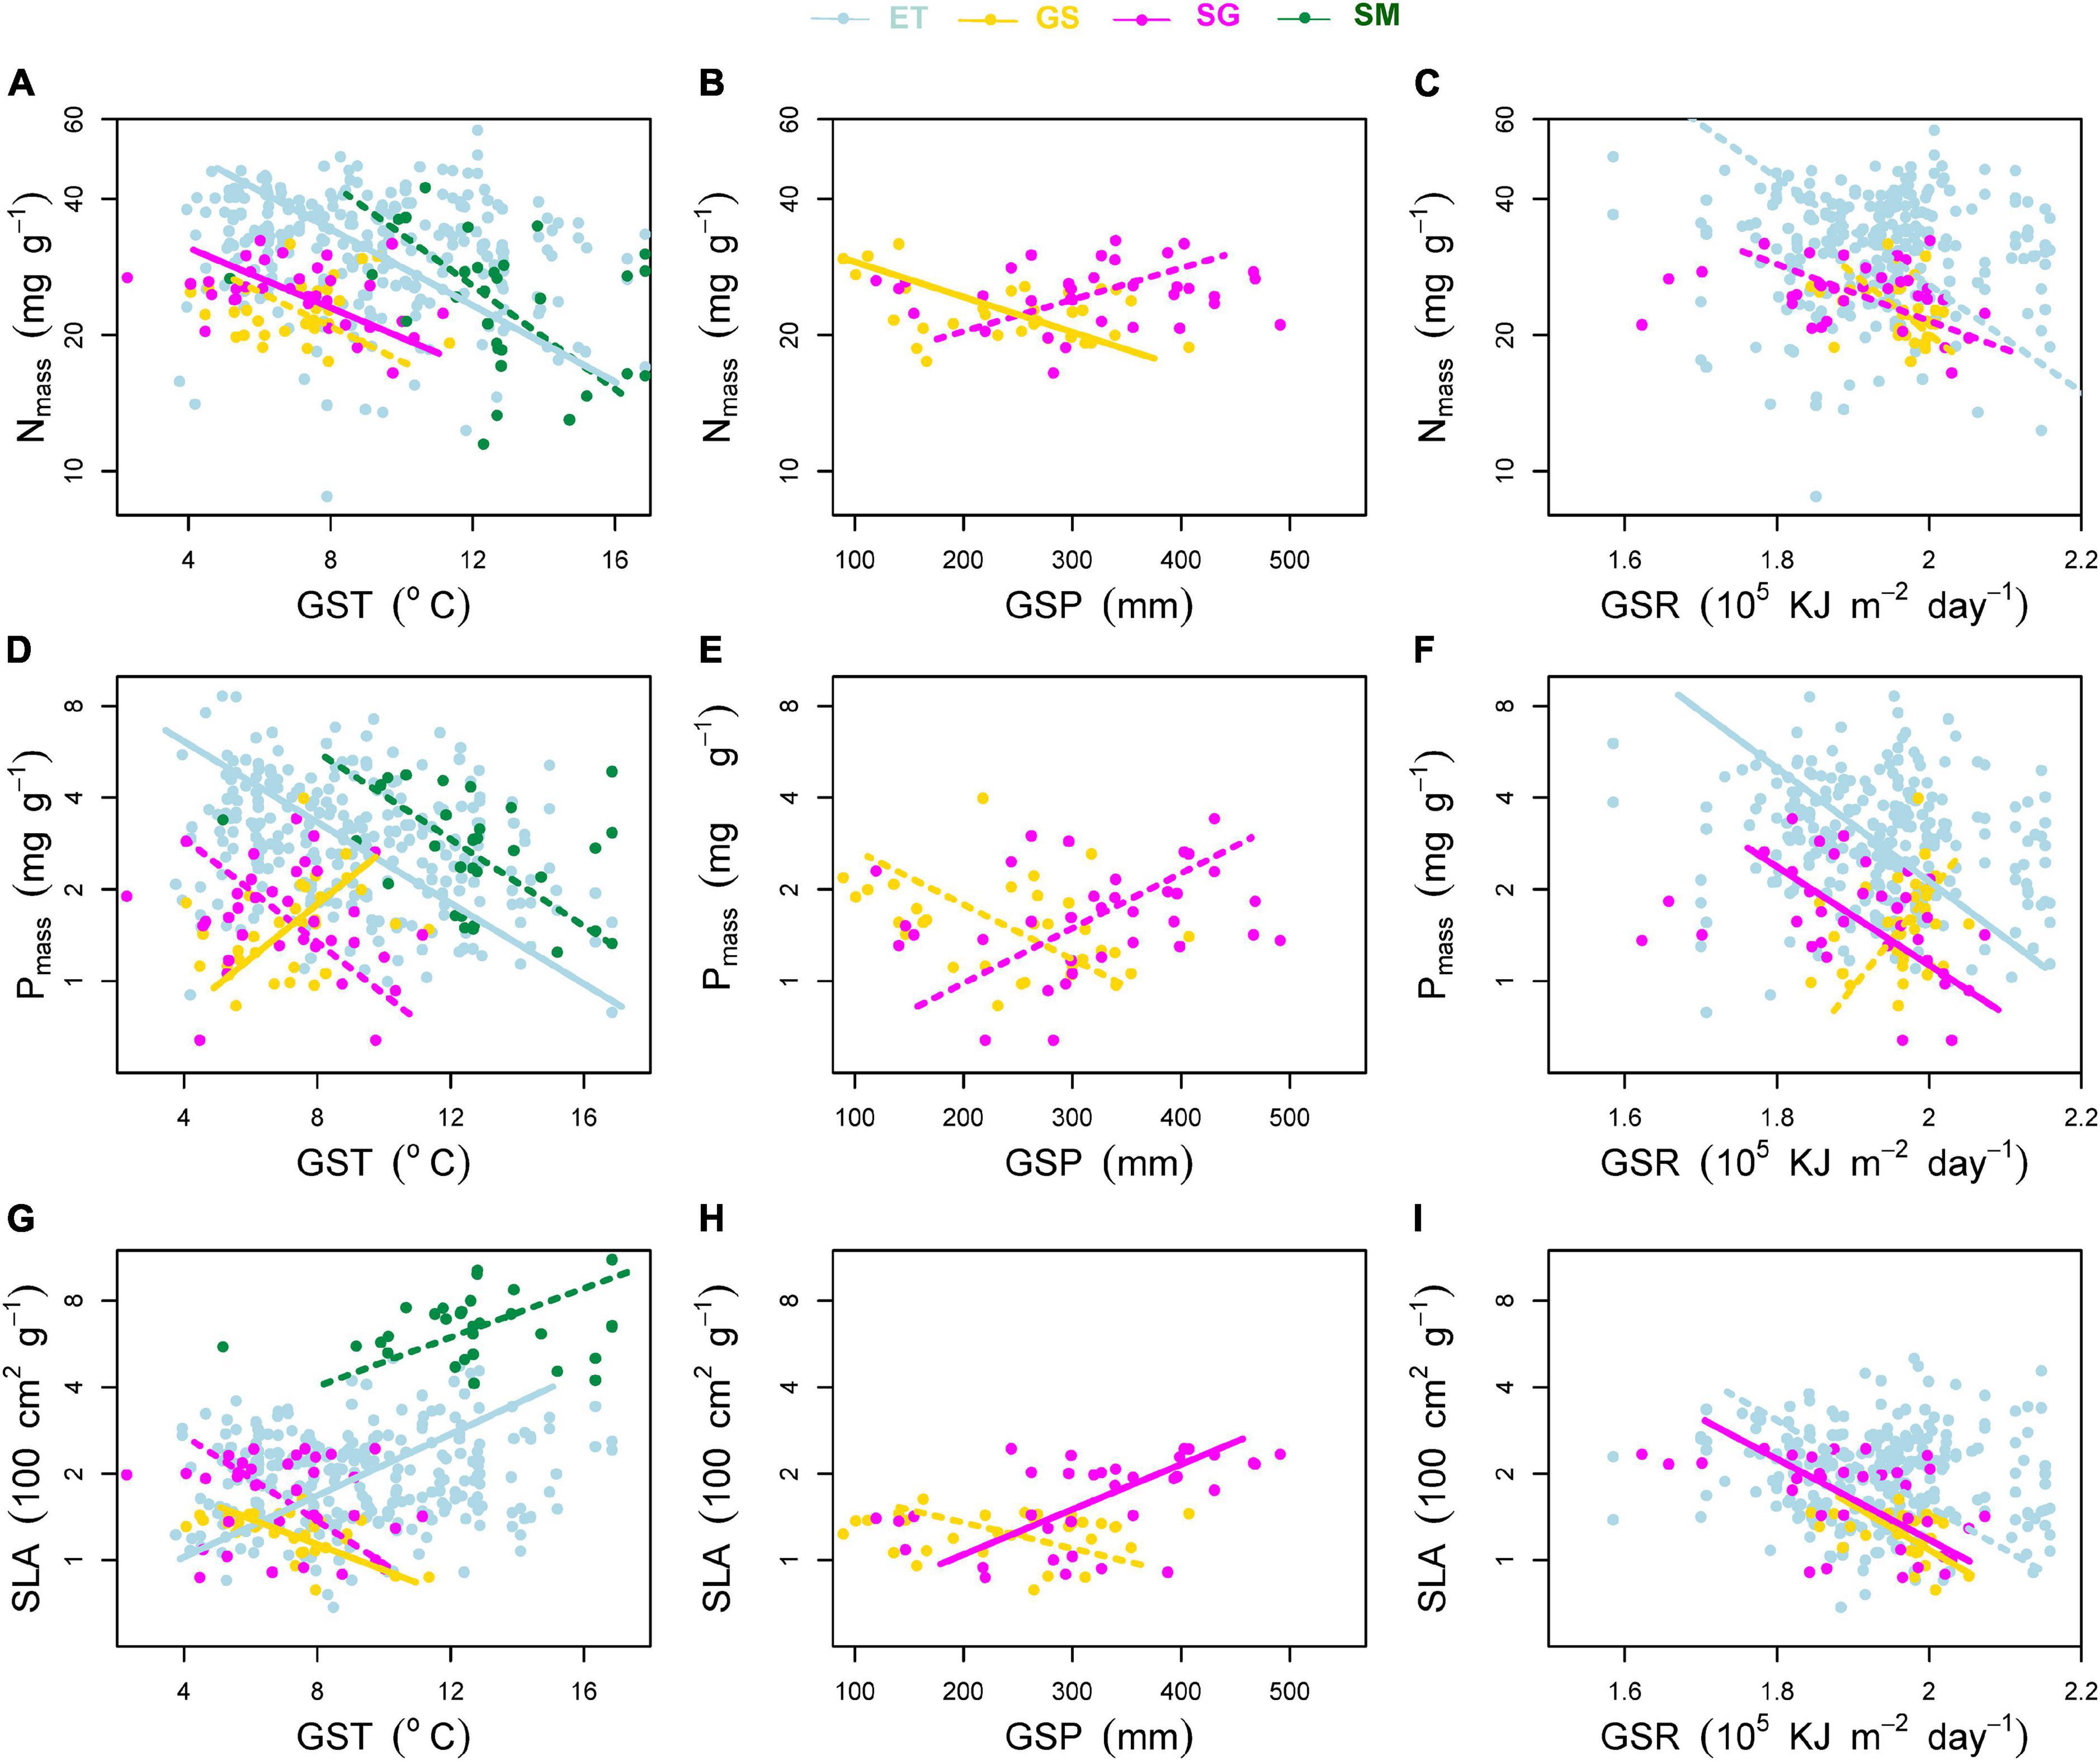
Figure 5. Effects of environmental factors on (A–C) mass-based leaf nitrogen concentration (Nmass), (D–F) mass-based leaf phosphorus concentration (Pmass) and (G–I) specific leaf area (SLA). Environmental factors include growing season mean air temperature (GST), growing season mean precipitation (GSP), and growing season mean solar radiation (GSR). ET, emergent plants, GS, grasses, SG, sedges, and SM, submerged plants. Solid lines denoted that the environmental factors affected the plant traits significantly at significance level p < 0.05, while the dashed lines showed non-significant relationships.
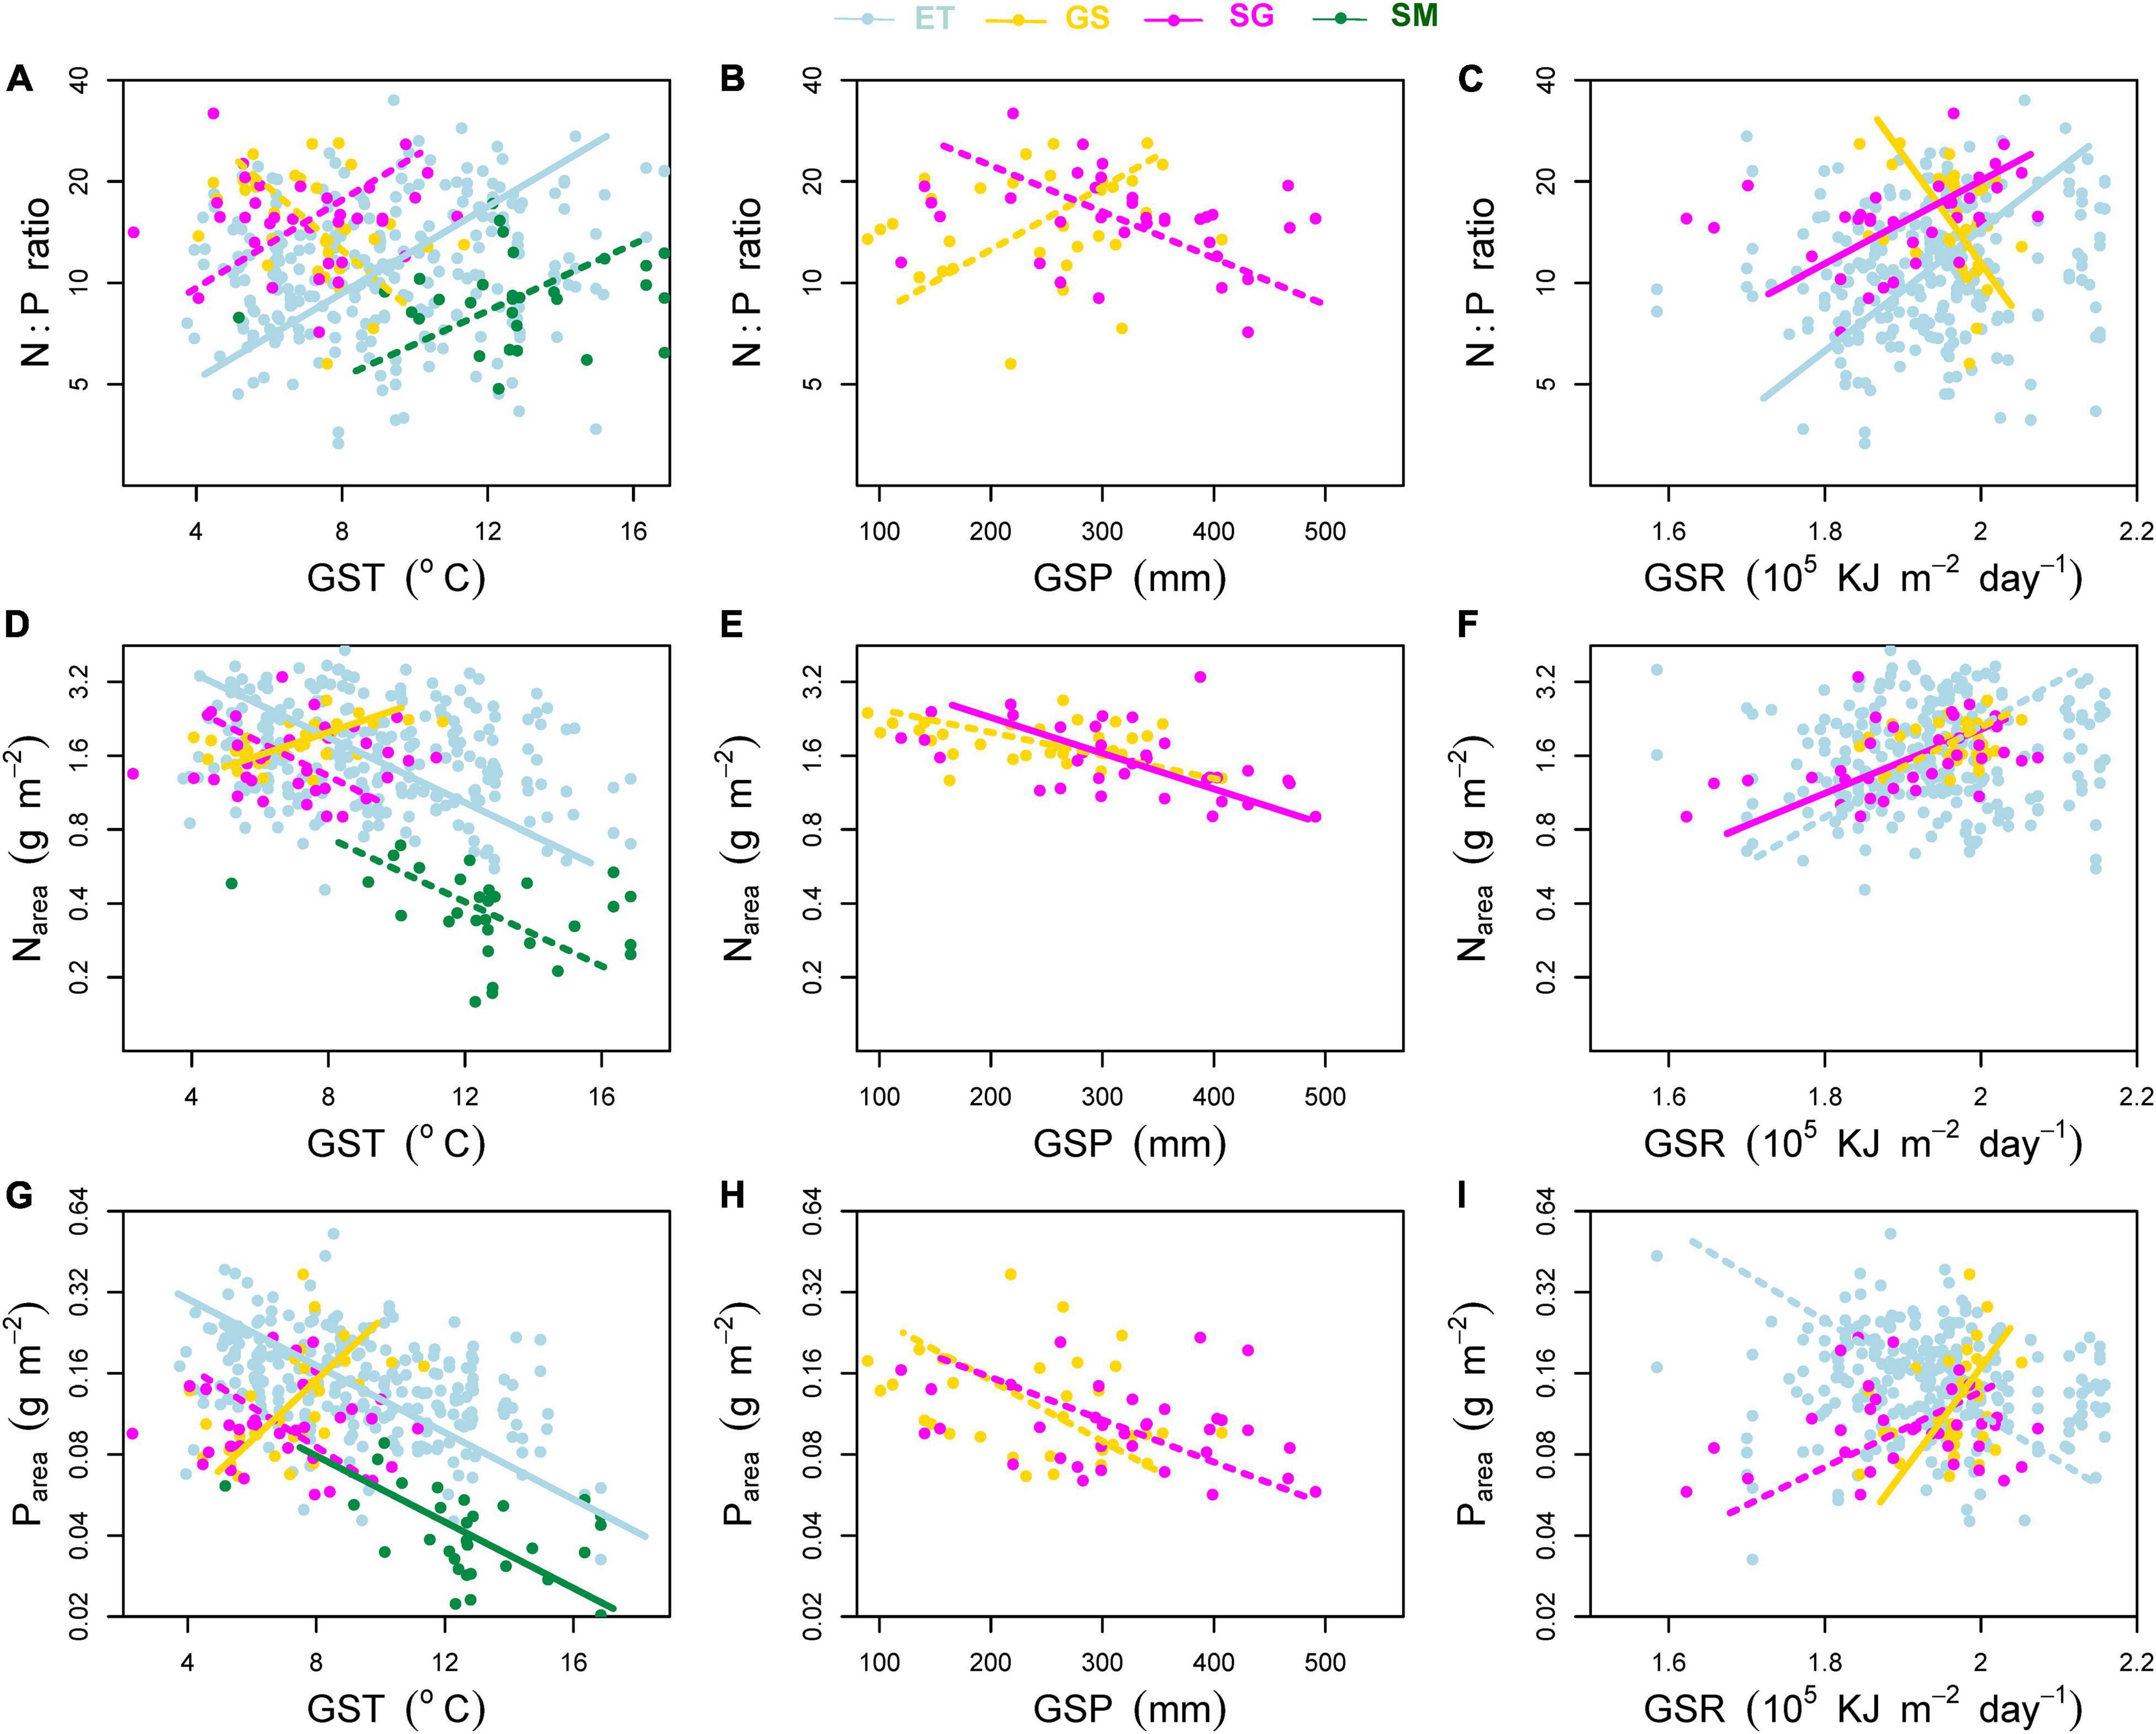
Figure 6. Effects of environmental factors on (A–C) mass-based N:P ratio, (D–F) area-based leaf nitrogen content (Narea) and (G–I) area-based leaf phosphorus content (Parea). Environmental factors include growing season mean air temperature (GST), growing season mean precipitation (GSP), and growing season mean solar radiation (GSR). ET, emergent plants, GS, grasses, SG, sedges, and SM, submerged plants. Solid lines denoted that the environmental factors affected the plant traits significantly at significance level p < 0.05, while the dashed lines showed non-significant relationships.
(i) For GST (Figures 5A,D,G), leaf Nmass of both terrestrial and aquatic plants, leaf Pmass of aquatic plants and sedges decreased with increasing GST. Only leaf Pmass of grasses increased with increasing GST. SLA of terrestrial plants and aquatic plants showed reversed trends along the temperature gradient.
(ii) For GSP (Figures 5B,E,H), leaf Nmass, Pmass, and SLA of grasses showed negative relationships with GSP, while all these three traits of sedges showed reversed trends.
(iii) For GSR (Figures 5C,F,I), the effects of radiation on SLA were more consistent and significant. SLA of emergent plants (p = 0.066) and both terrestrial plants (p < 0.05) decreased toward intense radiation.
(iv) In terms of transformed plant traits, each of them was related to two measured traits (mass-based traits and SLA). Affected by the different variation rates (slopes of the regression lines) of single measured traits, transformed traits showed different patterns from measured ones along environmental gradients (Figure 6).
Discussion
Plant functional traits and trait syndromes reflect both evolutionary trade-offs and ecological fitness to ambient environment (Pérez-Harguindeguy et al., 2013; Díaz et al., 2016). The major differences between aquatic and terrestrial habitats are soil water conditions and the low light intensity, slow diffusion of gases (CO2 and O2) underwater, resulting in different trait values and scales of trait-trait correlations between aquatic and terrestrial plants. In this study, we mainly focused on the differences and similarities in plant functional traits and the bivariate traits correlations between aquatic and terrestrial herbaceous plants in harsh environmental conditions on the Tibetan Plateau.
Differences in Leaf Traits Between Aquatic and Terrestrial Plants
First, we found that differences existed in Nmass, Pmass, SLA, Narea, and Parea between plant groups. Terrestrial plant groups have lower Nmass, Pmass, and SLA than aquatic plants (except Nmass of submerged plants), of which grasses have the lowest traits values (Figure 3). Water availability is the primary climatic factor in determining the distribution of herbaceous species on the Tibetan Plateau (Zheng and Zhao, 2017). Grass of Stipa purpurea is the most dominant herbaceous species of alpine steppe in western part of the Tibetan Plateau, where the environmental conditions are characterized by low precipitation, intense solar radiation and lack of soil nutrient availability (Zheng and Zhao, 2017). All of these environmental factors force Stipa purpurea constructing leaves with lower SLA (thicker or denser leaves) and lower Nmass and Pmass to survive there (Poorter et al., 2009; Reich, 2014). Water content of the leaf determines SLA (Shipley, 1995). In arid and semi-arid regions, increasing temperature results in higher evapotranspiration and aggravate the existing water deficiency. This may explain the lowest SLA of grasses and the downward trend of SLA within this plant group with increasing GST (Figure 5G), rather than limited increase of GSP in areas where evapotranspiration is far greater than precipitation. Sedges of genera Kobresia or Carex dominate the community of alpine meadow, where water stress is relatively alleviated. SLA of sedges are higher than that of grasses, and increase with increasing GSP. Light regime is another environmental factor in affecting plant leaf construction (Long et al., 2011; Dalke et al., 2018). An in situ field experiment showed that enhanced radiation induced thicker leaves of two common but not dominant species, Saussurea superba and Gentiana straminea on the Tibetan Plateau (Shi et al., 2004), resulting in lower SLA. In this study, leaves of two terrestrial plant groups (grasses and sedges) and emergent plants (weak correlation, p = 0.066) lower their SLA toward strong radiation (Figure 5I). Hu et al. (2012) found that both leaf thickness and leaf density were negatively correlated with SLA of Stipa purpurea on the Tibetan Plateau. Whether the variation in SLA is determined by leaf density or by leaf thickness in this study needs further study. Submerged plants have extremely high SLA, partly because thinner leaves are helpful to light capture and gas exchange in low light and low CO2 pressure environments (Pierce et al., 2012; Liu et al., 2021), and partly because of the reduced investments in support tissues under water (Poorter et al., 2009). Emergent plants, which only the roots are inundated while the leaves stay in air facing atmospheric surrounding conditions directly, have similar SLA to their terrestrial counterparts.
Nmass, Pmass, and N:P ratios also showed significant differences among plant groups. Nmass, Pmass, and N:P ratios in this study were nearly identical to our previous data of both emergent plants and submerged plants (Wang et al., 2015), and the data of genera of Stipa and Kobresia on the Tibetan Plateau (He et al., 2008). Nmass of emergent plants are higher than those of the other three plant groups, while Pmass of two groups of aquatic plants are significantly higher than two terrestrial plant groups in this study (Figures 3A,B). Correspondingly, Substrates of emergent plants contain the highest soil N contents among the four groups, and soil P contents in two groups of aquatic plants substrates are significantly enriched than terrestrial substrate (Figures 2D,E). Thus, the differences in leaf nutrientmass between aquatic and terrestrial plants may be caused by the differences in soil nutrients conditions. With respect to plant N:P ratio, it is sometimes regarded as an indicator assessing whether the availability of N or P is more limiting for plant growth (Güsewell and Koerselman, 2002; Pérez-Harguindeguy et al., 2013). The plant N:P ratios 14∼16 are critical values, of which lower than 14, higher than 16, and between 14 and 16, indicates N limitation, P limitation, and co-limiting by N and P, respectively (Koerselman and Meuleman, 1996). However, this empirical threshold should only be used when factors other than N and P are unlikely to limit plant growth (Güsewell and Koerselman, 2002). The grassland region of the Tibetan Plateau is a youthful geologic unit with soil types of Xerosols and Cambisols. Low vegetation coverage (especially in alpine steppe regions) limits the input of organic litters, together with the low rate of nitrogen mineralization induced by cold weather, resulting in low soil available N and extensive N limitation of plants (Zheng and Zhao, 2017; Kou et al., 2020). In contrast, P comes from the weathering of soil parent material and thus young soil on the Tibetan Plateau maintains high soil P but low N contents (Han et al., 2005), resulting in very low soil N:P ratios. Although the mean N:P ratio of grasses (15.90) and sedges (15.98) are very close to 16, lack of N supply, rather than P, should be the primary factor limiting plant growth in grassland regions on the Tibetan Plateau. Low N:P ratios of aquatic plants are generated by the high Pmass, which is caused by concentrated P contents in aquatic substrates. Substrate in aquatic habitat always receives leached nutrient elements as a sink from terrestrial soils by surface runoff, resulting in nutrients enrichment, especially P, in aquatic substrates (Reynolds and Davies, 2001). Another potential explanation is that lower N:P ratio (together with high SLA), as adaption strategies, helps submerged plants maintain rapid growth rate in stressful conditions (e.g., low light) (Reich and Oleksyn, 2004; Pierce et al., 2012).
Area-based leaf nutrient contents, which generally are converted from dividing nutrientmass by SLA, are positively correlated with potential photosynthetic capacity per unit leaf area (Reich, 2014; Onoda et al., 2017). In this study, both Nmass and Pmass of grasses were relatively lower in mean values than those of sedges. However, significantly lower SLA of grasses generated higher Narea and Parea (Figure 3). The allometric variations in nutrientmass and SLA help species that survives in arid regions maintain high photosynthetic rates when stomatal conductance is depressed (Farquhar et al., 2002; Onoda et al., 2017). Aquatic plants always exhibit high acquisitive strategies with high nutrientmass and high SLA, and grow faster (Pierce et al., 2012). Extending leaf area or thinning leaf thickness to increase SLA are the most cost-effective strategies that maximize light capture and CO2 absorption in maintaining relative growth rate in low irradiance conditions (e.g., underwater) (Pierce et al., 2012; Maberly and Gontero, 2018). Compared to terrestrial plants, the increases in SLA of submerged plants were much greater than that of nutrientmass, resulting in low nutrientarea (Figure 3), i.e., low photosynthetic rate per unit leaf area (Onoda et al., 2017). However, extremely high SLA, together with high nutrientmass would counterbalance the negative influences of low nutrientarea on photosynthetic capacity of submerged plants, and keep relatively high plant growth rate.
Although He et al. (2008) found that precipitation and temperature had weak influence on Nmass and N:P ratios, our results showed that both mass- and area-based N and P concentrations of all plant groups (except grasses) had weakly increased trends, and N:P ratios decreased with decreasing temperature (Figures 5A,D, 6A,D,G), consisting with our previous study of aquatic plants (Wang et al., 2015). The temperature-plant physiological hypothesis (TPPH), which suggests that plants require more N and P (and low N:P ratio) to counterbalance the depressed biochemical efficiency caused by low temperature (Reich and Oleksyn, 2004), provides a reasonable explanation for our results. Soil N and P contents had no significant effects on leaf nutrientmass of other three plant groups and Nmass of grasses (data not shown). With respect to leaf Pmass of grasses, significant positive effect of soil P contents on it (r2 = 0.33, p < 0.01) induced its different pattern along climatic gradients from other plant groups.
Generality of Trait-Trait Correlations and Shifts in Common Slopes Between Aquatic and Terrestrial Plants
Our results verified the general bivariate relationships between Nmass, Pmass, and SLA, which have been well documented both on global (Güsewell and Koerselman, 2002; Reich et al., 2010; Pan et al., 2020a) and regional (He et al., 2006; Xia et al., 2014; Dalke et al., 2018) scales. Thomas et al. (2020) extended the plant trait relationships to tundra biome, and found that tundra plants demonstrated similar resource economic traits in extremely harsh environments, just like that in the alpine climate in this study. He et al. (2006) reported the generality of interspecific leaf trait relationships in herbaceous plants on the Tibetan Plateau. In this study, leaf nutrientmass positively correlated with SLA (except Pmass – SLA of grasses) in both terrestrial and aquatic plant groups (Figure 4), supporting the convergent evolution in plant functioning (Reich et al., 1997). However, due to the unique habitat conditions, significant differences in trait-trait correlations also can be observed between terrestrial and aquatic plants (Pan et al., 2020a). For example, submerged plants face very different surrounding environments from terrestrial plants, of which pH is one of the most important factors. Because submerged plants are submersed in water, the water pH controls the balance of different forms of dissolved inorganic carbon (DIC) directly and thus affects the photosynthesis of submerged plants (Su and Li, 2005). In addition, the accumulation of leaf N and P of aquatic plants on the Tibetan Plateau were significantly influenced by water pH (Wang et al., 2015). The differences of conditions between aquatic and terrestrial habitats force the plants adjust the trait coupling relationships precisely to survive in certain habitats (Pan et al., 2020b).
N and P are the two most interested photosynthesis-related macroelements but often limit plant growth as limiting nutrients. Based on more than 9300 observations, Reich et al. (2010) generalized that the positive relation of leaf Nmass and Pmass had a uniform 2/3 scaling across taxonomical groups and biomes. However, in this study, the SMA slops of Nmass-Pmass relationships showed significant deviation from the value of 2/3, and differed from each other between terrestrial and aquatic plants (Figure 4 and Table 1). The disproportionate accumulation of leaf N and P most likely caused the deviation of slopes (Wang et al., 2015; Pan et al., 2020a). For example, the mean leaf Nmass of submerged plants was nearly equal to that of sedges (24.55 vs. 24.99 mg g–1), while the mean leaf Pmass was 62% higher (2.82 vs. 1.74 mg g–1, Supplementary Appendix Table 1). As mentioned in Section “Differences in Leaf Traits Between Aquatic and Terrestrial Plants,” soils on the Tibetan Plateau are characterized by fertile P but lack of N. Furthermore, both soil N and P contents were relatively lower in terrestrial soils than aquatic substrates (Figure 2). The much severer N limitation in terrestrial plants resulted in smaller varied range of N at a given range of P variation (flatter slope) than aquatic plants (Figure 4).
Another generally accepted bivariate trait correlation is the positive SLA-nutrientmass relationship across plant groups (Onoda et al., 2017; Pan et al., 2020a; Thomas et al., 2020). With respect to SLA, it is very variable between species and even between replicates, and the affecting factors of SLA are more complex than those of leaf Nmass (Wilson et al., 1999), especially in aquatic habitats. When compared the variations in leaf traits between terrestrial and submerged plants by mean values, we found that Nmass, Pmass, and SLA varied no differences, less than 2-fold and almost 5-fold, respectively. In the case of limited variation ranges of leaf nutrientmass, increasing SLA is considered to be one of the most favorable strategies to adapt to the submerged environment (Pierce et al., 2012), inducing the allometric variation rates in leaf nutrientmass and SLA between submerged plants and other plant groups. At given leaf nutrientmass, submerged plants can invest C to construct thinner leaves with high SLA.
In general, aquatic plants, especially submerged plants, are characterized by higher SLA, greater leaf nutrientmass than terrestrial plants, tend to pursue fast-return investment strategies, and represent the acquisitive end of leaf economics spectrum. The deviations of trait-trait relationships between different plant groups reveal the precise adaptions of submerged plants to the unique aquatic habitats.
Data Availability Statement
The raw data supporting the conclusions of this article will be made available by the authors, without undue reservation.
Author Contributions
LY, ZW, and DY designed the study. LY, HZ, ZZ, and ZW performed the field investigation. LY and ZW analyzed the data and wrote the manuscript. All authors worked together to produce the final submitted version of the manuscript.
Funding
This work was supported by the National Natural Science Foundation of China (Grant 31300296) and Plateau Ecology Youth Innovative Fund of Wuhan University (413100105).
Conflict of Interest
The authors declare that the research was conducted in the absence of any commercial or financial relationships that could be construed as a potential conflict of interest.
Acknowledgments
We thank Xinwei Xu in Wuhan University, Xiujuan Qiao in Wuhan Botanical Garden, Chinese Academy of Sciences, for the valuable comments on the manuscript, Yingji Pan in Leiden University, Netherlands, for the helpful discussion on data analysis. All the leaf and soil samples were measured in the National Field Station of Freshwater Ecosystem of Liangzi Lake, Wuhan University.
Supplementary Material
The Supplementary Material for this article can be found online at: https://www.frontiersin.org/articles/10.3389/fevo.2021.706237/full#supplementary-material
Footnotes
References
Bowman, R. (1988). A rapid method to determine total phosphorus in soils. Soil Sci. Soc. Am. J. 52, 1301–1304. doi: 10.2136/sssaj1988.03615995005200050016x
Chapin, F. S. III., Autumn, K., and Pugnaire, F. (1993). Evolution of suites of traits in response to environmental stress. Am. Nat. 142, S78–S92. doi: 10.1086/285524
Dalke, I. V., Novakovskiy, A. B., Maslova, S. P., and Dubrovskiy, Y. A. (2018). Morphological and functional traits of herbaceous plants with different functional types in the European Northeast. Plant Ecol. 219, 1295–1305. doi: 10.1007/s11258-018-0879-2
Díaz, S., Kattge, J., Cornelissen, J. H. C., Wright, I. J., Lavorel, S., Dray, S., et al. (2016). The global spectrum of plant form and function. Nature 529, 167–171. doi: 10.1038/nature16489
Fang, J., Wang, X., Shen, Z., Tang, Z., He, J., Yu, D., et al. (2009). Methods and protocols for plant community inventory. Biodivers. Sci. 17, 533–548. doi: 10.3724/SP.J.1003.2009.09253
Farquhar, G. D., Buckley, T. N., and Miller, J. M. (2002). Optimal stomatal control in relation to leaf area and nitrogen content. Silva Fenn. 36, 625–637. doi: 10.14214/sf.530
Güsewell, S., and Koerselman, W. (2002). Variation in nitrogen and phosphorus concentrations of wetland plants. Perspect. Plant Ecol. Evol. Syst. 5, 37–61. doi: 10.1078/1433-8319-0000022
Han, W. X., Fang, J. Y., Guo, D. L., and Zhang, Y. (2005). Leaf nitrogen and phosphorus stoichiometry across 753 terrestrial plant species in China. New Phytol. 168, 377–385. doi: 10.1111/j.1469-8137.2005.01530.x
He, J., Wang, L., Flynn, D. F. B., Wang, X., Ma, W., and Fang, J. (2008). Leaf nitrogen:phosphorus stoichiometry across Chinese grassland biomes. Oecologia 155, 301–310. doi: 10.1007/s00442-007-0912-y
He, J., Wang, Z., Wang, X., Schmid, B., Zuo, W., Zhou, M., et al. (2006). A test of the generality of leaf trait relationships on the Tibetan plateau. New Phytol. 170, 835–848. doi: 10.1111/j.1469-8137.2006.01704.x
Hu, M., Zhang, L., Luo, T., and Shen, W. (2012). Variations in leaf functional traits of stipa purpurea along a rainfall gradient in Xizang, china. Chin. J. Plant Ecol. 36, 136–143. doi: 10.3724/SP.J.1258.2012.00136
Koerselman, W., and Meuleman, A. (1996). The vegetation N:P ratio: a new tool to detect the nature of nutrient limitation. J. Appl. Ecol. 33, 1441–1450. doi: 10.2307/2404783
Kou, D., Yang, G., Li, F., Feng, X., Zhang, D., Mao, C., et al. (2020). Progressive nitrogen limitation across the Tibetan alpine permafrost region. Nat. Commun. 11:3331. doi: 10.1038/s41467-020-17169-6
Kuo, S. (1997). “Phosphorus,” in Methods of Soil Analysis Part 3. Chemical Methods, ed. J. Bigham (Madison: Soil Science Society of America), 869–919.
Liu, H., Liu, G., and Xing, W. (2021). Functional traits of submerged macrophytes in eutrophic shallow lakes affect their ecological functions. Sci. Total Environ. 760:143332. doi: 10.1016/j.scitotenv.2020.143332
Long, W., Zang, R. G., Schamp, B. S., and Ding, Y. (2011). Within- and among-species variation in specific leaf area drive community assembly in a tropical cloud forest. Oecologia 167, 1103–1113. doi: 10.1007/s00442-011-2050-9
Maberly, S. C., and Gontero, B. (2018). “Trade-offs and synergies in the structural and functional characteristics of leaves photosynthesizing in aquatic environments,” in The Leaf: A Platform for Performing Photosynthesis, eds W. W. Adams III and I. Terashima (Berlin: Springer), 307–343. doi: 10.1007/978-3-319-93594-2_11
Moor, H., Rydin, H., Hylander, K., Nilsson, M. B., Lindborg, R., and Norberg, J. (2017). Towards a trait-based ecology of wetland vegetation. J. Ecol. 105, 1623–1635. doi: 10.1111/1365-2745.12734
Onoda, Y., Wright, I. J., Evans, J. R., Hikosaka, K., Kitajima, K., Niinemets, U., et al. (2017). Physiological and structural tradeoffs underlying the leaf economics spectrum. New Phytol. 214, 1447–1463. doi: 10.1111/nph.14496
Pan, Y., Cieraad, E., Armstrong, J., Armstrong, W., Clarkson, B., Colmer, T., et al. (2020a). Global patterns of the leaf economics spectrum in wetlands. Nat. Commun. 11:4519. doi: 10.1038/s41467-020-18354-3
Pan, Y., Cieraad, E., Clarkson, B. R., Colmer, T. D., Pedersen, O., Visser, E. J. W., et al. (2020b). Drivers of plant traits that allow survival in wetlands. Funct. Ecol. 34, 956–967. doi: 10.1111/1365-2435.13541
Pérez-Harguindeguy, N., Díaz, S., Garnier, E., Lavorel, S., Poorter, H., Jaureguiberry, P., et al. (2013). New handbook for standardised measurement of plant functional traits worldwide. Aust. J. Bot. 61, 167–234. doi: 10.1071/BT12225
Pierce, S., Brusa, G., Sartori, M., and Cerabolini, B. E. L. (2012). Combined use of leaf size and economics traits allows direct comparison of hydrophyte and terrestrial herbaceous adaptive strategies. Ann. Bot. 109, 1047–1053. doi: 10.1093/aob/mcs021
Pohlert, T. (2014). The Pairwise Multiple Comparison of Mean Ranks Package (PMCMR). Available Online at: https://CRAN.R-project.org/package=PMCMR. R package.
Poorter, H., Niinemets, U., Poorter, L., Wright, I. J., and Villar, R. (2009). Causes and consequences of variation in leaf mass per area (lma): a meta-analysis. New Phytol. 182, 565–588. doi: 10.1111/j.1469-8137.2009.02830.x
Reich, P. B. (2014). The world-wide ‘fast-slow’ plant economics spectrum: a traits manifesto. J. Ecol. 102, 275–301. doi: 10.1111/1365-2745.12211
Reich, P. B., Ellsworth, D. S., Walters, M. B., Vose, J. M., Gresham, C., Volin, J. C., et al. (1999). Generality of leaf trait relationships: a test across six biomes. Ecology 80, 1955–1969. doi: 10.2307/176671
Reich, P. B., and Oleksyn, J. (2004). Global patterns of plant leaf N and P in relation to temperature and latitude. Proc. Natl. Acad. Sci. U. S. A. 101, 11001–11006. doi: 10.1073/pnas.0403588101
Reich, P. B., Walters, M. B., and Ellsworth, D. S. (1997). From tropics to tundra: global convergence in plant functioning. Proc. Natl. Acad. Sci. U. S. A. 94, 13730–13734. doi: 10.1073/pnas.94.25.13730
Reich, P. B., Wright, I. J., Niklas, J. O., Hedin, K. J., and Elser, J. J. (2010). Evidence of a general 2/3-power law of scaling leaf nitrogen to phosphorus among major plant groups and biomes. Proc. Biol. Sci. 277, 877–883. doi: 10.1098/rspb.2009.1818
Reynolds, C. S., and Davies, P. S. (2001). Sources and bioavailability of phosphorus fractions in freshwaters: a British perspective. Biol. Rev. Camb. Philos. Soc. 76, 27–64. doi: 10.1111/j.1469-185X.2000.tb00058.x
Shi, S., Zhu, W. Y., Li, H. M., Zhou, D. W., Han, F., Zhao, X. Q., et al. (2004). Photosynthesis of Saussurea superba and Gentiana straminea is not reduced after long-term enhancement of UV-B radiation. Environ. Exp. Bot. 51, 75–83. doi: 10.1016/S0098-8472(03)00062-5
Shipley, B. (1995). Structured interspecific determinants of specific leaf area in 34 species of herbaceous angiosperms. Funct. Ecol. 9, 312–319. doi: 10.2307/2390579
Su, R. L., and Li, W. (2005). Advances in research on photosynthesis of submerged macrophytes. Chin. Bull. Botany 22, 128–138.
Thomas, H. J. D., Bjorkman, A. D., Myers-Smith, I. H., Elmendorf, S. C., Kattge, J., Diaz, S., et al. (2020). Global plant trait relationships extend to the climatic extremes of the tundra biome. Nat. Commun. 11:1351. doi: 10.1038/s41467-020-15014-4
Tibetan Plateau Scientific Expedition and Research Team (TPSERT). (1992). Tibetan Grassland. Beijing: Science Press.
Wang, Z., Luo, T., Li, R., Tang, Y., and Du, M. (2013). Causes for the unimodal pattern of biomass and productivity in alpine grasslands along a large altitudinal gradient in semi-arid regions. J. Veg. Sci. 24, 189–201. doi: 10.1111/j.1654-1103.2012.01442.x
Wang, Z., Xia, C., Yu, D., and Wu, Z. (2015). Low-temperature induced leaf elements accumulation in aquatic macrophytes across Tibetan plateau. Ecol. Eng. 75, 1–8. doi: 10.1016/j.ecoleng.2014.11.015
Warton, D. I., Duursma, R. A., Falster, D. S., and Taskinen, S. (2012). smatr 3 - an r package for estimation and inference about allometric lines. Methods Ecol. Evol. 3, 257–259. doi: 10.1111/j.2041-210X.2011.00153.x
Warton, D. I., Wright, I. J., Falster, D. S., and Westoby, M. (2006). Bivariate line-fitting methods for allometry. Biol. Rev. Camb. Philos. Soc. 81, 259–291. doi: 10.1017/S1464793106007007
Wilson, P. J., Thompson, K., and Hodgson, J. G. (1999). Specific leaf area and leaf dry matter content as alternative predictors of plant strategies. New Phytol. 143, 155–162. doi: 10.1046/j.1469-8137.1999.00427.x
Wright, I. J., Reich, P. B., Westoby, M., Ackerly, D. D., Baruch, Z., Bongers, F., et al. (2004). The worldwide leaf economics spectrum. Nature 428, 821–827. doi: 10.1038/nature02403
Xia, C., Yu, D., Wang, Z., and Xie, D. (2014). Stoichiometry patterns of leaf carbon, nitrogen and phosphorous in aquatic macrophytes in eastern china. Ecol. Eng. 70, 406–413. doi: 10.1016/j.ecoleng.2014.06.018
Keywords: alpine wetlands, functional traits, leaf economics spectrum, leaf N and P concentrations, specific leaf area, stoichiometry
Citation: Yang L, Zhao H, Zuo Z, Li X, Yu D and Wang Z (2021) Generality and Shifts in Leaf Trait Relationships Between Alpine Aquatic and Terrestrial Herbaceous Plants on the Tibetan Plateau. Front. Ecol. Evol. 9:706237. doi: 10.3389/fevo.2021.706237
Received: 07 May 2021; Accepted: 02 June 2021;
Published: 25 June 2021.
Edited by:
Xiaoting Xu, Sichuan University, ChinaReviewed by:
Lin Zhang, Institute of Tibetan Plateau Research, Chinese Academy of Sciences (CAS), ChinaYan Geng, Beijing Forestry University, China
Copyright © 2021 Yang, Zhao, Zuo, Li, Yu and Wang. This is an open-access article distributed under the terms of the Creative Commons Attribution License (CC BY). The use, distribution or reproduction in other forums is permitted, provided the original author(s) and the copyright owner(s) are credited and that the original publication in this journal is cited, in accordance with accepted academic practice. No use, distribution or reproduction is permitted which does not comply with these terms.
*Correspondence: Zhong Wang, wangzhong@whu.edu.cn; Dan Yu, lakeyd@163.com