Supporting Wildfire Response During a Pandemic in the United States: the COVID-19 Incident Risk Assessment Tool
 Matthew P. Thompson
 Erin J. Belval2
  Jake Dilliott
 Jude Bayham
- 1Rocky Mountain Research Station, USDA Forest Service, Fort Collins, CO, United States
- 2Department of Forest and Rangeland Stewardship, Colorado State University, Fort Collins, CO, United States
- 3Department of Agricultural and Resource Economics, Colorado State University, Fort Collins, CO, United States
The onset of the global pandemic in 2020 significantly increased the complexity and uncertainty of wildfire incident response in the United States, and there was a clear role for decision support to inform and enhance coordination and communication efforts. Epidemiological modeling suggested the risk of COVID-19 outbreak at a traditional large fire camp could be substantial and supported the broadscale implementation of mitigations, and management of COVID-19 required expanding the response network to interface with entities such as local public health agencies, hospitals, and emergency operations centers. Despite the early issuance of medical and public health guidance to support wildfire management functions under a COVID-19 modified operating posture, an identified gap was a scale- and scope-appropriate tool to support incident-level assessment of COVID-19 risk. Here we review the development and application of a COVID-19 Incident Risk Assessment Tool intended to fill that gap. After prototyping with fire managers and risk practitioners, including early-season use on several incidents, we built an online dashboard that was used operationally throughout the 2020 fire season. We summarize usage statistics, provide some examples of real use on wildfire incidents, and report feedback from users. The tool helped to fill a critical information gap and was intended to support risk-informed decision-making regarding incident logistics, operations, and COVID-19 mitigations.
Introduction
Response to wildfire incidents can be a complex and uncertain endeavor, with management challenges and prospective losses increasing as human development expands into burnable areas and climate change leads to increased fire activity (Thompson, 2013; Abatzoglou and Williams, 2016; Radeloff et al., 2018). Wildfire response organizations scale up as the size and complexity of the incident increases, which necessitates networked coordination and communication across a variety of functions and with numerous local agencies, managers, and stakeholders (Nowell and Steelman, 2015; Nowell et al., 2018; Steelman and Nowell, 2019). Accordingly, there is a clear role for decision support to inform and enhance coordination and communication efforts (Greiner et al., 2020; Rapp et al., 2020).
The onset of the global pandemic in 2020 significantly increased the complexity and uncertainty of wildfire incident response in the United States. Even without an ongoing pandemic, large wildland fire response is logistically challenging as it can require hundreds to thousands of personnel to be assigned to a single incident. Traditionally, at each individual incident these personnel interact with each other in fire camps (the sites at which the personnel are provided with food, water, areas for sleeping, and sanitary services) and at incident command posts (the location where the primary logistics functions of the fire are administered.) These personnel move between fires over the course of the fire season; at each fire, individuals are exposed to a new group of personnel. Due to factors such as high-density living and working conditions, limited hygiene, smoke exposure, and a transient workforce, transmission of infectious disease was already a known risk associated with wildfire incident management activities in the United States1. Epidemiological modeling suggested the risk of COVID-19 outbreak at a traditional large fire camp setting could be substantial and supported the broadscale implementation of mitigations, including screening and social distancing measures such as expanded use of telecommunications rather than in-person briefings and dispersed rather than concentrated camping (Thompson et al., 2020). Further, management of COVID-19 required expanding the response network to interface with entities such as local public health agencies, hospitals, and emergency operations centers2.
Despite early issuance of medical and public health guidance to support wildfire management functions under a COVID-19 modified operating posture3, an identified gap was a scale- and scope-appropriate tool to support incident-level assessment of COVID-19 risk. The Wildland Fire Decision Support System (WFDSS) provides strategic functionality to estimate the relative risk for an incident but is focused on potential fire behavior and threats to assets and resources such as homes, critical infrastructure, and wildlife habitat (Calkin et al., 2011; Noonan-Wright et al., 2011; Zimmerman, 2012). Risk Assessment Worksheets used operationally do have a focus on risk to human health and safety but generally at the scale of the individual rather than the population4.
Here we review the development and application of a COVID-19 Incident Risk Assessment Tool intended to fill that gap. After prototyping with fire managers and risk practitioners, including early-season use on several incidents, we built an online dashboard that was used operationally throughout the 2020 fire season. The tool was designed to support the assessment of risks to firefighter health and workforce capacity at the level of the population of fire personnel assigned to the incident. More specifically, the tool was intended for use on large, long-duration incidents where hundreds to thousands of fire personnel can be mobilized, and where the likelihood of infectious disease transmission is generally higher. In addition to the risk of transmission, these fires tend to have more complex, multi-agency incident response organizations where enhanced communication and coordination can be essential.
The COVID-19 Incident Risk Assessment Tool was designed for the United States fire system, for use on individual incidents, with information and results intended for local users. Our ends-based objectives for the tool were that it could capture local and up-to-date knowledge of conditions, track changing conditions over time, promote situational awareness, help identify mitigations within the scope of control of the incident management organization, and, most importantly, facilitate communication, deliberation and information sharing throughout the interagency response network. As a means-based objective, and as suggested in early feedback, we wanted the tool to be simple to use and interpret by on-the-ground fire personnel who are typically under considerable time-pressures with high workloads.
In the subsequent sections, we first describe the design of the risk assessment tool, our communications plan to reach users, software implementation to build a user-friendly online dashboard, and our deployment and evaluation plan. We then summarize usage statistics, provide some examples of real use on wildfire incidents, and report feedback from users. Lastly, we identify possible improvements and opportunities for use in 2021.
Materials and Methods
Risk Assessment Framework and Products
We structured the assessment as a hierarchical multi-criteria analysis. The scheme includes three risk factors (scored 3–9), each of which is rated based upon three-subfactors (scored 1–3), which are combined as a weighted sum. The risk factor ratings are then combined as a weighted sum to yield a numerical incident-level risk score and a corresponding qualitative risk rating. We selected this framework based in part on recommendations from the field to foster consistency and familiarity with existing assessment products in WFDSS.
Equation 1 displays the basic risk score calculation, assessing risk for the entire population of firefighters. For generality, we present an equation with the flexibility to accommodate different weighting schemes, although the current model uses equal weights of 1.0, such that the score can range from 9 to 27. Additionally, the model allows users to modify the final risk score to account for local risk factors not included in our model, such that the adjusted risk score can go up to 30. We conservatively defined the corresponding risk rating categories as: low (9–13), moderate (14–18), and high (19–30).
Where:
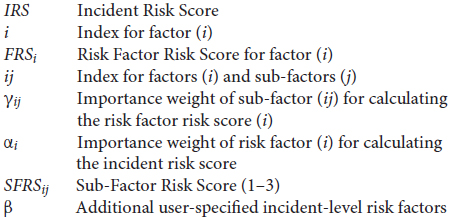
Table 1 provides specifics for the risk factors and sub-factors we identified. This language was embedded in the dashboard using textboxes that appeared when users hovered over the risk factor text, as well as being provided in PDF format on the dashboard to guide the interpretation and assessment of risk factors. We iterated over multiple versions of the scheme, and the final design choice reflects the balance of complexity and completeness versus ease and timeliness of use. Throughout, we solicited feedback from practitioners as well as medical and public health experts. We also incorporated insights from relevant epidemiological modeling of factors influencing COVID-19 outbreak risk at fire camp, including possibly correlated risk factors (e.g., number of personnel assigned and incident duration) that have differential impacts on COVID-19 risk (Thompson et al., 2020). For purposes of a high-level summary, and recognizing time demands on users, the tool did not request details on different groupings and interactions of firefighters assigned to the incident.
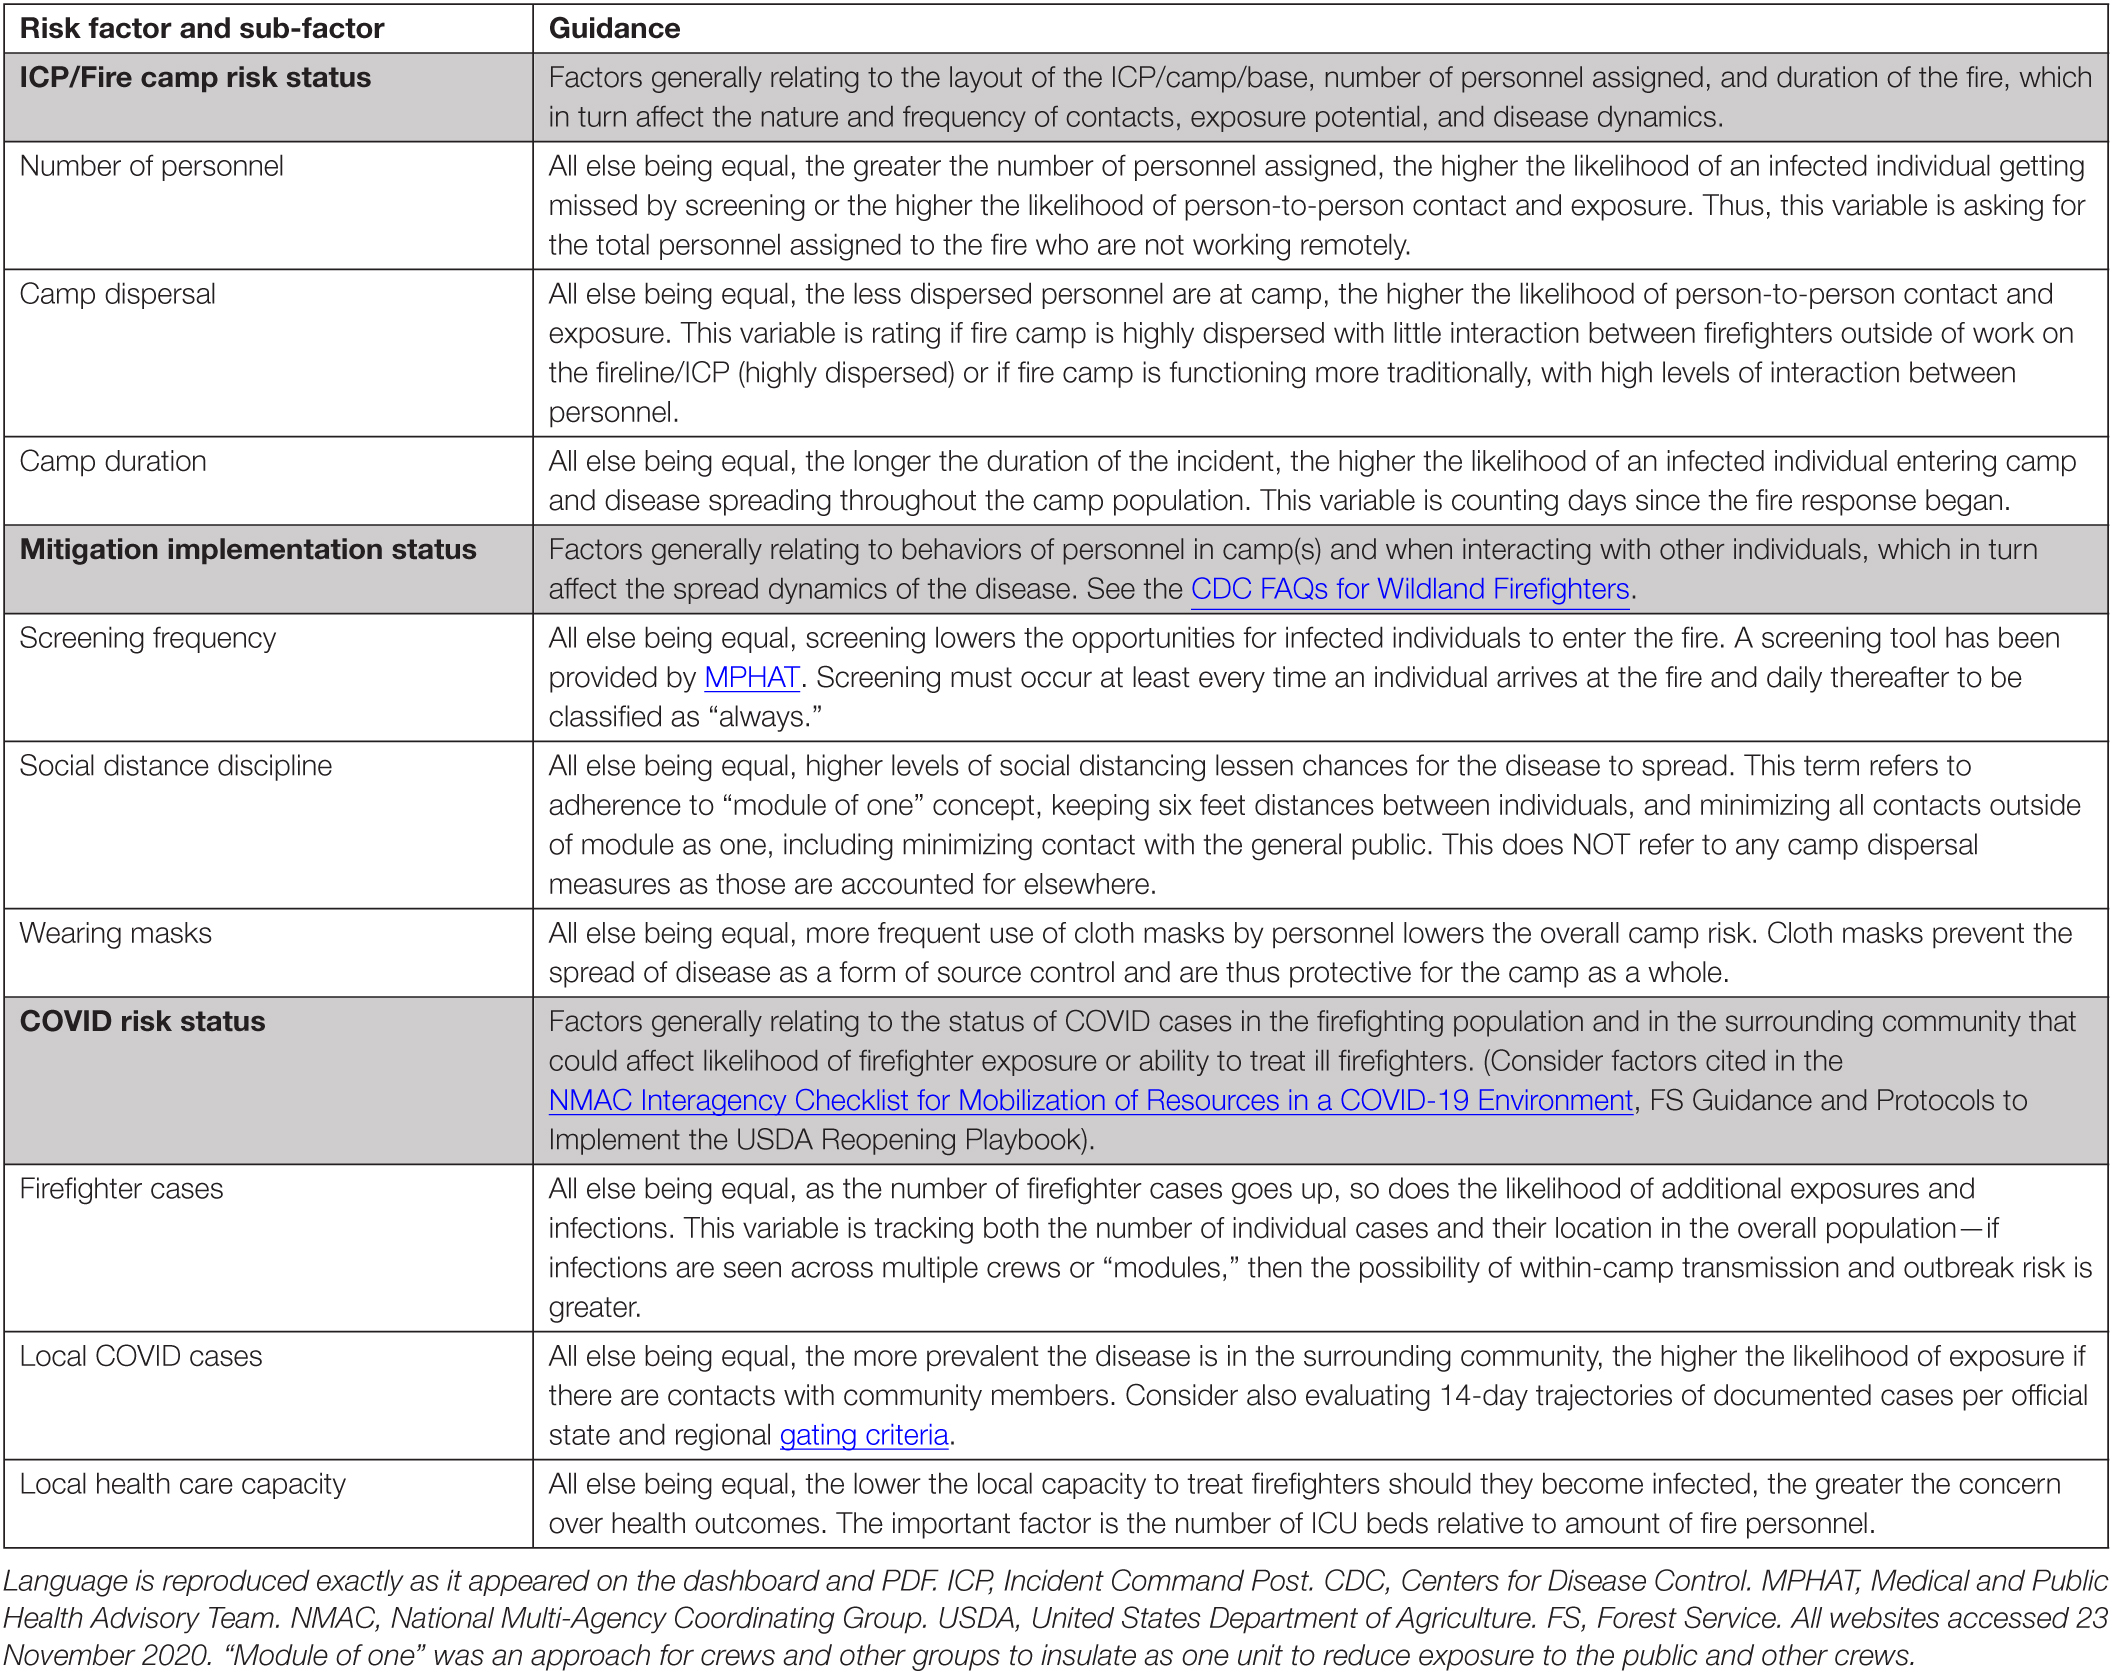
Table 1. Guidance provided to users of the COVID-19 incident risk assessment tool for interpreting and assessing risk factors.
Figure 1 displays the conceptual rose chart for how risk scores and ratings were visualized. The dashboard automatically creates figures for each factor and sub-factor and for the overall incident-level score. Each “petal” corresponds to an individual risk sub-factor, the size and color of which vary depending on the assigned score. Figure 2 displays how each factor and sub-factor are rated on the dashboard itself. The greater the size of a petal, the greater its contribution to overall risk. Table 2 displays the risk assessment worksheet that forms the basis for how the chart is created. This worksheet was available for users as information and as a tool to download and fill out by hand. In practice, the target user base is a comparatively small fraction of the fire management community; one or a few persons per Incident Management Team would be sufficient to gauge risk and initiate meaningful conversation.
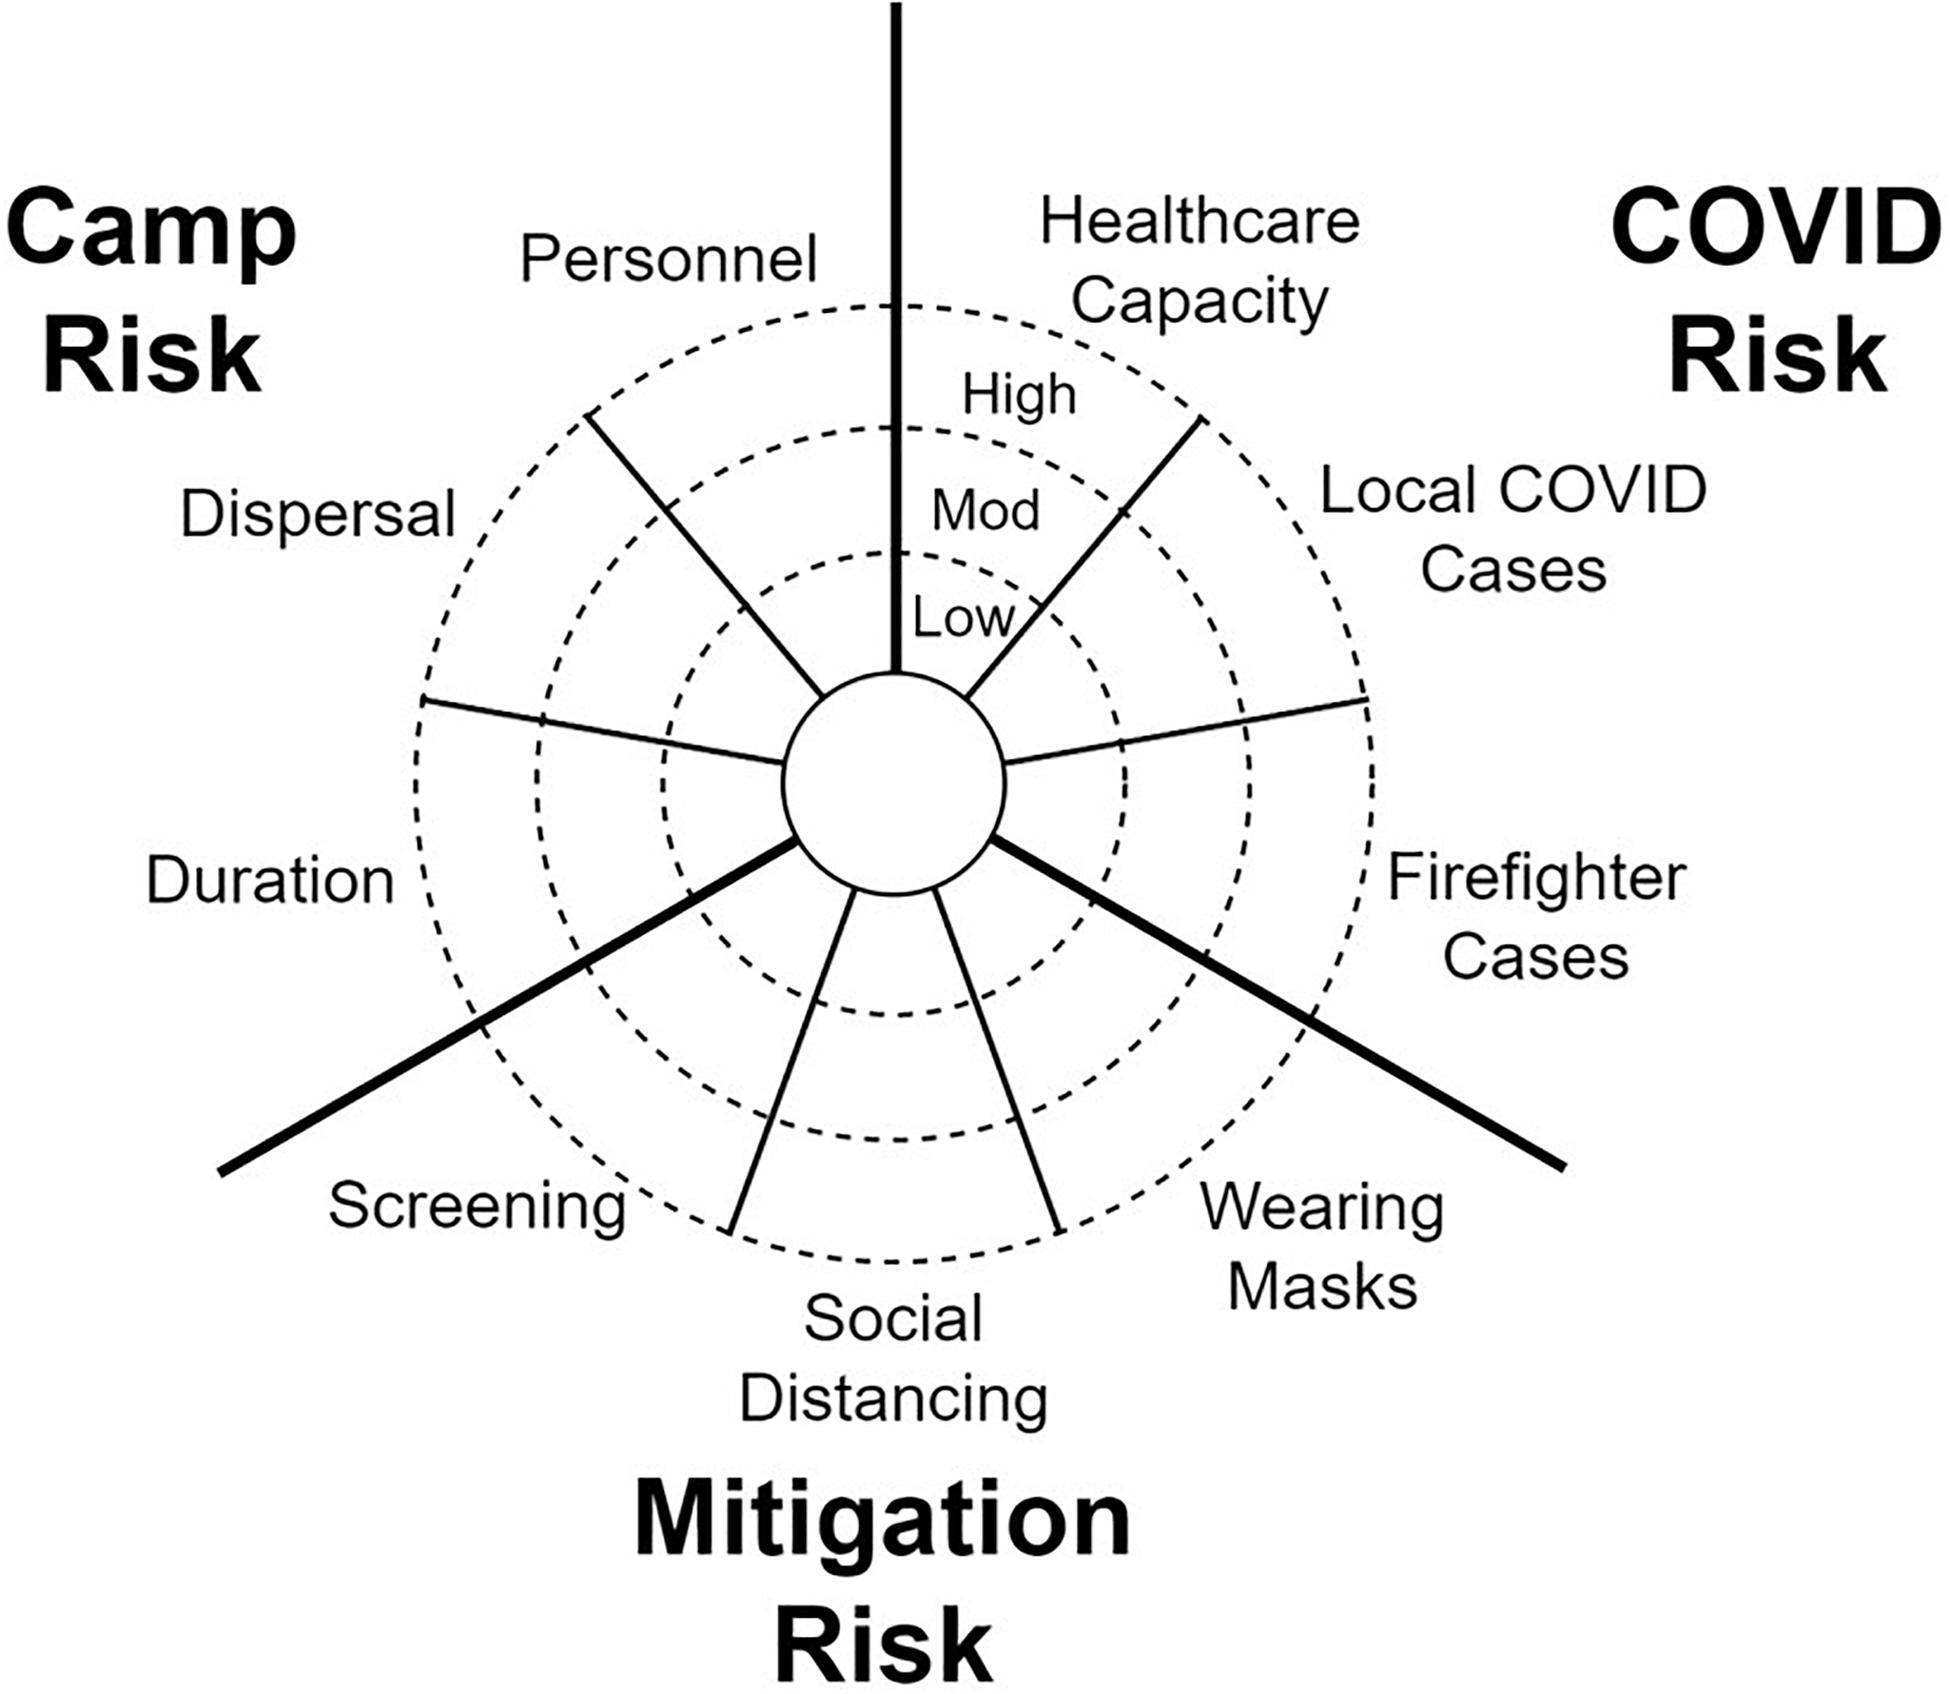
Figure 1. Conceptual rose chart illustrating the hierarchical multi-criteria approach to estimating incident-level risk through assessment of risk factors and sub-factors.
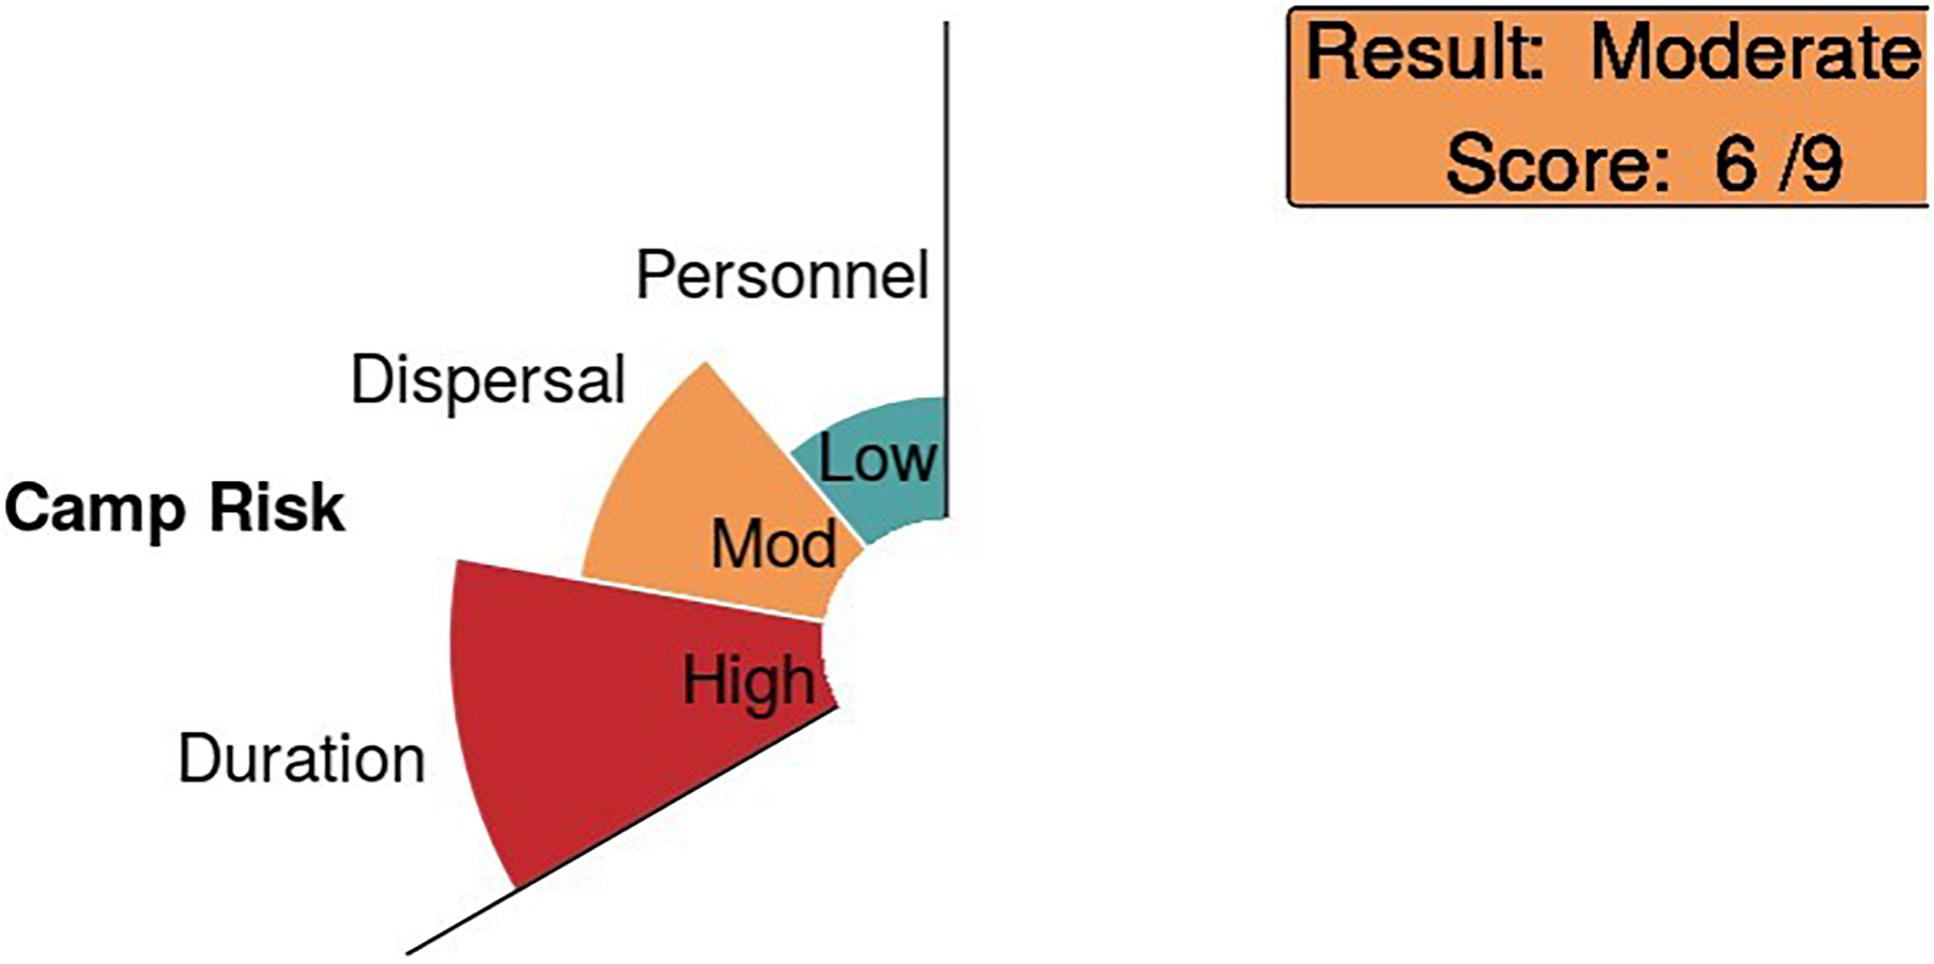
Figure 2. Illustration of filling out rose chart on the online dashboard.
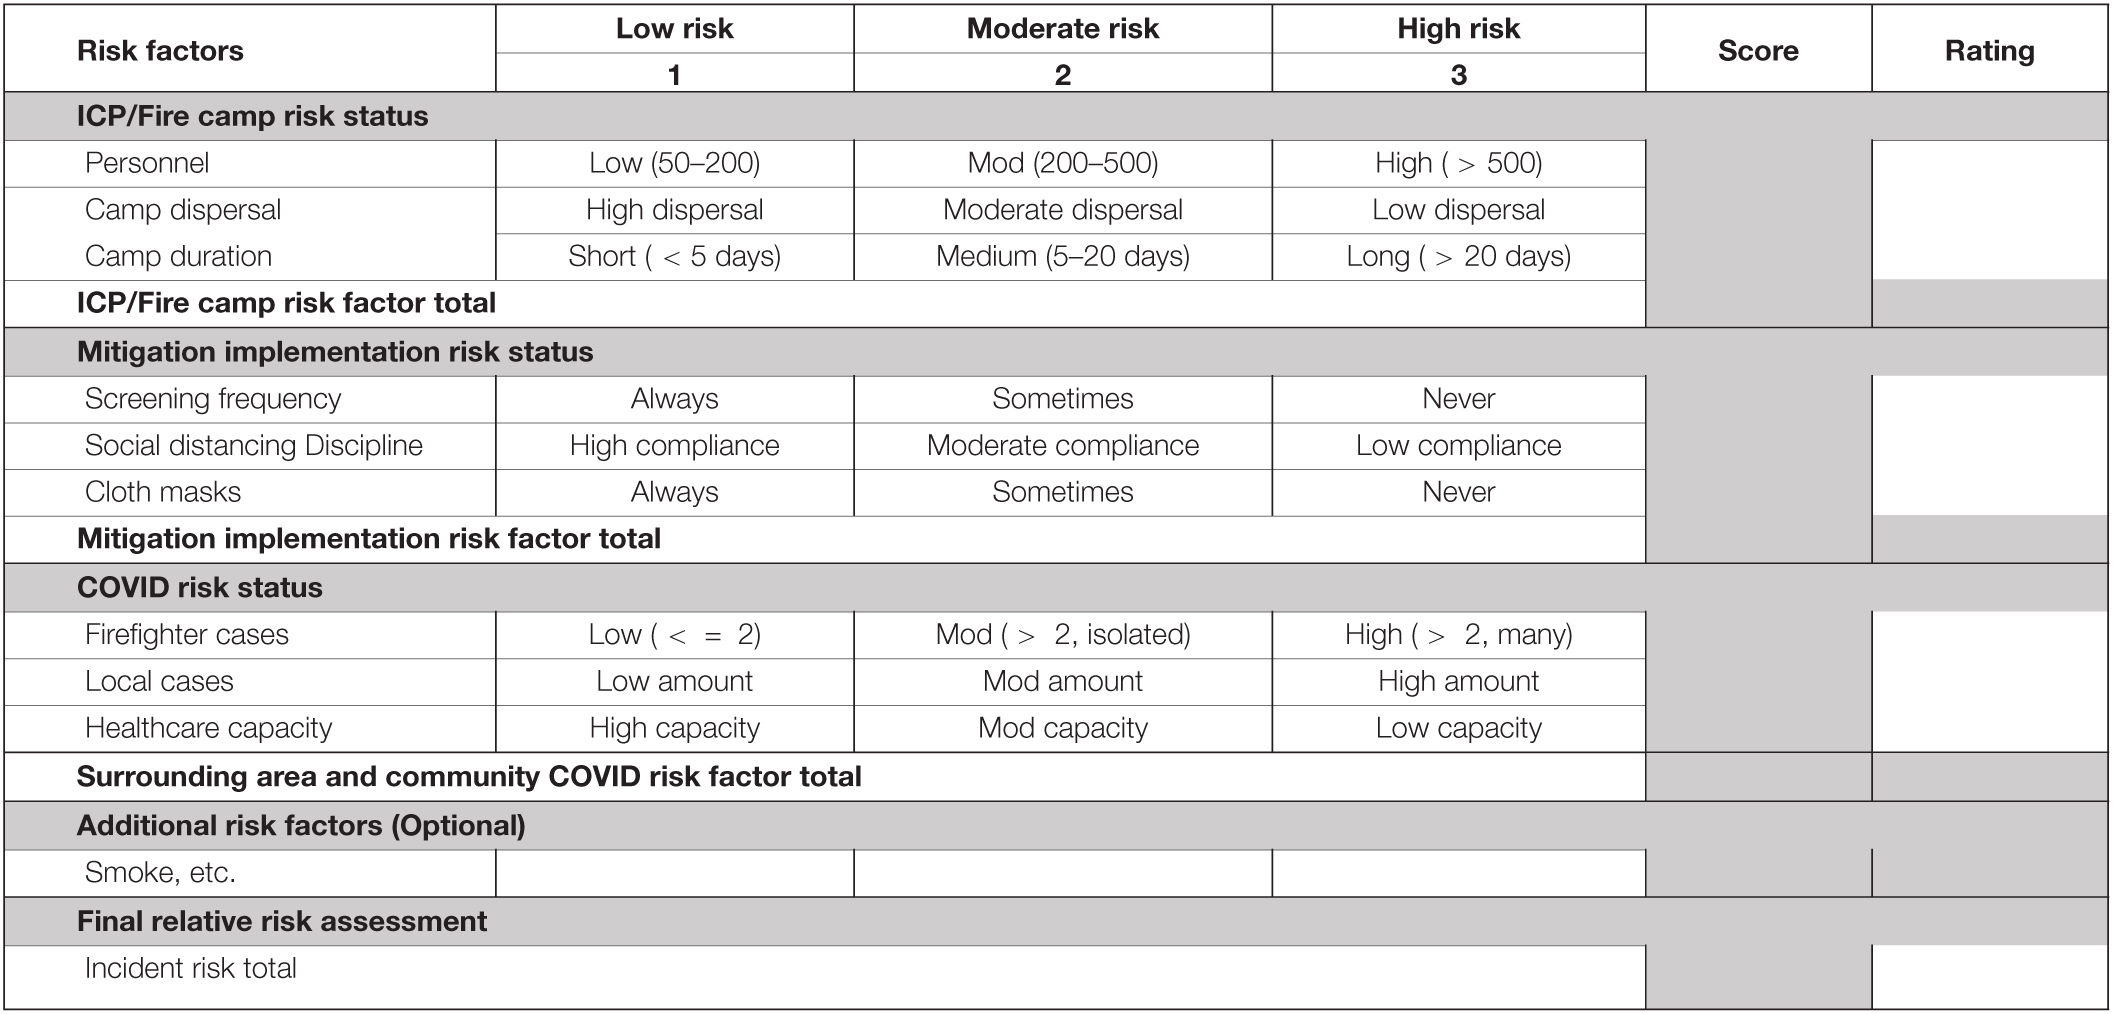
Table 2. Risk Assessment Worksheet that lays out the risk scoring and rating system all factors and sub-factors.
Prototyping, Communication, and Outreach
In late June and early July 2020, an initial version of the risk assessment tool was used on multiple wildfire incidents in the southwestern United States. At the time, we had only developed the framework and shared an image mirroring the depiction of the tool with the relative risk assessment from WFDSS. Assessment results were hand-drawn and shared with accompanying text narrative. Based on positive feedback from regional risk management specialists familiar with the tool’s operational use, we proceeded with updating the graphical model and developing the software to streamline and expand the use of the online risk assessment tool.
In addition to working with subject matter experts and relying on their respective networks, we used multiple channels to share information about the COVID-19 Incident Risk Assessment Tool. Early on, we briefed senior leadership of the USDA Forest Service, who offered their support for continued development and use. We coordinated closely with agency personnel from Fire and Aviation Management, Office of Communications, and the Rocky Mountain Research Station. With their assistance, we developed an informational webpage about the project as well as an online tutorial hosted on the dashboard5.
A primary channel we leveraged was virtual meetings hosted by Incident Management Remote Response (IMRR), a collaborative interagency effort to support rapid sharing of information and lessons learned across the fire response community. Through IMRR, we presented to groups of Incident Commanders, Agency Administrators, and Safety Officers, with hundreds of attendees in some cases. In these sessions, we provided contact information and were able to follow up directly with interested personnel, in some cases supporting the use of the tool in real-time. Lastly, we collaborated with the Joint Fire Science Program who distributed information about our tool through the Fire Science Exchange Network.
Software Implementation
We built the COVID-19 Incident Risk Assessment tool using the R Statistical Computing Language (R Core Team, 2019). Table 3 lists the packages we utilized as well as the reason each package was necessary. The dashboard was developed as a Shiny app and provided to incident managers using the shiny.io server. The dashboard features a landing page that provides an overview of the decision support tool as well as links to a video introduction and a PDF allowing for offline incident risk assessment. From the landing page, users can navigate to the incident risk assessment tool. Once at the incident risk assessment tool, users are provided with an explanation of each risk factor and dropdown menus to input values for each sub-factor. The dropdown menu for each sub-factor provided a brief description of each sub-factor level. Initial values for all sub-factors were set to be empty, with empty spaces where the risk factor graphs and scores appear. The app accepts user inputs and updates dynamically. Once the user populates values for all three of the sub-factors associated with a risk factor, the score for that risk factor is calculated, and the graph and factor score appears in an image for the user to see. Once all nine risk sub-factors are scored by the user, the final incident risk score is calculated, and this, in addition to the graph combining all nine sub-factors, is presented to the user. Graphs are created using the package ggplot2. The graphs are represented as bar charts in polar coordinates. We graph the values of the sub-factors directly. The dashboard presents each subsection of the graph that is associated with each risk factor separately, with the final graph showing all risk factors together as the final output. The code repository for the dashboard is available online through GitHub (Dilliott, 2021).
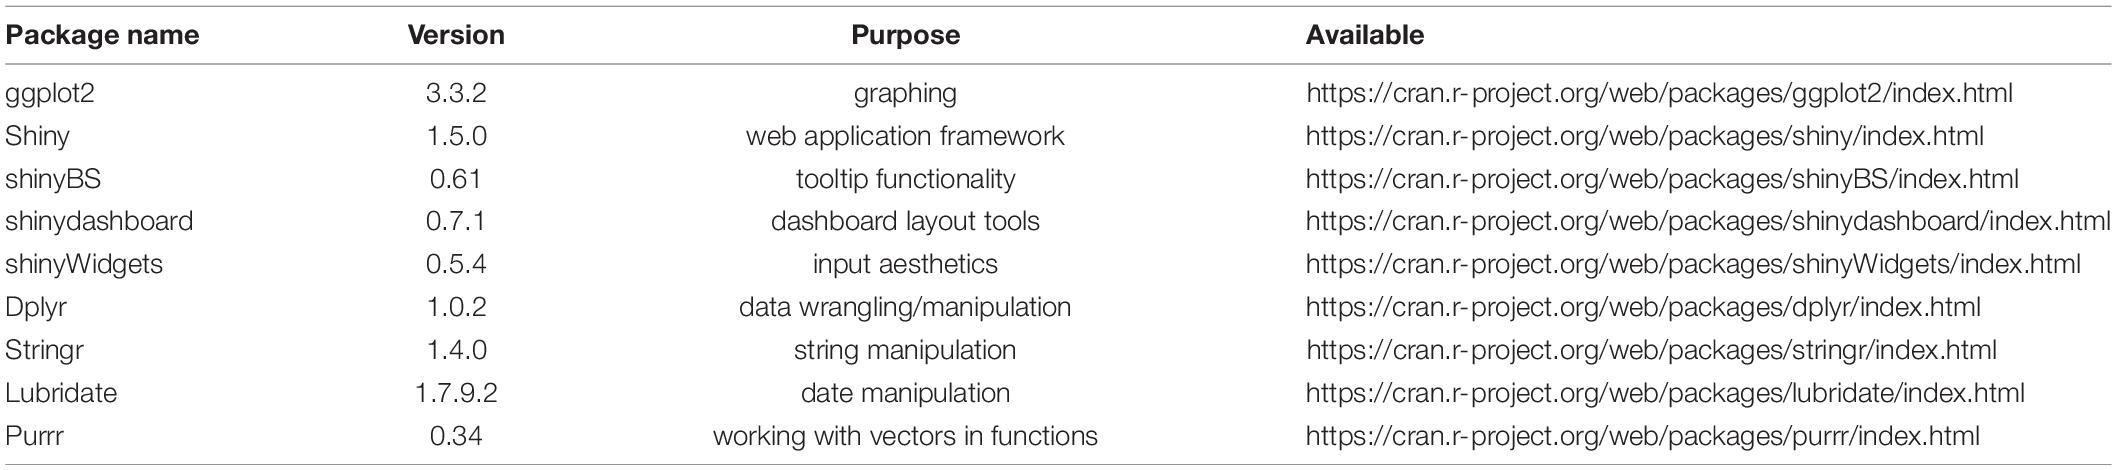
Table 3. R packages used in the development of the dashboard.
In addition to the dropdown menus for each sub-factor, there are textboxes for users to provide the rationale for their ranking of each sub-factor. These rationales are not used in any of the risk score calculations. Rather, those fields are provided so that users may document and share information they used to come to their decisions. We provided the ability for users to download their full report as a PDF file; the rationales users provided for each risk sub-factor are printed on the PDF as well as each sub-factor score, the final risk score, and the complete graph. This PDF functionality was designed to allow users to easily share their results and rationales with others.
Once users completed their incident risk assessment, they were given the option to submit the full risk assessment to our modeling team along with information identifying themselves, their role in the incident management team, the fire on which they used the assessment, and any feedback they wanted to provide. These submissions were logged in an online spreadsheet and were used to identify potential improvements to the decision support tool and to provide context for how the tool was used on wildland fire incidents. Making submission of incident data voluntary was a design choice to encourage use by minimizing privacy or data tracking concerns.
Deployment and Evaluation
After prototyping and outreach efforts were complete, the COVID-19 Incident Risk Assessment Tool was released for operational use by appropriate individuals in the fire management community at their discretion. Field users on fire assignments generated the input data, interpreted the results, and communicated them within their incident response organizations and with partners. From this point forward, we made no further adjustments to the model but did aid with use and interpretation as requests arose.
The tool was developed under compressed time frames to support the immediate needs of the fire management community. Because the tool was released during an extreme fire season coincident with a pandemic, respondents from whom we solicited feedback were also operating under considerable time pressures and stresses. The prospect of limited documentation on use was foreseeable (including the possibility of offline use with the PDF version in areas with limited connectivity), as was the prospect of not knowing the total number of wildfire incidents at which the tool was used. These were acceptable tradeoffs, and we prioritized supporting COVID-19 assessment, mitigation, and communication efforts over comprehensively tracking and evaluating use. Nevertheless, we developed a three-tiered approach to evaluation of the tool: (1) tracking online usage statistics; (2) examining actual use cases; and (3) examining user feedback.
Results
Usage Statistics
We initially tracked dashboard usage using the built-in functionality provided by the shiny.io server. The usage statistics are tracked by the minute and include the number of active connections, Central Processing Unit (CPU) kernel usage in nanoseconds, and CPU user usage in nanoseconds. These usage statistics are shown over time in Figure 3, starting on 28 July 2020. The number of daily connections can be used as an estimate of the number of site visits the dashboard received. Because a single user may connect to the dashboard more than once per day, that metric can be higher than the number of daily unique site users.
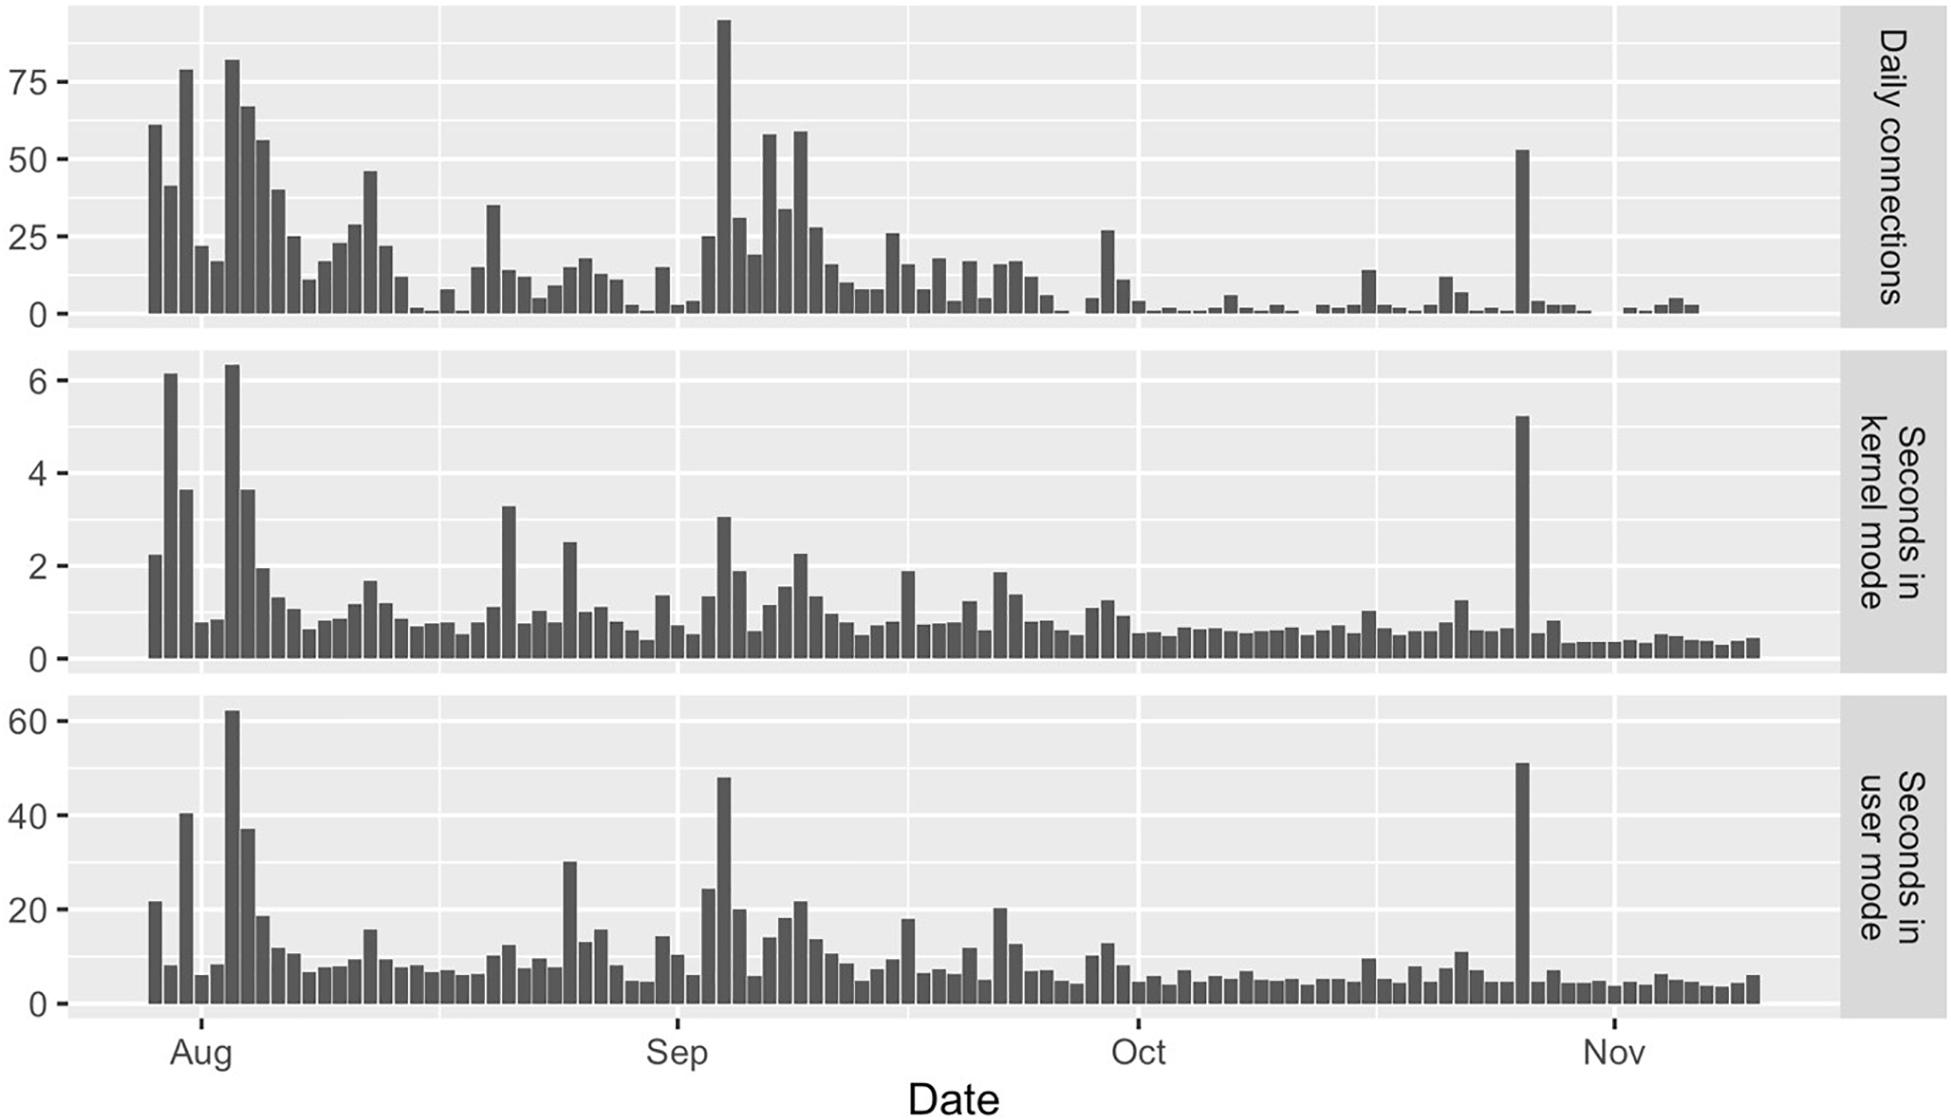
Figure 3. The daily connections, daily CPU usage in kernel mode, and daily CPU usage in user mode as tracked by the shiny.io server for 28 July 2020 through 10 November 2020.
The amount of CPU time used in kernel mode is associated with computing tasks such as application initiation, while the amount of CPU time used in user mode is associated with tasks such as application usage. Thus, for our dashboard, higher ratios of user mode to kernel mode CPU usage are likely to indicate users that are actually interacting with the dashboard as opposed to users who simply visit the site and do not interact with the application. These statistics from the shiny.io server show spikes in connections during key publication events such as the initial distribution the week of 28 July 2020, an email highlighting the application that was sent out on 4 September 2020, and a presentation that mentioned our team’s work on 20 October 2020. However, we also observe ongoing routine usage of the app between publication events.
To improve tracking of dashboard usage, on 10 September 2020, we enabled tracking by Google Analytics. We used the standard Google Analytics settings. The use of Google Analytics allowed us to track additional data on users, including location, and if the visitor was new or returning. Figure 4 shows the geographic distribution of new and returning users from 10 September 2020 through 10 November 2020. The dashboard saw usage across all regions of the United States, both for new visitors and returning visitors. According to the tracking done by Google Analytics, most users of the dashboard visited only once (150 users between 10 September and 10 November 2020). However, there were 20 users who visited the dashboard twice and 15 users who visited the dashboard between three and eight times. Google Analytics may underestimate returning visitors, as users who use more than one device can be considered a new user for each device. These dashboard user statistics may slightly underestimate the usage of this decision support tool, as we did provide decision-makers with a fillable PDF that could be used offline. In summary, usage statistics indicate sustained use of the tool by a variety of users in a variety of locations throughout the fire season.
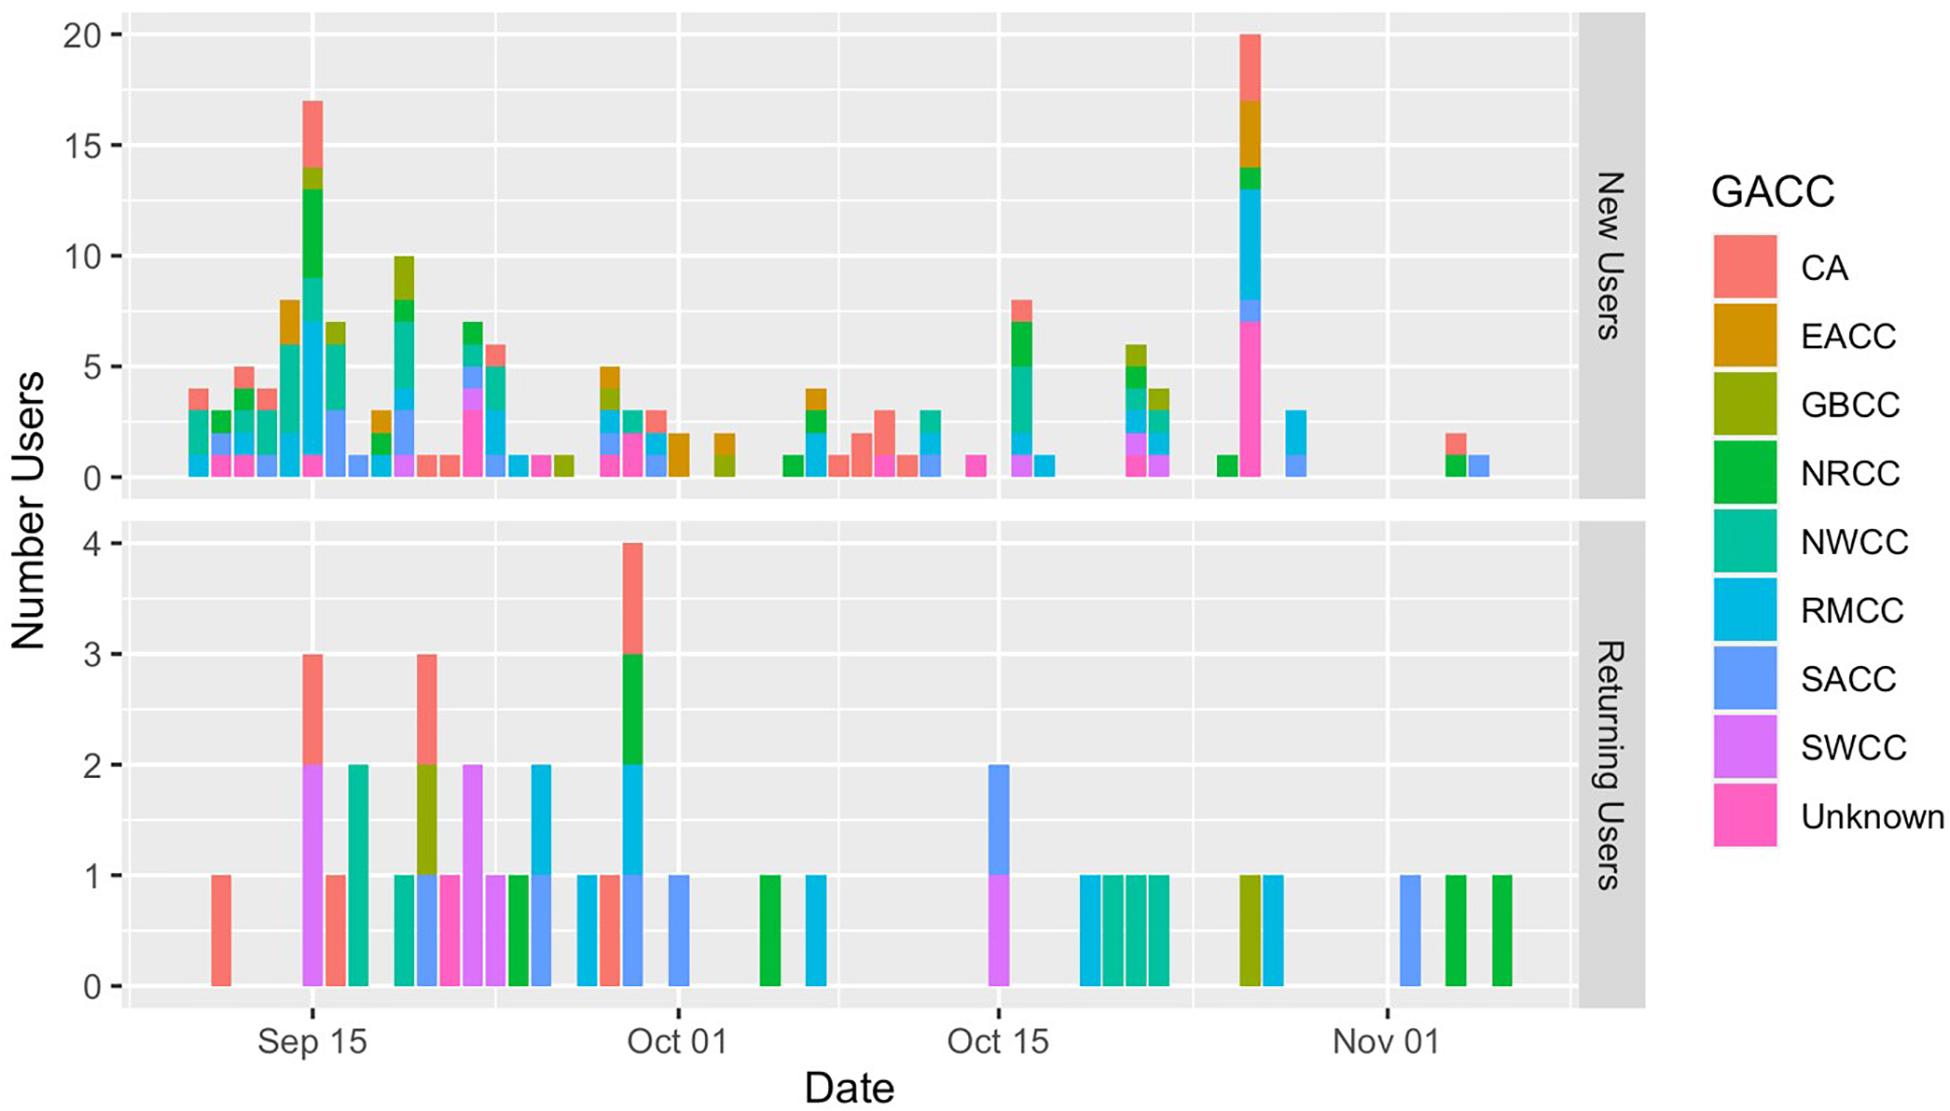
Figure 4. The number of dashboard users in the United States classified by geographic area coordinating center (GACC) and user status (new or returning) as tracked by Google Analytics for 10 September 2020 through 10 November 2020. CA, California (a merging of the Northern and Southern California Coordination Centers); EACC, Eastern Area Coordination Center; GBCC, Great Basin Coordination Center; NRCC, Northern Rockies Coordination Center; NWCC, Northwest Coordination Center; RMCC, Rocky Mountain Coordination Center; SACC, Southern Area Coordination Center; SWCC, Southwest Coordination Center.
Use Cases
For illustrative purposes, here we present risk assessment results and user-specified rationales for a real incident. We anonymize any data that could identify personnel or the incident, consistent with our statement to users that the tool was for informational purposes only and would not be used for any official record keeping or documentation. Figure 5 displays the finalized rose chart with the overall risk score (19) and risk rating (high) from the real incident example. Table 4 provides the accompanying rationales for all sub-factors. In this specific instance, Camp Risk Status and Mitigation Risk Status both rated as moderate, whereas COVID Risk Status rated as high, due to multiple cases among fire personnel and concerns over limited local healthcare capacity. As a point of comparison, Figure 6 displays the finalized rose chart for an incident rated as moderate risk, and with very different breakdown of risk factors. In that case, the highest risk factor was ICP Risk Status, with an expectation of many personnel and a long-duration incident, but with the ability to widely disperse fire personnel at a large fire camp.
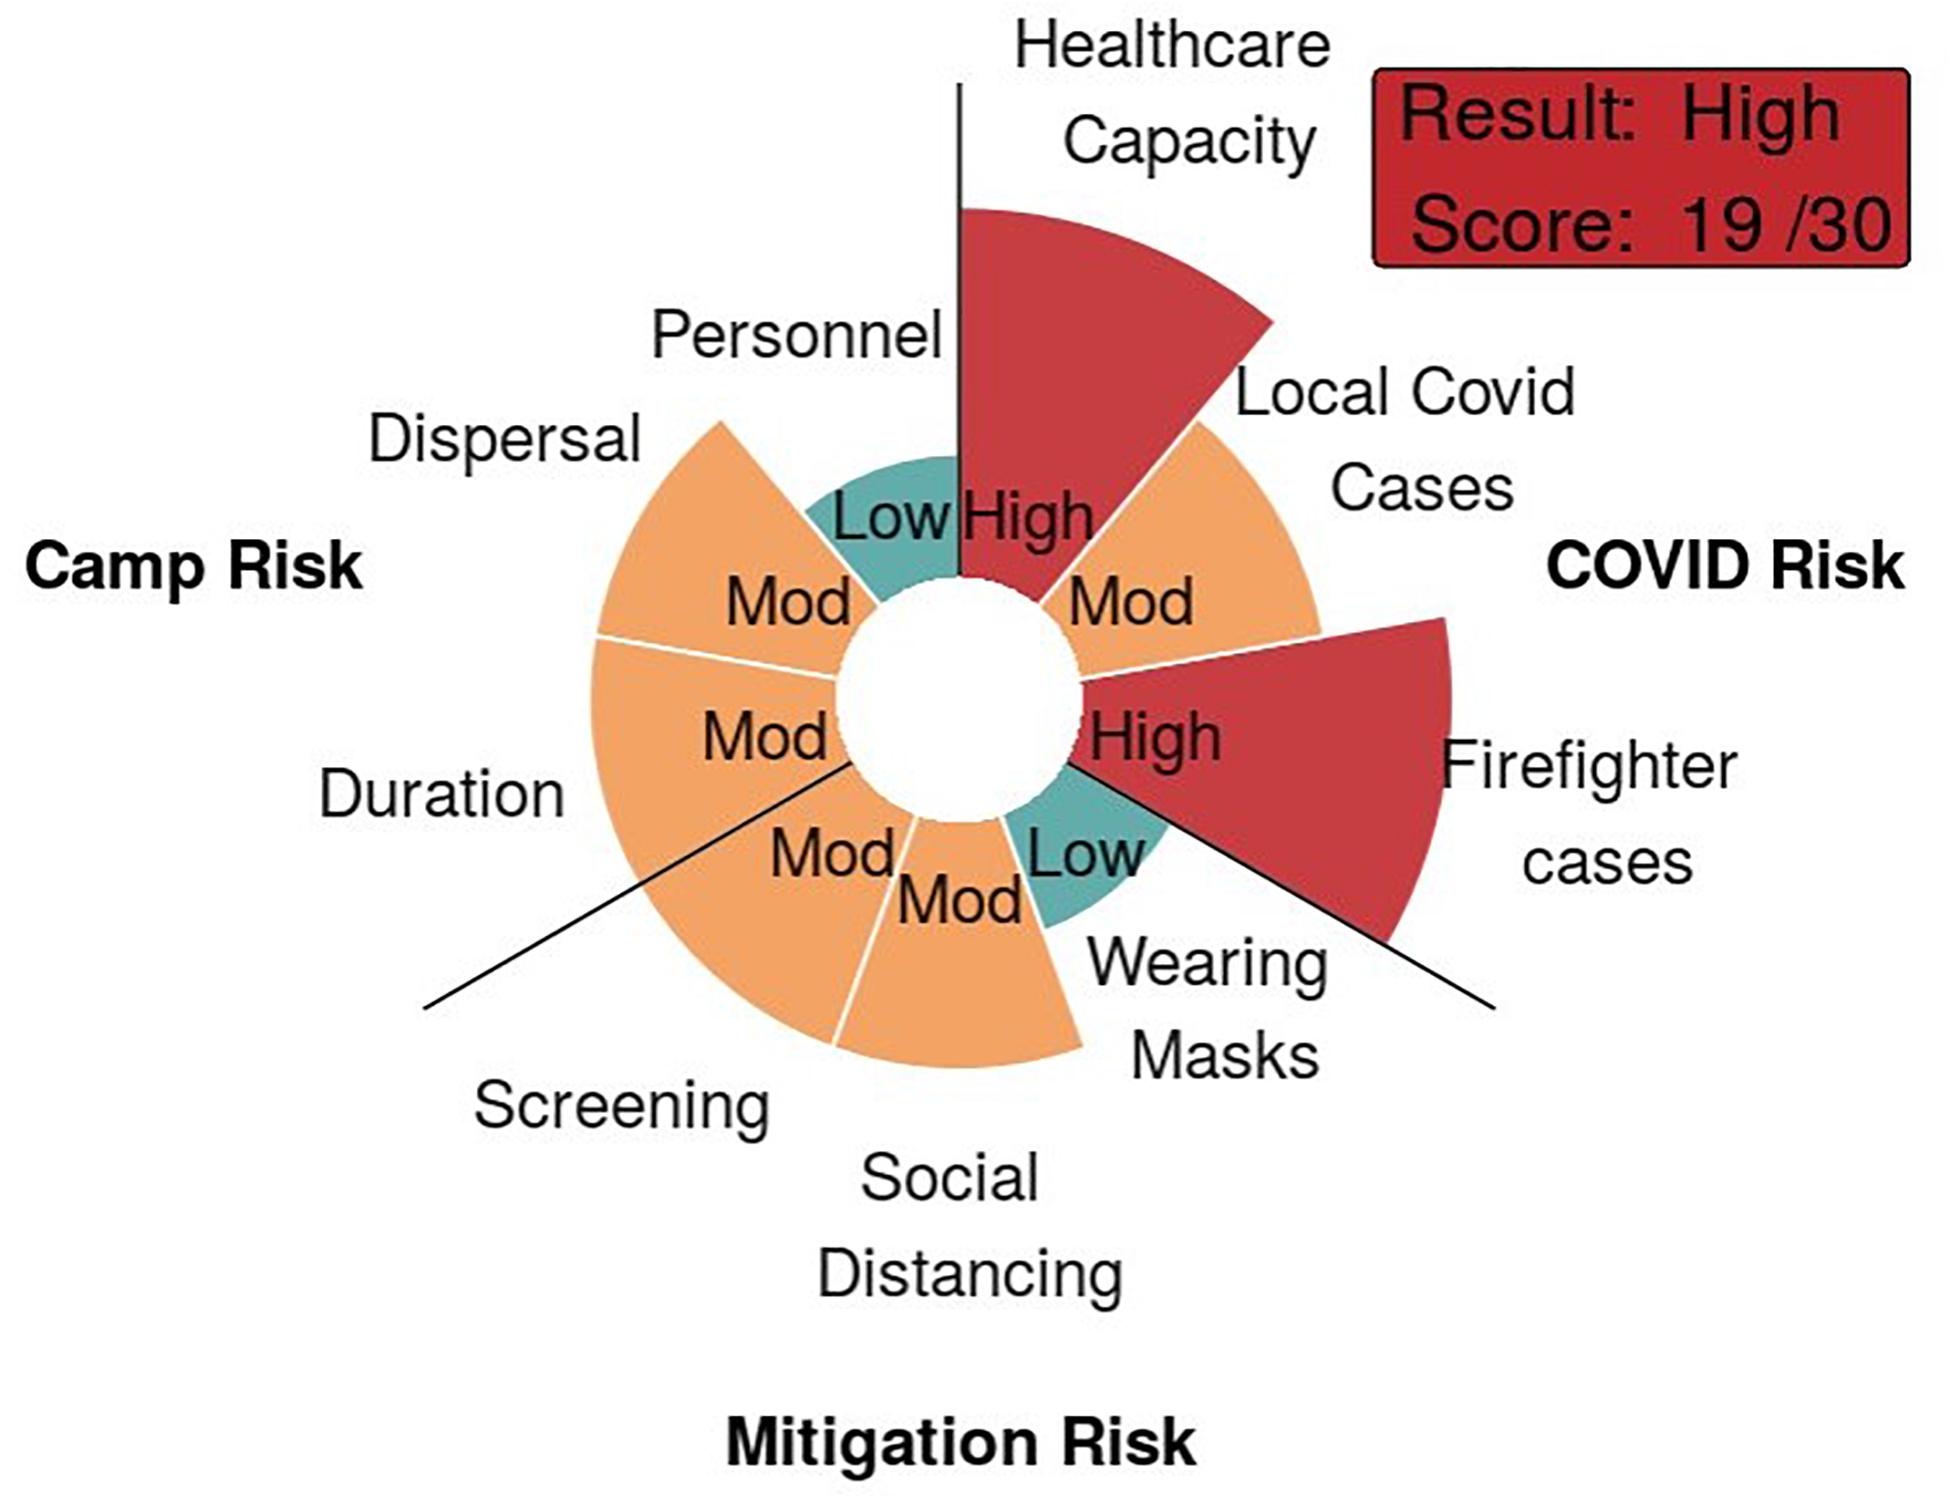
Figure 5. Rose chart results from actual use case rating out as high risk (risk score of 19).
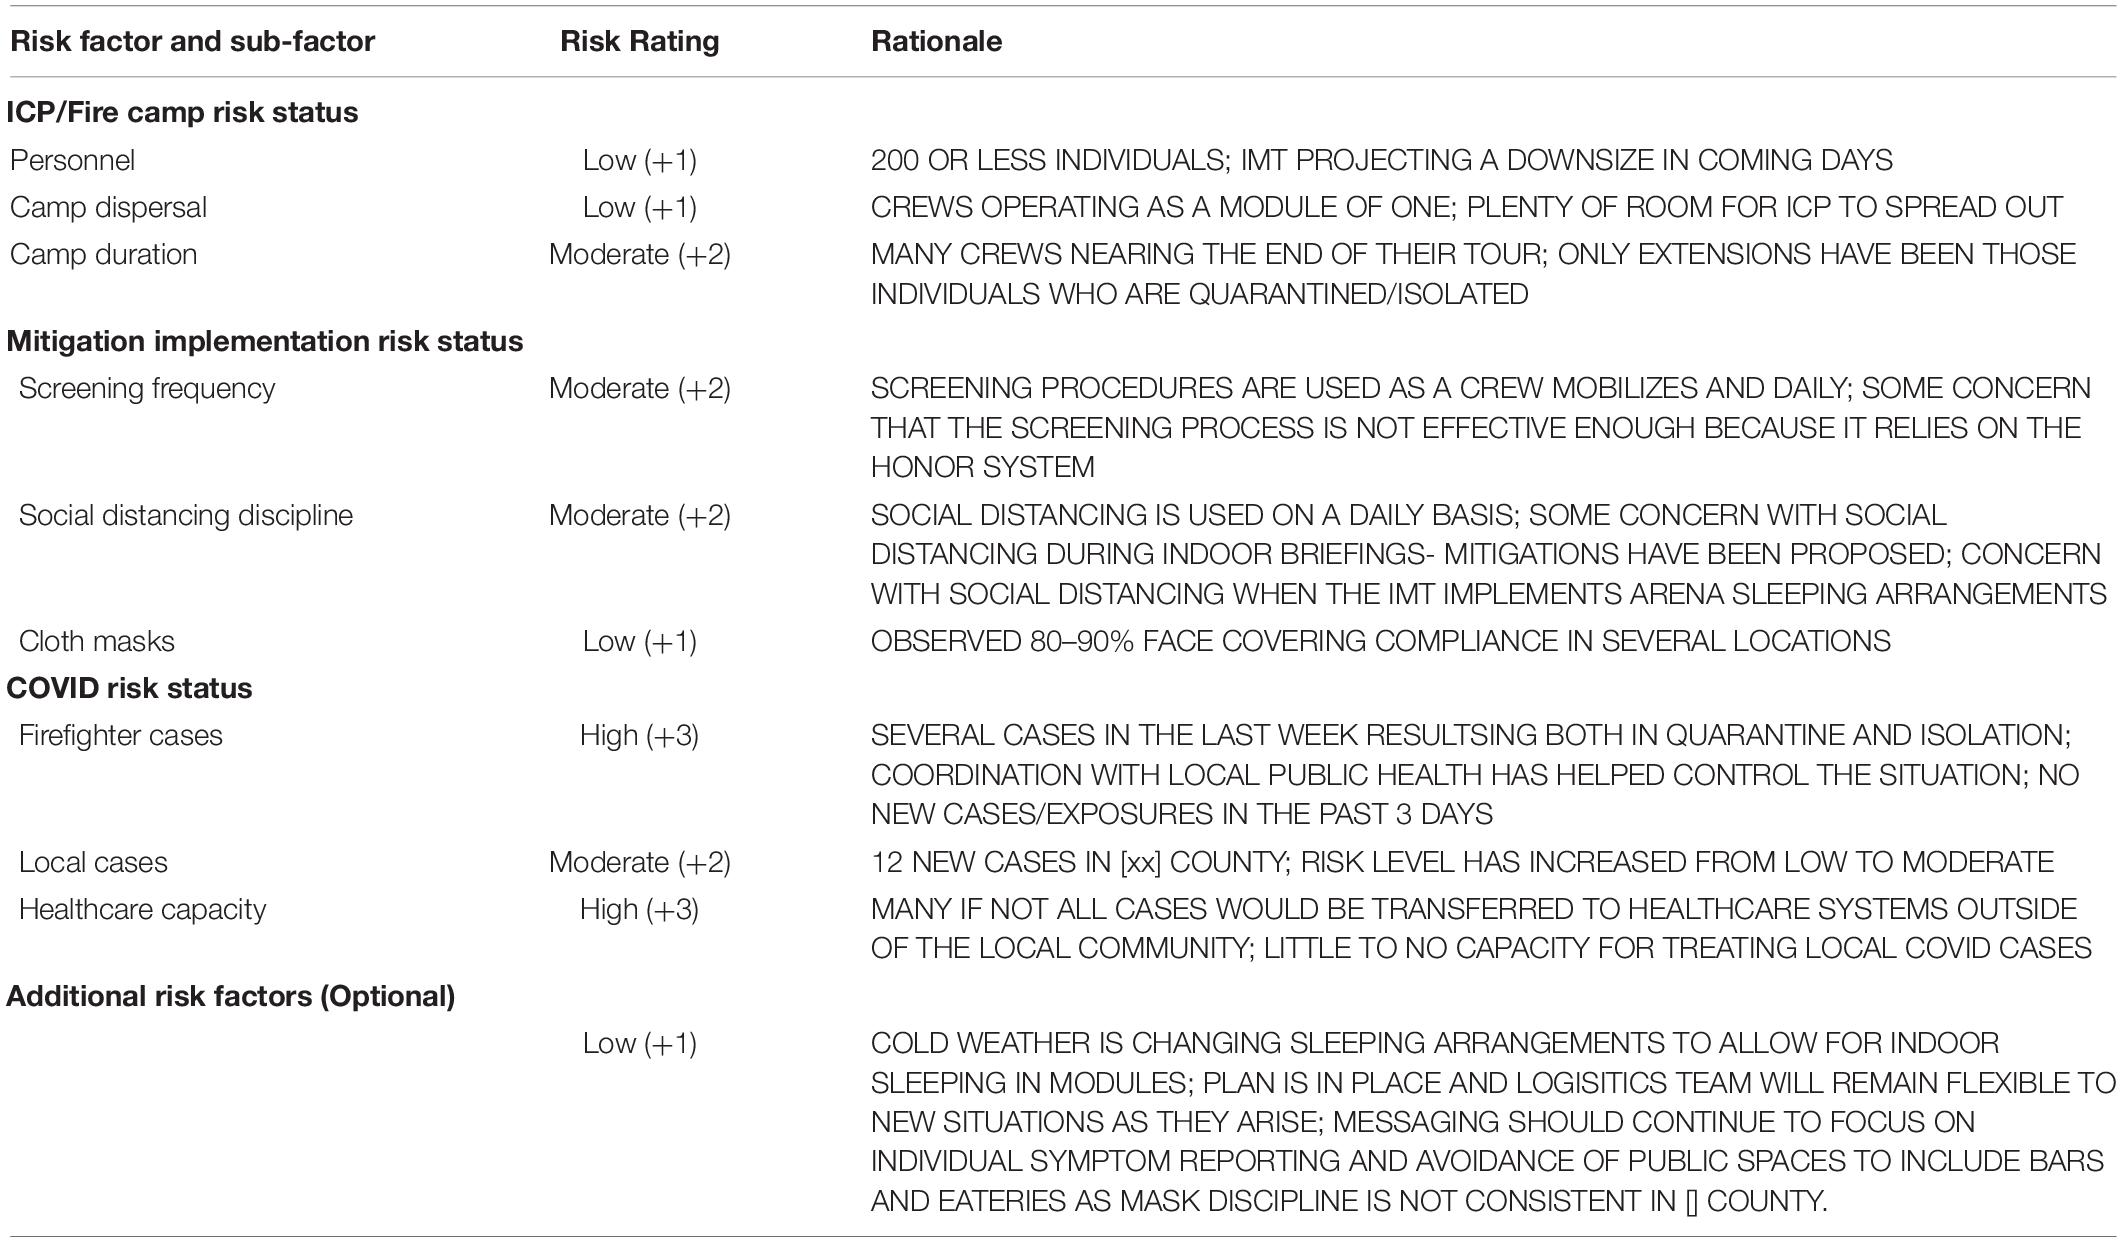
Table 4. User-specified rationales from actual use case rating out as high risk (risk score of 19).
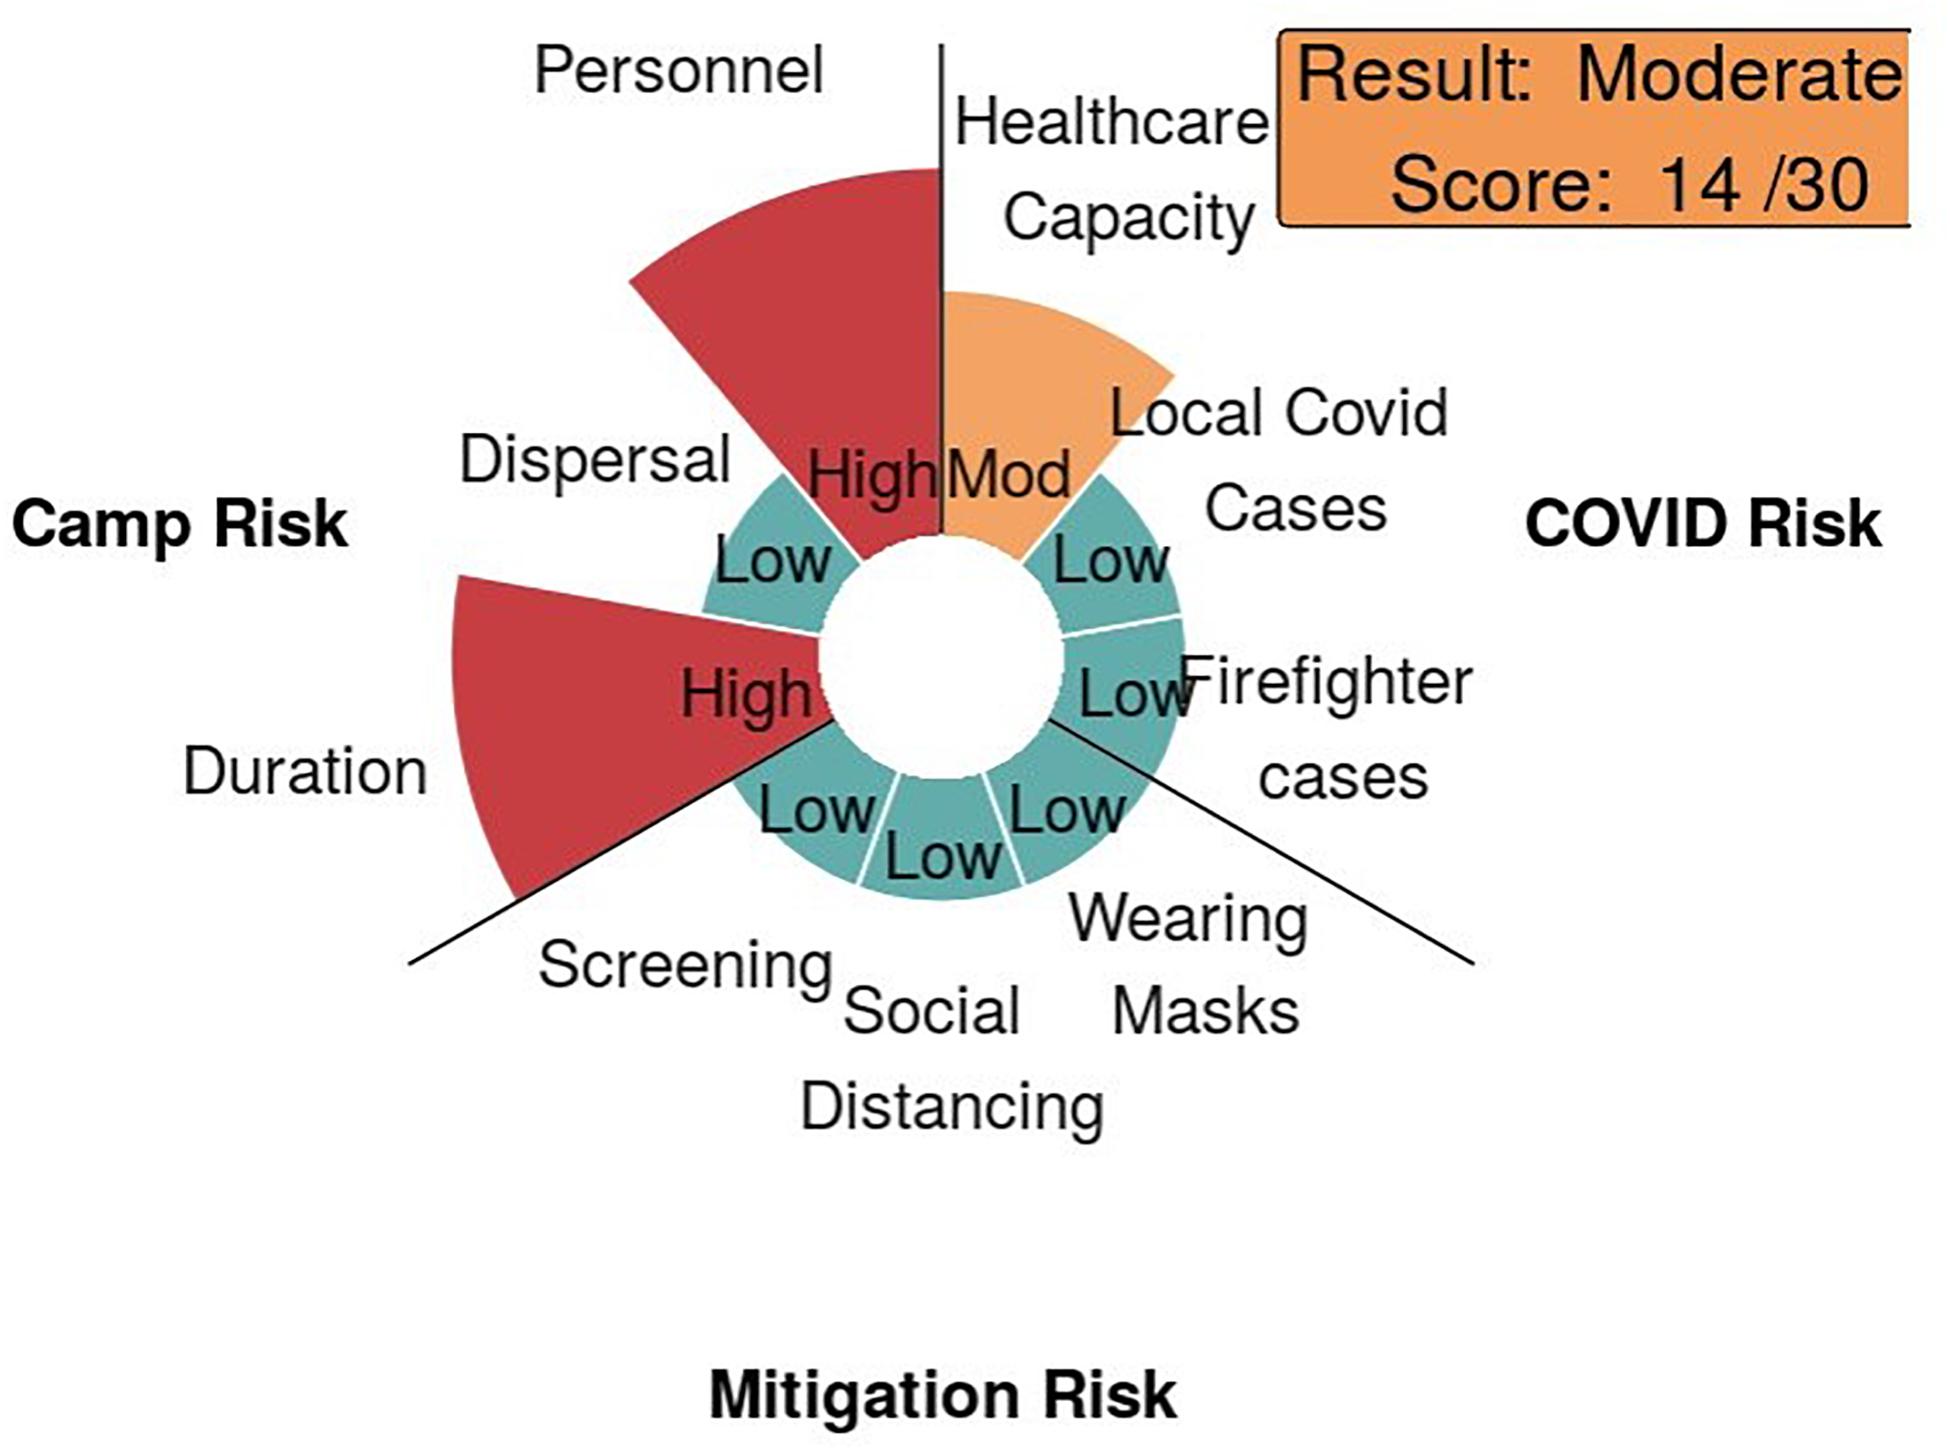
Figure 6. Rose chart results from a different actual use case rating out as moderate risk (risk score of 14).
It is worth reiterating that the primary intention of the tool was facilitating communication and coordination rather than predicting where COVID-19 spread might occur. With that said, comparison of assessment results against observed case counts could help validate the internal logic of the assessment framework. Unfortunately, data on firefighter case counts is of poor quality and federal wildfire management agencies in the United States did not publish official counts for COVID-19 cases occurring on wildfire incidents. To provide one example of validation, with an admittedly limited scope of inference, we are aware of one incident where the final score was 21/30 with a rating of high risk where widespread testing, contact tracing, and quarantining/isolating were initiated, and ultimately where multiple cases were confirmed (again, the incident details are anonymized).
User Feedback
A variety of personnel used the tool, including Agency Administrators, Safety Officers, Medical Unit Leaders, and COVID Advisors. Table 5 presents a select set of statements from real users and consumers of the COVID-19 Incident Risk Assessment Tool. Safety Officers appear to have been the primary user role, unsurprising given their responsibility to monitor all matters relating to the health and safety of response personnel. Feedback was generally positive, and notably emphasized how the tool enhanced communication and coordination, especially across organizations like county commissioners and local public health agencies. However, at least one user noted the subjectivity of some of the risk factors and questioned whether they “got it right.” This points to a continued need to emphasize that the tool is not intended to be precise or predictive but rather to stimulate deliberation and communication. We will return to these points in the next section.
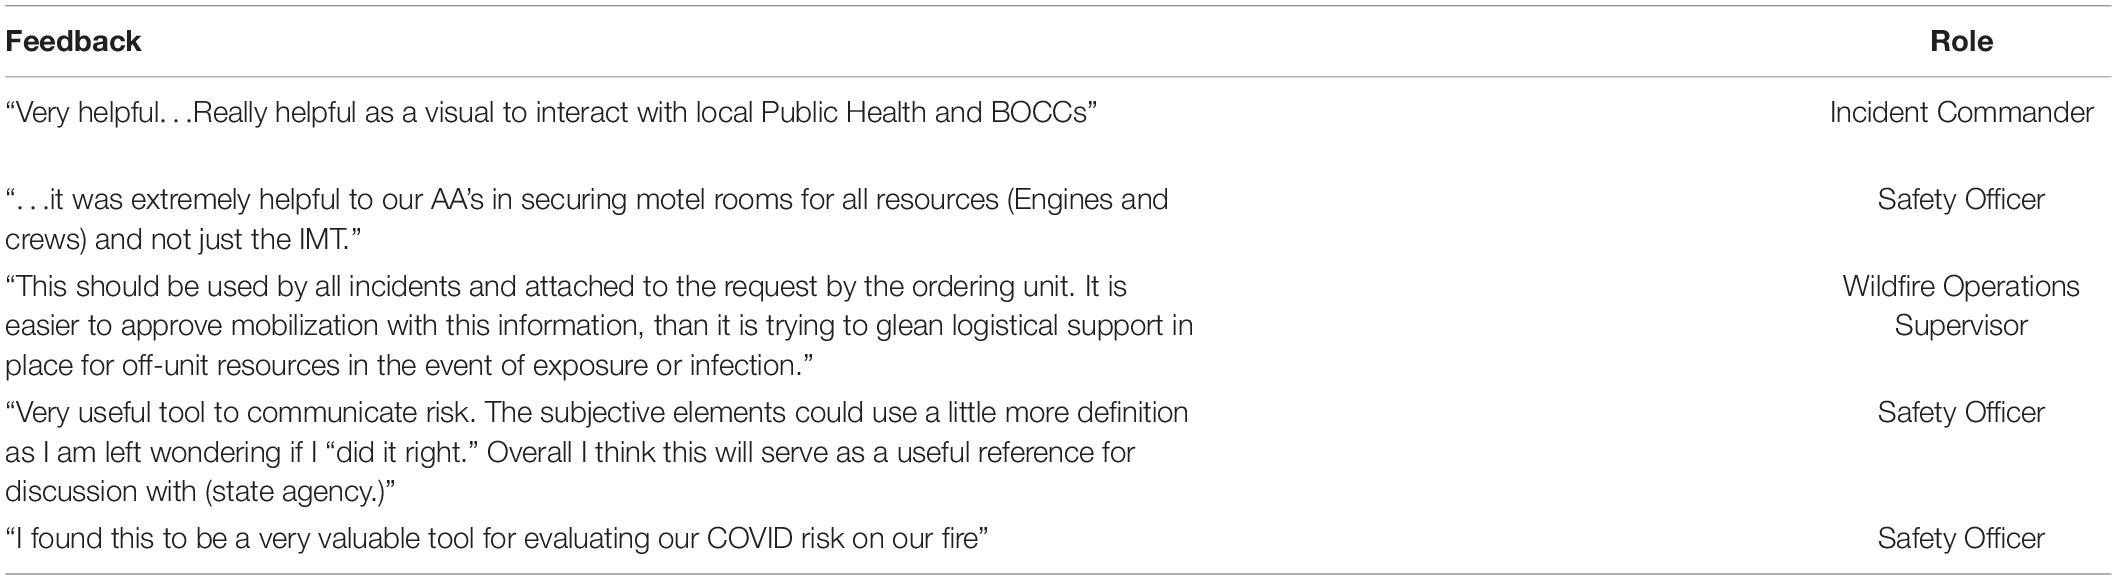
Table 5. Feedback from users and consumers of COVID-19 Risk Assessment Tool, with user role identified. BOCC, board of county commissioners. AA, Agency Administrator, IMT, Incident Management Team.
Discussion
The COVID-19 Incident Risk Assessment Tool was a rapidly developed product, built for an urgent need under considerable time pressure and uncertainty. The tool joins a body of online tools to support risk informed COVID-19 decision-making (e.g., Chande et al., 2020) and that emphasize human health and safety risks to firefighters (e.g., Viegas et al., 2009; Lahaye et al., 2018; Sol et al., 2018; Campbell et al., 2019; Dunn et al., 2019; Jolly et al., 2019; West et al., 2020). Early use and feedback from the field improved the product and facilitated iterative prototyping, including multiple combinations of risk factors and different approaches to visualization.
The tool was not intended to be predictive, but rather its primary contributions were in supporting the identification of risk factors and available mitigations, and in serving as a communication tool. Because of time pressures, the environment in which managers were operating, the rapid deployment of the tool during an ongoing fire season, and the choice to limit the collection of information, measures regarding the use of the tool are limited. We acknowledge limited feedback gathered from the field. However, use on even a modest number of incidents by the target user community can have an outsized impact as managers of the larger, longer duration, more complex incidents can be managing hundreds to thousands of individuals. Further, from the measures we do have as well as feedback from the field, it seems apparent that the tool helped to fill a critical information gap and supported risk-informed decision-making regarding incident logistics, operations, and COVID-19 mitigations (Table 5). Usage statistics indicate operational use across multiple incidents over time and spanning multiple geographic areas (Figures 3, 4). Although not the only measure of success, the reception has been positive from agency leadership down to the operational users. We acknowledge a degree of subjectivity but would emphasize the intent to support risk-informed assessment and communication based on local conditions and expertise.
Although not discussed here, in addition to the risk assessment functionality, our dashboard also allowed users to examine various incident scenarios using the epidemiological modeling presented in Thompson et al. (2020). Looking ahead, we plan to update this epidemiological modeling to account for individual interactions and variability in proportions of firefighters with a degree of immunity. We also intend to keep the risk assessment dashboard online, and pending analysis of empirical case and vaccine rates in the firefighting community may update the risk assessment framework. Ideally, the relationships between incident management teams and public health officials, and others, established during the 2020 wildfire season can be reinforced to support information exchange (Steelman et al., 2014), and the COVID-19 Risk Assessment Tool can facilitate those efforts.
Data Availability Statement
Publicly available datasets were analyzed in this study. This data can be found here: https://github.com/jakedilliott/ciraDash.
Author Contributions
MT and EB led development and prototyping of the tool. JD, EB, and JB led development of the online dashboard. MT led communication and outreach to the fire management community. All authors contributed to the manuscript.
Funding
This research was supported by the United States Department of Agriculture, Forest Service. This research was funded in part by joint venture agreement number 18-JV-11221636-099 between Colorado State University and the USDA Forest Service Rocky Mountain Research Station. This research was also supported by the Joint Fire Science Program, which provided funds to the USDA Forest Service Rocky Mountain Research Station (agreement 20-S-01-2) to support this work at Colorado State University through the existing joint venture agreement.
Conflict of Interest
The authors declare that the research was conducted in the absence of any commercial or financial relationships that could be construed as a potential conflict of interest.
Acknowledgments
We wish to thank many individuals who helped design, prototype, review, improve, and communicate our model, including Dave Williams, Shane Greer, Alex Viktora, Jim Burton, Tom Zimmerman, Kat Navarro, Jen Symonds, Jessica Brewen, Lisa Bryant, Jen Hayes, and Rick Stratton. The findings and conclusions in this manuscript are those of the author(s) and should not be construed to represent any official USDA or United States Government determination or policy.
Footnotes
- ^ https://www.nwcg.gov/committees/emergency-medical-committee/infectious-disease-guidance
- ^ https://www.nifc.gov/fireInfo/covid-19.htm
- ^ https://www.nwcg.gov/partners/fmb/covid-19
- ^ https://www.fs.usda.gov/sites/default/files/2020-04/master_revised_orm_guide_02262020.pdf
- ^ https://www.fs.usda.gov/rmrs/tools/covid-19-fire-incident-specific-risk-assessment-tool
References
Abatzoglou, J. T., and Williams, A. P. (2016). Impact of anthropogenic climate change on wildfire across western US forests. Proc. Natl. Acad. Sci. 113, 11770–11775. doi: 10.1073/pnas.1607171113
Calkin, D. E., Thompson, M. P., Finney, M. A., and Hyde, K. D. (2011). A real-time risk assessment tool supporting wildland fire decisionmaking. J. For. 109, 274–280.
Campbell, M. J., Page, W. G., Dennison, P. E., and Butler, B. W. (2019). Escape route index: a spatially-explicit measure of wildland firefighter egress capacity. Fire 2, 40. doi: 10.3390/fire2030040
Chande, A., Lee, S., Harris, M., Nguyen, Q., Beckett, S. J., Hilley, T., et al. (2020). Real-time, interactive website for US-county-level COVID-19 event risk assessment. Nat. Hum. Behav. 4, 1313–1319. doi: 10.1038/s41562-020-01000-9
Dilliott, J. (2021). ciraDash: First Release (Version v0.0.0.9001). Available online at: http://doi.org/10.5281/zenodo.4682186 (Accessed April 12, 2021)
Dunn, C. J., O’Connor, C. D., Reilly, M. J., Calkin, D. E., and Thompson, M. P. (2019). Spatial and temporal assessment of responder exposure to snag hazards in post-fire environments. For. Ecol. Manage. 441, 202–214. doi: 10.1016/j.foreco.2019.03.035
Greiner, S. M., Schultz, C. A., and Kooistra, C. (2020). Pre-season fire management planning: the use of Potential Operational Delineations (PODs) to prepare for wildland fire events. Int. J. Wildland Fire 30, 170–178. doi: 10.1071/wf20124
Jolly, W. M., Freeborn, P. H., Page, W. G., and Butler, B. W. (2019). Severe fire danger index: a forecastable metric to inform firefighter and community wildfire risk management. Fire 2:47. doi: 10.3390/fire2030047
Lahaye, S., Sharples, J., Matthews, S., Heemstra, S., Price, O., and Badlan, R. (2018). How does weather and terrain contribute to firefighter entrapments in Australia? Int. J. Wildland Fire 27, 85–98. doi: 10.1071/WF17114
Noonan-Wright, E. K., Opperman, T. S., Finney, M. A., Zimmerman, G. T., Seli, R. C., Elenz, L. M., et al. (2011). Developing the US wildland fire decision support system. J. Combust. 2011:168473.
Nowell, B., and Steelman, T. (2015). Communication under fire: the role of embeddedness in the emergence and efficacy of disaster response communication networks. J. Public Adm. Res. Theory 25, 929–952. doi: 10.1093/jopart/muu021
Nowell, B., Steelman, T., Velez, A. L. K., and Yang, Z. (2018). The structure of effective governance of disaster response networks: insights from the field. Am. Rev. Public Adm. 48, 699–715. doi: 10.1177/0275074017724225
R Core Team (2019). R: A Language and Environment for Statistical Computing. Vienna: R Foundation for Statistical Computing.
Radeloff, V. C., Helmers, D. P., Kramer, H. A., Mockrin, M. H., Alexandre, P. M., Bar-Massada, A., et al. (2018). Rapid growth of the US wildland-urban interface raises wildfire risk. Proc. Natl. Acad. Sci. U.S.A. 115, 3314–3319. doi: 10.1073/pnas.1718850115
Rapp, C., Rabung, E., Wilson, R., and Toman, E. (2020). Wildfire decision support tools: an exploratory study of use in the United States. Int. J. Wildland Fire 29, 581–594. doi: 10.1071/wf19131
Sol, J. A., Ruby, B. C., Gaskill, S. E., Dumke, C. L., and Domitrovich, J. W. (2018). Metabolic demand of hiking in wildland firefighting. Wilderness Environ. Med. 29, 304–314. doi: 10.1016/j.wem.2018.03.006
Steelman, T., and Nowell, B. (2019). Evidence of effectiveness in the Cohesive Strategy: measuring and improving wildfire response. Int. J. Wildland Fire 28, 267–274. doi: 10.1071/wf18136
Steelman, T. A., Nowell, B., Bayoumi, D., and McCaffrey, S. (2014). Understanding information exchange during disaster response: methodological insights from infocentric analysis. Adm. Soc. 46, 707–743. doi: 10.1177/0095399712469198
Thompson, M. P. (2013). Modeling wildfire incident complexity dynamics. PloS One 8:e63297. doi: 10.1371/journal.pone.0063297
Thompson, M. P., Bayham, J., and Belval, E. (2020). Potential COVID-19 outbreak in fire camp: modeling scenarios and interventions. Fire 3:38. doi: 10.3390/fire3030038
Viegas, D. X., Simeoni, A., Xanthopoulos, G., Rossa, C., Ribeiro, L., Pita, L., et al. (2009). Recent Forest Fire Related Accidents in Europe. Luxembourg: European Commission.
West, M. R., Costello, S., Sol, J. A., and Domitrovich, J. W. (2020). Risk for heat-related illness among wildland firefighters: job tasks and core body temperature change. Occup. Environ. Med. 77, 433–438. doi: 10.1136/oemed-2019-106186
Keywords: COVID-19, decision support, dashboard, wildfire management, risk management
Citation: Thompson MP, Belval EJ, Dilliott J and Bayham J (2021) Supporting Wildfire Response During a Pandemic in the United States: the COVID-19 Incident Risk Assessment Tool. Front. For. Glob. Change 4:655493. doi: 10.3389/ffgc.2021.655493
Received: 19 January 2021; Accepted: 26 April 2021;
Published: 21 May 2021.
Edited by:
Jose G. Borges, University of Lisbon, PortugalCopyright © 2021 Thompson, Belval, Dilliott and Bayham. This is an open-access article distributed under the terms of the Creative Commons Attribution License (CC BY). The use, distribution or reproduction in other forums is permitted, provided the original author(s) and the copyright owner(s) are credited and that the original publication in this journal is cited, in accordance with accepted academic practice. No use, distribution or reproduction is permitted which does not comply with these terms.
*Correspondence: Matthew P. Thompson, matthew.p.thompson@usda.gov