 Xiangzheng Fu
 Wen Zhu
 Lijun Cai1*
 Bo Liao
 Lihong Peng
 Jialiang Yang
- 1College of Information Science and Engineering, Hunan University, Changsha, China
- 2School of Mathematics and Statistics, Hainan Normal University, Haikou, China
- 3School of Computer Science, Hunan University of Technology, Zhuzhou, China
- 4Department of Genetics and Genomic Sciences, Icahn Institute for Genomics and Multiscale Biology, Icahn School of Medicine at Mount Sinai, New York, NY, United States
Playing critical roles as post-transcriptional regulators, microRNAs (miRNAs) are a family of short non-coding RNAs that are derived from longer transcripts called precursor miRNAs (pre-miRNAs). Experimental methods to identify pre-miRNAs are expensive and time-consuming, which presents the need for computational alternatives. In recent years, the accuracy of computational methods to predict pre-miRNAs has been increasing significantly. However, there are still several drawbacks. First, these methods usually only consider base frequencies or sequence information while ignoring the information between bases. Second, feature extraction methods based on secondary structures usually only consider the global characteristics while ignoring the mutual influence of the local structures. Third, methods integrating high-dimensional feature information is computationally inefficient. In this study, we have proposed a novel mutual information-based feature representation algorithm for pre-miRNA sequences and secondary structures, which is capable of catching the interactions between sequence bases and local features of the RNA secondary structure. In addition, the feature space is smaller than that of most popular methods, which makes our method computationally more efficient than the competitors. Finally, we applied these features to train a support vector machine model to predict pre-miRNAs and compared the results with other popular predictors. As a result, our method outperforms others based on both 5-fold cross-validation and the Jackknife test.
Introduction
Derived from hairpin precursors (pre-miRNAs), mature microRNAs (miRNAs) belong to a family of non-coding RNAs (ncRNAs) that play significant roles as post-transcriptional regulators (Lei and Sun, 2014). For example, hypothalamic stem cells partially control aging rate through extracellular miRNAs (Zhang et al., 2017). MiRNAs are formed by cleavage of pre-miRNAs by enzymes. Discovery of miRNAs relies on predictive models for characteristic features from pre-miRNAs. However, the short length of miRNA genes and the lack of pronounced sequence features complicate this task (Lopes et al., 2016). In addition, miRNAs are involved in many important biological processes, including plant development, signal transduction, and protein degradation (Zhang et al., 2006; Pritchard et al., 2012). Due to their intimate relevance to miRNA biogenesis and small interfering RNA design, pre-miRNA prediction has recently become a hot topic in miRNA research. However, traditional experimental methods like ChIP-sequencing are expensive and time-consuming (Bentwich, 2005; Li et al., 2013; Liao et al., 2014; Peng et al., 2017). In the post-genome era, a large number of genome sequences have become available, which provides an opportunity for large scale pre-miRNA identification by computational techniques (Li et al., 2010).
In recent years, many computational methods have been proposed to identify pre-miRNAs, most of which are based on machine learning (ML) algorithms or statistical models. The ML-based methods usually model pre-miRNA identification as a binary classification problem to discriminate real and pseudo-pre-miRNAs. Widely used ML-based algorithms include support vector machines (SVMs) (Xue et al., 2005; Helvik et al., 2007; Huang et al., 2007; Wang Y. et al., 2011; Lei and Sun, 2014; Lopes et al., 2014; Wei et al., 2014; Liu et al., 2015b; Khan et al., 2017), back-propagation and self-organizing map (SOM) neural networks (Stegmayer et al., 2016; Zhao et al., 2017), linear genetic programming (Markus and Carsten, 2007), hidden Markov model (Agarwal et al., 2010), random forest (RF) (Jiang et al., 2007; Kandaswamy et al., 2011; Lin et al., 2011), covariant discrimination (Chou and Shen, 2007; Lopes et al., 2014), Naive Bayes (Lopes et al., 2014), and deep learning (Mathelier and Carbone, 2010). For example, Yousef et al. (2006) Peng et al. (2018) used a Bayesian classifier for pre-miRNA recognition, which has demonstrated effectiveness in recognizing pre-miRNAs in the genomes of different species. Xue et al. (2005) proposed a triplet-SVM predictor to identify pre-miRNA hairpin structural features, whose prediction performance has been improved by 10% in a later method using a RF-based MiPred classifier (Jiang et al., 2007). In addition, Stegmayer et al. (2016) proposed a deepSOM predictor to solve the problem of imbalance of positive and negative pre-miRNA samples.
It is known that the performance of ML-based methods is highly associated with the extraction of features (Liao et al., 2015b; Zhang and Wang, 2017; Ren et al., 2018). Typical feature representation methods include secondary structure and sequence information-based methods (Wei et al., 2016; Saçar Demirci and Allmer, 2017; Yousef et al., 2017). For example, Xue et al. (2005) proposed a 32-dimensional feature of triplet sequences containing secondary structure information to better express pre-miRNA sequences. Jiang et al. (2007) performed random sequence rearrangement, which is useful in obtaining the energy characteristics of pre-miRNA sequences. However, this method is quite slow. In addition, Wei et al. (2014) and Chen et al. (2016) extended the features proposed by Xue et al. (2005) into 98-dimensional pre-miRNA features, which resulted in a better pre-miRNA prediction accuracy. Most pre-miRNAs have the characteristic stem–loop hairpin structure (Xue et al., 2005); thus, the secondary structure is an important feature used in computational methods. Recently, Liu et al. proposed several methods for predicting pre-miRNAs on the basis of the secondary structure, namely, iMiRNA-PseDPC (Liu et al., 2016), iMcRNA-PseSSC (Liu et al., 2015b), miRNA-dis (Liu et al., 2015a), and deKmer (Liu et al., 2015c). Some researchers (Khan et al., 2017; Yousef et al., 2017) have increased the dimensionality of features by combining multi-source features to improve the accuracy of pre-miRNAs prediction. With the increase of feature dimension, considerable redundant information and noises are also incorporated, which may reduce the prediction accuracy and slow down the algorithm. Thus, it is usually necessary to perform feature selection to remove irrelevant or redundant features. An excellent feature selection method can effectively reduce the running time for training the model and improve the performance of the prediction (Wang X. et al., 2011; Wang Y. et al., 2011). To further facilitate computational processes, several bioinformatics toolkits have been developed to generate numerical sequence feature information (Liu et al., 2015d).
Developing an effective feature representation algorithm for pre-miRNA sequences is a challenging task. Existing methods have several drawbacks, which may not be sufficiently informative to distinguish between pre-miRNAs and non-pre-miRNAs. First, even excellent feature extraction methods usually only consider the frequency or sequence information of the bases of pre-miRNA sequences while ignore the interaction between two bases. Second, feature extraction methods based on secondary structures usually only consider the global characteristics while ignore the mutual influence of the local characteristics of structures. Third, methods combining multisource feature information and integrating feature selection algorithms to reduce dimensionality (Khan et al., 2017; Yousef et al., 2017) is inefficient in computational time.
As a useful measure to compare profile information based on their entropy, mutual information (MI) has been extensively applied in computational and bioinformatics studies. For instance, MI profiles were used as genomic signatures to reveal phylogenetic relationships between genomic sequences (Bauer et al., 2008), as a metric of phylogenetic profile similarity (Date and Marcotte, 2003), and for predicting drug-target interactions (Ding et al., 2017) and gene essentiality (Nigatu et al., 2017). Inspired by previous studies (Date and Marcotte, 2003; Bauer et al., 2008; Ding et al., 2017; Nigatu et al., 2017; Zhang and Wang, 2018), we proposed a novel MI-based feature representation algorithm for sequences and secondary structures of pre-miRNAs. Specifically, we used entropy and MI to calculate the interdependence between bases, and calculated the 3-gram MI and 2-gram MI of the sequences and secondary structures as feature vectors, respectively. Due to the nature of MI in representing profile dependency, our method is capable of catching the interactions between sequence bases and local features of the secondary structure, which is critical to pre-miRNA prediction. In addition, we combined the MI feature with the minimum free energy (MFE) feature of pre-miRNA, one of the most widely used features for RNA study and constructed a total of 55-dimensional features. Since the feature space is smaller than that of most popular methods, our method is computationally more efficient than the competitors while keeping most important information for pre-miRNA prediction. Our method was evaluated on a stringent benchmark dataset by a jackknife test and compared with a few canonical methods.
Materials and Methods
Framework of the Proposed Method
We illustrated in Figure 1 the overall framework of our method, which consists of two main steps, namely, feature extraction and pre-miRNA prediction. In the feature extraction step, the initial pre-miRNA sequences were first extracted from the raw data. Secondly, homology bias was avoided by using the CD-HIT software (Li and Godzik, 2006) (with threshold value 0.8), and the samples with similarity greater than the threshold in the initial dataset were filtered out. The remaining data was used as the benchmark dataset for this study. After that, the secondary structures of the sequences in the benchmark dataset were predicted by the software RNAfold (Hofacker, 2003). Finally, the primary sequence features based on mutual information (PSFMI), secondary structure features based on mutual information (SSFMI), and MFE features were retrieved, respectively for samples in the benchmark dataset. In the pre-miRNA prediction step, the generated features were fed into an SVM classifier to generate a training model, which was employed to predict pre-miRNAs.
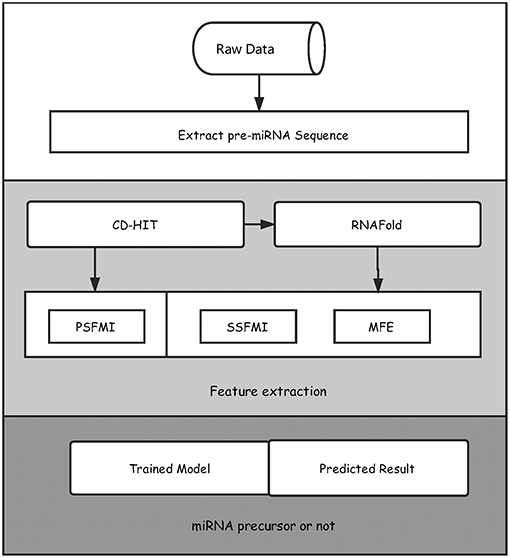
Figure 1. The overall framework of the proposed method for predicting pre-miRNAs.
Datasets
Balanced Dataset
Our balanced benchmark dataset for pre-miRNA identification consists of real Homo sapiens pre-miRNAs as positive set and two pseudo pre-miRNAs subsets as negative set, named as: S1 and S2, respectively. The benchmark dataset S1 and S2 can be formulated as:
The benchmark dataset S+contains a total of 1,612 positive samples, which were selected from the 1,872 reported Homo sapiens pre-miRNA entries downloaded from the miRBase (20th Edition) (Kozomara and Griffithsjones, 2011), and the pre-miRNAs sharing sequence similarity more than 80% were removed using the CD-HIT software (Li and Godzik, 2006) to get rid of redundancy and avoid bias; the negative samples set contains 1,612 pseudo miRNAs, which were selected from the 8,494 pre-miRNA-like hairpins (Xue et al., 2005); the contains 1,612 pseudo miRNAs, which were selected from the 14,250 pre-miRNA-like hairpins (Wei et al., 2014).
In addition, we selected 88 new pre-miRNA sequences from a later version (e.g., miRBase22) as positive samples, and selected 88 samples from as negative samples to construct a benchmark dataset for independent testing, named S3. The benchmark dataset S3 can be formulated as:
Imbalanced Dataset
To evaluate the performance of our approach in an unbalanced dataset, we have constructed two unbalanced benchmark datasets, named as: S4 and S5, respectively. The benchmark dataset S4 and S5 can be formulated as:
Specifically, S4 consists of S+ (positive samples) and (negative samples) with ratio ~1:8.8 (1,612:14,250). S5 was adopted from microPred (Batuwita and Palade, 2009), which contains 691 non-redundant human pre-miRNAs from miRBase release 12 and 8,494 pseudo hairpins.
To evaluate experimental performance on other species, we retrieved the virus pre-miRNA sequences dataset from the study of Gudyś et al. (2013). Similar to other datasets, we removed pre-miRNAs sharing more than 80% sequence similarity by the CD-HIT software. As a result, we constructed a virus dataset namely S6, which contains 232 positive samples and 232 negative samples. The benchmark dataset S6 can be formulated as:
Where the virus pre-miRNA sequences dataset S6 consists of (positive samples) and (negative samples), which were obtained from the study of Gudyś et al. (2013).
Classification Algorithm and Optimization
We selected SVM to classify the samples. Specifically, the publicly available support vector machine library (LIBSVM) was applied to the benchmark data with our feature representation. The LIBSVM toolkit can be downloaded freely at http://www.csie.ntu.edu.tw/~cjlin/libsvm. We integrated this toolbox in the Matrix Laboratory (MATLAB) workspace to build the prediction system. We selected the radial basis function as the kernel function, and a grid search based on the 10-fold cross validation was used to optimize the SVM parameter γ and the penalty parameter C. C = 65,536 and γ = 10−4 was tuned to be the optimal parameters.
Features Extraction
Primary Sequence Features Based on Mutual Information (PSFMI)
Recently, it has been shown that local continuous primary sequence characteristics are crucial for pre-miRNA prediction (Bonnet et al., 2004). As one of the important characteristics, n-grams are often used in feature mapping (Liu and Wong, 2003). Let S be a given pre-miRNA sequence (consisting of four characters: A, U, C, and G) with length L. Then the n-grams represent a continuous subsequences of length n in S with.
Figure 2 shows the calculation process for the 2-gram and 3-gram PSFMI feature representations. Any two and three consecutive bases in the pre-miRNA sequence, regardless of the order of the bases, are represented as 2- and 3-gram, respectively. For example, as shown in Figure 2, the number of bases “GA”(2-gram) is 3. The number of bases “UG”(2-gram) is 4. Similarly, 3-gram represents three consecutive bases, such as the number of bases “G G U”(3-gram) is 2.
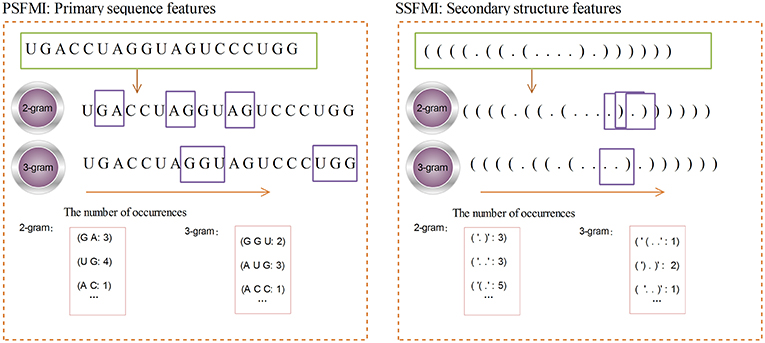
Figure 2. The 2-gram and 3-gram feature representation.
In this study, we used entropy and mutual information (MI) to calculate the interdependence between two bases on a given pre-miRNA sequence. Specifically, we calculated the 3-gram MI and the 2-gram MI as the feature vector for a given pre-miRNA sequence. The 3-tuple MI for 3-gram is calculated as:
where x, y, and z are three conjoint bases. Subsequently, the MI MI(x, y) and conditional MI MI(x, y|z) can be calculated as follows:
Here, H(x|z) andH(x|y, z) are calculated as follows:
where p(x) denotes the frequency of x appearing in a pre-miRNA sequence, p(x, y)denotes the frequency of x and y appearing in 2-grams and p(x, y, z) denotes the frequency of x, y, and z appearing in 3-tuples in a pre-miRNA sequence. p(x), p(x, y) and p(x, y, z) can be calculated by Equations (8)–(10):
(10) Nx is the number of occurrences of base x appearing in the pre-miRNA sequence, and L is the length of the pre-miRNA sequence. In Equation (8), ε represents a very small positive real number that does not affect the final score, which is used to avoid having 0 as the denominator.
According to the Equation (10), a given pre-miRNA sequence can be expressed as 30 mutual information values [20 3-tuples IM (x, y, z) and 10 2-tuples IM (x, y)]. In addition, we calculated the frequency of the four base classes appearing in this pre-miRNA sequence. Therefore, the pre-miRNA sequence can be expressed as 20 + 10 + 4 = 34 features, as determined using our proposed mutual information method.
Secondary Structure Features Based on Mutual Information (SSFMI)
It has been shown that the structure of pre-miRNA can provide insights into biological functions. Pre-miRNA structural information can be predicted by RNAfold (Hofacker, 2003) software from sequences and is frequently used as features by machine-learning algorithms. Figure 3 shows the pre-miRNA secondary structure of miRNA hsa-mir-302f, which was obtained using the algorithm in Mathews et al. (1999).
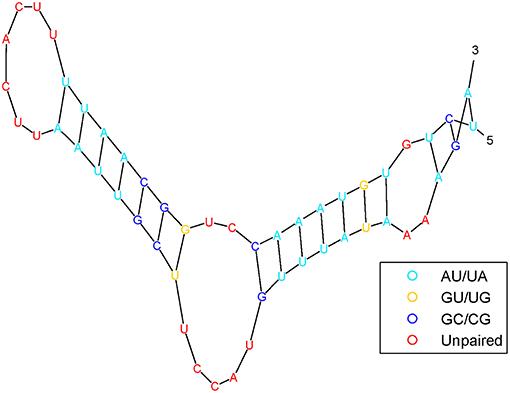
Figure 3. The pre-miRNA secondary structure of miRNA hsa-mir-302f.
The pre-miRNA secondary structure is represented as a sequence of three symbols: a left parenthesis, a right parenthesis, and a point. In other words, nucleotides have only two states: paired and unpaired nucleotides, which are represented in parentheses “(” or “)” and points “.”, respectively. The open parenthesis “(” indicates that the paired nucleotides located on the 5′ end can be paired with 3′-end nucleotides, which are represented by the corresponding close parenthesis “).” The secondary structure of the pre-miRNA sequence is composed of free radicals and radical pairs A–U and C–G. To a certain extent, after such treatment, the secondary structure of the pre-miRNA sequence can be converted into a linear sequence.
A given pre-miRNA sequence S is converted to a pre-miRNA secondary structure sequence by using the RNAfold software. The length of the sequence is denoted by L, and the mutual information of the secondary structure sequence n-gram is calculated by Equations (1) and (3). The calculation process is similar to that for the PSFMI. Figure 2 shows the calculation process for the 2-gram and 3-gram SSFMI feature representations.
According to Equations (1)–(10), the pre-miRNA secondary structure sequence can be expressed as 16 mutual information values [10 3-tuples IM(x, y, z) and 6 2-tuples IM(x, y)]. Similarly, the frequencies of the three symbols that appear in the sequence of secondary structure elements were calculated. Another significant feature is the amount of base pairs in pre-miRNA sequences. For the pre-miRNA gene, given the presence of the G–U wobble pair in the hairpin loop structure (secondary structure) of the pre-miRNA, the G–U pair is considered in the base pairing.
Therefore, the secondary structure features can be expressed as 10 + 6 + 3 + 1 = 20 features, as determined using our proposed mutual information method.
In addition, studies have shown that real pre-miRNA sequences are generally more stable than randomly generated pseudo-pre-miRNAs and therefore have lower MFE. Therefore, during the process of feature extraction for pre-miRNA sequences, structural energy features are often used to characterize pre-miRNA sequences. Since the structural calculation result of RNAfold is actually provided along with the MFE value of the secondary structure of the sequence, we took this value.
In summary, we extracted a total of 55 [34 (PSFMI) + 20 (SSFMI) + 1 (MFE)] features, in which the 34-dimensional feature was obtained by applying the PSFMI method from the pre-miRNA sequence, the 20-dimensional feature was obtained by applying the SSFMI method from the pre-miRNA secondary structure, and the 1 (MFE) dimension feature is the MFE value calculated by the RNAfold software. Since the distribution of the values in each feature is non-uniform, we normalized each feature to (−1,1) using the MATLAB function mapminmax (MATLAB 2014b), and obtained the final 55-dimensional feature data set for model training.
Measurements
In statistical prediction experiments, three cross-validation methods are often used to test the effectiveness of a prediction algorithm including independent dataset test, K-fold validation test and the Jackknife validation test. Among them, the Jackknife test is considered to be the most rigorous and objective method of verification. In the field of pre-miRNA prediction, the Jackknife tests are often used to verify the predictive performance of different algorithms. In the Jackknife test, each pre-miRNA sequence was individually selected as a test sample, and the remaining pre-miRNA sequences were used as training samples, and the test sample categories were predicted from the model trained by the training samples. Therefore, we adopted the Jackknife test in this study.
In order to comprehensively evaluate the performance of the pre-miRNA prediction method, several indicators were introduced in this paper. Receiver operating characteristic (ROC) was plotted based on specificity (Sp) and sensitivity (Sn). The areas under ROC curves (AUC) and average area under the precision-recall curve (AUPR) are both used as the evaluation metrics. The AUC provides a measure of the classifier performance; the larger the value of the AUC is, the better the performance of the classifier. However, for class imbalance problem, AUPR is more suitable than AUC, for it punishes false positive more in evaluation. In addition, Matthew correlation coefficient (MCC) was used to evaluate the prediction performance. The MCC accounts for true and false positives and negatives and are usually regarded as a balanced measure that can be used even if the classes are of different sizes. The sensitivity (SE), specificity (SP), precision (PR), accuracy (ACC), and MCC are defined as follows:
Where TP, TN, FP, and FN denote the number of true positives, true negatives, false positives and false negatives, respectively.
Results and Discussion
Performance of Different Features
According to the feature extraction algorithm proposed in this paper, the corresponding 55 features (including PSFMI, SSFMI, and MFE) were extracted for each true and false pre-miRNA (positive and negative sample data) in the benchmark dataset. For the improved evaluation of these features, they were subdivided into four subsets according to the different feature types, namely, PSFMI, SSFMI, PSFMI + MFE, and SSFMI + MFE feature sets. To assess the importance of each feature subset, predictive models were constructed on the basis of the different feature subsets of the benchmark dataset. Jackknife verification was used to evaluate the performance of the predictive models.
Table 1 presents a comparison of the performances of the predictive models based on the different feature subsets and combinations thereof. As demonstrated in Table 1, the predictive model based on the feature subset SSFMI is better than that based on the feature subset PSFMI. The predictive model based on SSFMI achieves 80.21% sensitivity, 88.34% specificity, the Matthews coefficient of 0.688, and prediction accuracy of 84.27%. The predictive model based on the mutual information of pre-miRNA secondary structure is better than that based on the sequence-based mutual information. The performances of the predictive models based on the PSFMI + MFE and SSFMI + MFE feature sets are significantly improved compared with those based on the independent feature subsets (i.e., PSFMI and SSFMI feature sets). In terms of accuracy, the performance of the PSFMI + MFE model is 13.24% better than that of the PSFMI model, whereas the performance of the SSFMI + MFE based model is 1.31% better than that of the SSFMI model. The experimental results show that the combination of MFE features should be considered to increase prediction accuracy.
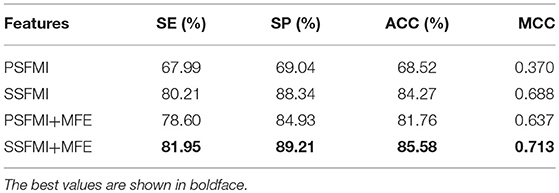
Table 1. The performance of different features on benchmark dataset (Jackknife test evaluation).
We also compare the AUROC of four feature combinations obtained by Jackknife cross-validation on benchmark dataset S1, shown in Figure 4. We can draw the same conclusion that the prediction model based on feature subset SSFMI is better than the prediction model based on feature subset PSFMI, and the combination of MFE features can improve the accuracy of prediction.
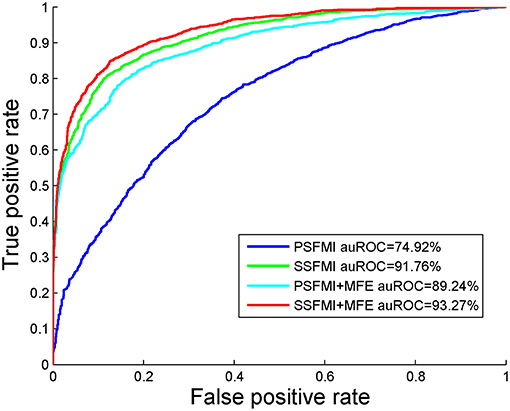
Figure 4. The AUROC comparison of four feature combinations through the Jackknife cross-validation.
Feature Importance Analysis
To explore the extent to which the features in the feature set affect the classification, we analyzed the importance of each feature in the feature set. To quantitatively measure the importance of each feature, we introduced the metric information gain (IG) (Deng et al., 2011; Uǧuz, 2011). IG scores are widely used in the analysis of feature importance of biological sequences (Wei et al., 2014, 2017; Chen et al., 2016). The higher the value of IG, the more important the feature is for the classifier. Table 2 presents the IG scores of 55 features. As shown in Table 2, although the 4 highest IG values all belong to PSFMIs, the 10 lowest IG values also belong to PSFMIs, indicating that the IG values of the PSFMIs are unevenly distributed and have large differences. The average IG value of PSFMI features is 0.5761, whereas the average IG value of SSFMI is 0.7489, further confirming that the secondary structure characteristics of pre-miRNA have a greater influence on the classification results than the primary sequence characteristics. The experimental findings are also consistent with the feature importance analysis.
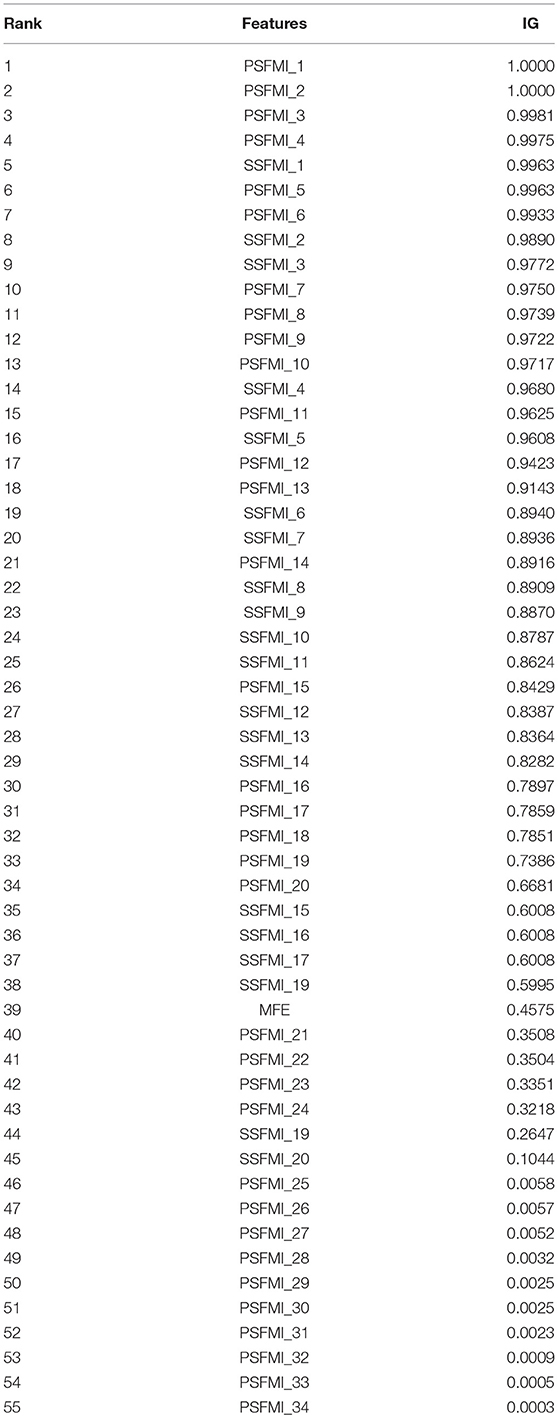
Table 2. Importance of the relatively specific features in the proposed features set.
Effect of Different Kernel Functions
To justify different kernel functions of SVM for our algorithm, we ran another set of experiments on the benchmark dataset using Jackknife test evaluation. Several kernel functions were tested in the experiments: SVM with linear kernel, SVM with polynomial kernel, SVM with Radial Basis Function (RBF) kernel and SVM with sigmoid kernel. The results achieved in these experiments are shown in Table 3. We could see the ACC, MCC, and AUC of the SVM classifier with RBF kernel outperformed all other classifiers. Therefore, in this study, we choose the SVM classifier of the RBF kernel.
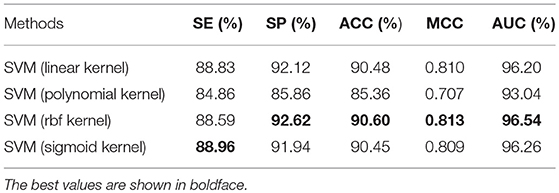
Table 3. Comparison of performance of different kernel functions on the benchmark dataset S1 (Jackknife test evaluation).
Performance on Balanced Dataset
We compared the ACC, SE, SP, MCC, and AUC achieved on the benchmark dataset S1 and S2 by our predictor with the following methods: iMiRNA-SSF (Chen et al., 2016), miRNAPre (Wei et al., 2014), Triplet-SVM (Xue et al., 2005), iMcRNA-PseSSC (Liu et al., 2015b), and iMiRNA-PseDPC (Liu et al., 2016), and A brief introduction to these methods is shown in Table 4. As can be seen from Table 4, both the iMcRNA-PseSSC (Liu et al., 2015b) and iMiRNA-PseDPC (Liu et al., 2016) methods require parameters, and the iMiRNA-PseDPC (Liu et al., 2016) method features the largest dimension.
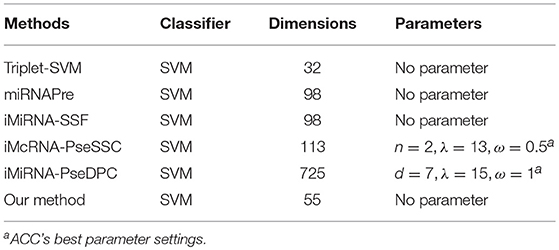
Table 4. A brief introduction to the state-of-the-art predictors.
The performance of different methods on the benchmark datasets S1 and S2 via the jackknife test, as showed in Tables 5, 6, respectively. For a fair comparison, the performances of these methods were taken from other studies with best tuned parameters (Liu et al., 2015b, 2016). Table 5 shows that our method significantly outperforms previous methods in all evaluation metrics used. Among the evaluated methods, our method achieves the best predictive performance on four metrics: AUC (96.54%), ACC (90.60%), MCC (0.813), and SP (92.62%). The respective ACC and MCC of our method are 1.51% and 0.051 higher than those of the previously known best-performing predictor iMiRNA-SSF (Chen et al., 2016) (ACC = 88.09% and MCC = 0.762). The AUC of our method is 1.57% higher than those of the previously known best-performing predictor iMiRNA-PseDPC (Liu et al., 2016) (AUC = 94.97%). In addition, We have incorporated the new negative samples from Wei's study (Wei et al., 2014) to construct a new benchmark dataset S2, and compared the prediction performance of our method together with 5 other popular methods using the Jackknife test (see Table 6). As can be seen, our method achieves the best predictive performance on 4 (out of 5) metrics including AUC (95.04%), ACC (88.00%), MCC (0.760), and specificity (88.71%), and is slightly worse than iMiRNA-PseDPC in sensitivity.
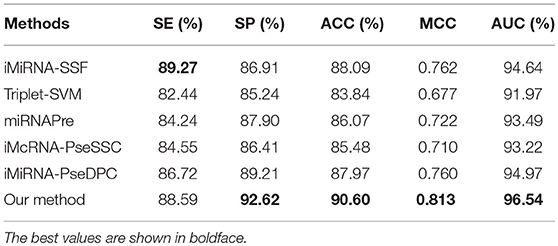
Table 5. Results of the proposed method and state-of-the-art predictors on benchmark dataset S1 (Jackknife test evaluation).
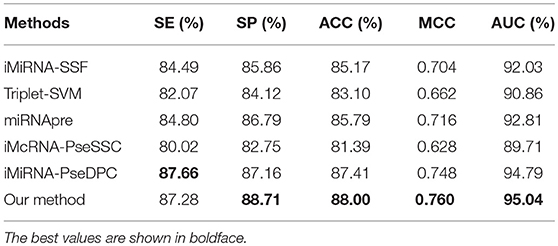
Table 6. Results of the proposed method and state-of-the-art predictors on benchmark dataset S2 (Jackknife test evaluation).
To further compare the performance of our method with other methods on independent testing, we chose the S1 dataset as the training set and the S3 dataset as the test set. Table 7 shows that our method outperforms all other methods in the independent test with an ACC of 70.45% and MCC of 0.412. The iMiRNA-PseDPC (Liu et al., 2016) method has an AUC value of 81.69%, which is the best AUC value in all methods. The AUC of our method (AUC = 75.54%) is comparable to the AUC of the iMcRNA-PseSSC (Liu et al., 2015b) method (AUC = 75.81%). The dimensions of iMiRNA-PseDPC are as high as 725 dimensions, far exceeding the 55-dimensional of our method, and the time overhead of our method is less than iMiRNA-PseDPC.
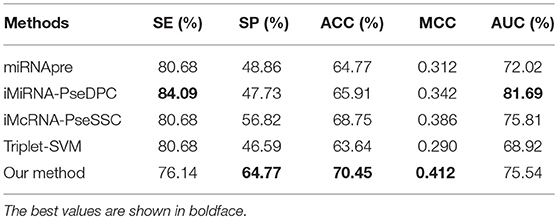
Table 7. Comparing the proposed method with other state-of-the-art predictors on an independent dataset S3.
Performance on Imbalanced Dataset
We then tested our method on S4 and S5 together with the other 4 State-of-the-Arts methods including miRNAPre (Wei et al., 2014), Triplet-SVM (Xue et al., 2005), iMcRNA-PseSSC (Liu et al., 2015b), and iMiRNA-PseDPC (Liu et al., 2016). The performance was evaluated using the 5-fold cross validation and the results were summarized in Table 8. As can be seen, our method performed the best for all 3 evaluation metrics including AUC (0.9589), F1score (0.7813), and AUPR (0.8525), respectively on the dataset S5. As for the dataset S4, our method ranks the first on F1score (with a value 0.7084) and second on AUC and AUPR. For a better view, we also plotted the AUC curves and AUPR curves of our method on S4 and S5 for all 5-folds, respectively in Figures 5, 6.
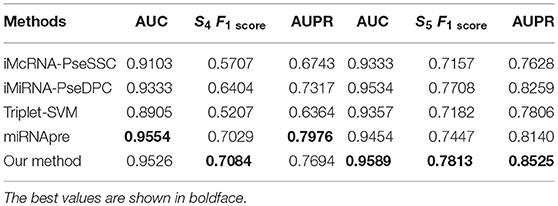
Table 8. Five-fold cross-validation prediction performance of the proposed method and 4 state-of-the-art predictors on imbalanced benchmark dataset S4 and S5.
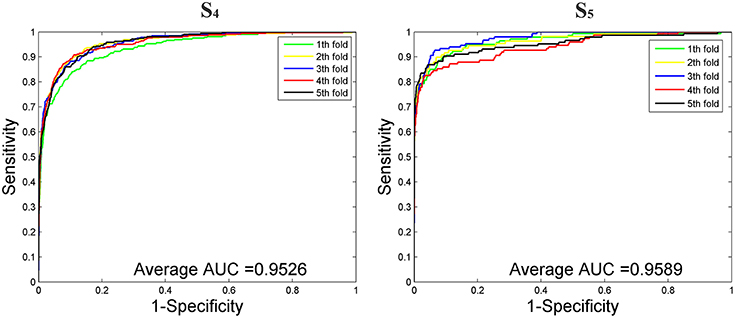
Figure 5. The AUROC curves of our method on the imbalanced benchmark dataset S4 and S5 via 5-fold cross validation.
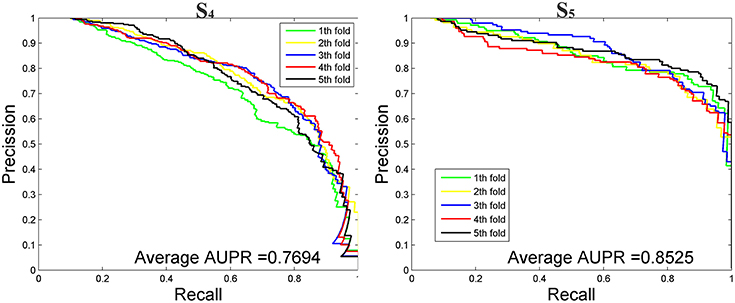
Figure 6. The AUPR curves of our method on the imbalanced benchmark dataset S4 and S5 via 5-fold cross validation.
Performance on Other Species
We then compared our method with 4 state-of-the-arts methods on the benchmark dataset S6 through the jackknife test. Table 9 shows that our method outperforms all other methods in the independent test with an ACC of 92.59%, MCC of 0.852, and AUC of 98.07%. The experimental results show that our method also has good performance on other species.
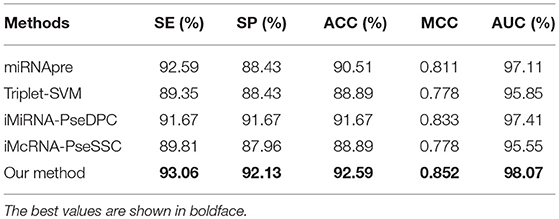
Table 9. Comparing the proposed method and state-of-the-art predictors on the benchmark dataset S6 (using the Jackknife test).
Case Study
Sometimes, the lower version of miRBase database (e.g., miRBase 20) may contain some false-positive pre-miRNAs, which will be excluded in a later version (e.g., miRBase 22). Usually, they are saved in the file “miRNA.dead.” Obviously, if we used miRBase 20 as a bench-mark data, a good method should predict the false-positive pre-miRNAs to be negative (i.e., not to be pre-miRNAs). Fortunately, it is the case for our method and we listed the 8 predicted false-positive pre-miRNAs in Table 10, in which the column names “ID” and “Accession” indicate the Id number and the Accession number of the pre-miRNA sequences in miRbase 22, respectively.
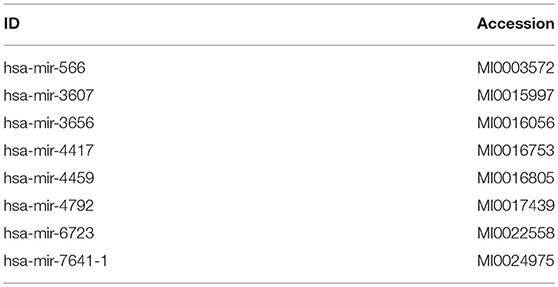
Table 10. False-positive pre-miRNAs predicted to be negative by our method.
Running Time
In this study, we used the SVM model to predict pre-miRNAs. The time complexity of training our SVM model is (Burges, 1998). Where l is the number of training points, NS is the number of support vectors (SVs), and d is the dimension of the input data.
To further evaluate the performance of our method and other competitors, we tested the running time on S6 datasets on the same platform. The experiments were carried out on a computer with Intel(R) Xeon(R) CPU E5-2650 0@2.00GHz 2.00GHz, 16GB memory and Windows OS. Detailed results of running time were shown in Table 11. Our method achieves the better performance of running time, and obtains a good performance of accuracy.
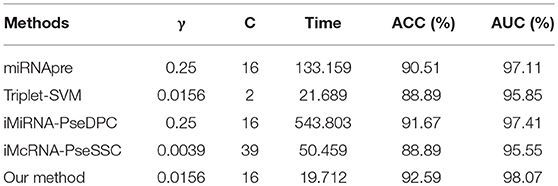
Table 11. The running time (in seconds) of different methods on benchmark dataset S6 using the Jackknife test, where C and γ represent the penalty coefficient of the SVM model and the parameters of the RBF function, respectively.
Conclusions
Pre-miRNA prediction is one of the hot topics in the field of miRNA research (Yue et al., 2014; Cheng et al., 2015; Liao et al., 2015a; Luo et al., 2017, 2018; Peng et al., 2017, 2018; Xiao et al., 2017; Fu et al., 2018). In recent years, machine learning-based miRNA precursor prediction methods have made great progress. Most of the existing prediction methods are based on the global feature extraction feature of the sequence, ignoring the influence of the sequence base characters, and the pre-miRNA structure information does not consider the local characteristics. For this reason, this paper performs mutual information calculation on the pre-miRNA sequence and the secondary structure, respectively, to extract the pre-miRNA sequence and the local features of the secondary structure. Then, the extracted features are input to a support vector machine classifier for prediction.
Finally, the experimental results show that: compared with the existing methods, the proposed method improves the sensitivity and specificity of pre-miRNA prediction. In addition, since the feature space of our method is only 55, less than that of most state-of-the-art methods, our feature construction is also efficient when plugging into canonical classification methods such as SVM. In summary, our method can extract effective features of pre-miRNAs and predicts reliable candidate pre-miRNAs for further experimental validation.
Author Contributions
XF, JY, YC, BL, and LC conceived the concept of the work. XF, WZ, and LP performed the experiments. XF and JY wrote the paper.
Funding
This study is supported by the Program for National Nature Science Foundation of China (Grant Nos. 61863010,61873076,61370171, 61300128, 61472127, 61572178, 61672214, and 61772192), and the Natural Science Foundation of Hunan, China (Grant Nos. 2018JJ2461, 2018JJ3570).
Conflict of Interest Statement
The authors declare that the research was conducted in the absence of any commercial or financial relationships that could be construed as a potential conflict of interest.
References
Agarwal, S., Vaz, C., Bhattacharya, A., and Srinivasan, A. (2010). Prediction of novel precursor miRNAs using a context-sensitive hidden Markov model (CSHMM). BMC Bioinformatics 11(Suppl.1):S29. doi: 10.1186/1471-2105-11-S1-S29
Batuwita, R., and Palade, V. (2009). microPred: effective classification of pre-miRNAs for human miRNA gene prediction. Bioinformatics 25, 989–995. doi: 10.1093/bioinformatics/btp107
Bauer, M., Schuster, S. M., and Sayood, K. (2008). The average mutual information profile as a genomic signature. BMC Bioinformatics 9:48. doi: 10.1186/1471-2105-9-48
Bentwich, I. (2005). Prediction and validation of microRNAs and their targets. FEBS Lett. 579, 5904–5910. doi: 10.1016/j.febslet.2005.09.040
Bonnet, E., Wuyts, J., Rouz,é, P., and Van, Y. D. P. (2004). Evidence that microRNA precursors, unlike other non-coding RNAs, have lower folding free energies than random sequences. Bioinformatics 20, 2911–2917. doi: 10.1093/bioinformatics/bth374
Burges, C. J. C. (1998). A tutorial on support vector machines for pattern recognition. Data Mining Knowl. Disc. 2, 121–167. doi: 10.1023/a:1009715923555
Chen, J., Wang, X., and Liu, B. (2016). iMiRNA-SSF: improving the identification of microRNA Precursors by combining negative sets with different distributions. Sci. Rep. 6:19062. doi: 10.1038/srep19062
Cheng, L., Yue, L., Jiawei, L., and Zhaolei, Z. (2015). A novel motif-discovery algorithm to identify co-regulatory motifs in large transcription factor and microRNA co-regulatory networks in human. Bioinformatics 31, 2348–2355. doi: 10.1093/bioinformatics/btv159
Chou, K. C., and Shen, H. B. (2007). Recent progress in protein subcellular location prediction. Anal. Biochem. 370, 1–16. doi: 10.1016/j.ab.2007.07.006
Date, S. V., and Marcotte, E. M. (2003). Discovery of uncharacterized cellular systems by genome-wide analysisof functional linkages. Nat. Biotechnol. 21, 1055–1062. doi: 10.1038/nbt861
Deng, H., Runger, G., and Tuv, E. (2011). “Bias of importance measures for multi-valued attributes and solutions,” in International Conference on Artificial Neural Networks (Berlin Heidelberg: Springer), 293–300.
Ding, Y., Tang, J., and Guo, F. (2017). Identification of drug-target interactions via multiple information integration. Inform. Sci. 418, 546–560. doi: 10.1016/j.ins.2017.08.045
Fu, X., Liao, B., Zhu, W., and Cai, L. (2018). New 3D graphical representation for RNA structure analysis and its application in the pre-miRNA identification of plants. RSC Adv. 8, 30833–30841. doi: 10.1039/C8RA04138E
Gudyś, A., Szcześniak, M. W., Sikora, M., and Makałowska, I. (2013). HuntMi: an efficient and taxon-specific approach in pre-miRNA identification. BMC Bioinformatics 14:83. doi: 10.1186/1471-2105-14-83
Helvik, S. A., Snøve, O. Jr., and Saetrom, P. (2007). Reliable prediction of Drosha processing sites improves microRNA gene prediction. Bioinformatics 23, 142–149. doi: 10.1093/bioinformatics/btl570
Hofacker, I. L. (2003). Vienna RNA secondary structure server. Nucleic Acids Res. 31:3429. doi: 10.1093/nar/gkg599
Huang, T. H., Fan, B., Rothschild, M. F., Hu, Z. L., Li, K., and Zhao, S. H. (2007). MiRFinder: an improved approach and software implementation for genome-wide fast microRNA precursor scans. Bmc Bioinformatics 8:341. doi: 10.1186/1471-2105-8-341
Jiang, P., Wu, H., Wang, W., Ma, W., Sun, X., and Lu, Z. (2007). MiPred: classification of real and pseudo microRNA precursors using random forest prediction model with combined features. Nucleic Acids Res. 35:W339–W344. doi: 10.1093/nar/gkm368
Kandaswamy, K. K., Chou, K. C., Martinetz, T., Möller, S., Suganthan, P. N., Sridharan, S., et al. (2011). AFP-Pred: A random forest approach for predicting antifreeze proteins from sequence-derived properties. J. Theor. Biol. 270, 56–62. doi: 10.1016/j.jtbi.2010.10.037
Khan, A., Shah, S., Wahid, F., Khan, F. G., and Jabeen, S. (2017). Identification of microRNA precursors using reduced and hybrid features. Mol. Biosyst. 13, 1640–1645. doi: 10.1039/C7MB00115K
Kozomara, A., and Griffithsjones, S. (2011). miRBase: integrating microRNA annotation and deep-sequencing data. Nucleic Acids Res. 39, D152–D157. doi: 10.1093/nar/gkq1027
Lei, J., and Sun, Y. (2014). miR-PREFeR: an accurate, fast and easy-to-use plant miRNA prediction tool using small RNA-Seq data. Bioinformatics 30, 2837–2839. doi: 10.1093/bioinformatics/btu380
Li, L., Xu, J., Yang, D., Tan, X., and Wang, H. (2010). Computational approaches for microRNA studies: a review. Mamm. Genome 21, 1–12. doi: 10.1007/s00335-009-9241-2
Li, W., and Godzik, A. (2006). Cd-hit: a fast program for clustering and comparing large sets of protein or nucleotide sequences. Bioinformatics 22, 1658–1659. doi: 10.1093/bioinformatics/btl158
Li, X., Liao, B., Cai, L., Cao, Z., and Zhu, W. (2013). Informative SNPs selection based on two-locus and multilocus linkage disequilibrium: criteria of max-correlation and min-redundancy. IEEE/ACM Trans. Comput. Biol. Bioinform. 10, 688–695. doi: 10.1109/TCBB.2013.61
Liao, B., Ding, S., Chen, H., Li, Z., and Cai, L. (2015a). Identifying human microRNA–disease associations by a new diffusion-based method. J. Bioinform. Comput. Biol. 13:1550014. doi: 10.1142/S0219720015500146
Liao, B., Jiang, Y., Liang, W., Peng, L., Peng, L., Hanyurwimfura, D., et al. (2015b). On efficient feature ranking methods for high-throughput data analysis. IEEE/ACM Trans. Comput. Biol. Bioinform. 12, 1374–1384. doi: 10.1109/TCBB.2015.2415790
Liao, B., Jiang, Y., Liang, W., Zhu, W., Cai, L., and Cao, Z. (2014). Gene selection using locality sensitive laplacian score. Comput. Biol. Bioinform. IEEE/ACM Trans. 11, 1146–1156. doi: 10.1109/TCBB.2014.2328334
Lin, W. Z., Fang, J. A., Xiao, X., and Chou, K. C. (2011). iDNA-prot: identification of DNA binding proteins using random forest with grey model. PLoS ONE 6:e24756. doi: 10.1371/journal.pone.0024756
Liu, B., Fang, L., Chen, J., Liu, F., and Wang, X. (2015a). miRNA-dis: microRNA precursor identification based on distance structure status pairs. Mol. Biosyst. 11, 1194–1204. doi: 10.1039/C5MB00050E
Liu, B., Fang, L., Liu, F., Wang, X., Chen, J., and Chou, K. C. (2015b). Identification of real microRNA precursors with a pseudo structure status composition approach. PLoS ONE 10:e0121501. doi: 10.1371/journal.pone.0121501
Liu, B., Fang, L., Liu, F., Wang, X., and Chou, K. C. (2016). iMiRNA-PseDPC: microRNA precursor identification with a pseudo distance-pair composition approach. J. Biomol. Struct. Dyn. 34, 1–28. doi: 10.1080/07391102.2015.1014422
Liu, B., Fang, L., Wang, S., Wang, X., Li, H., and Chou, K. C. (2015c). Identification of microRNA precursor with the degenerate K-tuple or Kmer strategy. J. Theor. Biol. 385, 153–159. doi: 10.1016/j.jtbi.2015.08.025
Liu, B., Liu, F., Wang, X., Chen, J., Fang, L., and Chou, K. C. (2015d). Pse-in-One: a web server for generating various modes of pseudo components of DNA, RNA, and protein sequences. Nucleic Acids Res. 43, W65–W71. doi: 10.1093/nar/gkv458
Liu, H., and Wong, L. (2003). Data mining tools for biological sequences. J. Bioinform. Comput. Biol. 1, 139–167. doi: 10.1142/S0219720003000216
Lopes, I. D. O., Schliep, A., and Carvalho, A. C. D. L. D. (2014). The discriminant power of RNA features for pre-miRNA recognition. BMC Bioinformatics 15:124. doi: 10.1186/1471-2105-15-124
Lopes, I. D. O. N., Schliep, A., and de Carvalho, A. P. D. L. F. (2016). Automatic learning of pre-miRNAs from different species. BMC Bioinformatics 17:224. doi: 10.1186/s12859-016-1036-3
Luo, J., Ding, P., Liang, C., and Chen, X. (2018). Semi-supervised prediction of human miRNA-disease association based on graph regularization framework in heterogeneous networks. Neurocomputing 294, 29–38. doi: 10.1016/j.neucom.2018.03.003
Luo, J., Xiang, G., and Pan, C. (2017). Discovery of microRNAs and transcription factors co-regulatory modules by integrating multiple types of genomic data. IEEE Trans. Nanobiosci. 16, 51–59. doi: 10.1109/TNB.2017.2649560
Markus, B., and Carsten, W. (2007). Ab initio identification of human microRNAs based on structure motifs. Bmc Bioinformatics 8:478. doi: 10.1186/1471-2105-8-478
Mathelier, A., and Carbone, A. (2010). MIReNA: finding microRNAs with high accuracy and no learning at genome scale and from deep sequencing data. Bioinformatics 26, 2226–2234. doi: 10.1093/bioinformatics/btq329
Mathews, D. H., Sabina, J., Zuker, M., and Turner, D. H. (1999). Expanded sequence dependence of thermodynamic parameters improves prediction of RNA secondary structure. J. Mol. Biol. 288, 911–940. doi: 10.1006/jmbi.1999.2700
Nigatu, D., Sobetzko, P., Yousef, M., and Henkel, W. (2017). Sequence-based information-theoretic features for gene essentiality prediction. BMC Bioinformatics 18:473. doi: 10.1186/s12859-017-1884-5
Peng, L., Liao, B., Zhu, W., and Li, K. (2017). Predicting drug-target interactions with multi-information fusion. IEEE J. Biomed. Health Inform. 21, 561–572. doi: 10.1109/JBHI.2015.2513200
Peng, L., Peng, M., Liao, B., Huang, G., Li, W., and Xie, D. (2018). The advances and challenges of deep learning application in biological big data processing. Curr. Bioinform. 13, 352–359. doi: 10.2174/1574893612666170707095707
Pritchard, C. C., Cheng, H. H., and Tewari, M. (2012). MicroRNA profiling: approaches and considerations. Nat. Rev. Genet. 13, 358–369. doi: 10.1038/nrg3198
Ren, S., Liao, B., Zhu, W., Li, Z., Liu, W., and Li, K. (2018). The Gradual Resampling Ensemble for mining imbalanced data streams with concept drift. Neuro Comput. 286, 150–166. doi: 10.1016/j.neucom.2018.01.063
Saçar Demirci, M. D., and Allmer, J. (2017). Delineating the impact of machine learning elements in pre-microRNA detection. PeerJ 5:e3131. doi: 10.7717/peerj.3131
Stegmayer, G., Yones, C., Kamenetzky, L., and Milone, D. H. (2016). High class-imbalance in pre-miRNA prediction: a novel approach based on deepSOM. IEEE/ACM Trans. Comput. Biol. Bioinform. 14, 1316–1326. doi: 10.1109/TCBB.2016.2576459
Uǧuz, H. (2011). A two-stage feature selection method for text categorization by using information gain, principal component analysis and genetic algorithm. Knowl. Based Syst. 24, 1024–1032. doi: 10.1016/j.knosys.2011.04.014
Wang, X., Laurie, J. D., Liu, T., Wentz, J., and Liu, X. S. (2011). Computational dissection of Arabidopsis smRNAome leads to discovery of novel microRNAs and short interfering RNAs associated with transcription start sites. Genomics 97, 235–243. doi: 10.1016/j.ygeno.2011.01.006
Wang, Y., Chen, X., Jiang, W., Li, L., Li, W., Yang, L., et al. (2011). Predicting human microRNA precursors based on an optimized feature subset generated by GA–SVM. Genomics 98, 73–78. doi: 10.1016/j.ygeno.2011.04.011
Wei, L., Liao, M., Gao, Y., Ji, R., He, Z., and Zou, Q. (2014). Improved and promising identification of human MicroRNAs by incorporating a high-quality negative set. IEEE/ACM Trans. Comput. Biol. Bioinform. 11, 192–201. doi: 10.1109/TCBB.2013.146
Wei, L., Tang, J., and Zou, Q. (2016). Local-DPP: an improved DNA-binding protein prediction method by exploring local evolutionary information. Inform. Sci. 135–144. doi: 10.1016/j.ins.2016.06.026
Wei, L., Tang, J., and Zou, Q. (2017). SkipCPP-Pred: an improved and promising sequence-based predictor for predicting cell-penetrating peptides. BMC Genomics 18(Suppl. 7):742. doi: 10.1186/s12864-017-4128-1
Xiao, Q., Luo, J., Liang, C., Cai, J., and Ding, P. (2017). A graph regularized non-negative matrix factorization method for identifying microRNA-disease associations. Bioinformatics 34, 239–248. doi: 10.1093/bioinformatics/btx545
Xue, C., Li, F., He, T., Liu, G. P., Li, Y., and Zhang, X. (2005). Classification of real and pseudo microRNA precursors using local structure-sequence features and support vector machine. BMC Bioinformatics 6:310. doi: 10.1186/1471-2105-6-310
Yousef, M., Khalifa, W., Acar, İ. E., and Allmer, J. (2017). MicroRNA categorization using sequence motifs and k-mers. BMC Bioinformatics 18:170. doi: 10.1186/s12859-017-1584-1
Yousef, M., Nebozhyn, M., Shatkay, H., Kanterakis, S., Showe, L. C., and Showe, M. K. (2006). Combining multi-species genomic data for microRNA identification using a Naïve Bayes classifier. Bioinformatics 22, 1325–1334. doi: 10.1093/bioinformatics/btl094
Yue, L., Cheng, L., Ka-Chun, W., Jiawei, L., and Zhaolei, Z. (2014). Mirsynergy: detecting synergistic miRNA regulatory modules by overlapping neighbourhood expansion. Bioinformatics 30, 2627–2635. doi: 10.1093/bioinformatics/btu373
Zhang, B., Pan, X., Cobb, G. P., and Anderson, T. A. (2006). Plant microRNA: a small regulatory molecule with big impact. Dev. Biol. 289, 3–16. doi: 10.1016/j.ydbio.2005.10.036
Zhang, W., and Wang, S. (2017). An integrated framework for identifying mutated driver pathway and cancer progression. IEEE/ACM Trans. Comput. Biol. Bioinform. 1:1.
Zhang, W., and Wang, S.-L. (2018). An efficient strategy for identifying cancer-related key genes based on graph entropy. Comput. Biol. Chem. 74, 142–148. doi: 10.1016/j.compbiolchem.2018.03.022
Zhang, Y., Kim, M. S., Jia, B., Yan, J., Zuniga-Hertz, J. P., Han, C., et al. (2017). Hypothalamic stem cells control ageing speed partly through exosomal miRNAs. Nature 548, 52–57. doi: 10.1038/nature23282
Keywords: pre-miRNAs identification, feature representation algorithm, mutual information, structure analysis, support vector machine
Citation: Fu X, Zhu W, Cai L, Liao B, Peng L, Chen Y and Yang J (2019) Improved Pre-miRNAs Identification Through Mutual Information of Pre-miRNA Sequences and Structures. Front. Genet. 10:119. doi: 10.3389/fgene.2019.00119
Received: 15 October 2018; Accepted: 04 February 2019;
Published: 25 February 2019.
Edited by:
Quan Zou, University of Electronic Science and Technology of China, ChinaReviewed by:
Leyi Wei, Tianjin University, ChinaAkshay Kakumanu, Fulcrum Therapeutics, United States
Mahashweta Basu, United States Food and Drug Administration, United States
Copyright © 2019 Fu, Zhu, Cai, Liao, Peng, Chen and Yang. This is an open-access article distributed under the terms of the Creative Commons Attribution License (CC BY). The use, distribution or reproduction in other forums is permitted, provided the original author(s) and the copyright owner(s) are credited and that the original publication in this journal is cited, in accordance with accepted academic practice. No use, distribution or reproduction is permitted which does not comply with these terms.
*Correspondence: Lijun Cai, ljcai@hnu.edu.cn
Bo Liao, dragonbw@163.com
Jialiang Yang, jialiang.yang@mssm.edu