 Ping Xuan
 Yangkun Cao1
- 1School of Computer Science and Technology, Heilongjiang University, Harbin, China
- 2School of Mathematical Science, Heilongjiang University, Harbin, China
- 3Department of Pancreatic and Biliary Surgery, The First Affiliated Hospital of Harbin Medical University, Harbin, China
A lot of studies indicated that aberrant expression of long non-coding RNA genes (lncRNAs) is closely related to human diseases. Identifying disease-related lncRNAs (disease lncRNAs) is critical for understanding the pathogenesis and etiology of diseases. Most of the previous methods focus on prioritizing the potential disease lncRNAs based on shallow learning methods. The methods fail to extract the deep and complex feature representations of lncRNA-disease associations. Furthermore, nearly all the methods ignore the discriminative contributions of the similarity, association, and interaction relationships among lncRNAs, disease, and miRNAs for the association prediction. A dual convolutional neural networks with attention mechanisms based method is presented for predicting the candidate disease lncRNAs, and it is referred to as CNNLDA. CNNLDA deeply integrates the multiple source data like the lncRNA similarities, the disease similarities, the lncRNA-disease associations, the lncRNA-miRNA interactions, and the miRNA-disease associations. The diverse biological premises about lncRNAs, miRNAs, and diseases are combined to construct the feature matrix from the biological perspectives. A novel framework based on the dual convolutional neural networks is developed to learn the global and attention representations of the lncRNA-disease associations. The left part of the framework exploits the various information contained by the feature matrix to learn the global representation of lncRNA-disease associations. The different connection relationships among the lncRNA, miRNA, and disease nodes and the different features of these nodes have the discriminative contributions for the association prediction. Hence we present the attention mechanisms from the relationship level and the feature level respectively, and the right part of the framework learns the attention representation of associations. The experimental results based on the cross validation indicate that CNNLDA yields superior performance than several state-of-the-art methods. Case studies on stomach cancer, lung cancer, and colon cancer further demonstrate CNNLDA's ability to discover the potential disease lncRNAs.
Introduction
Long non-coding RNA genes (lncRNAs) are transcripts longer than 200 nucleotides which are not translated into proteins (Reik, 2009). Accumulating evidences have indicated that lncRNAs play crucial roles in the metastasis and progression of various diseases (Prensner and Chinnaiyan, 2011; Schmitt and Chang, 2016; Hu et al., 2018). Therefore, identifying the associations between lncRNAs and diseases is important for understanding the functions of lncRNAs in the disease processes.
Predicting disease-related lncRNAs (disease lncRNAs) can screen the potential candidates for the biologists to discover the real lncRNA-disease associations with the wet-lab experiments (Chen et al., 2016a). Existing methods have been presented for prioritizing the candidate disease lncRNAs, which fall into three main categories. Methods in the first category utilize the biological information related to lncRNAs, such as the genome locations, tissue specificity and expression profile. Chen et al. and Li et al. predicted disease lncRNAs by exploiting the locations of lncRNAs and genes in the genome (Chen et al., 2013; Li et al., 2014a). However, the methods are not effective on the lncRNAs which have no adjacent genes. Liu et al. and Chen predicted the potential associations by using the lncRNA tissue specificity or lncRNA expression profile (Liu et al., 2014; Chen, 2015). The methods suffered from the limited information of tissue-specific expressions and low expression levels of lncRNAs.
Methods in the second category construct the prediction models based on machine learning for inferring the lncRNA-disease associations. A semi-supervised learning based method was proposed to predict the potential associations (Chen and Yan, 2013). On the basis of this study, Chen et al. and Huang et al. optimized the calculation of the similarities of lncRNAs and diseases (Chen et al., 2015; Huang et al., 2016). However, the methods considered the information of the lncRNA and disease spaces, and did not fuse them completely. Several methods infer the candidate lncRNAs related to a disease by random walk on the lncRNA functional similarity network or heterogeneous network composed of lncRNAs, genes and diseases (Sun et al., 2014; Chen et al., 2016b; Gu et al., 2017; Yao et al., 2017). The common and similar neighbors of two diseases (or two lncRNAs) in the lncRNA-disease bipartite network are utilized to infer the association scores between lncRNAs and diseases (Ping et al., 2018). Nevertheless, most of these methods fail to be applied to new diseases without any known related lncRNAs.
The methods in the third category integrate the multiple data sources about the proteins and miRNAs that are interacted with lncRNAs, and the drugs associated with the proteins. Zhang et al. constructed the lncRNA-protein-disease network and obtained the candidate disease lncRNAs by propagating information flow in the heterogeneous network (Zhang et al., 2017). After calculating the various lncRNA and disease similarities, LDAP used the bagging SVM classifier to uncover the potential diseases lncRNAs(Lan et al., 2017). A couple of methods established the matrix factorization based prediction models to fuse the multiple kinds of information related to the lncRNAs, diseases and proteins (Fu et al., 2017; Lu et al., 2018). However, most of the previous methods are the shallow learning methods which cannot learn the deep and complex representations of lncRNA-disease associations.
Deep learning approaches can hold the promise of much better performance (Xu et al., 2017). In our study, we propose a novel method based on dual convolutional neural networks to predict lncRNA-disease associations, which we refer to as CNNLDA. CNNLDA exploits the similarities and associations of lncRNAs and diseases, the interactions between lncRNAs and miRNAs, and the miRNA-disease associations. The feature matrix is firstly constructed based on the biological premises about lncRNAs, miRNAs, and diseases. Combining the biological premise about the cases that two lncRNAs (diseases) should be more similar can capture the relationships between the lncRNA-disease associations and the lncRNA (disease) similarities. Integrating the interactions between lncRNAs and miRNAs, and the miRNA-disease associations can capture the relationships between the lncRNAs and miRNAs interacted with each other and the lncRNA-disease associations. A new framework based on the dual convolutional neural networks is established for extracting both the global and the attention feature representations of lncRNA-disease associations. The left part of the framework is concentrated on extract features from the associations and similarities of lncRNAs and diseases. In the right part of the framework, each of features and each kind of features are assigned to different weights by applying our proposed attention mechanisms, which may discriminate their different contributions for predicting the potential disease lncRNAs. The comprehensive cross-validation experiments confirm that CNNLDA outperforms several state-of-the-art methods for predicting candidate disease lncRNAs. Moreover, case studies on 3 diseases indicate that CNNLDA is able to discover potential association candidates that are supported by the corresponding databases and literature.
Materials and Methods
Datasets for Disease lncRNA Prediction
The lncRNA-disease associations, the lncRNA-miRNA interactions, and the miRNA-disease associations are obtained from the previous work on prediction of the lncRNA-disease associations (Fu et al., 2017). The 2687 lncRNA-disease associations are originally extracted from the databases LncRNADisease (Chen et al., 2013) and Lnc2Cancer (Ning et al., 2016) that contains the experimentally confirmed lncRNA-disease associations, and the database GeneRIF (Lu et al., 2006) that records the lncRNA functional description. The 1002 lncRNA-miRNA interactions are extracted from database starBase (Li et al., 2014b) which includes the interaction information between multiple kinds of RNAs. The disease semantic similarities are obtained from DincRNA (Cheng et al., 2018) that are used by us to calculate the lncRNA similarities based on their associated diseases. The 5218 verified miRNA-disease associations by experiment are obtained from the human miRNA-disease database HMDD (Li et al., 2013). All of these associations and interactions cover 240 lncRNAs, 402 diseases, and 495 miRNAs.
Calculation and Representation of Multiple Kinds of Data
Representation of the lncRNA-Disease Associations and miRNA-Disease Associations
The bipartite graph composed of lncRNAs and diseases is constructed by the known lncRNA-disease associations (Figure 1A). We use matrix to represent the association case between nl lncRNAs and nd diseases, where Aij is 1 if lncRNA li has been observed to be related to disease dj or 0 otherwise. As shown in Figure 1C, the known miRNA-disease associations form the miRNA-disease bipartite graph. Matrix represents the associations between nm miRNAs and nd diseases. Bij is set to 1 means there is observed association between miRNA mi and disease dj, and it is 0 otherwise.
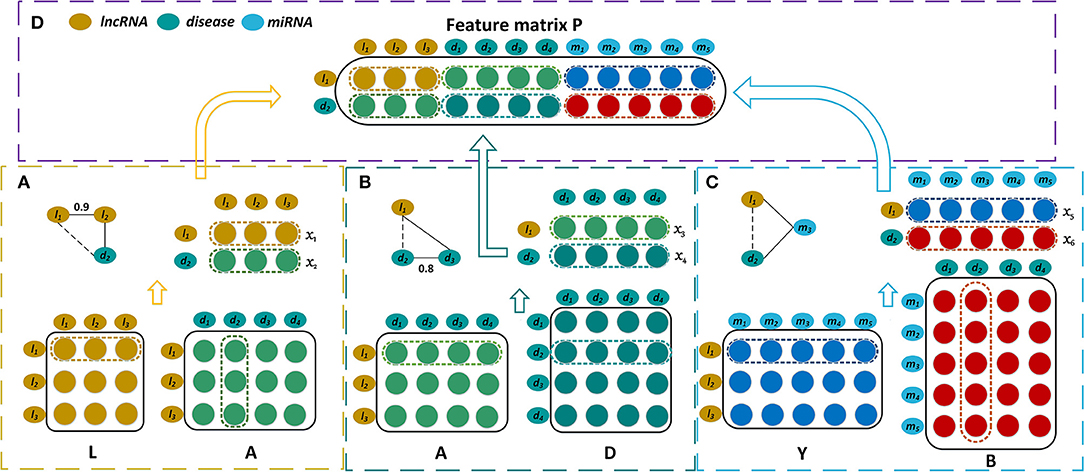
Figure 1. Construction of the feature matrix of lncRNA l1 and disease d2. (A) Construct the first part of feature matrix by integrating the lncRNA similarities and the lncRNA-disease associations. (B) Construct the second part by incorporating the lncRNA-disease associations and the disease similarities. (C) Construct the third part by exploiting the lncRNA-miRNA interactions and the miRNA-disease associations. (D) Concatenate these three parts to form the feature matrix P.
Representation of the Disease Similarities
The more similar that two diseases are, the more likely that they are associated with similar lncRNAs. Hence the disease similarities are integrated by our model for predicting disease-related lncRNAs. A disease can be represented by a directed acyclic graph (DAG) that includes all the disease terms related to the disease. If two diseases have more common disease terms, they are more similar, which is the basic idea for semantic similarity between Gene Ontology terms (Xu et al., 2013b). Wang et al. have successfully measured the similarity of two diseases based on their DAGs (Wang et al., 2010). The disease similarities are calculated by Wang's method, and they are represented by matrix where Dij is the similarity of two diseases di and dj(Figure 1B).
Representation of the lncRNA Similarities
As the lncRNAs associated with the similar diseases are generally possible to have more similar functions, Chen et al. measured the similarity of two lncRNAs based on their associated diseases (Chen et al., 2015), of which similar approaches have been used for miRNA-miRNA network inference (Xu et al., 2013a). The lncRNA similarities that we used are calculated by Chen's method. For instance, the lncRNA la is associated with a group of diseases DTa = {di1, di2, …, dim}, lncRNA lb is associated with a group of diseases DTb = {dj1, dj2, …, djn}. The similarity between DTa and DTb is then calculated as the similarity of la and lb, and it is denoted as LS(la, lb). LS(la, lb) is defined as,
where DS(dai, dbj) is the semantic similarity of disease of dai and dbj which belong to DTa and DTb respectively. m and n are the numbers of diseases that are included by DTa and DTb. The lncRNA similarities are denoted by matrix where Lij is the similarity of two lncRNAs li and lj (Figure 1A).
Representation of the lncRNA-miRNA Interactions
It is well-known that the lncRNAs often interact with the corresponding miRNAs and they are involved in the biological processes synchronously (Yang et al., 2014; Paraskevopoulou and Hatzigeorgiou, 2016). Hence our prediction model also takes the interaction relationships between lncRNAs and miRNAs into account (Figure 1C). The interactions between nl lncRNAs and nm miRNAs are represented by the matrix , and each row of Y corresponds to a lncRNA and each column of Y corresponds to a miRNA. Yij is 1 when lncRNA li interacts with miRNA mj and it is 0 otherwise.
Disease lncRNA Prediction Model Based on Dual CNN
In this section, we describe our prediction model for learning the latent representations of lncRNA-disease associations and predicting the disease-related lncRNAs. The feature matrix is constructed firstly by incorporating the similarities, interactions, and associations about lncRNAs, miRNAs, and diseases (Figure 1). A novel framework is then established based on dual convolutional neural networks with attention mechanisms (Figure 2). The left part of the framework learns the global representation of a lncRNA-disease association, while the right part learns the more informative connection relationships among lncRNAs, miRNAs, and diseases. These two representations are integrated by an additional convolutional and fully connected layer and the possibility that a lncRNA is associated with a disease is obtained as their association score. We take the lncRNA l1 and the disease d2 as an example to describe our model CNNLDA for lncRNA-disease association prediction.
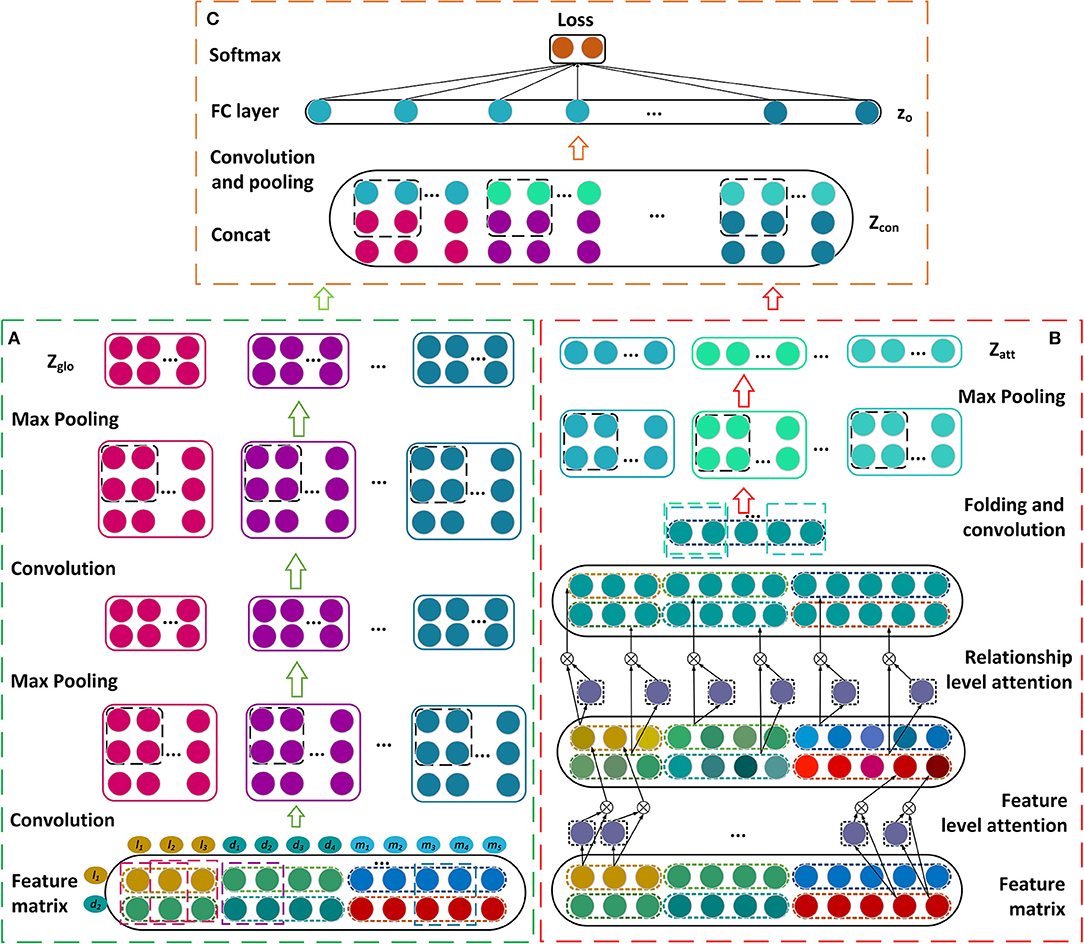
Figure 2. Construction of the framework based on the dual convolutional neural networks for learning the global and attention representations. (A) Construct the convolutional and pooling layers. (B) Establish the attention mechanism at the feature and relationship levels. (C) Construct the final module to estimate the association score.
Construction of Feature Matrix
The feature matrix of the lncRNA l1 and the disease d2 is constructed by combining three biological premises. First, if l1 and d2 have similarity and association relationships with more common lncRNAs, they are more likely associated with each other. For instance, if l1 and l2 have similar functions, and d2 has been observed to be associated with l2, l1 will be possibly associated with d2. Let x1 represent the 1st row of L which contains the similarities between l1 and the various lncRNAs. The 2nd column of D, x2, records the associations between d2 and all the lncRNAs. x1 and x2 are put together to form a matrix whose dimension is 2 × nl (Figure 1A). Second, when l1 and d2 have the association and similarity connections with more common diseases, l1 is more likely to be associated with d2. x3 is the 1st row of A and it records the associations between l1 and all the diseases. x4 is the 2nd row of D and it contains the similarities between d2 and these diseases. x3 and x4 are also combined and they form a matrix with dimension 2 × nd (Figure 1B). Third, there is a possible association between l1 and d2 when they have the interaction and association connections with the common miRNAs. The 1st row of Y, x5, records the interactions between l1 and the various miRNAs, while the 2nd column of B, x6, records the associations between d2 and these miRNAs. x5 and x6 are integrated to form a matrix with dimension 2 × nm (Figure 1C). All of these three matrices are concatenated and then form a feature matrix of lncRNA l1 and disease d2 whose dimension is 2 × (nl + nd + nm) (Figure 1D).
Convolutional Module on the Left
The feature matrix of l1 and d2, P, is input to the convolutional module on the left to learn a global deep representation for l1 and d2. The convolutional module includes two convolutional layers and two pooling layers (Figure 2A), we take the first convolutional layer and the first pooling layer as examples to describe the process of the convolution and the pooling. To learn the marginal information of P, we pad zeros around P and obtain a new matrix named P′.
Convolutional layer
For the first convolutional layer, the length of a filter is set as nf, and its width is nw. If the number of filters is nconv1, the filters are applied to the matrix P′, and get the feature maps . P′(i, j) is the element at the ith row and the jth column of P′, and P′k,i,j represents a region within the filter when the kth filter slides to the position P′(i, j). The formal definitions of P′k,i,j and Zconv1,k are as follows,
where bconv1 is the bias vector, f is a relu function (Nair and Hinton, 2010), and nt = nl + nd + nm. Zconv1,k(i, j) is the element at the ith row and jth column of the kth feature map Zconv1,k.
Pooling layer
We apply the max pooling to extract the robust features from the feature maps Zconv1. ng and np are the length and width of a filter of pooling layer, respectively. The pooling outputs of all the feature maps are Zconvpool1,
where Zconvpool1,k is the kth feature map, and Zconvpool1,k(i, j) is the element at its' ith row and jth column.
Attention Module on the Right
In our model, the attention module are used to learn which features or connection relationships are more informative for the representation of lncRNA l1 and disease d2. Thus, the module consists of the attention mechanism at the feature level and the one at relationship level (Figure 2B).
Attention at the feature level
The features within P usually have different contributions for representations of lncRNA-disease associations. For instance, in terms of a specific disease, the lncRNAs that have been observed to be associated with the disease are often more important than the unobserved ones. In the feature matrix P = {x1, x2, …, xi, …, x6 }, each feature xij of vector xi is assigned an attention weight . is defined as follows,
where HF and are the weight matrices, and bF is a bias vector. is the vector that records the attention scores representing the importance of different features in xi, where ni is the length of xi, is the score of xini. is the normalized attention weight for feature xij. Thus the latent representation of different features may be denoted as yi,
where ⊗ is the element-wise product operator, and the symbol F represents the feature level.
Attention at the relationship level
There are several connection relationships among lncRNAs, diseases, and miRNAs, including the similarities between lncRNAs, the associations between lncRNAs and diseases, the similarities between diseases, the interactions between lncRNAs and miRNAs, and the associations between diseases and miRNAs. Different relationships also have different contributions to the representation of lncRNA-disease associations. Therefore, in relationship level, we use an attention mechanism on each feature vector yi to generate the final attention representation. The attention scores at relationship level are given by,
where is the weight matrix, and bR is a bias vector. hR is a weight vector and represents the score of the ith relationship yi. is the normalized attention weight for relationship yi. The latent representation of association through the attentions at the feature and relationship levels is obtained and represented by
where the symbol R represents the relationship level. Let G be the matrix after g is padding zeros. The attention representations Zatt are obtained by feeding G into a convolutional layer and a maxpooling layer.
Final Module
Let Zglo be the global representation that are learned from the left convolutional module and Zatt be the attention representation that are learned from the right convolutional module. Zglo and Zatt are combined by putting the former on top and putting the later under it, and denoted as Zcon (Figure 2C). Zcon runs through an additional convolutional layer to obtain the final representation Zfin. zo is a vector of flattening Zfin and it is inputted into a fully connected layer Wout and a softmax layer (Bahdanau et al., 2014) to get p
p is an association probability distribution of C classes (C = 2), and it contains the probability that a lncRNA and a disease is determined to have an association relationship and the probability that they have no association.
Loss of Association Prediction
In our model, the cross-entropy loss between the ground truth distribution of lncRNA-disease association and the prediction probability p is defined as ,
where z ∈ ℝ2 is the classification label vector and T is a set of training samples. If l1 is associated with d2, the second dimension of the vector z is 1 and the first one is 0. On the contrary, if l1 is not associated with d2, the first dimension of z is 1 and the second one is 0.
We denote all neural network parameters by θ. The objective function in our learning process is defined as follows,
where λ is a trade-off parameter between the training loss and regularization term. We use Adam optimization algorithm to optimize the objective function (Kingma and Ba, 2015).
Results and Discussion
Parameter Setting
In CNNLDA, 2 × 2 window size is used for all of the convolutional and pooling layers. In the left convolutional module (Figure 2A), the number of filters in the first convolutional layer is 8 and one in the second layer is 16. In the right attention convolutional module (Figure 2B), the number of filters is 16. In the final module (Figure 2C), we set the number of filters to 32. We implement our method using Pytorch to train and optimize the neural networks, and a GPU card (Nvidia GeForce GTX 1080Ti) is utilized to speed up the training process. The training process is terminated when the maximum number of iterations, 80, is reached.
Performance Evaluation Metrics
Five-fold cross-validation is performed to evaluate the performance of CNNLDA and other state-of-the-art methods for predicting lncRNA-disease associations. If a lncRNA ls is associated with a disease dt, we treat the ls-dt node pair as a positive sample. If ls is not observed to associate with dt, it is treated as a negative sample. For each cross validation, we randomly select 80% positive samples and the same number of negative samples as the training data and use the remaining 20% positive samples and all of the negative samples for testing. Note that the association dataset is separated to 5 folds for cross-validation, and we recomputed the lncRNA similarities by using the known associations that are used for training in each cross validation process.
The samples are ranked by their association scores after the association probabilities of the testing samples are estimated. The higher the node pairs of the positive samples are ranked, the better CNNLDA performs. If an observed association exists in lncRNA-disease node pair samples, and its association score is greater than a threshold θ, it is a successfully determined positive sample. If the prediction score of a negative sample is smaller than θ, it is a determined correctly negative sample. We calculate the true positive rates (TPRs) and the false positive rates (FPRs) to get a receiver operating characteristic (ROC) curve by changing threshold θ. TPR and FPR are defined as follows,
where TP is the number of successfully identified positive samples, and FN is the number of misidentified negative samples. TN is the number of correctly identified negative samples, and FP is the number of incorrectly identified positive samples. The global prediction performance of a method is always measured by the area under the ROC curve (AUC) (Karimollah, 2013).
The known lncRNA-disease associations (the positive samples) and the unobserved ones (the negative samples) form the serious imbalance. In such case, we also use the precision-recall (PR) curve and its area (AUPR) to assess the performance of a prediction method (Takaya and Marc, 2015). Precision and recall are defined as follows,
Precision is the rate of the correctly identified positive samples among the samples that are retrieved, and recall is the rate of the correctly identified positive samples among all the positive samples. In terms of 5-fold cross-validation, we use averaging CV to obtain the final performance. Averaging CV means that we obtain a separate performance (AUC or AUPR) for each of the 5 folds when used as a test set, and the 5 performances are averaged to give the final performance.
In addition, the biologists usually select lncRNA candidates from the top part of the ranking list, and then further validate their associations with diseases. Therefore, the recall values of top 30, 60, …, 240, are calculated, and they represent the fraction of the successfully recovered positive samples in the top list k among the total positive samples.
Comparison With Other Methods
To evaluate the performance of CNNLDA, we compare it with several state-of-the-art methods including SIMCLDA (Lu et al., 2018), Ping's method (Ping et al., 2018), MFLDA (Fu et al., 2017) and LDAP (Lan et al., 2017) for lncRNA-disease association prediction. As shown in Figure 3A and Table 1, CNNLDA achieves the highest average AUC on all of the tested 402 diseases (AUC = 0.952). It outperforms SIMCLDA by 20.6%, Ping's method by 8.05%, MFLDA by 32.6% and LDAP by 8.85%. We also list the AUCs of the five methods on 10 well-characterized diseases that are associated with at least 15 lncRNAs (Table 1). CNNLDA yields the best performance for 9 out of 10 diseases. CNNLDA achieves best average performance (AUPR = 0.251) which is 15.6%, 3.19, 18.5, and 8.51% better than SIMCLDA, Ping's method, MFLDA and LDAP respectively (Figure 3B). In addition, CNNLDA achieves the highest AUPRs on 9 out of 10 well-characterized diseases (Table 2). The performance of Ping's method is similar to that of LDAP as they exploit different types of similarities of lncRNAs and diseases. These two methods achieves the second and third best performance respectively. The performance of MFLDA is not as good as the other four methods as it did not exploit the disease similarities and the lncRNA similarities. The improvement of CNNLDA over the compared methods is primarily due to its deeply learning the global and attention representations of lncRNA-disease associations.
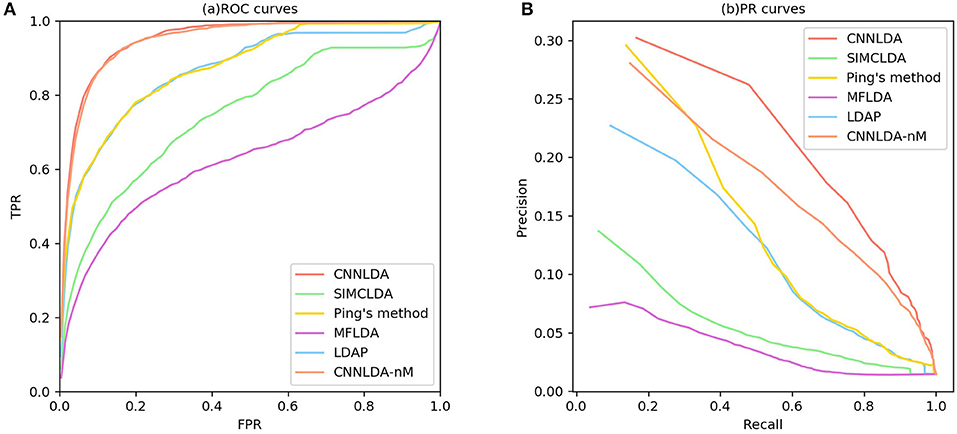
Figure 3. ROC curves and PR curves of CNNLDA and other methods for all the diseases. (A) ROC curves of all the methods. (B) PR curves of all the methods.
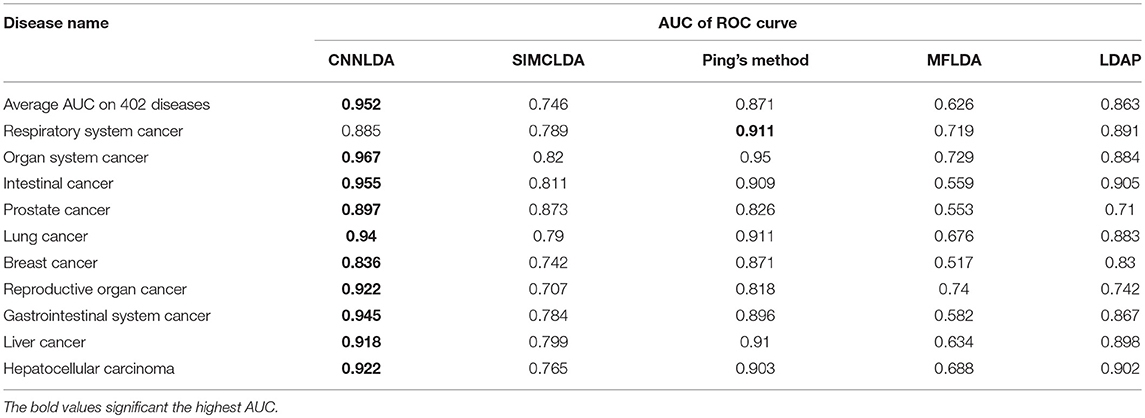
Table 1. AUCs of ROC curves of CNNLDA and other methods for all of the diseases and 10 well-characterized diseases.
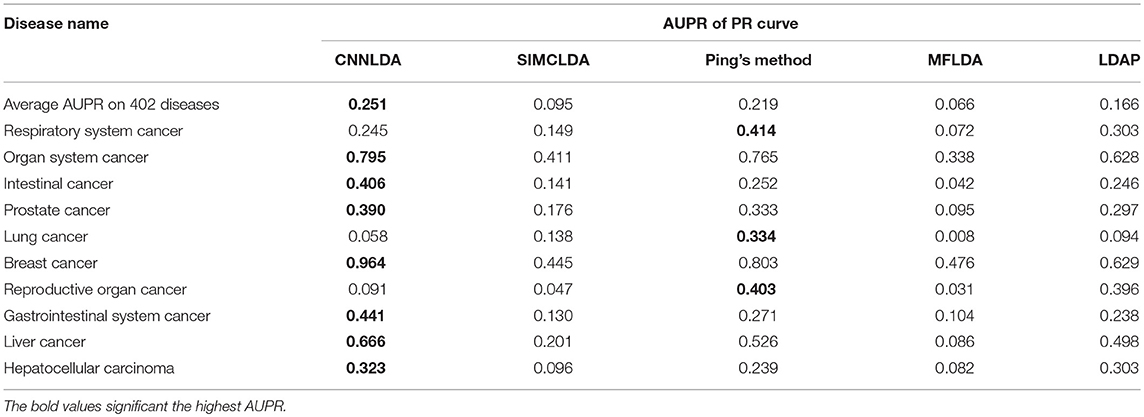
Table 2. AUPRs of PR curves of CNNLDA and other methods for all of the diseases and 10 well-characterized diseases.
We perform a paired Wilcoxon-test to evaluate whether CNNLDA's AUCs and AUPRs across all of the tested diseases are significantly higher than those of another method. CNNLDA achieves significantly higher performance than the other methods in terms of both AUCs and AUPRs as the corresponding P-values are smaller than 0.05 (Table 3).
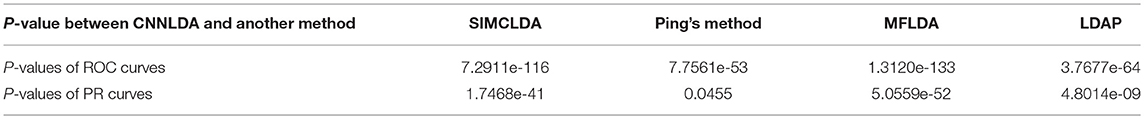
Table 3. A pairwise comparison with a paired Wilcoxon-test on the prediction results in terms of AUCs and AUPRs.
The higher the recall rate on the top k ranked lncRNA-disease associations is, the more genuine associations are determined correctly. Under different k cutoffs, the performance of CNNLDA consistently outperforms other methods (Figure 4), and ranks 89.6% of the positive samples in the top 30, 96.2% in the top 60, and 98.8% in the top 90. Most of the recalls of Ping's method are very close to LDAP, while Ping's method ranks 68.9% in top 30, 81.3% in top 60, 88% in top 90. LDAP ranks 68.5% in top 30, 81.3% in top 60, 88% in top 90. SIMCLDA ranks 49.3% in top 30, 63% in top 60, 74.1% in top 90, which is not as good as Ping's method but better than MFLDA (42%, 53.9% and 61%).
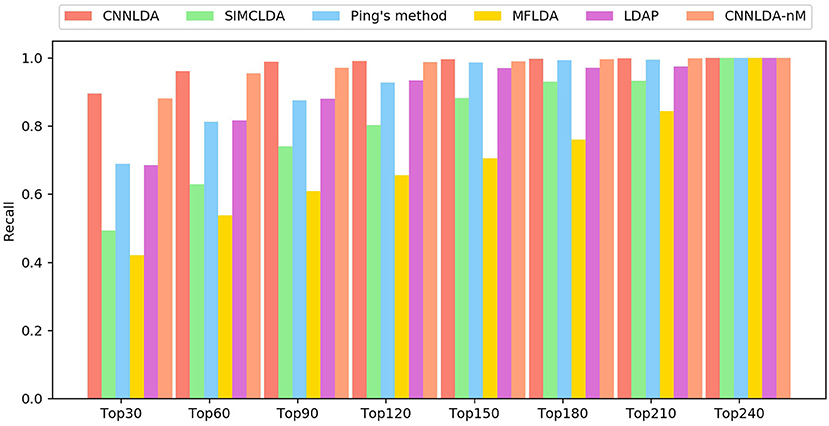
Figure 4. The average recalls across all the tested diseases under different top k cutoffs.
In addition, to validate the effectiveness of exploiting the information related to the miRNAs, we construct another instance of CNNLDA that is trained without this kind of information, and the instance is referred to as CNNLDA-nM. The instance of CNNLDA that is trained by using the miRNA-related information is still named as CNNLDA. CNNLDA's AUC and AUPR are 0.2%and 0.94% greater than CNNLDA-nM, which confirms the importance of integrating the information for improving CNNLDA's prediction performance.
Case Studies: Stomach Cancer, Lung Cancer, and Colon Cancer
To demonstrate CNNLDA's ability to discover potential candidate disease lncRNAs, we execute the case studies on stomach cancer, lung cancer, and colon cancer and analyze the top 15 candidates respectively related to these cancers (Table 4).
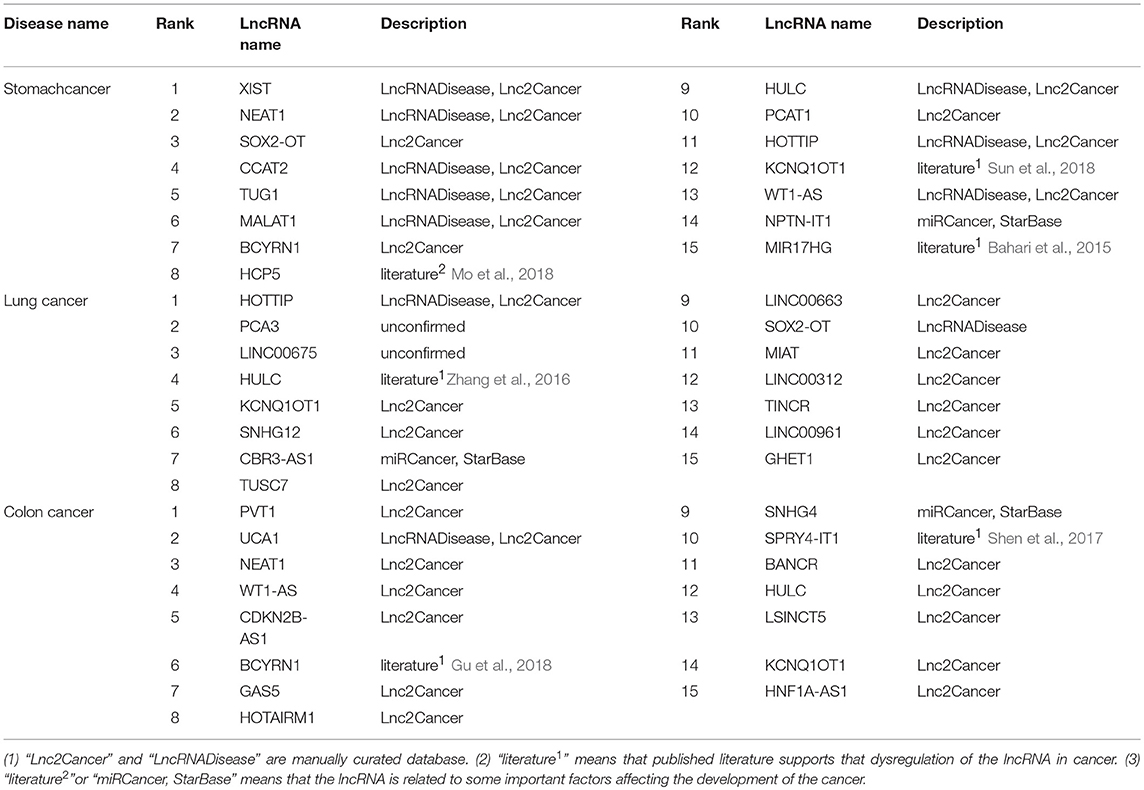
Table 4. The candidate lncRNAs associated with stomach cancer, lung cancer and colon cancer.
First, a database named Lnc2Cancer curates the lncRNAs that have different expression in the disease tissues compared to the normal ones. Lnc2Cancer contains lncRNAs related to cancers that have been identified by analyzing the results of northern blot experiments, microarray experiments, and quantitative real-time polymerase chain reaction experiments (Gao et al., 2018). LncRNADisease is also a database which includes 2,947 lncRNA-disease entries (Chen et al., 2013). By using text mining techniques, these associations are extracted from the published literature, and then the dysregulation of lncRNAs are manually confirmed. As shown in Table 4, 33 candidate lncRNAs are contained by Lnc2Cancer and 13 candidate lncRNAs are included by LncRNADisease, which confirms these lncRNAs have been upregulated or downregulated in these cancers.
Next, 2 candidates of stomach cancer, 1 candidate of lung cancer and 2 candidates of colon cancer labeled with “literature1” are supported by several published literature. These lncRNAs are confirmed to have dysregulations in the cancers when compared with the normal tissues (Bahari et al., 2015; Zhang et al., 2016; Shen et al., 2017; Gu et al., 2018; Sun et al., 2018).
Finally, 5 candidates labeled with “literature2,” and “miRCancer, StarBase” are related to the important factors affecting the development of the corresponding cancers. In the metabolic network, lncRNA HCP5 is regulated by three miRNAs, and the miRNAs are downregulated in stomach cancer. It indicates that the expression of HCP5 is more likely to associate with stomach cancer (Mo et al., 2018). Four lncRNAs (CBR3-AS1, NPTN-IT1, CDKN2B-AS1 and SNHG4) have interactions with four corresponding miRNAs (hsa-miR-217, hsa-miR-520c-3p, hsa-miR-320a and hsa-miR-4458) (Li et al., 2014b). These four miRNAs have been to be observed associated with stomach cancer, lung cancer and colon cancer (Xie et al., 2013). Hence these lncRNAs are probably involved in the progression of these cancers.
Predicting Novel Disease-Related lncRNAs
After evaluating its prediction performance through the cross-validation process and case studies, CNNLDA is applied to all 402 diseases. All the positive samples and the negative ones are used to train CNNLDA to predict the novel disease-associated lncRNAs. The potential candidate lncRNAs for these diseases are listed in Supplementary Table 1. In addition, the lncRNA similarities based on the diseases associated with these lncRNAs are shown in Supplementary Table 2.
Conclusions
A novel method based on dual convolutional neural networks, CNNLDA, is developed for predicting the potential disease-related lncRNAs. We respectively construct the attention mechanism at feature and relationship levels to discriminate the different contributions of features and learn the more informative representation of lncRNA-disease associations. The new framework based on dual convolutional neural networks is developed for learning the global representation and the attention of lncRNA-disease associations. The experimental results indicate that CNNLDA is superior to the compared other methods in terms of both AUCs and AUPRs. The case studies on 3 diseases demonstrate CNNLDA's ability for discovering potential disease-associated lncRNAs.
Data Availability
All datasets analyzed for this study are cited in the manuscript and the Supplementary Files.
Author Contributions
PX and YC conceived the prediction method, and they wrote the paper. YC and ZZ developed computer programs. TZ and RK analyzed the results and revised the paper.
Funding
The work was supported by the Natural Science Foundation of China (61702296, 61302139), the Heilongjiang Postdoctoral Scientific Research Staring Foundation (LBH-Q18104, LBH-Q16180), the Natural Science Foundation of Heilongjiang Province (FLHPY2019329), the Fundamental Research Foundation of Universities in Heilongjiang Province for Technology Innovation (KJCX201805), the Fundamental Research Foundation of Universities in Heilongjiang Province for Youth Innovation Team (RCYJTD201805), the Young Innovative Talent Research Foundation of Harbin Science and Technology Bureau (2016RQQXJ135), the Research Fund of the First Affiliated Hospital of Harbin Medical University (2019M24), and the Foundation of Graduate Innovative Research (YJSCX2018-140HLJU).
Conflict of Interest Statement
The authors declare that the research was conducted in the absence of any commercial or financial relationships that could be construed as a potential conflict of interest.
Supplementary Material
The Supplementary Material for this article can be found online at: https://www.frontiersin.org/articles/10.3389/fgene.2019.00416/full#supplementary-material
Supplementary Table 1. Potential candidate lncRNAs related to 402 diseases.
Supplementary Table 2. The lncRNA similarities.
References
Bahari, F., Emadi-Baygi, M., and Nikpour, P. (2015). miR-17-92 host gene, uderexpressed in gastric cancer and its expression was negatively correlated with the metastasis. Ind. J. Cancer 52, 22–25. doi: 10.4103/0019-509X.175605
Bahdanau, D., Cho, K., and Bengio, Y. (2014). Neural machine translation by jointly learning to align and translate. arXiv:1409.0473.
Chen, G., Wang, Z., Wang, D., Qiu, C., Liu, M., Chen, X., et al. (2013). LncRNADisease: a database for long-non-coding RNA-associated diseases. Nucleic Acids Res. 41, D983–D986.doi: 10.1093/nar/gks1099
Chen, X. (2015). KATZLDA: KATZ measure for the lncRNA-disease association prediction. Sci. Rep. 5:16840. doi: 10.1038/srep16840
Chen, X., Yan, C. C., Luo, C., Ji, W., Zhang, Y., and Dai, Q. (2015). Constructing lncRNA functional similarity network based on lncRNA-disease associations and disease semantic similarity. Sci. Rep. 5:11338. doi: 10.1038/srep11338
Chen, X., Yan, C. C., Zhang, X., and You, Z.-H. (2016a). Long non-coding RNAs and complex diseases: from experimental results to computational models. Brief. Bioinformat. 18, 558–576. doi: 10.1093/bib/bbw060
Chen, X., and Yan, G. Y. (2013). Novel human lncRNA–disease association inference based on lncRNA expression profiles. Bioinformatics 29, 2617–2624. doi: 10.1093/bioinformatics/btt426
Chen, X., You, Z. H., Yan, G. Y., and Gong, D. W. (2016b). IRWRLDA: improved random walk with restart for lncRNA-disease association prediction. Oncotarget 7, 57919–57931. doi: 10.18632/oncotarget.11141
Cheng, L., Hu, Y., Sun, J., Zhou, M., and Jiang, Q. (2018). DincRNA: a comprehensive web-based bioinformatics toolkit for exploring disease associations and ncRNA function. Bioinformatics 34, 1953–1956. doi: 10.1093/bioinformatics/bty002
Fu, G., Wang, J., Domeniconi, C., and Yu, G. (2017). Matrix factorization based data fusion for the prediction of lncRNA-disease associations. Bioinformatics 34, 1529–1537. doi: 10.1093/bioinformatics/btx794
Gao, Y., Wang, P., Wang, Y., Ma, X., Zhi, H., Zhou, D., et al. (2018). Lnc2Cancer v2. 0: updated database of experimentally supported long non-coding RNAs in human cancers. Nucleic Acids Res. 47, D1028–D1033. doi: 10.1093/nar/gky1096
Gu, C., Liao, B., Li, X., Cai, L., Li, Z., Li, K., et al. (2017). Global network random walk for predicting potential human lncRNA-disease associations. Sci. Rep. 7:12442. doi: 10.1038/s41598-017-12763-z
Gu, L., Lu, L., Zhou, D., and Liu, Z. (2018). Long noncoding RNA BCYRN1 promotes the proliferation of colorectal cancer cells via Up-Regulating NPR3 Expression. Cell Physiol. Biochem. 48, 2337–2349. doi: 10.1159/000492649
Hu, X., Sood, A. K., Dang, C. V., and Zhang, L. (2018). The role of long noncoding RNAs in cancer: the dark matter matters. Curr. Opin. Genet. Dev. 48, 8–15. doi: 10.1016/j.gde.2017.10.004
Huang, Y. A., Chen, X., You, Z. H., Huang, D. S., and Chan, K. C. C. (2016). ILNCSIM: improved lncRNA functional similarity calculation model. Oncotarget 7, 25902–25914. doi: 10.18632/oncotarget.8296
Karimollah, H. T. (2013). Receiver operating characteristic (ROC) curve analysis for medical diagnostic test evaluation. Caspian J. Intern. Med. 4, 627–635.
Kingma, D. P., and Ba, J. (2015). “Adam: a method for stochastic optimization,” in International Conference on Learning Representations (San Diego, CA), 1–15.
Lan, W., Li, M., Zhao, K., Liu, J., Wu, F. X., Pan, Y., et al. (2017). LDAP: a web server for lncRNA-disease association prediction. Bioinformatics 33, 458–460. doi: 10.1093/bioinformatics/btw639
Li, J., Gao, C., Wang, Y., Ma, W., Tu, J., Wang, J., et al. (2014a). A bioinformatics method for predicting long noncoding RNAs associated with vascular disease. Sci. China Life Sci. 57, 852–857. doi: 10.1007/s11427-014-4692-4
Li, J. H., Liu, S., Zhou, H., Qu, L. H., and Yang, J. H. (2014b). starBase v2.0: decoding miRNA-ceRNA, miRNA-ncRNA and protein-RNA interaction networks from large-scale CLIP-Seq data. Nucleic Acids Res. 42, D92. doi: 10.1093/nar/gkt1248
Li, Y., Qiu, C., Tu, J., Geng, B., Yang, J., Jiang, T., et al. (2013). HMDD v2. 0: a database for experimentally supported human microRNA and disease associations. Nucleic acids Res. 42:D1070–D1074. doi: 10.1093/nar/gkt1023
Liu, M.-X., Chen, X., Chen, G., Cui, Q.-H., and Yan, G.-Y. (2014). A computational framework to infer human disease-associated long noncoding RNAs. PloS ONE 9:e84408. doi: 10.1371/journal.pone.0084408
Lu, C., Yang, M., Luo, F., Wu, F. X., Li, M., Pan, Y., et al. (2018). Prediction of lncRNA-disease associations based on inductive matrix completion. Bioinformatics 34, 3357–3364. doi: 10.1093/bioinformatics/bty327
Lu, Z., Cohen, KB, and Hunter, L. (2006). “GeneRIF quality assurance as summary revision,” in Pacific Symposium on Biocomputing Pacific Symposium on Biocomputing 2007 (Maui), 269.
Mo, X., Li, T., Xie, Y., Zhu, L., Xiao, B., Liao, Q., et al. (2018). Identification and functional annotation of metabolism-associated lnc RNA s and their related protein-coding genes in gastric cancer. Mol. Genet. Genom. Med. 6, 728–738. doi: 10.1002/mgg3.427
Nair, V., and Hinton, G. E. (2010). “Rectified linear units improve restricted boltzmann machines,” in International Conference on International Conference on Machine Learning (Haifa), 807–814.
Ning, S., Zhang, J., Wang, P., Zhi, H., Wang, J., Liu, Y., et al. (2016). Lnc2Cancer: a manually curated database of experimentally supported lncRNAs associated with various human cancers. Nucleic Acids Res. 44, D980–D985. doi: 10.1093/nar/gkv1094
Paraskevopoulou, M. D., and Hatzigeorgiou, A. G. (2016). “Analyzing miRNA–lncRNA interactions,” in Long Non-coding RNAs (New York, NY: Springer), 271–286.
Ping, P., Wang, L., Kuang, L., Ye, S., Iqbal, M. F. B., and Pei, T. (2018). A novel method for LncRNA-disease association prediction based on an lncRNA-disease association network. IEEE/ACM Trans. Comput. Biol. Bioinform. 16, 688–693. doi: 10.1109/TCBB.2018.2827373
Prensner, J. R., and Chinnaiyan, A. M. (2011). The emergence of lncRNAs in cancer biology. Cancer Discov. 1, 391–407. doi: 10.1158/2159-8290.CD-11-0209
Reik, W. (2009). Evolution and functions of long noncoding RNAs. Cell 136, 629–641. doi: 10.1016/j.cell.2009.02.006
Schmitt, A. M., and Chang, H. Y. (2016). Long noncoding RNAs in cancer pathways. Cancer Cell 29, 452–463. doi: 10.1016/j.ccell.2016.03.010
Shen, F., Cai, W. S., Feng, Z., Chen, J. W., Feng, J. H., Liu, Q. C., et al. (2017). Long non-coding RNA SPRY4-IT1 pormotes colorectal cancer metastasis by regulate epithelial-mesenchymal transition. Oncotarget 8:14479. doi: 10.18632/oncotarget.10407
Sun, J., Shi, H., Wang, Z., Zhang, C., Liu, L., Wang, L., et al. (2014). Inferring novel lncRNA–disease associations based on a random walk model of a lncRNA functional similarity network. Mol. BioSyst. 10, 2074–2081. doi: 10.1039/C3MB70608G
Sun, X., Xin, Y., Wang, M., Li, S., Miao, S., Xuan, Y., et al. (2018). Overexpression of long non-coding RNA KCNQ1OT1 is related to good prognosis via inhibiting cell proliferation in non-small cell lung cancer. Thorac. Cancer 9, 523–531. doi: 10.1111/1759-7714.12599
Takaya, S., and Marc, R. (2015). The precision-recall plot is more informative than the ROC plot when evaluating binary classifiers on imbalanced datasets. PLoS ONE 10:e0118432. doi: 10.1371/journal.pone.0118432
Wang, D., Wang, J., Lu, M., Song, F., and Cui, Q. (2010). Inferring the human microRNA functional similarity and functional network based on microRNA-associated diseases. Bioinformatics 26, 1644–1650. doi: 10.1093/bioinformatics/btq241
Xie, B., Ding, Q., Han, H., and Wu, D. (2013). miRCancer: a microRNA–cancer association database constructed by text mining on literature. Bioinformatics 29, 638–644. doi: 10.1093/bioinformatics/btt014
Xu, Y., Guo, M., Liu, X., Wang, C., and Liu, Y. (2013a). Inferring the soybean (Glycine max) microRNA functional network based on target gene network. Bioinformatics 30, 94–103. doi: 10.1093/bioinformatics/btt605
Xu, Y., Guo, M., Shi, W., Liu, X., and Wang, C. (2013b). A novel insight into gene ontology semantic similarity. Genomics 101, 368–375. doi: 10.1016/j.ygeno.2013.04.010
Xu, Y., Wang, Y., Luo, J., Zhao, W., and Zhou, X. (2017). Deep learning of the splicing (epi) genetic code reveals a novel candidate mechanism linking histone modifications to ESC fate decision. Nucleic Acids Res. 45, 12100–12112. doi: 10.1093/nar/gkx870
Yang, G., Lu, X., and Yuan, L. (2014). LncRNA: a link between RNA and cancer. Biochim. et Biophys. Acta 1839, 1097–1109. doi: 10.1016/j.bbagrm.2014.08.012
Yao, Q., Wu, L., Li, J., guang Yang, L., Sun, Y., Li, Z., et al. (2017). Global prioritizing disease candidate lncRNAs via a multi-level composite network. Sci. Rep. 7:39516. doi: 10.1038/srep39516
Zhang, J., Lu, S., Zhu, J.-F., and Yang, K.-P. (2016). Up-regulation of lncRNA HULC predicts a poor prognosis and promotes growth and metastasis in non-small cell lung cancer. Int. J. Clin. Exp. Pathol. 9, 12415–12422.
Keywords: lncRNA-disease prediction, dual convolutional neural networks, attention at feature level, attention at relationship level, lncRNA-miRNA interactions
Citation: Xuan P, Cao Y, Zhang T, Kong R and Zhang Z (2019) Dual Convolutional Neural Networks With Attention Mechanisms Based Method for Predicting Disease-Related lncRNA Genes. Front. Genet. 10:416. doi: 10.3389/fgene.2019.00416
Received: 15 February 2019; Accepted: 16 April 2019;
Published: 03 May 2019.
Edited by:
Quan Zou, University of Electronic Science and Technology of China, ChinaReviewed by:
Lei Deng, Central South University, ChinaPora Kim, University of Texas Health Science Center at Houston, United States
Copyright © 2019 Xuan, Cao, Zhang, Kong and Zhang. This is an open-access article distributed under the terms of the Creative Commons Attribution License (CC BY). The use, distribution or reproduction in other forums is permitted, provided the original author(s) and the copyright owner(s) are credited and that the original publication in this journal is cited, in accordance with accepted academic practice. No use, distribution or reproduction is permitted which does not comply with these terms.
*Correspondence: Tiangang Zhang, zhang@hlju.edu.cn