 Wenyang Zhou1†
 Fan Yang2†
 Zhaochun Xu1†
 Meng Luo1
 Pingping Wang1Yu Guo1
 Huan Nie1*Lifen Yao2*
 Qinghua Jiang1*
- 1School of Life Science and Technology, Harbin Institute of Technology, Harbin, China
- 2Department of Neurology, The First Affiliated Hospital of Harbin Medical University, Harbin, China
Clear-cell renal cell carcinoma (ccRCC) is the most common and lethal subtype of kidney cancer. VHL and PBRM1 are the top two significantly mutated genes in ccRCC specimens, while the genetic mechanism of the VHL/PBRM1-negative ccRCC remains to be elucidated. Here we carried out a comprehensive analysis of single-cell genomic copy number variations (CNVs) in VHL/PBRM1-negative ccRCC. Genomic CNVs were identified at the single-cell level, and the tumor cells showed widespread amplification and deletion across the whole genome. Functional enrichment analysis indicated that the amplified genes are significantly enriched in cancer-related signaling transduction pathways. Besides, receptor protein tyrosine kinase (RTK) genes also showed widespread copy number variations in cancer cells. Our studies indicated that the genomic CNVs in RTK genes and downstream signaling transduction pathways may be involved in VHL/PBRM1-negative ccRCC pathogenesis and progression, and highlighted the role of the comprehensive investigation of genomic CNVs at the single-cell level in both clarifying pathogenic mechanism and identifying potential therapeutic targets in cancers.
Introduction
Renal cell carcinoma (RCC) is one kind of kidney cancer, accounting for nearly 300,000 new cancer cases per year worldwide (Hakimi et al., 2013). RCC includes several histological subtypes, among which clear cell renal cell carcinoma (ccRCC) is the most common and lethal one (Hakimi et al., 2016). Increasing studies have shown that the development of ccRCC seems to be shaped by chromosomal lesions and a number of somatic mutations (Sato et al., 2013). VHL and PBRM1, located within the chromosome 3p25 and 3p21 segments, are the top two significantly mutated genes in ccRCC (Sato et al., 2013). Nearly 90% of ccRCCs undertake the deletion on chromosome 3p, leading to a very high frequency of VHL inactivation (Gnarra et al., 1994). Moreover, VHL and PBRM1 are mutated in about 50 and 41% of sporadic ccRCC, respectively (Kaelin, 2004; Varela et al., 2011). However, little is known about the genetic mechanisms in VHL/PBRM1-negative ccRCC.
Based on the next-generation sequencing technology, previous studies identified many driver mutations in ccRCC (Gnarra et al., 1994; Kaelin, 2004; Sato et al., 2013; Cheng et al., 2019). However, limited insights are available on the genomic diversity within tumor tissues (Wang et al., 2014). Generally, tumor tissues may contain cancer cells from multiple clones and noncancerous cells, which make it difficult to identify the mutations in each clone and detect the driver genes during the cancer progression (Xu et al., 2012; Casasent et al., 2018). Fortunately, single-cell DNA sequencing has been developed to meet this challenge, because it can provide unique insights into intratumor heterogeneity, development, and diversity of cancers at the single-cell level (Casasent et al., 2018). For example, Xu et al. (2012) carried out the single-cell exome sequencing on a ccRCC tumor and its adjacent normal tissue. They identified four genes (i.e., AHNAK, SRGAP3, LRRK2, and USP6) as potential driving factors for VHL/PBRM1-negative ccRCC development, which provided new insights into the pathogenesis of the ccRCC.
Genomic copy number variations (CNVs) play an important role in cancer progression, and emerging studies indicate that genomic CNVs are associated with the ccRCC (Gerlinger et al., 2014; Nouhaud et al., 2018) and other cancers (Waddell et al., 2015; Secrier et al., 2016; Hong et al., 2019). Xu et al. (Xu et al., 2012) performed a single-cell exome sequencing to elucidate the genetic mechanisms of the ccRCC by identifying the single nucleotide variants (SNVs). However, the authors did not examine whether the genomic copy number variations play a crucial role in ccRCC.
To further investigate the potential roles of CNVs in VHL/PBRM1-negative ccRCC, we performed a comprehensive single-cell CNV analysis based on a dataset provided by Xu et al., (2012). We delineated the genomic copy number variation landscape at the single-cell level and reclassified all single cells based on the single-cell genomic CNVs. We also identified several significantly amplified/deleted loci and genes in cancer cells. Finally, we further investigated the biological pathways which may be involved in the ccRCC pathogenesis.
Methods
Datasets
The sample data and information used in our article came from a previous study, and the original sequencing data were downloaded from NCBI (http://www.ncbi.nlm.nih.gov/sra) under the accession number SRA050201.
Quality Control
Quality control of the sequencing data was performed using FastQC. The adapter and low-quality ends were trimmed from reads using Trim-Galore version 0.5.0 (http://www.bioinformatics.babraham.ac.uk/projects/trim_galore/). Trimmed reads shorter than 20 bp were discarded.
Reads Mapping
The human reference genome sequence (Hg19) was used for mapping (http://hgdownload.soe.ucsc.edu/goldenPath/hg19/bigZips/). Short read pairs were mapped to the reference genome using Burrows-Wheeler Aligner (BWA) version 0.7.12-r1039 (Li and Durbin, 2009). In this process, we adopted the BWA-MEM algorithm and adjusted the main parameters, setting the minimum seed length to 19, the penalty for a mismatch to 4, and shorter split hits were marked as secondary. Then, Samtools was used to convert SAM files to compressed BAM files, sort the BAM files by chromosomal coordinates, and remove the PCR duplicates from BAM files.
Copy Number Variations Calling
In each cell, germline and somatic copy number variations were called by Control-FREEC version 11.5 (Boeva et al., 2012). Considering the exome enrichment during library construction, read counts were calculated by exome region. The target region file of exome capture was downloaded from the Agilent website (https://earray.chem.agilent.com/suredesign/index.htm). The germline CNVs were detected in each cell and bulk normal tissue, respectively. Somatic CNVs were detected only in single cells. Gene annotations were performed with Annovar software (Wang et al., 2010) and OAHG database (Cheng et al., 2016).
Dimensionality Reduction of Cells
T-distributed stochastic neighbor embedding (t-SNE) was performed based on the germline CNVs of target regions. Both 25 single cells and bulk normal tissue were projected to 2D space using the R package named “Rtsne.”
Significantly Somatic Copy Number Variation Loci Analysis
Significantly amplified/deleted loci in tumor cells were identified using GISTIC2.0 (Mermel et al., 2011). GISTIC2.0 was run on an input defined as the log2()-1 of somatic copy number values, with confidence (-conf) threshold of 0.9. Considering for downstream analysis, thresholds suggested by GISTIC2.0 for copy number variation were as follows: if GISTIC score ≥0.9, it means amplification; 0.1 < GISTIC score <0.9, corresponding to gain; −1.3 < GISTIC score < −0.1, loss; GISTIC score ≤ −1.3, deletion.
Receptor Protein Tyrosine Kinase Gene Copy Number Profiling
To examine the landscape of copy number variations in RTK genes, we derived GISTIC-equivalent scores by dividing the germline copy numbers and classifying genes as amplified if score ≥ 0.9, deleted if score ≤ −1.3, gained if score > 0.1, and loss if the score < −0.1.
Function Analysis
The significantly amplified and deleted genes were identified according to significantly somatic CNV loci (q-value < 0.0001) in GISTIC2.0. The Kyoto Encyclopedia of Genes and Genomes (KEGG) pathway function enrichment analysis was performed using the Carcinogenic Potency Database (CPDB) (Kamburov et al., 2013). In this study, the p-value threshold for KEGG enrichment analysis is 0.05.
Results
Identification of Single-Cell Genomic Copy Number Variations in Kidney Cancer and Normal Cells
To identify genomic CNVs in ccRCC, we analyzed the sequencing data from a ccRCC patient, which includes 20 single-cell exome sequencing data from the tumor tissue, 5 single-cell exome sequencing data from the adjacent normal tissue, and a bulk exome sequencing data from the adjacent normal tissue. Trim-Galore was used to remove the low-quality and adapter segments and analyze the quality of sequencing reads. The cleaned reads were mapped to the reference genome with BWA software (Li and Durbin, 2009). The sequencing depth was more than 20X (29.68 ± 5.68) in all single cells. The genomic CNVs were called by using Control-FREEC (Boeva et al., 2012).
Germline CNVs were identified in all the samples. The comparison between cancer and normal cells revealed widespread amplification and deletion across the whole genome in tumor cells (Figure 1A). At the same time, some deleted loci were found both in normal and cancer cells, which may be caused by multiple displacement amplification (MDA) amplification (Yilmaz and Singh, 2012) or exome capture during DNA library preparation.
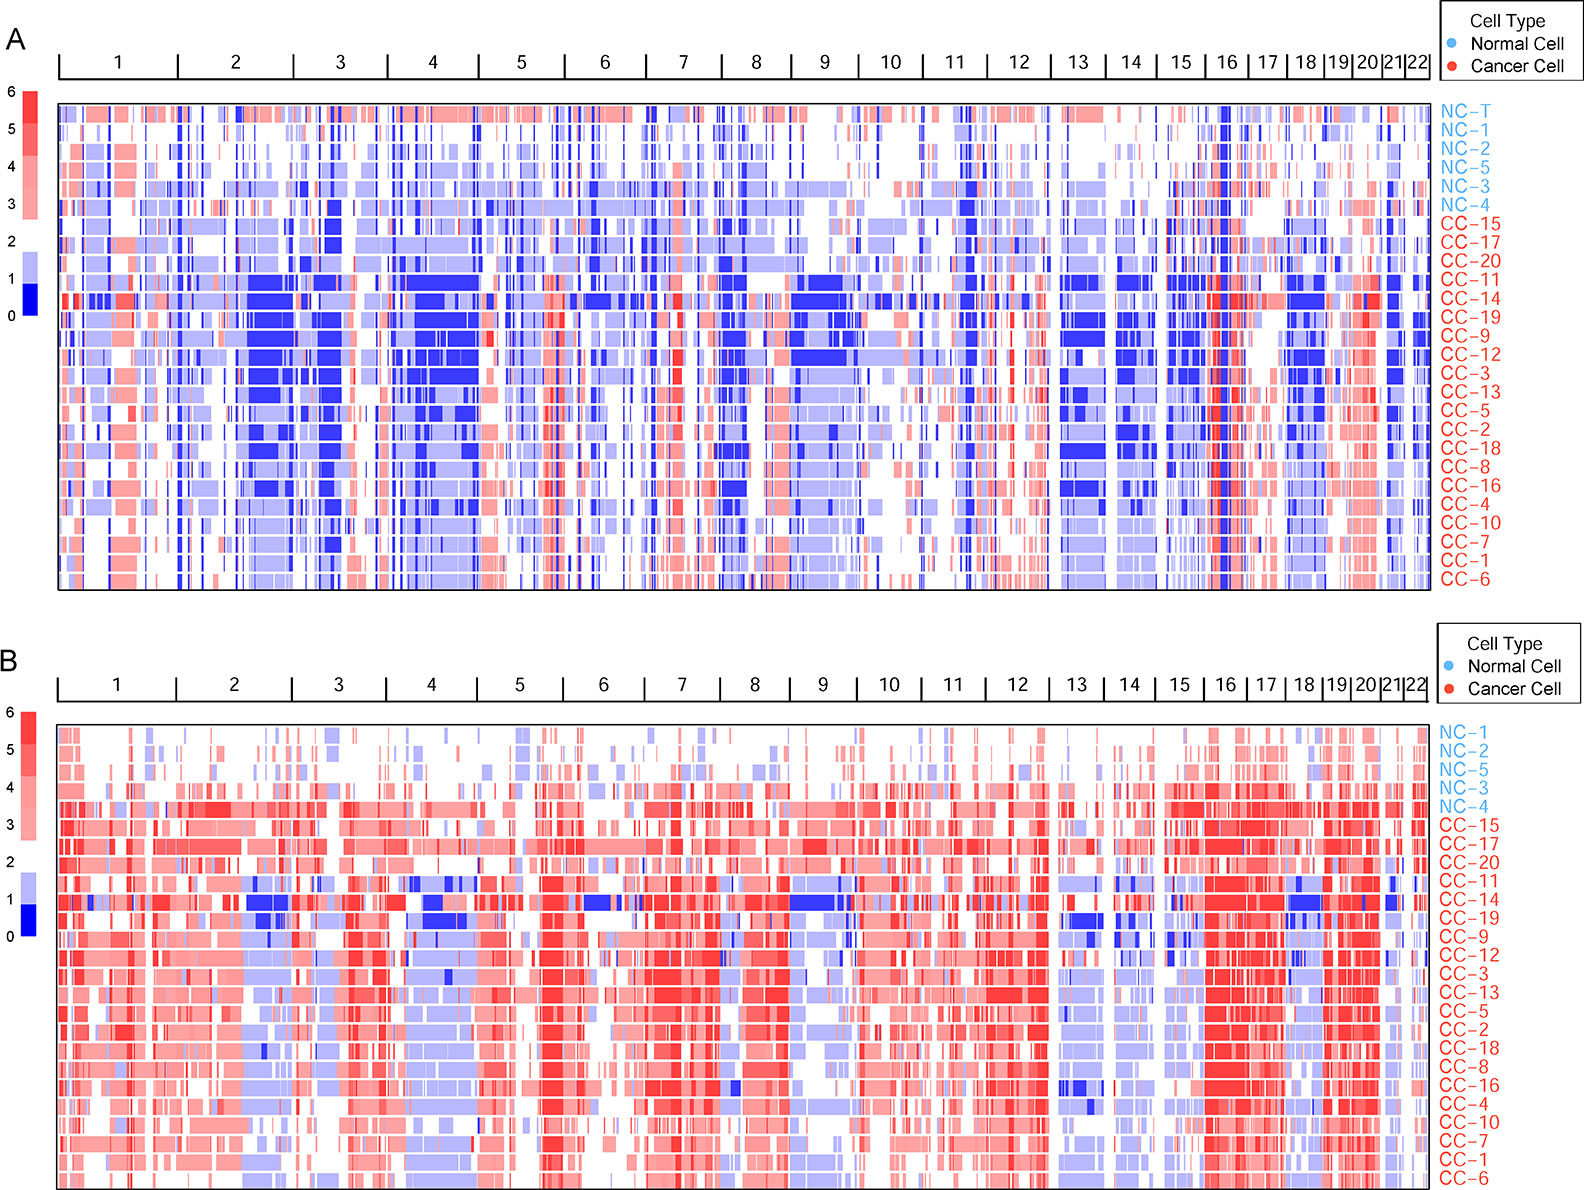
Figure 1 The genomic copy number variations (CNVs) identified across all cells. (A) The germline CNVs in single cells and normal tissue. Genomic CNVs within the whole genome are shown, the color scale ranges from blue (deletion) to red (amplification) with estimated copy numbers shown. The cell names are marked by different cell types. (B) The somatic CNVs in single cells.
To remove the background mutations caused by germline or technology flaws, somatic CNVs were identified in all cells using bulk normal tissue as control. The somatic CNVs showed much more amplification than germline CNVs in the cancer cells remarkably (Figure 1B). Large-scale of somatic CNVs were found in the ccRCC single cells, which was consistent with the previous studies based on the bulk sequencing (Cancer Genome Atlas Research, N, 2013; Gerlinger et al., 2014; Nouhaud et al., 2018). What’s more, single-cell sequencing data revealed the amplification of copy number showed a high degree of consistency, which suggests the amplification may play an important role in the progression of ccRCC. On the contrary, the deletion showed higher intratumor heterogeneity in the cancer cells.
Re-Classification of Kidney Cancer and Normal Cells Based on Single-Cell Copy Number Variations
Generally, surgically removed cancer tumors may contain both cancer and normal cells (Xu et al., 2012). To reclassify all the single cells accurately, the t-distributed stochastic neighbor embedding (t-SNE) was performed based on the cell copy number in exome target regions. The results of dimensionality reduction (Figure 2, Supplementary Table S1) showed that three cancer cells (CC-15, CC-17, and CC-20) clustered tightly with the normal cells and tissue, suggesting that they probably were normal cells in the tumor tissue. These results were consistent with the previous findings which based on the single-cell SNVs (Xu et al., 2012). These three cells (CC-15, CC-17, and CC-20) were excluded from the cancer cell group in the downstream analysis. Focusing on the remaining cancer cells, we found no subpopulation of cancer cells within the cancer tissue.
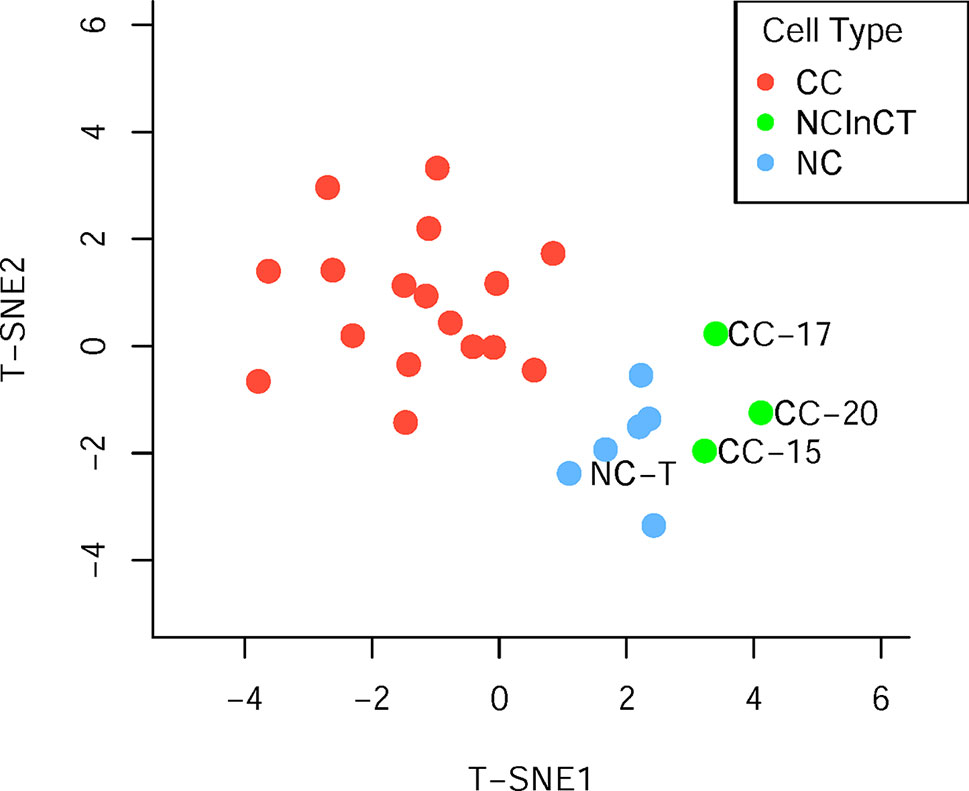
Figure 2 Population analysis based on the germline copy number variations (CNVs). T-distributed stochastic neighbor embedding (T-SNE) analysis of cancer cell (red), normal cell (blue), and normal cell in cancer tissue (green) based on the germline CNVs.
According to the single-cell genomic CNVs, all the single cells can be reclassified into three groups, namely cancer cell (CC), normal cell (NC), and normal cell in cancer tissue (NCinCT). To address whether the genomic CNVs were significantly different between the three groups, we calculated the proportion of whole genome that covered with amplification (copy number ≥ 4) and loss (copy number = 0), respectively. The results (Figure 3) showed that there were more amplified loci in CC group than NC group (P = 3×10⁻⁴) and NCinCT group (P = 1.8×10⁻³). Besides, there was no significant difference between NC and NCinCT groups (P = 0.79). The lost loci also showed a similar result. Single-cell genomic CNVs indicated that the genome of cancer cells was in an extremely unstable state.

Figure 3 The coverage of genomic copy number variations (CNV) regions in three cell types. (A) The percentage of amplification region (copy number ≥ 4) across the whole genome in different cell types. (B) The percentage of loss region (copy number = 0) across the whole genome in different cell types. In the two sub-graphs (A) and (B), p-values between two groups (Wilcoxon signed-rank test) and all groups (Kruskal-Wallis test) were calculated.
Loci Distribution of Significant Genomic Copy Number Variations in Kidney Cancer
To investigate the loci distribution of the significant genomic CNVs across all tumor single cells, GISTIC2.0 (Mermel et al., 2011) was used to identify the significant genomic CNVs loci based on the somatic CNVs in 17 cancer cells, but not including germline CNVs which are not involved in cancer development generally. The results indicated that copy numbers in the significant CNV loci have a high degree of consistency across all the cancer cells. Although lots of lost loci (more slight than deletion, −1.3 < GISTIC score < −0.1) were identified, there was no significantly deleted locus (GISTIC score ≤ −1.3) found in cancer cells, which was consistent with high heterogeneity of deletion region in our cancer cells.
Significantly amplified loci (Figure 4, Supplementary Table S2A) according to GISTIC2.0 (12q13.3, 12p13.31, 5q35.3, etc.; q-value < 0.05) comprised genes such as IGFBP4, ERBB2, ERBB3, FGFR4, CDK2, FLT4, and so on. The IGFBP4 gene had been reported to be associated with several types of cancer (Hallberg et al., 2000; Romero et al., 2011; Yang et al., 2017), it can promote the RCC cell metastasis and activate Wnt/beta-catenin signaling pathway in humans (Ueno et al., 2011). ERBB2 and ERBB3 genes belong to the epidermal growth factor receptor (EGFR) family, and they had been identified as common driver genes of multiple cancer types by promoting solid tumor growth (Yarden, 2001; Henson et al., 2017; Oldrini et al., 2017). The amplification of EGFR also was found in other cancers, which contributed to the EGFR excessive activation (Sigismund et al., 2018). FGFR4 gene belongs to the fibroblast growth factor receptor family, and the activation of FGFR4 can promote cell growth and angiogenesis in cancer (Bai et al., 2015). CDK2 gene is commonly excessive activation in human cancers, and dysfunction of CDK2 can lead to uncontrolled cell growth (Mihara et al., 2001). FLT4 gene, belonging to the vascular endothelial growth factor family, had been reported to regulate cancer cell survival and proliferation (Varney and Singh, 2015).
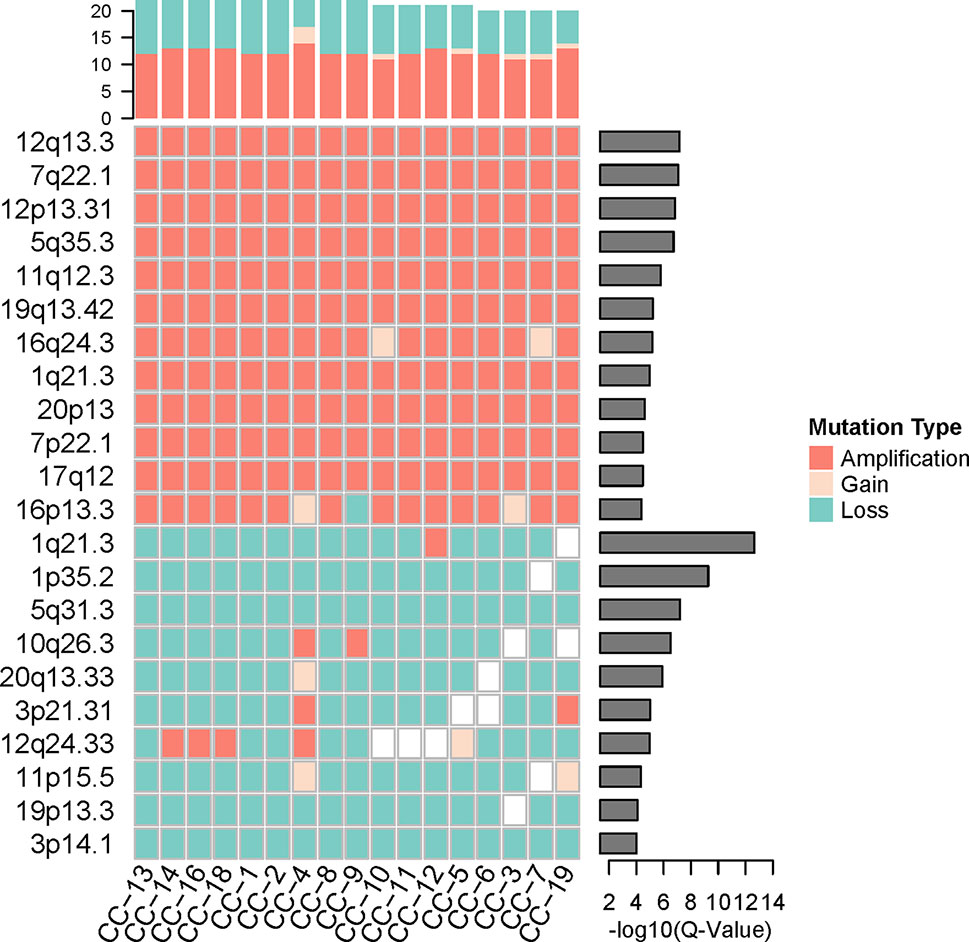
Figure 4 The significant genomic copy number variation (CNV) loci in cancer cells. All CNV types in each cancer cell were counted for the top frequency histogram, and q-value for each significant genomic CNV loci was shown on the right. Only the loci with q-value < 0.0001 were shown.
While the top significantly deleted loci (Figure 4, Supplementary Table S2B) (1q21.3, 1p35.2, 16q24.3, 3p14.1, etc.; q-value < 0.05) showed loss of Chmp1A, CADM2, PRAP1, and ULK1 genes. Chmp1A and CADM2, belonging to cell adhesion molecules family, had been found to be a tumor suppressor gene in RCC. The overexpression of Chmp1A and CADM2 significantly suppressed cancer growth and invasion (You et al., 2012; He et al., 2013). PARP1 gene played an important role in DNA repair and cell apoptosis (Tulin, 2011), the cell with PARP1 deficiency show resistance to DNA damage-induced programmed cell death and increased cancer risk (Schiewer and Knudsen, 2014). ULK1 was an initiate autophagy gene, and the down-regulation of ULK1 had been found in cancer (Zhang et al., 2017). ULK1 may play a pivotal role in cancer by promoting cell death (Chen et al., 2014).
The genes in significantly amplified loci include a number of known driver genes, which may promote the cancer progression by the up-regulation of cell growth and cell cycle. Significantly deleted loci include some tumor suppressor genes and autophagy genes. The inactivation of these genes leads to uncontrolled tumor growth, which may contribute to the VHL/PBRM1-negative ccRCC pathogenesis and progression
Functional Analysis of Significant Genomic Copy Number Variations in Kidney Cancer
To better understand the potential biological and functional characteristics of the significantly amplified and deleted genes in cancer cells, biological function pathways in ccRCC had been further investigated. The KEGG functional enrichment analysis was performed using the CPDB Database based on the amplified and deleted genes, respectively. The amplified genes showed significant enrichment (p-value < 0.05) for signal transduction, metabolism, cell cycle, immunity, and other cancer-related pathways (Figure 5, Supplementary Table S3). In contrast to amplified genes, deleted genes only showed significant enrichment for the fatty acid elongation pathway (p-value = 7.6×10⁻³).
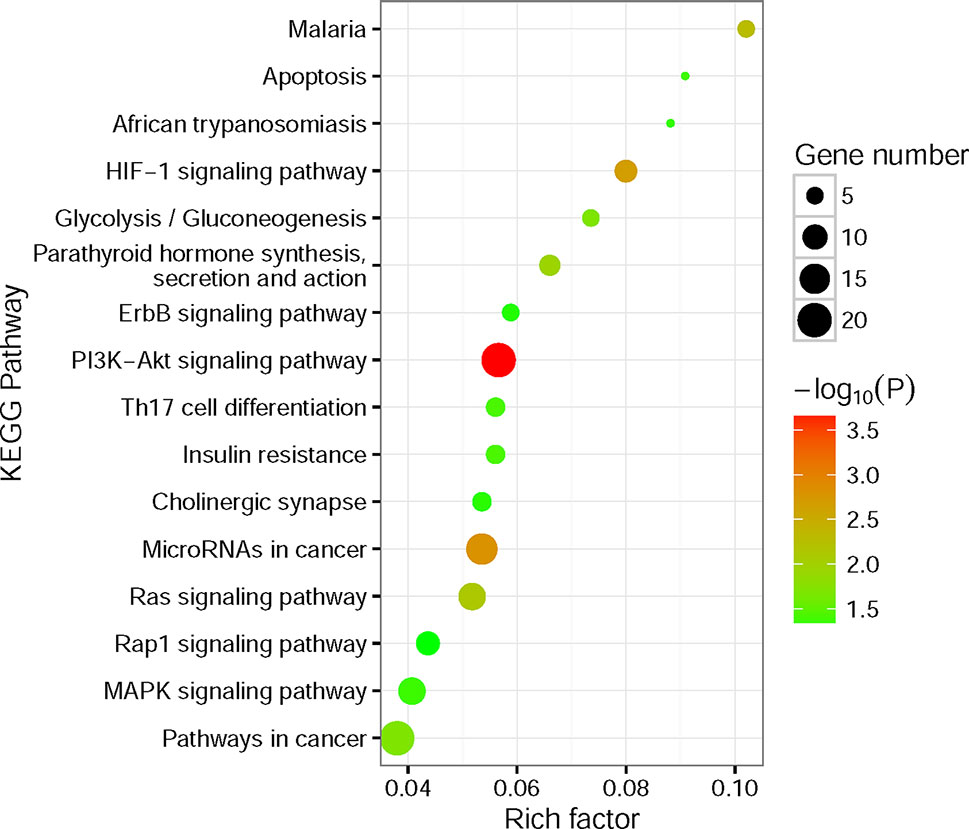
Figure 5 Kyoto Encyclopedia of Genes and Genomes (KEGG) functional enrichment analysis for significantly amplified genes. The size of the point means the gene number both in our amplified gene set and KEGG pathway terms. The color of point means enrichment significance (−log10P). The pathways were sorted by rich factor (the ratio of significantly amplified gene number in this pathway term to gene number in this pathway term).
The most notable result is that a large portion of enrichment pathways belong to the signaling transduction pathway. Both of the HIF-1 (Posadas et al., 2013), ErbB (Liu et al., 2015), PI3K-Akt (Linehan et al., 2010; Sato et al., 2013; Guo et al., 2015), Ras (de Araujo Junior et al., 2015; Chen et al., 2018), Rap1 (Chen et al., 2018), and MAPK signaling pathway (Liu et al., 2015) had been found involved in the pathogenesis of RCC. What’s more, the results also showed that Th17 cells (Li et al., 2015) and microRNAs (Gowrishankar et al., 2014) seem to have a connection with the ccRCC pathogenesis. Interestingly, the fatty acid elongation pathway was significantly deleted in ccRCC, which may account for the fact that ccRCC tumors are lipid-laden (Hakimi et al., 2016).
Receptor Protein Tyrosine Kinase Genes Show Widespread Copy Number Variations in Cancer Cells
Since lots of cancer-related signaling transduction pathways showed significantly amplified in cancer cells, we then examined the copy number variations in their upstream RTK genes (Robinson et al., 2000; Secrier et al., 2016) to investigate possible reasons for the negative results that tumor did not appear known driver mutations in VHL and PBRM1.
The single cancer cells show widespread amplification and deletion on multiple RTKs compared with the normal cells, the NC and NCinCT groups show similar RTK gene profile. There were some RTK genes (EPHB6, EPHA1, EPHB3, FGFR4, PDGFRB, and FLT4) showing amplification in cancer cells. On the contrary, EPHB2, ERBB4, FGFR1, PDGFRA, KDR, and FLT1 genes showed deletion in cancer cells (Figure 6). Genomic copy number is varied across these RTKs and downstream pathways, indicating that the genomic CNVs in RTKs and downstream signaling transduction pathways may have important roles in the pathogenesis and progression of the VHL/PBRM1-negative ccRCC.
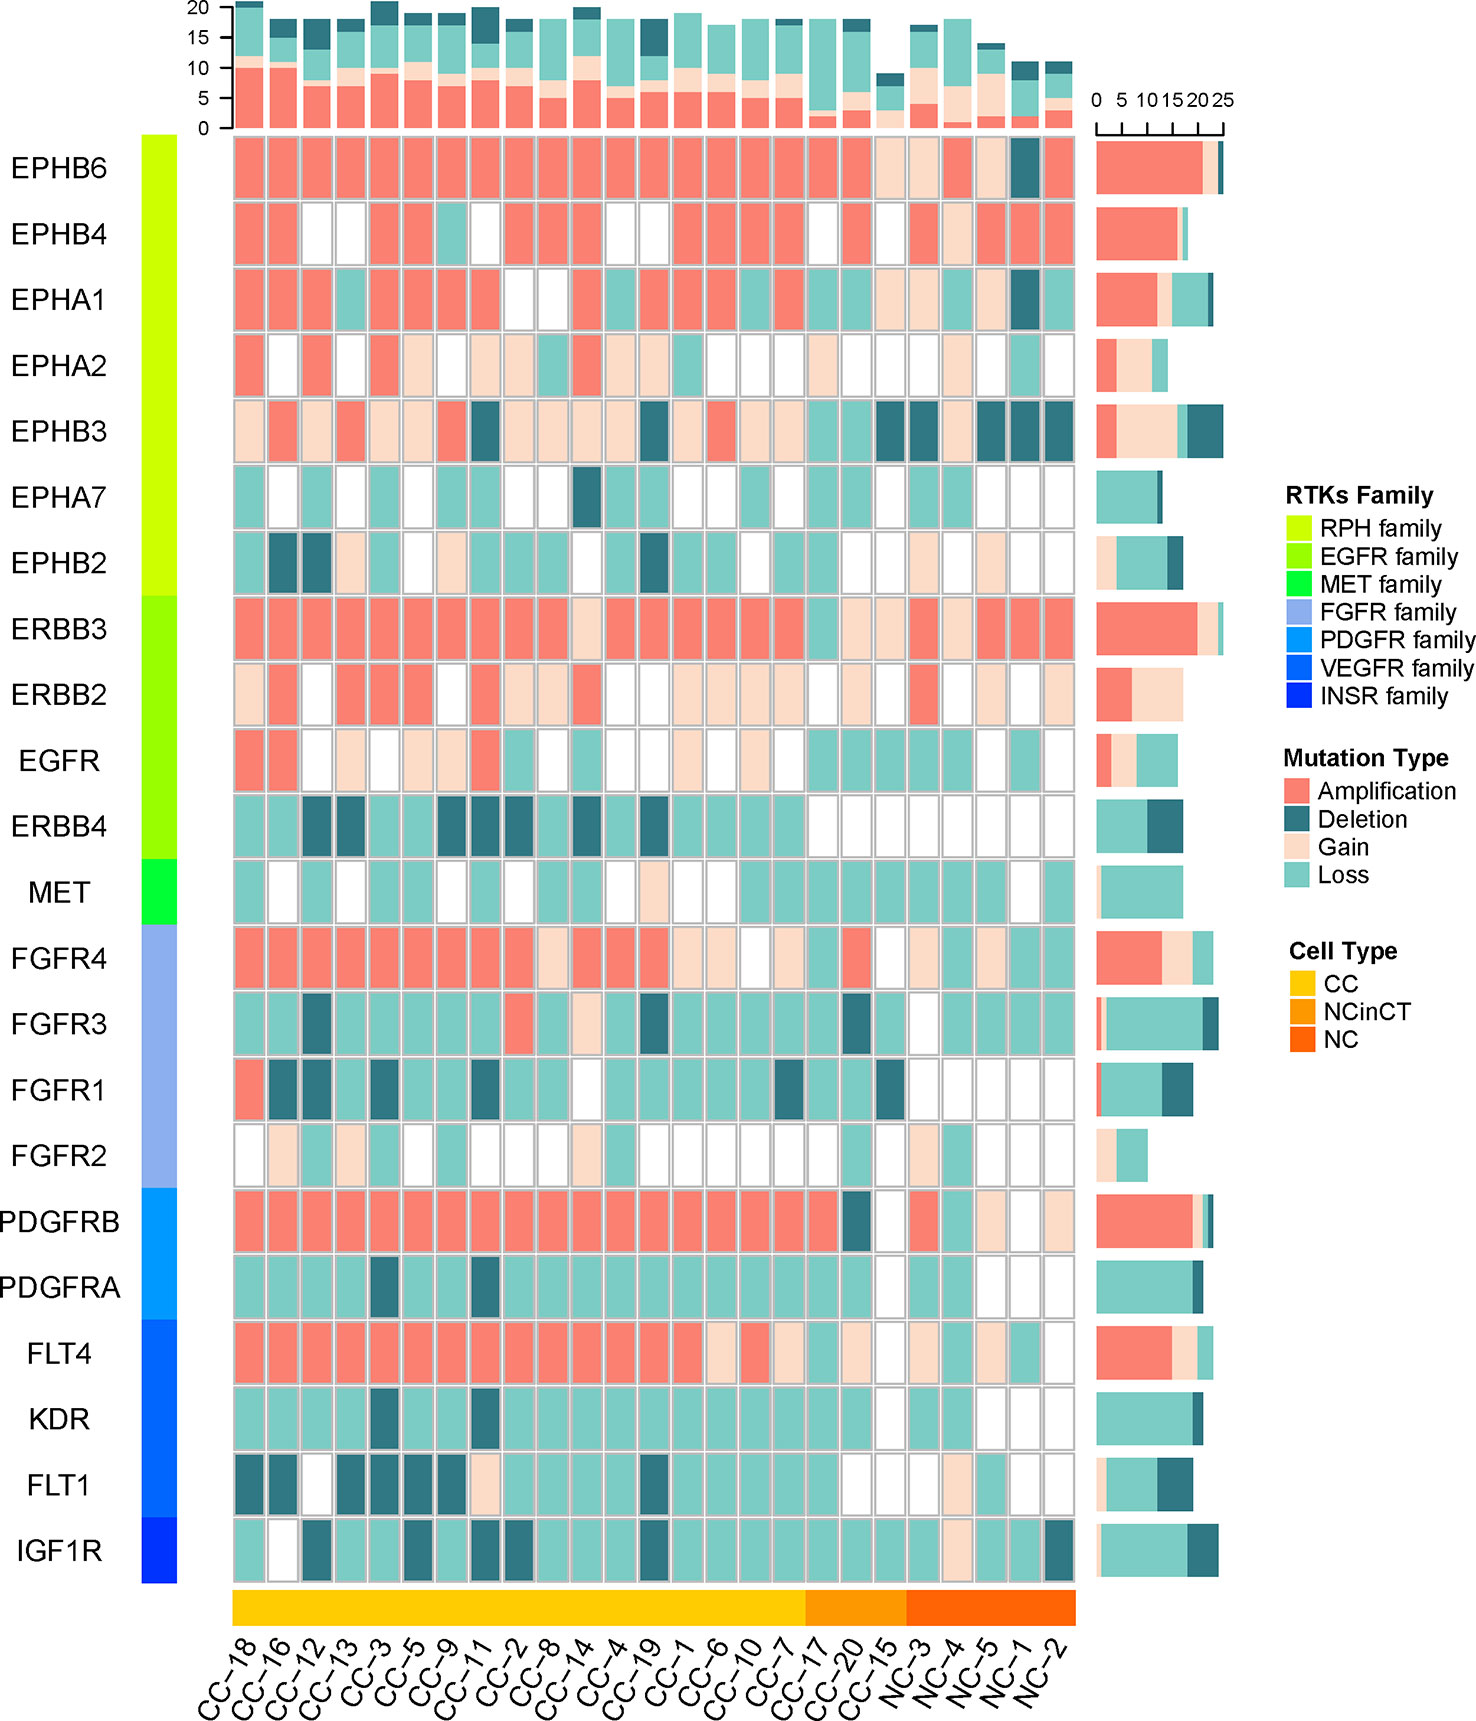
Figure 6 The copy number of receptor protein tyrosine kinase (RTK) genes in all single cells. The copy number variations (CNVs) on RTK genes in both tumor and normal cells were shown. The RTKs family and cell types were shown at the left and bottom of the plot. The mutation types in each cell and gene were counted for the top and right frequency histograms, respectively.
Discussion
Previous studies have shown that VHL and PBRM1 are the top two significantly mutated genes in ccRCC. However, the pathogenesis in VHL/PBRM1-negative ccRCC is still unclear. Our comprehensive analysis of CNVs in 25 single cells from a ccRCC patient provided new insights into the pathogenesis of the ccRCC. We reclassified all the single cells and identified pathological mutations in VHL/PBRM1-negative ccRCC cells. Similar to the genomic CNVs in other cancers, the pathogenesis in VHL/PBRM1-negative ccRCC seems to be shaped by the accumulation of amplification in driver genes (IGFBP4, ERBB2, ERBB3, FGFR4, CDK2, and FLT4), the loss of function in tumor suppressor genes (Chmp1A, CADM2) and autophagy genes (PRAP1, ULK1).
Pathway analysis of these significantly amplified and deleted genes identified several signaling transduction pathways, including HIF-1, ErbB, PI3K-Akt, Ras, Rap1, and MAPK signaling pathways, were affected by genomic amplification. At the same time, RTK genes showed widespread copy number variations in cancer cells specifically. Mutations on RTKs may take part in the overactivity of downstream signaling transduction pathways, leading to the uncontrolled growth of ccRCC cells.
Overall, our single-cell analysis of the copy number in VHL/PBRM1-negative ccRCC revealed that the genomic CNVs in RTKs may cooperate with downstream signaling transduction pathways to take part in VHL/PBRM1-negative ccRCC pathogenesis and progression. Clinically, our findings may provide more effective targeted therapeutic approaches for patients with VHL/PBRM1-negative ccRCC. However, because of the small number of cells and the high intratumor heterogeneity, our findings need to be verified in larger cohorts.
Data Availability Statement
Publicly available datasets were analyzed in this study. The original sequencing data can be downloaded from NCBI (http://www.ncbi.nlm.nih.gov/sra) under the accession number SRA050201.
Author Contributions
HN, LY, and QJ designed the experiments. PW obtained data from NCBI. WZ and ML analyzed the data. FY, ZX, and YG wrote the manuscript. All authors read and approved the manuscript.
Funding
This work is supported by the National Natural Science Foundation of China [61571152, 61822108], the National Science and Technology Major Project of China [2016YFC1202302] and the Natural Science Foundation of Heilongjiang Province [F2015006].
Conflict of Interest
The authors declare that the research was conducted in the absence of any commercial or financial relationships that could be construed as a potential conflict of interest.
Supplementary Material
The Supplementary Material for this article can be found online at: https://www.frontiersin.org/articles/10.3389/fgene.2019.01379/full#supplementary-material
Table S1 | The results of dimensionality reduction based on the germline CNVs. The name and coordinate in 2D space of all single cells were shown in this table.
Table S2 | The results of significantly amplified (Table S2A) and deleted (Table S2B) loci according to GISTIC2.0. The cytoband name, q-value and gene names of each amplification/deletion loci were shown in this table.
Table S3 | The results of KEGG enrichment analysis based on significantly amplified (Table S3A) and deleted (Table S3B) genes according to the CPDB database. The pathway name, p-value and gene sets of each pathway were shown in this table.
References
Bai, Y. P., Shang, K., Chen, H., Ding, F., Wang, Z., Liang, C., et al. (2015). FGF-1/-3/FGFR4 signaling in cancer-associated fibroblasts promotes tumor progression in colon cancer through Erk and MMP-7. Cancer Sci. 106 (10), 1278–1287. doi: 10.1111/cas.12745
Boeva, V., Popova, T., Bleakley, K., Chiche, P., Cappo, J., Schleiermacher, G., et al. (2012). Control-FREEC: a tool for assessing copy number and allelic content using next-generation sequencing data. Bioinformatics 28 (3), 423–425. doi: 10.1093/bioinformatics/btr670
Cancer Genome Atlas Research, N. (2013). Comprehensive molecular characterization of clear cell renal cell carcinoma. Nature 499 (7456), 43–49. doi: 10.1038/nature12222
Casasent, A. K., Schalck, A., Gao, R., Sei, E., Long, A., Pangburn, W., et al. (2018). Multiclonal invasion in breast tumors identified by topographic single cell sequencing. Cell 172 (1-2), 205–217 e212. doi: 10.1016/j.cell.2017.12.007
Chen, Y., He, J., Tian, M., Zhang, S. Y., Guo, M. R., Kasimu, R., et al. (2014). UNC51-like kinase 1, autophagic regulator and cancer therapeutic target. Cell Prolif. 47 (6), 494–505. doi: 10.1111/cpr.12145
Chen, Y. L., Ge, G. J., Qi, C., Wang, H., Wang, H. L., Li, L. Y., et al. (2018). A five-gene signature may predict sunitinib sensitivity and serve as prognostic biomarkers for renal cell carcinoma. J. Cell Physiol. 233 (10), 6649–6660. doi: 10.1002/jcp.26441
Cheng, L., Sun, J., Xu, W., Dong, L., Hu, Y., Zhou, M. (2016). OAHG: an integrated resource for annotating human genes with multi-level ontologies. Sci. Rep. 6, 34820. doi: 10.1038/srep34820
Cheng, L., Wang, P., Tian, R., Wang, S., Guo, Q., Luo, M., et al. (2019). LncRNA2Target v2.0: a comprehensive database for target genes of lncRNAs in human and mouse. Nucleic Acids Res. 47 (D1), D140–D144. doi: 10.1093/nar/gky1051
de Araujo Junior, R. F., Leitao Oliveira, A. L., de Melo Silveira, R. F., de Oliveira Rocha, H. A., de Franca Cavalcanti, P., de Araujo, A. A. (2015). Telmisartan induces apoptosis and regulates Bcl-2 in human renal cancer cells. Exp. Biol. Med. (Maywood) 240 (1), 34–44. doi: 10.1177/1535370214546267
Gerlinger, M., Horswell, S., Larkin, J., Rowan, A. J., Salm, M. P., Varela, I., et al. (2014). Genomic architecture and evolution of clear cell renal cell carcinomas defined by multiregion sequencing. Nat. Genet. 46 (3), 225–233. doi: 10.1038/ng.2891
Gnarra, J. R., Tory, K., Weng, Y., Schmidt, L., Wei, M. H., Li, H., et al. (1994). Mutations of the VHL tumour suppressor gene in renal carcinoma. Nat. Genet. 7 (1), 85–90. doi: 10.1038/ng0594-85
Gowrishankar, B., Ibragimova, I., Zhou, Y., Slifker, M. J., Devarajan, K., Al-Saleem, T., et al. (2014). MicroRNA expression signatures of stage, grade, and progression in clear cell RCC. Cancer Biol. Ther. 15 (3), 329–341. doi: 10.4161/cbt.27314
Guo, H., German, P., Bai, S., Barnes, S., Guo, W., Qi, X., et al. (2015). The PI3K/AKT pathway and renal cell carcinoma. J. Genet. Genomics 42 (7), 343–353. doi: 10.1016/j.jgg.2015.03.003
Hakimi, A. A., Pham, C. G., Hsieh, J. J. (2013). A clear picture of renal cell carcinoma. Nat. Genet. 45 (8), 849–850. doi: 10.1038/ng.2708
Hakimi, A. A., Reznik, E., Lee, C. H., Creighton, C. J., Brannon, A. R., Luna, A., et al. (2016). An integrated metabolic atlas of clear cell renal cell carcinoma. Cancer Cell 29 (1), 104–116. doi: 10.1016/j.ccell.2015.12.004
Hallberg, L. M., Ikeno, Y., Englander, E., Greeley, G. H., Jr. (2000). Effects of aging and caloric restriction on IGF-I, IGF-I receptor, IGFBP-3 and IGFBP-4 gene expression in the rat stomach and colon. Regul. Pept. 89 (1-3), 37–44. doi: 10.1016/s0167-0115(00)00095-1
He, W., Li, X., Xu, S., Ai, J., Gong, Y., Gregg, J. L., et al. (2013). Aberrant methylation and loss of CADM2 tumor suppressor expression is associated with human renal cell carcinoma tumor progression. Biochem. Biophys. Res. Commun. 435 (4), 526–532. doi: 10.1016/j.bbrc.2013.04.074
Henson, E., Chen, Y., Gibson, S. (2017). EGFR family members’ regulation of autophagy is at a crossroads of cell survival and death in cancer. Cancers (Basel) 9 (4), 27–40. doi: 10.3390/cancers9040027
Hong, X., Qiao, S., Li, F., Wang, W., Jiang, R., Wu, H., et al. (2019). Whole-genome sequencing reveals distinct genetic bases for insulinomas and non-functional pancreatic neuroendocrine tumours: leading to a new classification system. Gut 0, 1–11. doi: 10.1136/gutjnl-2018-317233
Kaelin, W. G., Jr. (2004). The von Hippel-Lindau tumor suppressor gene and kidney cancer. Clin. Cancer Res. 10 (18 Pt 2), 6290S–6295S. doi: 10.1158/1078-0432.CCR-sup-040025
Kamburov, A., Stelzl, U., Lehrach, H., Herwig, R. (2013). The ConsensusPathDB interaction database: 2013 update. Nucleic Acids Res. 41 (Database issue), D793–D800. doi: 10.1093/nar/gks1055
Li, H., Durbin, R. (2009). Fast and accurate short read alignment with Burrows-Wheeler transform. Bioinformatics 25 (14), 1754–1760. doi: 10.1093/bioinformatics/btp324
Li, L., Yang, C., Zhao, Z., Xu, B., Zheng, M., Zhang, C., et al. (2015). Skewed T-helper (Th)1/2- and Th17/T regulatorycell balances in patients with renal cell carcinoma. Mol. Med. Rep. 11 (2), 947–953. doi: 10.3892/mmr.2014.2778
Linehan, W. M., Srinivasan, R., Schmidt, L. S. (2010). The genetic basis of kidney cancer: a metabolic disease. Nat. Rev. Urol. 7 (5), 277–285. doi: 10.1038/nrurol.2010.47
Liu, X., Wang, J., Sun, G. (2015). Identification of key genes and pathways in renal cell carcinoma through expression profiling data. Kidney Blood Press Res. 40 (3), 288–297. doi: 10.1159/000368504
Mermel, C. H., Schumacher, S. E., Hill, B., Meyerson, M. L., Beroukhim, R., Getz, G. (2011). GISTIC2.0 facilitates sensitive and confident localization of the targets of focal somatic copy-number alteration in human cancers. Genome Biol. 12 (4), R41. doi: 10.1186/gb-2011-12-4-r41
Mihara, M., Shintani, S., Nakahara, Y., Kiyota, A., Ueyama, Y., Matsumura, T., et al. (2001). Overexpression of CDK2 is a prognostic indicator of oral cancer progression. Jpn. J. Cancer Res. 92 (3), 352–360. doi: 10.1111/j.1349-7006.2001.tb01102.x
Nouhaud, F. X., Blanchard, F., Sesboue, R., Flaman, J. M., Sabourin, J. C., Pfister, C., et al. (2018). Clinical relevance of gene copy number variation in metastatic clear cell renal cell carcinoma. Clin. Genitourin Cancer 16 (4), e795–e805. doi: 10.1016/j.clgc.2018.02.013
Oldrini, B., Hsieh, W. Y., Erdjument-Bromage, H., Codega, P., Carro, M. S., Curiel-Garcia, A., et al. (2017). EGFR feedback-inhibition by Ran-binding protein 6 is disrupted in cancer. Nat. Commun. 8 (1), 2035. doi: 10.1038/s41467-017-02185-w
Posadas, E. M., Limvorasak, S., Sharma, S., Figlin, R. A. (2013). Targeting angiogenesis in renal cell carcinoma. Exp. Opin. Pharmacother. 14 (16), 2221–2236. doi: 10.1517/14656566.2013.832202
Robinson, D. R., Wu, Y. M., Lin, S. F. (2000). The protein tyrosine kinase family of the human genome. Oncogene 19 (49), 5548–5557. doi: 10.1038/sj.onc.1203957
Romero, D., O’Neill, C., Terzic, A., Contois, L., Young, K., Conley, B. A., et al. (2011). Endoglin regulates cancer-stromal cell interactions in prostate tumors. Cancer Res. 71 (10), 3482–3493. doi: 10.1158/0008-5472.CAN-10-2665
Sato, Y., Yoshizato, T., Shiraishi, Y., Maekawa, S., Okuno, Y., Kamura, T., et al. (2013). Integrated molecular analysis of clear-cell renal cell carcinoma. Nat. Genet. 45 (8), 860–867. doi: 10.1038/ng.2699
Schiewer, M. J., Knudsen, K. E. (2014). Transcriptional roles of PARP1 in cancer. Mol. Cancer Res. 12 (8), 1069–1080. doi: 10.1158/1541-7786.MCR-13-0672
Secrier, M., Li, X., de Silva, N., Eldridge, M. D., Contino, G., Bornschein, J., et al. (2016). Mutational signatures in esophageal adenocarcinoma define etiologically distinct subgroups with therapeutic relevance. Nat. Genet. 48 (10), 1131–1141. doi: 10.1038/ng.3659
Sigismund, S., Avanzato, D., Lanzetti, L. (2018). Emerging functions of the EGFR in cancer. Mol. Oncol. 12 (1), 3–20. doi: 10.1002/1878-0261.12155
Tulin, A. (2011). Re-evaluating PARP1 inhibitor in cancer. Nat. Biotechnol. 29 (12), 1078–1079. doi: 10.1038/nbt.2058
Ueno, K., Hirata, H., Majid, S., Tabatabai, Z. L., Hinoda, Y., Dahiya, R. (2011). IGFBP-4 activates the Wnt/beta-catenin signaling pathway and induces M-CAM expression in human renal cell carcinoma. Int. J. Cancer 129 (10), 2360–2369. doi: 10.1002/ijc.25899
Varela, I., Tarpey, P., Raine, K., Huang, D., Ong, C. K., Stephens, P., et al. (2011). Exome sequencing identifies frequent mutation of the SWI/SNF complex gene PBRM1 in renal carcinoma. Nature 469 (7331), 539–542. doi: 10.1038/nature09639
Varney, M. L., Singh, R. K. (2015). VEGF-C-VEGFR3/Flt4 axis regulates mammary tumor growth and metastasis in an autocrine manner. Am. J. Cancer Res. 5 (2), 616–628.
Waddell, N., Pajic, M., Patch, A. M., Chang, D. K., Kassahn, K. S., Bailey, P., et al. (2015). Whole genomes redefine the mutational landscape of pancreatic cancer. Nature 518 (7540), 495–501. doi: 10.1038/nature14169
Wang, K., Li, M., Hakonarson, H. (2010). ANNOVAR: functional annotation of genetic variants from high-throughput sequencing data. Nucleic Acids Res. 38 (16), e164. doi: 10.1093/nar/gkq603
Wang, Y., Waters, J., Leung, M. L., Unruh, A., Roh, W., Shi, X., et al. (2014). Clonal evolution in breast cancer revealed by single nucleus genome sequencing. Nature 512 (7513), 155–160. doi: 10.1038/nature13600
Xu, X., Hou, Y., Yin, X., Bao, L., Tang, A., Song, L., et al. (2012). Single-cell exome sequencing reveals single-nucleotide mutation characteristics of a kidney tumor. Cell 148 (5), 886–895. doi: 10.1016/j.cell.2012.02.025
Yang, B., Zhang, L., Cao, Y., Chen, S., Cao, J., Wu, D., et al. (2017). Overexpression of lncRNA IGFBP4-1 reprograms energy metabolism to promote lung cancer progression. Mol. Cancer 16 (1), 154. doi: 10.1186/s12943-017-0722-8
Yarden, Y. (2001). The EGFR family and its ligands in human cancer. signalling mechanisms and therapeutic opportunities. Eur. J. Cancer 37 Suppl 4, S3–S8. doi: 10.1016/s0959-8049(01)00230-1
Yilmaz, S., Singh, A. K. (2012). Single cell genome sequencing. Curr. Opin. Biotechnol. 23 (3), 437–443. doi: 10.1016/j.copbio.2011.11.018
You, Z., Xin, Y., Liu, Y., Sun, J., Zhou, G., Gao, H., et al. (2012). Chmp1A acts as a tumor suppressor gene that inhibits proliferation of renal cell carcinoma. Cancer Lett. 319 (2), 190–196. doi: 10.1016/j.canlet.2012.01.010
Keywords: copy number variations, single-cell exome sequencing, clear-cell renal cell carcinoma, receptor protein tyrosine kinase, signaling transduction pathway
Citation: Zhou W, Yang F, Xu Z, Luo M, Wang P, Guo Y, Nie H, Yao L and Jiang Q (2020) Comprehensive Analysis of Copy Number Variations in Kidney Cancer by Single-Cell Exome Sequencing. Front. Genet. 10:1379. doi: 10.3389/fgene.2019.01379
Received: 23 September 2019; Accepted: 17 December 2019;
Published: 23 January 2020.
Edited by:
Lei Deng, Central South University, ChinaReviewed by:
Hao Lin, University of Electronic Science and Technology of China, ChinaJuan Wang, Inner Mongolia University, China
Jingpu Zhang, Henan University of Urban Construction, China
Copyright © 2020 Zhou, Yang, Xu, Luo, Wang, Guo, Nie, Yao and Jiang. This is an open-access article distributed under the terms of the Creative Commons Attribution License (CC BY). The use, distribution or reproduction in other forums is permitted, provided the original author(s) and the copyright owner(s) are credited and that the original publication in this journal is cited, in accordance with accepted academic practice. No use, distribution or reproduction is permitted which does not comply with these terms.
*Correspondence: Huan Nie, nh1212@hit.edu.cn; Lifen Yao, yaolifen_2015@sina.com; Qinghua Jiang, qhjiang@hit.edu.cn
†These authors have contributed equally to this work