 S. P. Dixit1*Sanjeev Singh1
 Indrajit Ganguly1
 Avnish Kumar Bhatia1Anurodh Sharma1
 N. Anand Kumar2Ajay Kumar Dang3
 S. Jayakumar1
- 1Animal Genetics Division, ICAR—National Bureau of Animal Genetic Resources, Karnal, India
- 2Animal Genetics & Breeding Division, ICAR—National Dairy Research Institute, Karnal, India
- 3Animal Physiology Division, ICAR-National Dairy Research Institute, Karnal, India
Genome-wide runs of homozygosity (ROH) are suitable for understanding population history, calculating genomic inbreeding, deciphering genetic architecture of complex traits and diseases as well as identifying genes linked with agro-economic traits. Autozygosity and ROH islands, genomic regions with elevated ROH frequencies, were characterized in 112 animals of seven Indian native cattle breeds (B. indicus) using BovineHD BeadChip. In total, 4138 ROH were detected. The average number of ROH per animal was maximum in draft breed, Kangayam (63.62 ± 22.71) and minimum in dairy breed, Sahiwal (24.62 ± 11.03). The mean ROH length was maximum in Vechur (6.97 Mb) and minimum in Hariana (4.04 Mb). Kangayam revealed the highest ROH based inbreeding (FROH> 1Mb = 0.113 ± 0.059), whereas Hariana (FROH> 1Mb = 0.042 ± 0.031) and Sahiwal (FROH> 1Mb = 0.043 ± 0.048) showed the lowest. The high standard deviation observed in each breed highlights a considerable variability in autozygosity. Out of the total autozygous segments observed in each breed except Vechur, > 80% were of short length (< 8 Mb) and contributed almost 50% of the genome proportion under ROH. However, in Vechur cattle, long ROH contributed 75% of the genome proportion under ROH. ROH patterns revealed Hariana and Sahiwal breeds as less consanguineous, while recent inbreeding was apparent in Vechur. Maximum autozygosity observed in Kangayam is attributable to both recent and ancient inbreeding. The ROH islands were harbouring higher proportion of QTLs for production traits (20.68% vs. 14.64%; P≤ 0.05) but lower for reproductive traits (11.49% vs. 15.76%; P≤ 0.05) in dairy breeds compared to draft breed. In draft cattle, genes associated with resistant to diseases/higher immunity (LYZL1, SVIL, and GPX4) and stress tolerant (CCT4) were identified in ROH islands; while in dairy breeds, for milk production (PTGFR, CSN1S1, CSN2, CSN1S2, and CSN3). Significant difference in ROH islands among large and short statured breeds was observed at chromosome 3 and 5 involving genes like PTGFR and HMGA2 responsible for milk production and stature, respectively. PCA analysis on consensus ROH regions revealed distinct clustering of dairy, draft and short stature cattle breeds.
Introduction
Runs of homozygosity (ROH), the indicator of genomic autozygosity, may be defined as two contiguous identical by descent (IBD) stretches of homozygous genotypes/segments/haplotypes of a common ancestor in an individual inherited from both of its parents (Gibson et al., 2006).
This autozygosity may arise in inbred as well as non-inbred populations due to several population phenomena like inbreeding, genetic drift, consanguineous mating, population bottleneck, as well as natural and artificial selection (Falconer and Mackay, 1996; Curik et al., 2014). Scanning of genome for ROH using high density SNP arrays in cattle has been found to be effective in discriminating non-autozygotic identical by state (IBS) segments from autozygotic (IBD) (Howrigan et al., 2011). Therefore, the identification and characterization of ROH may help in revealing population structure and demographic history evolved over time as well as unveiling footprints of natural and/or human made selection. The length and frequency of ROH are two important parameters for determining causative forces of genomic change.
Since recombination events interrupt lengthy genomic segments, it is anticipated that longer ROH will appear as a result of recent inbreeding in the pedigree. A negative correlation existed between length of the runs and number of generations back the selection or inbreeding event occurred (Howrigan et al., 2011). Consequently, ROH may be useful for ascertaining signatures of recent and/or ancient selection events (Purfield et al., 2012). Although, recombination events are random and distribution of ROH across samples is likely to be exceptionally heterogeneous; however, selection leaves certain peaks across the genome. These peaks in terms of frequency of ROH are called hotspots and considered to be the signal of selective sweeps (Curik et al., 2014). These hotspots (stretches of homozygous sequences) shared by large proportion of individuals in a population are characterized as ROH islands, the footprints of selection event. ROH may also be an accurate estimator of inbreeding coefficient and has recently been used in calculating inbreeding coefficient of Gyr cattle (Peripolli et al., 2018). The selection sweeps were also studied using ROH information in cattle (Iacolina et al., 2016).
Cattle breeds in India have evolved over the centuries under diverse agro-climatic conditions as well as breeding and management practices for the purpose of different specialized functions such as dairy, draft and dual (dairy and draft). Consequently, these cattle harbouring putative signatures for specific functions may serve a great reservoir of genetic pool for identification of genes under selection particularly those in ROH regions. Here, three dairy breeds (Sahiwal, Gir, Tharparkar) of sub-tropical hot arid regions, two dual breeds viz. Hariana of sub-tropical hot arid region, and Ongole of tropical semi-arid region were considered. One draft breed, Kangayam of tropical semi-arid region, and one short statured cattle breed, Vechur of tropical hot humid region were also included. All these breeds except Vechur are international breeds, and are bred in good number in different countries across the continents.
The present study aimed at delineating autozygosity by identifying and characterizing genome wide ROH patterns in seven Indian native cattle breeds using high density SNP genotyping array (Illumina BovineHD BeadChip). Further, the gene content in ROH regions of these diverse breeds (dairy, dual, draft, large, and small) was also explored to apprehend selection/adaptive footprints.
Materials and Methods
Animal Resources, SNP Genotyping, and Quality Control
A total of 132 samples of Sahiwal (SW, n = 19), Tharparkar (TR, n = 17), Gir (GR, n = 16), Ongole (OG, n = 24), Hariana (HR, n = 18), Kangayam (KG, n = 18) and Vechur (VC, n = 20) breeds of cattle were incorporated. The random blood samples were collected from different farms in the country in compliance with the guidelines and regulations of the Institutional Animal Ethics Committee (IAEC), National Bureau of Animal Genetics Resources (ICAR-NBAGR), Karnal (Supplementary Figure S1). After isolation of genomic DNA, estimation of quality and quantity was carried out as described earlier (Dash et al., 2018). DNA samples were genotyped at Sandor Lifesciences Pvt. Ltd., Hyderabad, India by using BovineHD BeadChip (Illumina, Inc. San Diego, CA, USA) following standard procedures of the manufacturer. The PLINK v 1.9 (Purcell et al., 2007; Chang et al., 2015) software was used for quality filtration of genotyped data. Only the SNPs located on autosomes were considered for analysis. SNPs that had call rate (CR) ≤ 90%, minor allele frequency (MAF) ≤ 0.05 and HWE (P ≤0.001) were excluded. Further, samples with more than 10% missing genotypes were also omitted.
Measure of Runs of Homozygosity and Their Distribution
ROH was estimated for each individual using PLINK v 1.9 (Purcell et al., 2007; Chang et al., 2015). Although, no linkage disequilibrium (LD) based pruning was performed; however, the minimum ROH length was set to 1 Mb for excluding short and common ROH that appeared across genome due to LD (Purfield et al., 2012). The following PLINK parameters and thresholds (Purcell et al., 2007) were applied to define a ROH: i) sliding window of 50 SNPs across the genome; ii) proportion of homozygous overlapping windows was 0.05; iii) minimum number of consecutive SNPs included in a ROH was 100; iv) minimum length of a ROH was set to 1 Mb; v) maximum gap between consecutive homozygous SNPs was 1000 kb; vi) a density of one SNP per 50 kb; and vii) maximum of five SNPs with missing genotypes and up to one heterozygous genotype were allowed in a ROH. All ROH were grouped into five classes as per the nomenclature of Kirin et al. (2010) and Ferenčaković et al. (2013a; 2013b): 1–2, 2–4, 4–8, 8–16, and >16 Mb. For every individual in each of the seven breeds, and for each ROH length category, the mean number of ROH per individual (MNROH), the average length of ROH (ALROH) and the total number of ROH per breed (nROH) were estimated. The percentage of chromosomes covered by ROH was also calculated. First, the mean ROH length was calculated by summing all ROH (Mb) on a chromosome and dividing by the number of individuals that had ROH on that chromosome; the mean ROH length was then divided by the length of the chromosome in Mb.
Alternative to PLINK, an R package called “detectRUNS” was additionally used to explore genome wide ROH and the results were compared. It makes use of two methods: 1) sliding-window and 2) consecutive runs. The sliding-window based technique is comparable to PLINK (Purcell et al., 2007); whereas, the consecutive runs is a window free technique to scan the genome SNP by SNP (Marras et al., 2015).
Genomic Inbreeding Coefficients
PLINK v 1.9 (Purcell et al., 2007; Chang et al., 2015) was used to estimate the genomic inbreeding coefficients (FROH and FHOM). Inbreeding coefficient based on ROH (FROH) for each animal was calculated according to McQuillan et al. (2008):
where LROH represents total length of all ROH in an individual genome while LAUTO refers to the autosomal genome length covered by SNPs included in the array. For each animal FROH (FROH > 1Mb and FROH > 8 Mb) was calculated according to ROH distribution within the length categories: >1 and >8 Mb. Inbreeding based on the observed versus expected number of homozygous genotypes (FHOM) was calculated using PLINK v1.90 by computing observed and expected autosomal homozygous genotypes counts for each sample as follows:
Spearman’s correlation coefficients among inbreeding measures (FROH and FHOM) were also estimated.
Detection and Analyses of Common Runs of Homozygosity
Overlapping ROH were analyzed by PLINK software. Samples were analyzed overall, breed wise, and utility wise (dairy vs. draft). The number of consensus samples was identified in each group and ROH island frequencies were calculated by dividing the number of consensus samples with total samples in each group. To identify genomic regions most commonly associated with ROH, the samples were analyzed using Manhattan plots of overlapping ROH% across the autosomes for each group. Top 20 ROH islands having a frequency of at least 20% were identified in each group from Manhattan Plots. NCBI map viewer of the bovine UMD3.1.1 (https://www.ncbi.nlm.nih.gov/genome/gdv/) was used to identify genes underlying ± 2 MB region on either side of consensus region of top 20 ROH islands. Cattle QTL database (https://www.animalgenome.org/QTLdb/cattle) was explored to find the effect of top 20 ROH islands on the underlying QTLs. Test of two proportions was carried out to find the test of significance between the numbers of QTLs affecting the two contrasting groups (dairy vs. draft) under six different traits using XLSTAT. Top five ROH hot spots from the overall ROH group were explored to find the frequency of ROH islands at analogous positions in each cattle breed. Test of K proportion (XLSTAT) was carried out to find out the significant difference of ROH frequencies among the breeds. Gene ontology and pathway analyses were carried out by PANTHER version 13.1 software tool (http://pantherdb.org). Pathway analysis was also carried out by Reactome pathway (https://reactome.org).
Structuring of Cattle
Genomic relationship matrix-based principal component analysis (PCA) was performed using the R software “factoextra” (https://cran.r-project.org) to better evaluate the composition of the breeds and to define genetic groups for further downstream calculations. Top 170 ROH regions (loci) of the total samples were selected with a frequency of at least 12.5% for PCA. Three components were extracted out of 6 using Kaiser Rule criterion (Johnson and Wichern, 1982) to determine the number of significant components. Further, number of loci contributing maximum to the total variance were scaled down. The different graphs and plots were generated representing the contribution of the loci and individuals to the total genetic variation.
Results
Filtration, Polymorphism, and Genetic Diversity Among the Breeds
Out of 132 animals, 20 were removed due to low genotyping (MIND > 0.1). The overall genotyping rate for the remaining 112 animals was 0.99. The quality control measures led to final data on 112 cattle belonging to Sahiwal (13), Tharparkar (17), Gir (15), Ongole (17), Hariana (18), Kangayam (16), and Vechur (16) breeds. Minor allele frequency across the breeds ranged from 0.23 (Kangayam) to 0.26 (Vechur) and observed heterozygosity on an average was 0.35 in all the studied samples (data not shown).
ROH Distribution and Genomic Inbreeding
A total of 4138 homozygous segments were identified. The mean number of ROH per animal was highest in draft breed, Kangayam (63.62 ± 22.71 with a range of 11- 92) and lowest in Sahiwal (24.62 ± 11.03 with a range of 12–49). Although, average length of ROH (ALROH) was maximum in Vechur (6.97 Mb) and minimum in Hariana (4.04 Mb) (Table 1); however, mean genome length under ROH was highest in Kangayam (283.74 Mb; 11.30%) and lowest in Hariana (106.61 Mb; 4.24%). The longest ROH segment (80.22 Mb harbouring 17050 SNPs) was observed on chromosome 6 in Tharparkar (Supplementary Table S1). The highest number of ROH (n= 145) was observed on BTA 5 in dairy (SW, TP, GR) and dual (HR) breeds but on BTA 2 in draft breed (n= 68). Major fraction of chromosome residing in ROH was observed on BTA 29 & BTA 15 (15.49% & 15.18%, respectively) in dairy and dual breeds but on BTA 13 (22.48%) in draft cattle (Figure 1). The number and percentage coverage of chromosomal length by ROH varied from breed to breed (Supplementary Figure S2).
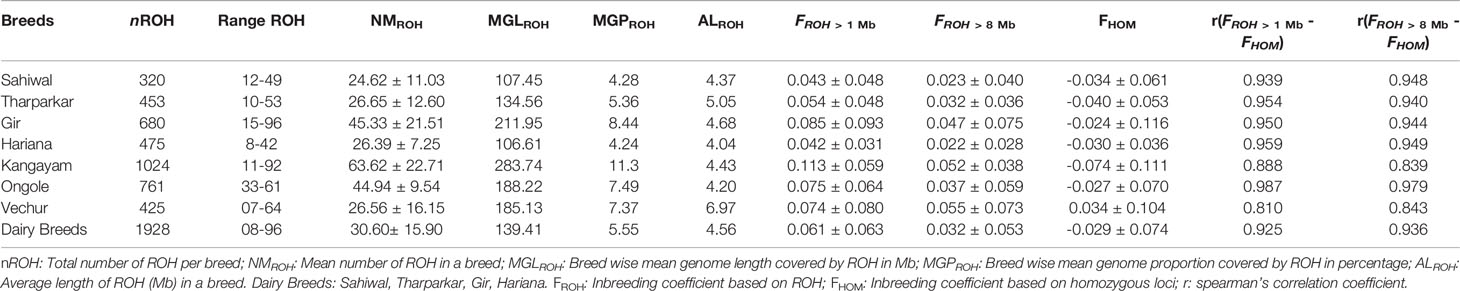
Table 1 Genomic distributions and descriptive statistics of ROH in different Bos indicus breeds.
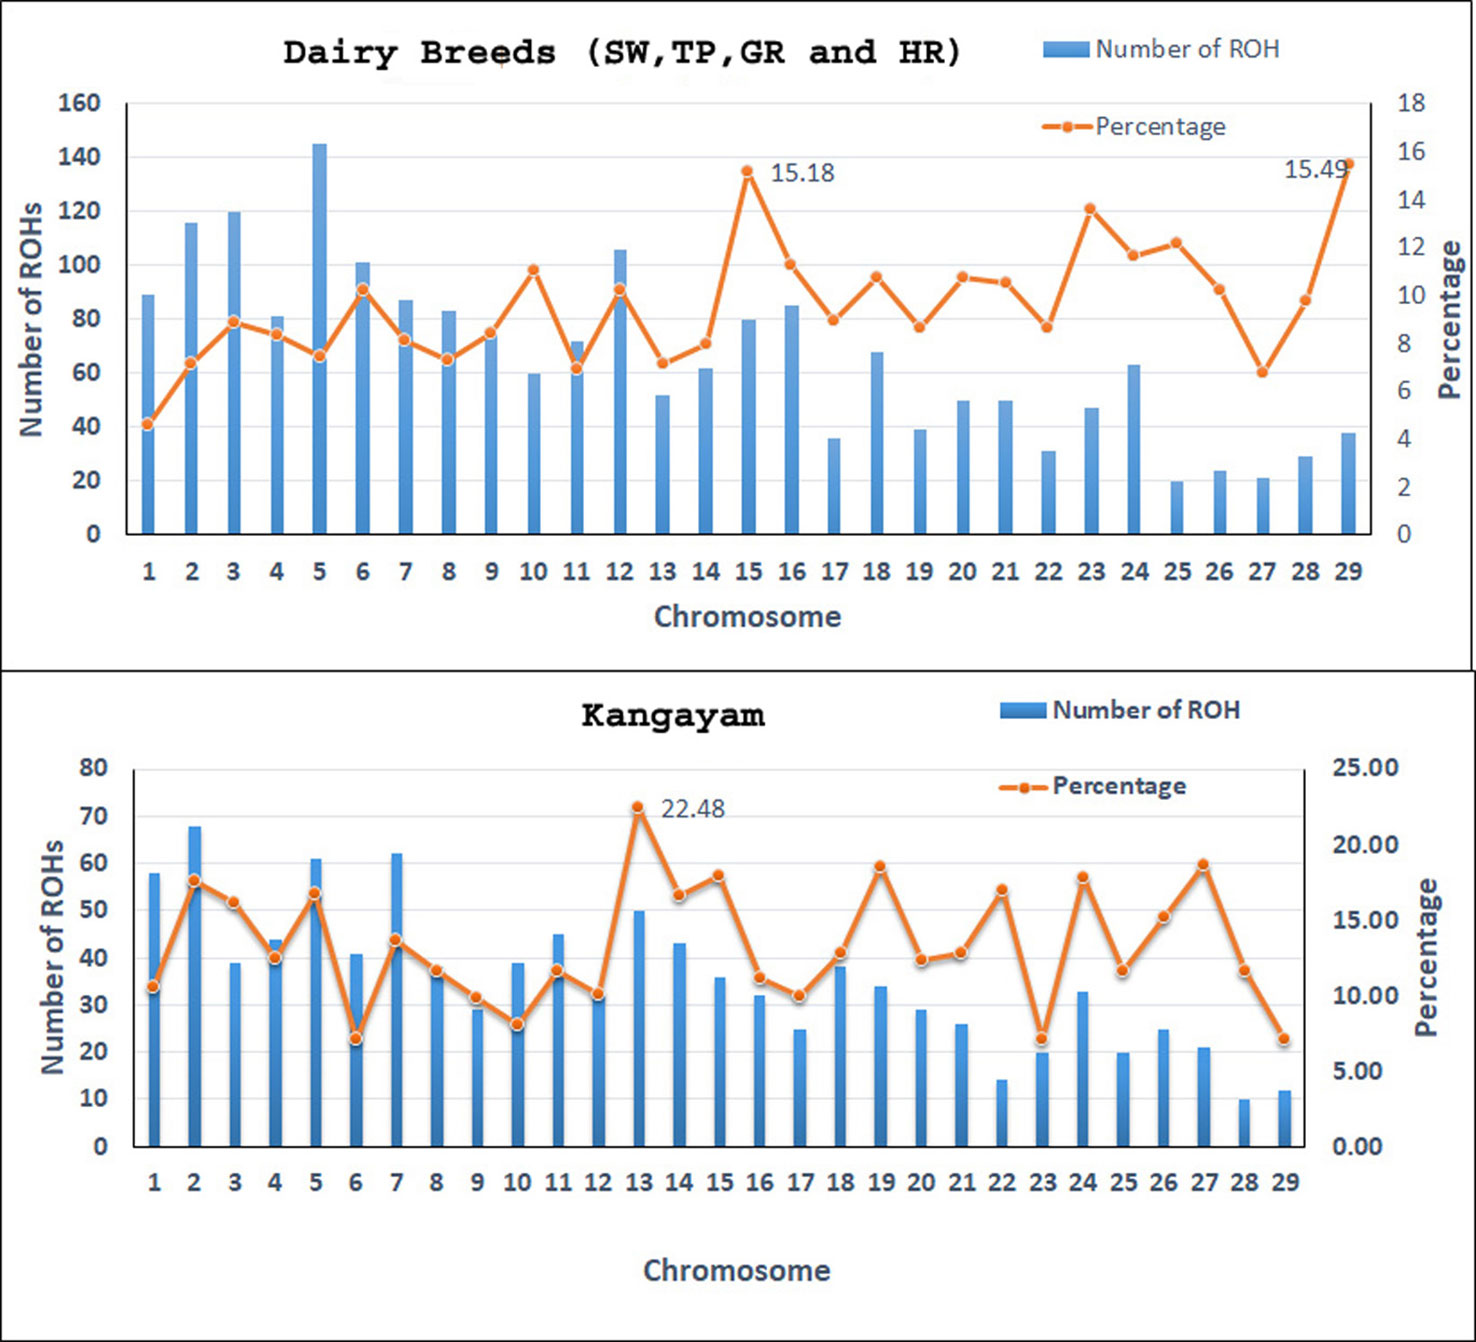
Figure 1 The number of ROH per chromosome and percentage coverage. The bars exhibit the total number of ROH per chromosome identified in the 112 animals. The line shows the average percentage of ROH for every chromosome. To determine the percentage of ROH per chromosome, the mean ROH length was calculated by adding all ROH (in Mb) on a chromosome and then dividing by the number of animals that had ROH on that chromosome. The mean ROH length was then divided by the chromosome length (in Mb) and transformed to percentage. SW, Sahiwal; TP, Tharparkar; GR, Gir; HR, Hariana.
The total number and length of genome under ROH for each individual in a breed are presented in Figure 2. The majority of the individuals (69.64%) clustered close to the origin of coordinates due to abundance of shorter ROH (Figure 2). The total length of ROH across genome was <176 Mb in most of the individuals (84.38%) in dairy breeds but varied between 200-400 Mb in draft breed (62.5%) (Figure 2). There were seven individuals with ROH length between 400 to 550 Mb and three individuals (one each from GR, OG, and VC) with more than 700 Mb of their autosomes covered by ROH (Supplementary Table S1). The proportion of the autosome under ROH varied both within and between breeds (Figure 3). Sahiwal had a tendency towards smaller proportion of genome under ROH but Kangayam towards larger. The later showed higher inter-animal variability (12.63 Mb to 543.81 Mb). All the 112 individuals of seven cattle breeds had at least one ROH in 1–2 Mb category. About 95% animals had at least one ROH between 2 and 4 Mb in length. The frequency of ROH in the different categories varied among the breeds (Figure 4, Table 2). Out of the total autozygous segments observed in each breed except Vechur, > 80% of the ROH were of short length (< 8 Mb) and contributed almost 50% of the genome coverage of ROH under this category. However, in Vechur cattle, long ROH (> 8 Mb) contributed 75% of the genome coverage under ROH (Tables 1 and 2).
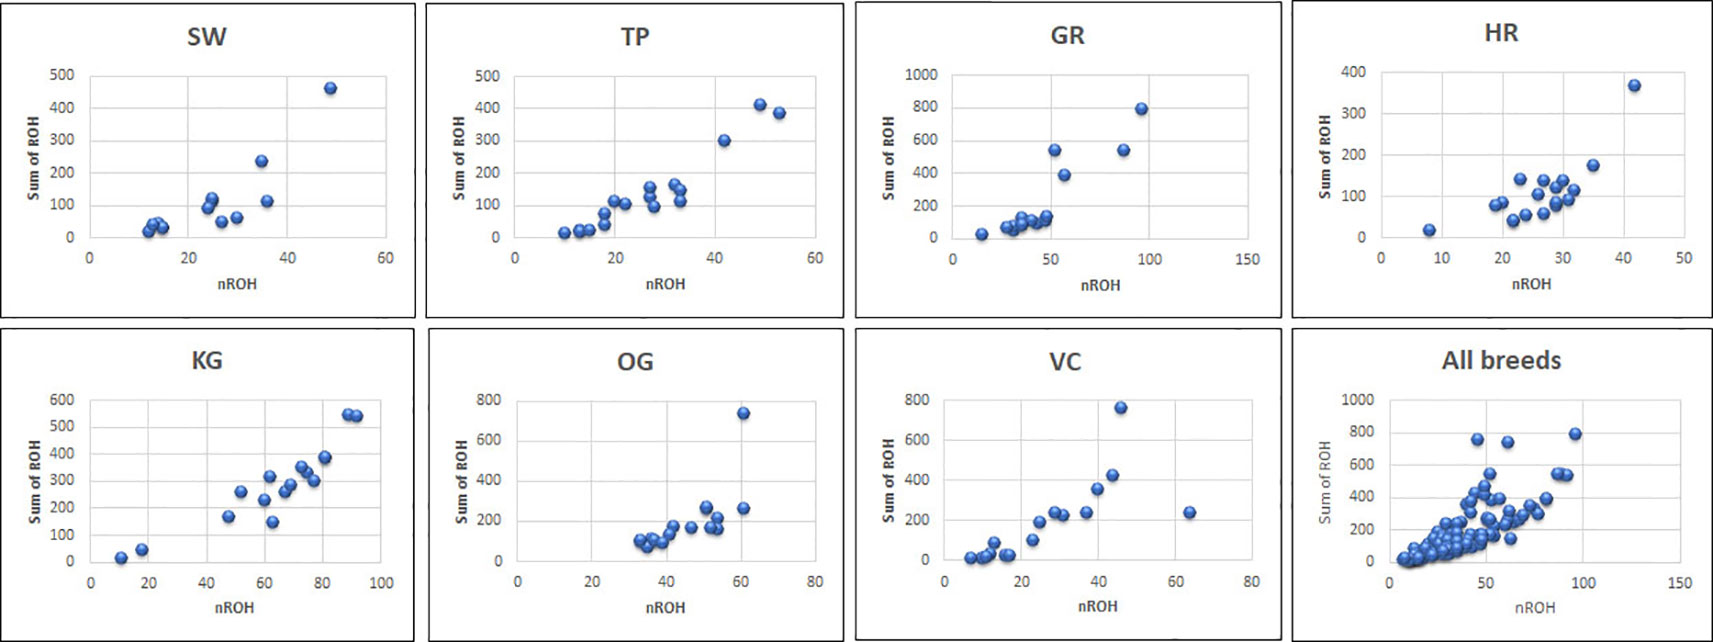
Figure 2 The total number of ROH and length of genome under ROH for each individual in a breed. SW, Sahiwal; TP, Tharparkar; GR, Gir; HR, Hariana; KG, Kangayam; OG, Ongole; VC, Vechur.
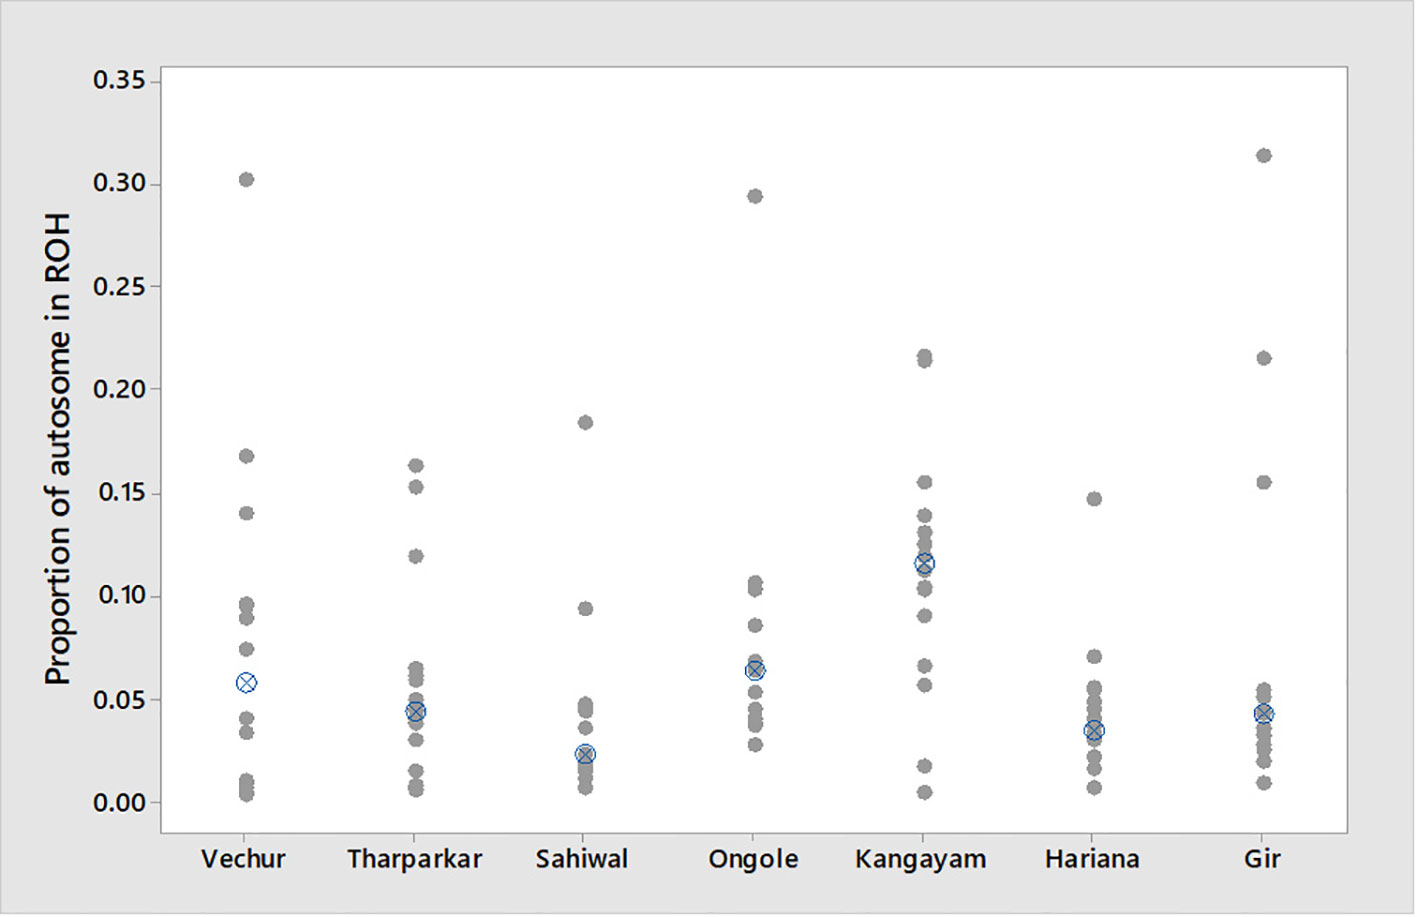
Figure 3 Individual value plot displaying proportion of autosome covered in runs of homozygosity (ROH) per animal. The crossed circle shows the median ROH value of each breed.
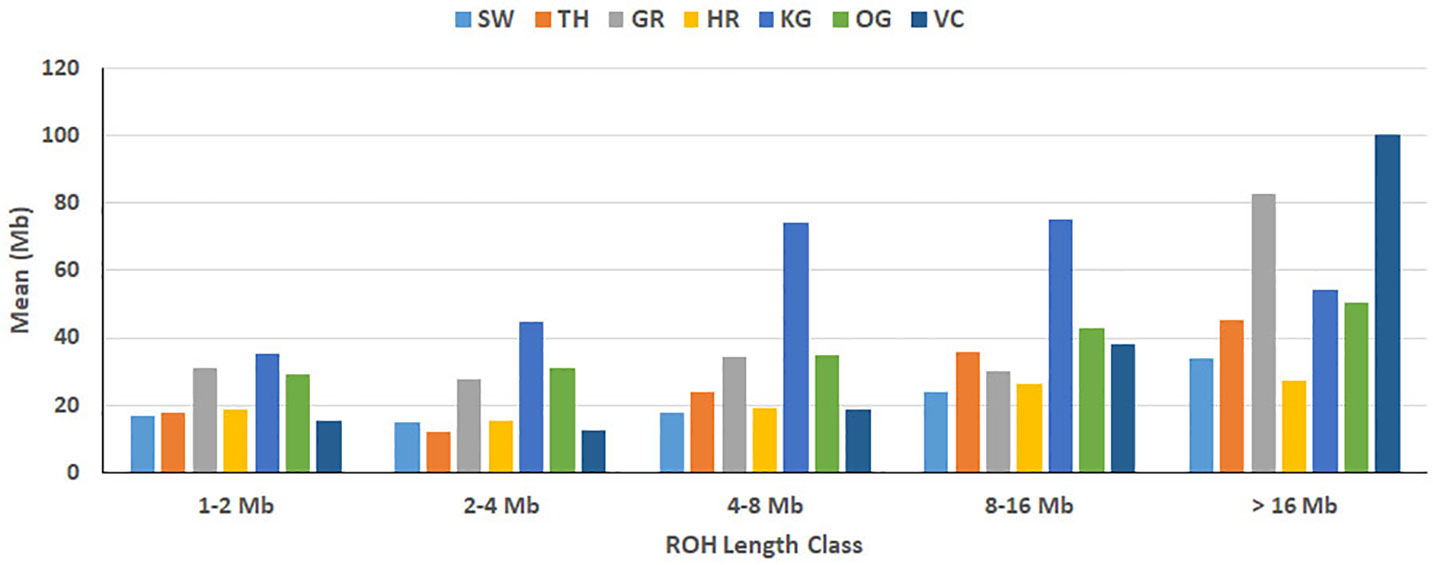
Figure 4 Breed-wise mean of sum of ROH. Within each ROH length category, the sum of ROH (in Mb) was calculated per animal and averaged breed-wise. Breeds from left to right are Sahiwal (SW), Tharparkar (TP), Gir (GR), Hariana (HR), Kangayam (KG), Ongole (OG), and Vechur (VC).
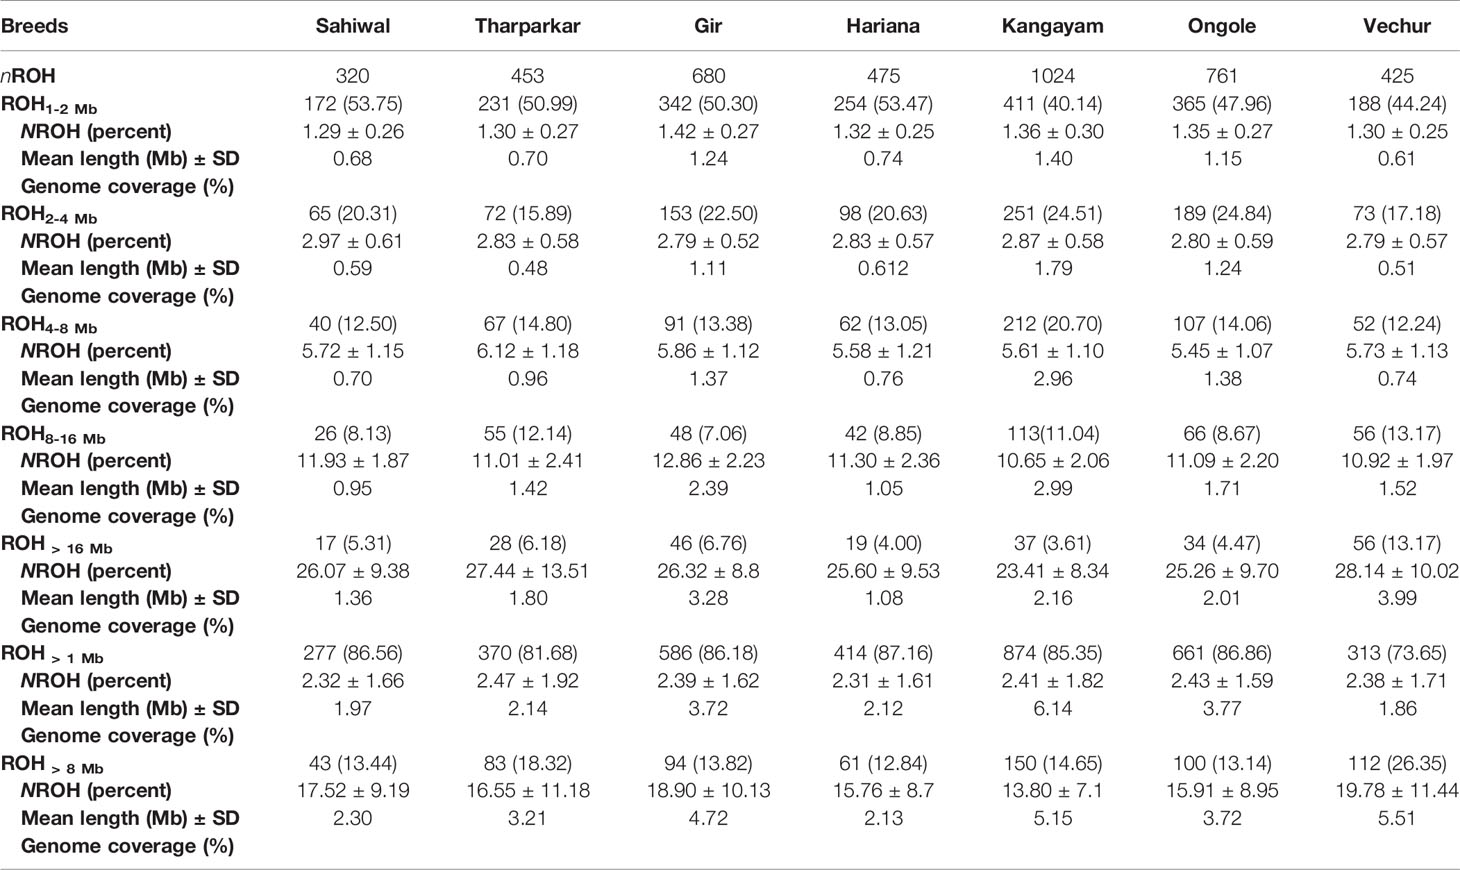
Table 2 Statistics of ROH observed in diverse Indian native cattle breeds (Bos indicus) under different length class (ROH1-2 Mb, ROH2-4 Mb, ROH4-8 Mb, ROH8-16 Mb, ROH > 16 Mb, ROH > 1 Mb and ROH > 8 Mb).
Average genomic inbreeding (FROH> 1 Mb) coefficient of Kangayam cattle was higher compared to that of Gir, Ongole and Vechur. On the other hand, FROH> 8Mb of Vechur was higher than that of Kangayam and Gir. However, the inbreeding coefficient of Hariana and Sahiwal was lower as compared to other breeds. The correlations of FHOM with FROH> 1 Mb and FROH> 8 Mb ranged from 0.810 to 0.959 (FHOM with FROH> 1 Mb) and 0.839 to 0.979 (FHOM with FROH> 8 Mb) across the breeds. (Table 1). The genomic inbreeding (FROH> 1 Mb) values of different breeds/groups are presented in Supplementary Figure S3. The slidingRUNS results were similar to the PLINK output (Table 2). On the contrary, slight variation in consecutiveRUNS results were observed because of different algorithm (SNP by SNP approach) being used. However, FROH calculated using PLINK, consecutiveRUNS and slidingRUNS revealed similar patterns in all the breeds (Supplementary Figure S3).
Genomic Regions Within Overlapping ROH
Principal component analysis based on entire SNP data clustered Hariana, traditionally defined as a dual breed, with other dairy breeds (Supplementary Figure S4). Hence in group wise analysis, Hariana was included in dairy group. PCA based clustering was in consonance with breeding of Hariana for higher milk production at the farm for several generations.
The Manhattan plots of overlapping ROH % for each group are presented in Supplementary Figure S5. The top 20 ROH islands of dairy breeds (SW, TH, GR, and HR) were harboring significantly (P≤ 0.05) higher proportion of QTL influencing production traits but lower proportion for reproduction traits compared to the draft breed (KG) (Table 3). The proportion of QTL in ROH islands were also higher for milk production but lower for meat and carcass traits, however, the differences were non-significant between both the groups. The frequency of top five ROH islands across different chromosomes in each breed indicated significant breed differences at chromosome 3, 5, and 12 (Table 4). The ROH islands in Vechur cattle were absent at chromosomes 3 and 5. The genes identified in these regions were PTGFR (Prostaglandin F Receptor) and HMGA2 (High Mobility Group AT-Hook 2) responsible for the milk production and short stature, respectively. There were also significant differences between Gir and Hariana cattle for enriched ROH islands. The detailed functional annotation of genes identified in top 20 ROH islands of dairy and draft breeds is presented in supplementary file (Supplementary Table S2). Some of the important genes identified in draft cattle (KG) were SVIL (Supervillin), LYZL1 (Lysozyme like1), ZEB1 (Zinc Finger E-Box Binding Homeobox 1), and GPX4 (Glutathione Peroxidase 4); and those in dairy breeds were PTGFR, ZAR1L (Zygote arrest-1 like), IFI44 (interferon-induced protein 44), and HELB (DNA helicase B).
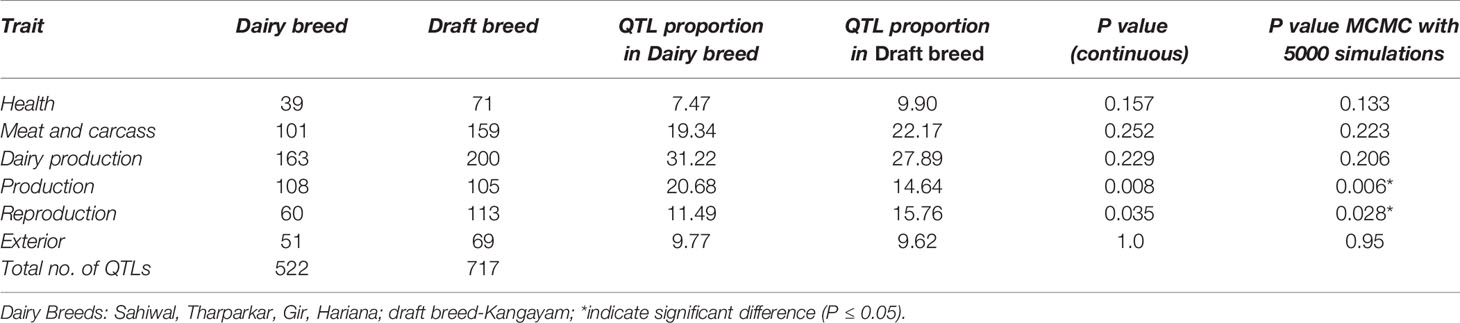
Table 3 Percentage of total QTLs underlying top 20 ROH islands in dairy and draft breeds.
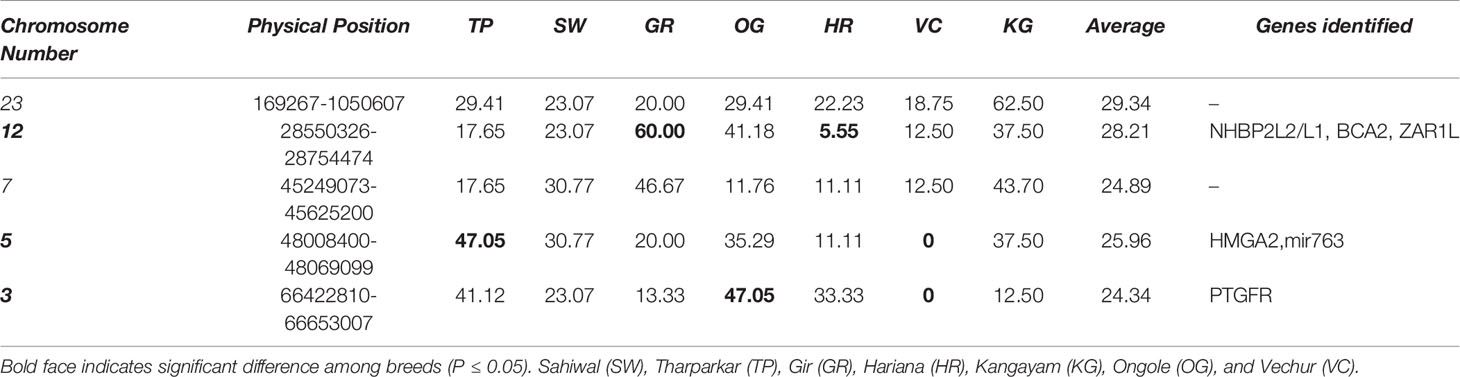
Table 4 Test of K proportion for the top five ROH hot spots (%) in different breeds of cattle based on overall samples.
Gene ontology (GO) analysis identified several enriched GO terms for the ROH gene list in dairy as well as draft cattle (Table 5).The detailed functions of genes identified from top 20 ROH islands ( ± 2MB) of two groups (dairy and draft) are given in Supplementary Table S3. Whereas, genes in the enriched GO and pathways analyses are shown in Supplementary Table S4. In both dairy and draft cattle, the G- coupling receptor signaling pathway (Table 5) harboring genes for stimuli, smell, cellular defense response and immune system process were under represented. Panther molecular and reactome pathways were not significantly enriched for any specific category of dairy cattle. However, in draft cattle (Kangayam) two reactome pathways were significantly affected viz., activation of pre-replicative complex with a fold difference of 6.91 (P< 4.02 x10⁻²) and G2/M transition with a fold difference of 3.14 (P< 4.35 x10⁻²) (Table 5). A total of seven and 16 genes were observed in the two groups, respectively.
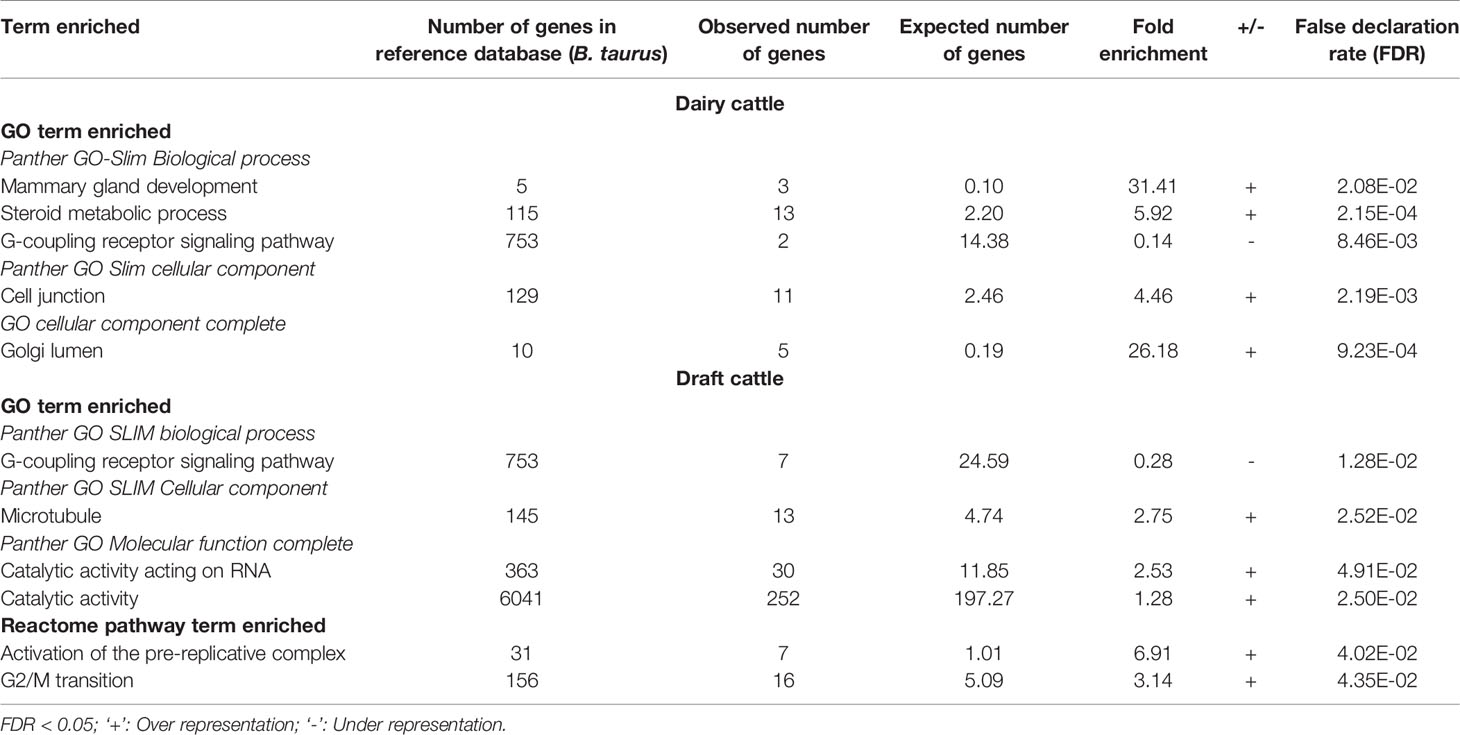
Table 5 Gene ontology and reactome pathway analyses for the enrichment of GO and reactome pathway terms in dairy and draft cattle.
Dairy Breed
In dairy cattle, several genes related to mammary gland development were observed in highly enriched GO terms for biological process, metabolic process and cellular component (Table 5). For the biological process, Kappa-casein (CSN3) and COP9 signalosome complex subunit 3 (COPS3) were found with highest fold enrichment (31.41). Similarly, 13 genes of steroid metabolic process had an enrichment of 5.92. Panther GO slim cellular component revealed 11 genes with a fold enrichment of 4.46 for cell junction. The key genes were from Cadherin (CADH1, CADH3, CADH5, and CADH11) and Myosin (MYO1A and MYO1B) families. GO cellular component complete revealed five genes with a fold enrichment of 26.18 for Golgi lumen.
Draft Breed
Under cellular component (microtubule), 13 genes were involved in cytoskeleton structuring and microtubular functions. 30 genes with catalytic activity acting on RNA (fold enrichment 2.53) and 252 genes with catalytic activity (1.28 fold) were also observed under GO molecular function complete (Table 5). In this group, LYZL1 (Lysozyme like 1; associated with body defense mechanism and disease resistance) as well as genes like CYB561 (Cytochrome B561) and GSR (glutathione reductase, mitochondrial), involved in oxidoreductase activity and antioxidant property, respectively were observed.
Structuring of Cattle
The structuring of native cattle breeds based on top 170, 92, and 10 contributing ROH islands is presented in Supplementary Figure S6. When the number of loci (consensus ROH regions) contributing maximum to the total variance was scaled down from 170 to 92 and 10, similar results were obtained. First three component explained 99% of cumulative variation in the data with first component of PCA explaining 58% of the total variation (Supplementary Figure S6c). The analysis revealed that Kangayam and Tharparkar contributed maximum to the total variance followed by Vechur, Gir, Sahiwal, Hariana, and Ongole. Kangayam, being a draft breed, was most distinct from rest of the breeds. The dwarf breed, Vechur was also separated from rest of the breeds. All other breeds viz. Sahiwal, Gir, Tharparkar, Hariana, and Ongole were having their own identities and could not be clustered together.
Discussion
ROH Distribution and Genomic Inbreeding
In the present investigation, BovineHD BeadChip was used to characterize autozygosity and ROH islands in seven Indian native cattle breeds (B. indicus). Minimum of 13 (SW) to maximum 18 (HR) animals per breed remained after quality filtration. For diversity analysis, the existing number of samples in each breed greater than 12 was adequate and in consonance with other studies (Upadhyay et al., 2017; Colli et al., 2018). It has also been indicated that sample size as small as 4 - 6 (Willing et al., 2012) and polymorphic SNP filtration (Colli et al., 2018; Utsunomiya et al., 2019) can mitigate ascertainment bias as long as the number of markers is sufficiently large as those under the current investigation. Earlier, in Indian dairy cattle breeds, we also tested bovine high-density genotyping array to assess its feasibility for Zebu cattle genomic studies (Dash et al., 2018). The genome proportion under autozygosity was almost equal in short and long ROH in all the breeds except Vechur. The autozygosity ranged from 4.24%–11.3% of the genome. This highlighted low ancient and recent autozygosity in Indian cattle. The results also indicated relatively more intense selection in draft than in dairy and dual breeds due to higher number and genome coverage of ROH. Similar level of genomic autozygosity (7.01%) was also observed in Brazilian Gyr cattle (Peripolli et al., 2018). In Vechur, 7.37% of the total genomic proportion was under ROH, and longer runs (> 8 Mb) were observed to be 26.35% among all the identified segments covering 5.5% of the genome (Table 2). The length of ROH is considered to have negative correlation with the time of co-ancestry because random recombination events interrupt lengthy chromosomal segments over a period of time. Hence, long (> 8 Mb) ROH in Vechur might have arisen as result of current inbreeding up to 5 generations (Howrigan et al., 2011; Mastrangelo et al., 2017) and/or bottleneck in this population in recent past.
The larger proportion of genome under longer ROH segments was in consonance with relatively higher inbreeding coefficient of FROH > 8 Mb as well as recent history of Vechur cattle. The Vechur was extensively crossed with exotic breeds like Jersey, American Brown Swiss and Holstein to produce Sunandini, a crossbred population. Subsequently, very few purebred Vechur cattle, sampled for the present study, were maintained in different farms in Kerala state of the country and hence, the inbreeding.
On the contrary, IBD genomic segments from remote ancestors yield short ROH (~1- 8 Mb) revealing a greater historical relatedness (Howrigan et al., 2011) and/or selection (Peripolli et al., 2018). Present results highlighted a lower recent inbreeding compared to ancient inbreeding (Table 1) in all the breeds and hence, these breeds are less consanguineous. Three individuals (one each from GR, OG and VC) had more than 700 Mb of their autosomes covered by ROH. Similar to the present findings, comparable genome-wide distributions of ROH in Spanish goat breeds have been reported (Manunza et al., 2016). In commercial sheep, few individuals have also been observed to carry ROH of >600 Mb of their autosome equivalent to almost one-fourth of their genome (Mastrangelo et al., 2017; Purfield et al., 2017).
The genomic inbreeding was generally low (FROH> 1Mb) in all the breeds except Kangayam (FROH > 1Mb = 0.113). The estimates of inbreeding were in agreement with the abundance and length of ROH in the sampled populations. Estimation of inbreeding coefficients using ROH >8 Mb confirmed to be the most consistent with pedigree-based estimates (Keller et al., 2011; Purfield et al., 2012; Marras et al., 2015), which capture recent inbreeding, and are more accurate (Curik et al., 2014; Kim et al., 2015). Hence, it may reasonably be inferred that these populations are by and large outbred in nature. FHOM estimates were also low but negative except in Vechur and again confirmed that they are less inbred than the average population (Wang, 2014). FROH reveals homozygosity level independent of allele frequencies; whereas, FHOMis influenced by allele frequencies and consequently by sampling (Zhang et al., 2015). The present estimates corroborated the previous findings in cattle (Zhang et al., 2015; Mastrangelo et al., 2017) and sheep (Purfield et al., 2017). The ancient rate of inbreeding (FROH> 1Mb) in some of the present breeds (Sahiwal, Hariana, Tharparkar) was similar but higher for others (Gir, Kangayam, Ongole and Vechur) compared to the estimates of Nellore cows (Zavarez et al., 2015). Nevertheless, in Nellore cattle, the recent inbreeding rate (FROH> 8 Mb) was lower than the current estimates. The average autosomal FROH> 1Mb for Bos taurus breeds ranged from 6-15% (Ferenčaković et al., 2013b). The high correlations of FHOM with FROH> 1 Mb and FROH> 8 Mb across the breeds revealed that the present estimates of inbreeding in these local cattle are almost free from sampling bias. The genome-wide distribution of ROH, its abundance and length revealed that these cattle had not experienced much inbreeding and/or selection pressure as selection increases the accumulation of ROH in the genome and reduces heterozygosity (Karimi, 2013; Marras et al., 2015; Peripolli et al., 2018). The demographic history of other cattle breeds has also been delineated by using ROH information (Bosse et al., 2012).
Genomic Regions Within Overlapping ROH
The dairy and draft cattle breeds had contrasting phenotypic/production and reproduction characteristics. Kangayam had lower age at first calving (39.99 months) than dairy breeds (mean of 45.09 months for four dairy breeds) indicating its higher reproductive efficiency. Whereas, milk production was lower in Kangayam (540 kg/lactation) compared to the average milk production of 4 dairy breeds (1792.75 Kg/lactation) indicating the superiority of dairy breeds for milk production (http://www.nbagr.res.in/). The production/reproduction characteristics of these breeds were in consonance with the proportion of identified QTL in top 20 ROH in each group for these traits (Table 3). The short stature of Vechur could be due to HMGA2 polymorphism observed in this cattle. HMGA2 polymorphism had earlier been found to be associated with the difference in body stature in mice (pygmy size) (Zhou et al., 1995), humans (oversize) (Ligon et al., 2005) and cattle (Pryce et al., 2011). Recently, the intronic copy number variation (CNV) of this gene has also been associated with navel length in Nellore cattle (Aguiar et al., 2018).The analysis of the annotated genes in these ROH regions of dairy and draft breeds also indicated that Kangayam was more resistant to diseases/had higher immunity (selection sweeps in LYZL1, SVIL and GPX4) and stress tolerant (CCT4). Whereas, dairy breeds had selection sweeps in key genes governing milk production (PTGFR, CSN1S1, CSN2, CSN1S2, and CSN3).
Besides CSN3 and COPS3, cadherin and myosin family genes were found to be enriched under GO Slim cellular component (cell junction) in dairy breeds, indicating their explicit role in mammary gland physiology. Cadherin is a calcium-dependent cell-cell adhesion glycoprotein crucial for alveolar epithelial cells differentiation in lactating mammary gland as well as involution of mammary gland after weaning (Boussadia et al., 2002).
Overall, the GO terms underlying cell proliferation and immune systems were enriched in Kangayam cattle, and the same was also supported by QTL and gene annotation in underlying ROH regions contributing to health and carcass traits. Kangayam cattle, being active, powerful and highly prized draft animals, had a good capacity for agricultural operations and transport. Higher cell proliferation and stronger immune system are considered to be the prerequisite of better draft ability to combat stressful conditions as well as wear and tear. Due to continuous selection for the draft ability traits over generations, these animals might have gathered putative signatures in the genomic regions responsible for these traits. There were significant ROH differences at chromosome 3 and 5 between large and short statured breeds (Table 4). The genes identified in these regions were PTGFR and HMGA2 responsible for the milk production and stature, respectively.
Structuring of Cattle Breeds
The PCA based on the consensus ROH regions resolved the differences between breeds. The draft and short statured breeds were quite distinct from other breeds. Dairy and dual breeds also had their own identities and could not be clustered together. It was also interesting to note that the structuring of these cattle does remain unaffected when the number of consensus regions were scaled down to just 10 from 170 based on their contribution to the total variance. However, based on entire SNP dataset, Vechur, Kangayam and Ongole clustered separately from rest of the breeds but all dairy breeds along with Hariana cattle clustered together (Supplementary Figure S4). Hence, ROH analysis revealed the functionality (dairy, dual, and draft) of zebu cattle in a better way compared to SNP dataset.
Conclusion
In conclusion, our study highlights characterization of autozygosity in seven diverse Indian cattle breeds (B. indicus) where genome coverage is found to be almost equal in short (ROH >1 Mb) and long (ROH >8 Mb) ROH regions. The level of genomic inbreeding (FROH) revealed that the breeds are mostly random bred and hence preserve sufficient genetic variability. The ROH regions observed in these cattle breeds were able to differentiate dairy and draft breeds as well as small stature cattle revealing selection/adaptive footprints. The selection signatures in and around genes responsible for milk production, immunity, stress tolerance, and small stature were identified in dairy, draft, and miniature cattle.
Data Availability Statement
We have uploaded the data on ICAR-Krishi portal and is in public domain with the URL http://krishi.icar.gov.in/jspui/handle/123456789/31167.
Ethics Statement
The animal study was reviewed and approved by ICAR-NBAGR IAEC.
Author Contributions
SD, SS and IG conceived and supervised the study. AS, SS, IG, SD, AK, NK, AD, and SJ participated in the data analysis. IG, SS, and SD drafted the manuscript. All the authors have read and approved the final manuscript.
Funding
This work was financially supported by the Department of Biotechnology (DBT), Govt. of India.
Conflict of Interest
The authors declare that the research was conducted in the absence of any commercial or economic associations that could be construed as a potential conflict of interest.
Acknowledgments
The financial assistance from Department of Biotechnology (DBT), Govt. of India is duly acknowledged. The authors wish to express thanks to Divya Jyoti Jagrati Sansthan, Noormahal, Jalandhar (Punjab), Rajasthan University of Veterinary and Animal Sciences, Bikaner (Rajasthan), and Jayadevan Narayanan, Kerala for providing biological samples.
Supplementary Material
The Supplementary Material for this article can be found online at: https://www.frontiersin.org/articles/10.3389/fgene.2020.00092/full#supplementary-material
References
Aguiar, T. S., Torrecilha, R. B. P., Milanesi, M., Utsunomiya, A. T. H., Trigo, B. B., Tijjani, A., et al. (2018). Association of copy number variation at intron 3 of HMGA2 with navel length in Bos indicus. Front. Genet. 9, 627. doi: 10.3389/fgene.2018.00627
Bosse, M., Megens, H., Madsen, O., Paudel, Y., Frantz, L. A. F., Schook, L. B., et al. (2012). Regions of homozygosity in the porcine genome: consequence of demography and the recombination landscape. PLoS Genet. 8 (11), e1003100. doi: 10.1371/journal.pgen.1003100
Boussadia, O., Kutsch, S., Hierholzer, A., Delmas, V., Kemler, R. (2002). Ecadherin is a survival factor for the lactating mouse mammary gland. Mech. Dev. 115, 53–62. doi: 10.1016/S0925-4773(02)00090-4
Chang, C. C., Chow, C. C., Tellier, L. C., Vattikuti, S., Purcell, S. M., Lee, J. J. (2015). Second-generation PLINK: rising to the challenge of larger and richer datasets. Gigascience 4, 7. doi: 10.1186/s13742-015-0047-8
Colli, L., Milanesi, M., Vajana, E., Iamartino, D., Bomba, L., Puglisi, F., et al. (2018). New insights on water buffalo genomic diversity and post-domestication migration routes from medium density SNP chip data. Front. Genet. 9, 53. doi: 10.3389/fgene.2018.00053
Curik, I., Ferenčaković, M., Sölkner, J. (2014). Inbreeding and runs of homozygosity: a possible solution to an old problem. Livest. Sci. 166, 26–34. doi: 10.1016/j.livsci.2014.05.034
Dash, S., Singh, A., Bhatia, A., Jayakumar, S., Sharma, A., Singh, S., et al. (2018). Evaluation of bovine high-density SNP genotyping Array in indigenous dairy cattle breeds. Anim. Biotechnol. 29 (2), 129–135. doi: 10.1080/10495398.2017.1329150
Falconer, D. S., Mackay, T. F. C. (1996). Introduction to quantitative genetics (Harlow: Addison Wesley Longman).
Ferenčaković, M., Hamzic, E., Gredler, B., Solberg, T. R., Klemetsdal, G., Curik, I., et al. (2013a). Estimates of autozygosity derived from runs of homozygosity: empirical evidence from selected cattle populations. J. Anim. Breed. Genet. 130, 286–293. doi: 10.1111/jbg.12012
Ferenčaković, M., Sölkner, J., Curik, I. (2013b). Estimating autozygosity from high-throughput information: effects of SNP density and genotyping errors. Genet. Sel. Evol. 45, 42. doi: 10.1186/1297-9686-45-42
Gibson, J., Morton, N. E., Collins, A. (2006). Extended tracts of homozygosity in outbred human populations. Hum. Mol. Genet. 15, 789–795. doi: 10.1093/hmg/ddi493
Howrigan, D. P., Simonson, M. A., Keller, M. C. (2011). Detecting autozygosity through runs of homozygosity: a comparison of three autozygosity detection algorithms. BMC Genomics 12, 460. doi: 10.1186/1471-2164-12-460
Iacolina, L., Stronen, A. V., Pertoldi, C., Tokarska, M., Nørgaard, L. S., Muñoz, J., et al. (2016). Novel graphical analyses of runs of homozygosity among species and livestock breeds. Int. J. Genomics. 2016, 1–8. doi: 10.1155/2016/2152847
Johnson, R. A., Wichern, D. W. (1982). Applied multivariate Statistical Analysis (New Jersey: Prentice- hall).
Karimi, Z. (2013). Runs of Homozygosity patterns in Taurine and Indicine cattle breeds. (Master Thesis) (Vienna, Austria: BOKU – University of Natural Resources and Life Sciences).
Keller, M. C., Visscher, P. M., Goddard, M. E. (2011). Quantification of inbreeding due to distant ancestors and its detection using dense single nucleotide polymorphism data. Genetics 189, 237–249. doi: 10.1534/genetics.111.30922
Kim, E. S., Sonstegard, T. S., van Tassell, C. P., Wiggans, G., Rothschild, M. F. (2015). The relationship between runs of homozygosity and inbreeding in Jersey cattle under selection. PLoS One 10, e0129967. doi: 10.1371/journal.pone.0129967
Kirin, M., McQuillan, R., Franklin, C., Campbell, H., McKeigue, P., Wilson, J. (2010). Genomic runs of homozygosity record population history and consanguinity. PLoS One 5, e13996. doi: 10.1371/journal.pone.0013996
Ligon, A. H., Moore, S. D. P., Parisi, M. A., Mealiffe, M. E., Harris, D. J., Ferguson, H. L., et al. (2005). Constitutional rearrangement of the architectural factor hmga2: a novel human phenotype including overgrowth and Lipomas. Am. J. Hum. Genet. 76, 340–348. doi: 10.1086/427565
Manunza, A., Noce, A., Serradilla, J. M., Goyache, F., Martínez, A., Capote, J., et al. (2016). A genome-wide perspective about the diversity and demographic history of seven Spanish goat breeds. Genet. Sel. Evol. 48, 52. doi: 10.1186/s12711-016-0229-6
Marras, G., Gaspa, G., Sorbolini, S., Dimauro, C., Ajmone-Marsan, P., Valentini, A., et al. (2015). Analysis of runs of homozygosity and their relationship with inbreeding in five cattle breeds farmed in Italy. Anim. Genet. 46, 110–121. doi: 10.1111/age.12259
Mastrangelo, S., Tolone, M., Sardina, M. T., Sottile, G., Sutera, A. M., Di Gerlando, R., et al. (2017). Genome-wide scan for runs of homozygosity identifies potential candidate genes associated with local adaptation in Valle del Belice sheep. Genet. Sel. Evol. 49, 84. doi: 10.1186/s12711-017-0360-z
McQuillan, R., Leutenegger, A. L., Abdel-Rahman, R., Franklin, C. S., Pericic, M., Barac-Lauc, L., et al. (2008). Runs of homozygosity in European populations. Am. J. Hum. Genet. 83, 359–372. doi: 10.1016/j.ajhg.2008.08.007
Peripolli, E., Stafuzza, N. B., Munari, D. P., Lima, A. L. F., Irgang, R., Machado, M. A., et al. (2018). Assessment of runs of homozygosity islands and estimates of genomic inbreeding in Gyr (Bos indicus) dairy cattle. BMC Genomics 19, 34. doi: 10.1186/s12864-017-4365-3
Pryce, J. E., Hayes, B. J., Bolormaa, S., Goddard, M. E. (2011). Polymorphic regions affecting human height also control stature in cattle. Genetics 187981-, 984. doi: 10.1534/genetics.110.123943
Purcell, S., Neale, B., Todd-Brown, K., Thomas, L., Ferreira, M. A., Bender, D., et al. (2007). PLINK: a tool set for whole-genome association and population-based linkage analyses. Am. J. Hum. Genet. 81, 559–575. doi: 10.1086/519795
Purfield, D. C., Berry, D. P., McParland, S., Bradley, D. G. (2012). Runs of homozygosity and population history in cattle. BMC Genet. 13, 70. doi: 10.1186/1471-2156-13-70
Purfield, D. C., McParland, S., Wall, E., Berry, D. P. (2017). The distribution of runs of homozygosity and selection signatures in six commercial meat sheep breeds. PLoS One 12, e0176780. doi: 10.1371/journal.pone.0176780
Upadhyay, M., da Silva, V. H., Megens, H. J., Visker, M. H. P. W., Ajmone-Marsan, P., Bâlteanu, V. A., et al. (2017). Distribution and functionality of copy number variation across European Cattle Populations. Front. Genet. 8, 108. doi: 10.3389/fgene.2017.00108
Utsunomiya, Y. T., Milanesi, M., Fortes, M. R. S., Porto-Neto, L. R., Utsunomiya, A. T. H., Silva, M. V. G. B., et al. (2019). Genomic clues of the evolutionary history of Bos indicus cattle. Anim. Genet. 50 (6), 557–568 doi: 10.1111/age.12836
Wang, J. (2014). Marker-based estimates of relatedness and inbreeding coefficients: an assessment of current methods. J. Evol. Biol. 27, 518–530. doi: 10.1111/jeb.12315
Willing, E. M., Dreyer, C., van Oosterhout, C. (2012). Estimates of genetic differentiation measured by FST do not necessarily require large sample sizes when using many SNP markers. PLoS One 7 (8), e42649. doi: 10.1371/journal.pone.0042649
Zavarez, L., Utsunomiya, Y. T., Carmo, A., Neves, H. H. R., Garcia, J. F., et al. (2015). Assessment of autozygosity in Nellore cows (Bos indicus) through high-density SNP genotypes. Front. Genet. 6, 5. doi: 10.3389/fgene.2015.00005
Zhang, Q., Guldbrandtsen, B., Bosse, M., Lund, M. S., Sahana, G. (2015). Runs of homozygosity and distribution of functional variants in the cattle genome. BMC Genomics 16, 542. doi: 10.1186/s12864-015-1715-x
Keywords: autozygosity, genomic inbreeding, runs of homozygosity islands, selection sweep, FROH
Citation: Dixit SP, Singh S, Ganguly I, Bhatia AK, Sharma A, Kumar NA, Dang AK and Jayakumar S (2020) Genome-Wide Runs of Homozygosity Revealed Selection Signatures in Bos indicus. Front. Genet. 11:92. doi: 10.3389/fgene.2020.00092
Received: 01 June 2019; Accepted: 28 January 2020;
Published: 21 February 2020.
Edited by:
Yuri Tani Utsunomiya, São Paulo State University, BrazilReviewed by:
Marco Milanesi, São Paulo State University, BrazilAlbano Beja-Pereira, University of Porto, Portugal
Copyright © 2020 Dixit, Singh, Ganguly, Bhatia, Sharma, Kumar, Dang and Jayakumar. This is an open-access article distributed under the terms of the Creative Commons Attribution License (CC BY). The use, distribution or reproduction in other forums is permitted, provided the original author(s) and the copyright owner(s) are credited and that the original publication in this journal is cited, in accordance with accepted academic practice. No use, distribution or reproduction is permitted which does not comply with these terms.
*Correspondence: S. P. Dixit, dixitsp@gmail.com