 Meng Dong
 Xue Zhang3
 Jichun Tan
- 1Center of Reproductive Medicine, Shengjing Hospital of China Medical University, Shenyang, China
- 2Key Laboratory of Reproductive Dysfunction Diseases and Fertility Remodeling of Liaoning Province, Shenyang, China
- 3School of Life Sciences, China Medical University, Shenyang, China
- 4Department of Laboratory Medicine, The First Affiliated Hospital of China Medical University, Shenyang, China
Non-obstructive azoospermia (NOA) denotes a severe form of male infertility, whose etiology is still poorly understood. This is mainly due to limited knowledge on the molecular mechanisms that lead to spermatogenesis failure. In this study, we acquired microarray data from GEO DataSets and identified differentially expressed genes using the limma package in R. We identified 1,261 differentially expressed genes between non-obstructive and obstructive azoospermia. Analysis of their possible biological functions and related signaling pathways using the cluster profiler package revealed an enrichment of genes involved in germ cell development, cilium organization, and oocyte meiosis. Immune infiltration analysis indicated that macrophages were the most significant immune component of NOA, cooperating with mast cells and natural killer cells. The weighted gene coexpression network analysis algorithm generated three related functional modules, which correlated closely with clinical parameters derived from histopathological subtypes of NOA. The resulting data enabled the construction of a protein–protein interaction network of these three modules, with CDK1, CDC20, CCNB1, CCNB2, and MAD2L1 identified as hub genes. This study provides the basis for further investigation of the molecular mechanism underlying NOA, as well as indications about potential biomarkers and therapeutic targets of NOA. Finally, using tissues containing different tissue types for differential expression analysis can reflect the expression differences in different tissues to a certain extent. But this difference in expression is only related and not causal. The specific causality needs to be verified later.
Introduction
Azoospermia affects approximately 10 to 15% of males seeking medical care for couple infertility, and is considered the most serious manifestation of male infertility (Practice Committee of American Society for Reproductive Medicine in collaboration with Society for Male Reproduction and Urology, 2008; Wosnitzer et al., 2014). Azoospermia can be classified as obstructive azoospermia (OA), with normal spermatogenesis, or non-obstructive azoospermia (NOA), in which spermatogenesis is impaired (Jow et al., 1993). OA is caused by physical blockage of the male excurrent ductal system, which obstructs the transport of sperm and may occur in any area between the testicular net and the ejaculatory ducts. It accounts for one-third of azoospermia cases (Jow et al., 1993). OA may be congenital (e.g., congenital bilateral absence of the vas deferens, idiopathic epididymal obstruction) or acquired (e.g., vasectomy, infection, trauma, and iatrogenic injury) (Practice Committee of the American Society for Reproductive Medicine in collaboration with the Society for Male Reproduction and Urology, 2019). Unlike OA, NOA only rarely correlates with physical blockage; instead, it results from a range of abnormal testicular histopathological features (Jarow et al., 1989).
Although NOA accounts for almost 66% of patients with azoospermia, its etiology remains poorly understood, with only a limited number of studies exploring its genetic and molecular mechanisms (Hu et al., 2011; Krausz, 2011; Cerván-Martín et al., 2020). For sperm to successfully undergo cell meiosis, human spermatogenesis relies on the coordinated regulation of testis-specific genes (Zheng et al., 2019). Identifying potentially complex genetic and molecular causes of azoospermia is of vital importance for the diagnosis of NOA (Dorosh et al., 2013; Krausz and Riera-Escamilla, 2018; Cerván-Martín et al., 2020). Therefore, exploring different genetic abnormalities during spermatogenesis could point to potential diagnostic biomarkers and therapeutic targets of NOA.
Large-scale gene expression analysis based on microarray and high-throughput sequencing technology can detect changes at the transcriptional level for a large number of genes simultaneously, making it a great tool to investigate various diseases including azoospermia (Malcher et al., 2013; Zheng et al., 2019). In this study, we first screened through the microarrays deposited in the Gene Expression Omnibus (GEO) database to obtain genes differentially expressed between OA and NOA. Then, we performed functional enrichment analysis and immune infiltration analysis to identify possible biological functions and signaling pathways involved in OA or NOA onset. Finally, functional modules related to clinical traits were screened based on weighted gene co-expression network analysis (WGCNA), and candidate hub genes were selected. The present study aimed to expand our understanding of the molecular mechanism(s) of NOA.
Materials and Methods
Acquisition of Datasets
Data on mRNA expression profiling microarrays were acquired from the GEO DataSets1. The GSE9210 series included 47 NOA samples and 11 OA samples, the GSE145467 series contained 10 NOA samples and 10 matched OA samples, and the GSE45885 series consisted of 27 NOA samples with the corresponding clinical parameters. As this study involved only a bioinformatics analysis of the GEO DataSets, no ethical approval was required.
Data Processing
The limma package in R was applied to screen for differentially expressed genes (DEGs), with | fold change| >2 and adjusted P < 0.05 considered as cutoff values (Ritchie et al., 2015). If fold change <−2. It means that this gene is low expressed in NOA. If fold change >2. It means that this gene is highly expressed in NOA. The genes that were aberrantly expressed in the GSE9210 and GSE145467 series were selected as the final DEGs.
Functional Enrichment Analysis
Functional enrichment analysis of DEGs was carried out by analyzing Gene Ontology (GO) terms and the Kyoto Encyclopedia of Genes and Genomes (KEGG) pathways using the cluster profiler package in R (Yu et al., 2012). P < 0.05 was considered statistically significant.
Immune Infiltration Analysis
The gene set variation analysis (GSVA) method, an explicit modeling phenotype approach in the enrichment scoring algorithm in R (Hanzelmann et al., 2013), was employed to analyze expression data. We collected 24 immune cell gene sets based on previously published articles (Subramanian et al., 2005; Thorsson et al., 2018).Specifically, the gene set identified by GSVA was used to analyze the distribution of 24 immune cells and evaluate immune infiltration in NOA (Bindea et al., 2013). Using correlation analysis, we analyzed the correlation among immune cells.
The calculation was supported by a t-test. Pearson test was used to evaluate correlations.
Identifying Modules Associated With Clinical Traits
Weighted gene co-expression network analysis, an effective data-mining method in R suitable for weighted correlation network analysis, was used to produce a hierarchical clustering tree (dendrogram) of DEGs based on the hclust and dissTOM functions, as well as to generate module clustering (Langfelder and Horvath, 2008). WGCNA will select an appropriate threshold based on the dataset for dimensionality reduction analysis. It will evaluate the model based on each power value. When the model’s R2 reached 0.9 for the first time, this power value was chosen as the threshold for subsequent analysis. The relationship between these clustered modules and clinical parameters of NOA was determined by comparing the genes in the modules with the GSE45885 series. The specific analysis process is that after using WGCNA algorithm for dimensionality reduction clustering, we can get the score of each module in each sample. The optimized correlation analysis function “cor” in WGCNA was used. We analyzed the correlation between module scores and clinical characteristics. Correlation coefficient greater than 0.25 means there is an interaction relationship.
Protein–Protein Interaction (PPI) Analysis
The Retrieval of Interacting Genes (STRING) database tool2 was used to build a protein–protein interaction (PPI) network (Szklarczyk et al., 2019). We put the genes in the candidate modules into the STRING database for subsequent protein interaction network construction. Interacting pairs with confidence scores >0.4 (medium confidence) were considered significant and retained and were then visualized by Cytoscape software (Bader and Hogue, 2003; Shannon et al., 2003). In the PPI networks, centisape, an app in Cytoscape, was used to calculate the connectivity degree. After obtaining the degree, we sort the genes by degree; the higher the degree, the higher the ranking. Then we selected the top five genes as hub genes.
Results
Identification of DEGs in OA and NOA
In the differential expression analysis, we considered NOA as case group. The high and low expressions mentioned in the analysis are all for NOA. Differential expression analysis identified 1,137 downregulated and 272 upregulated genes in GSE9210 (Supplementary Table 1), as well as 2,202 upregulated and 3,348 downregulated genes in GSE145467 (Figure 1A and Suplementary Table 2). Cross-analysis indicated the presence of 1,261 overlapping genes with stable differences (Figure 1B).
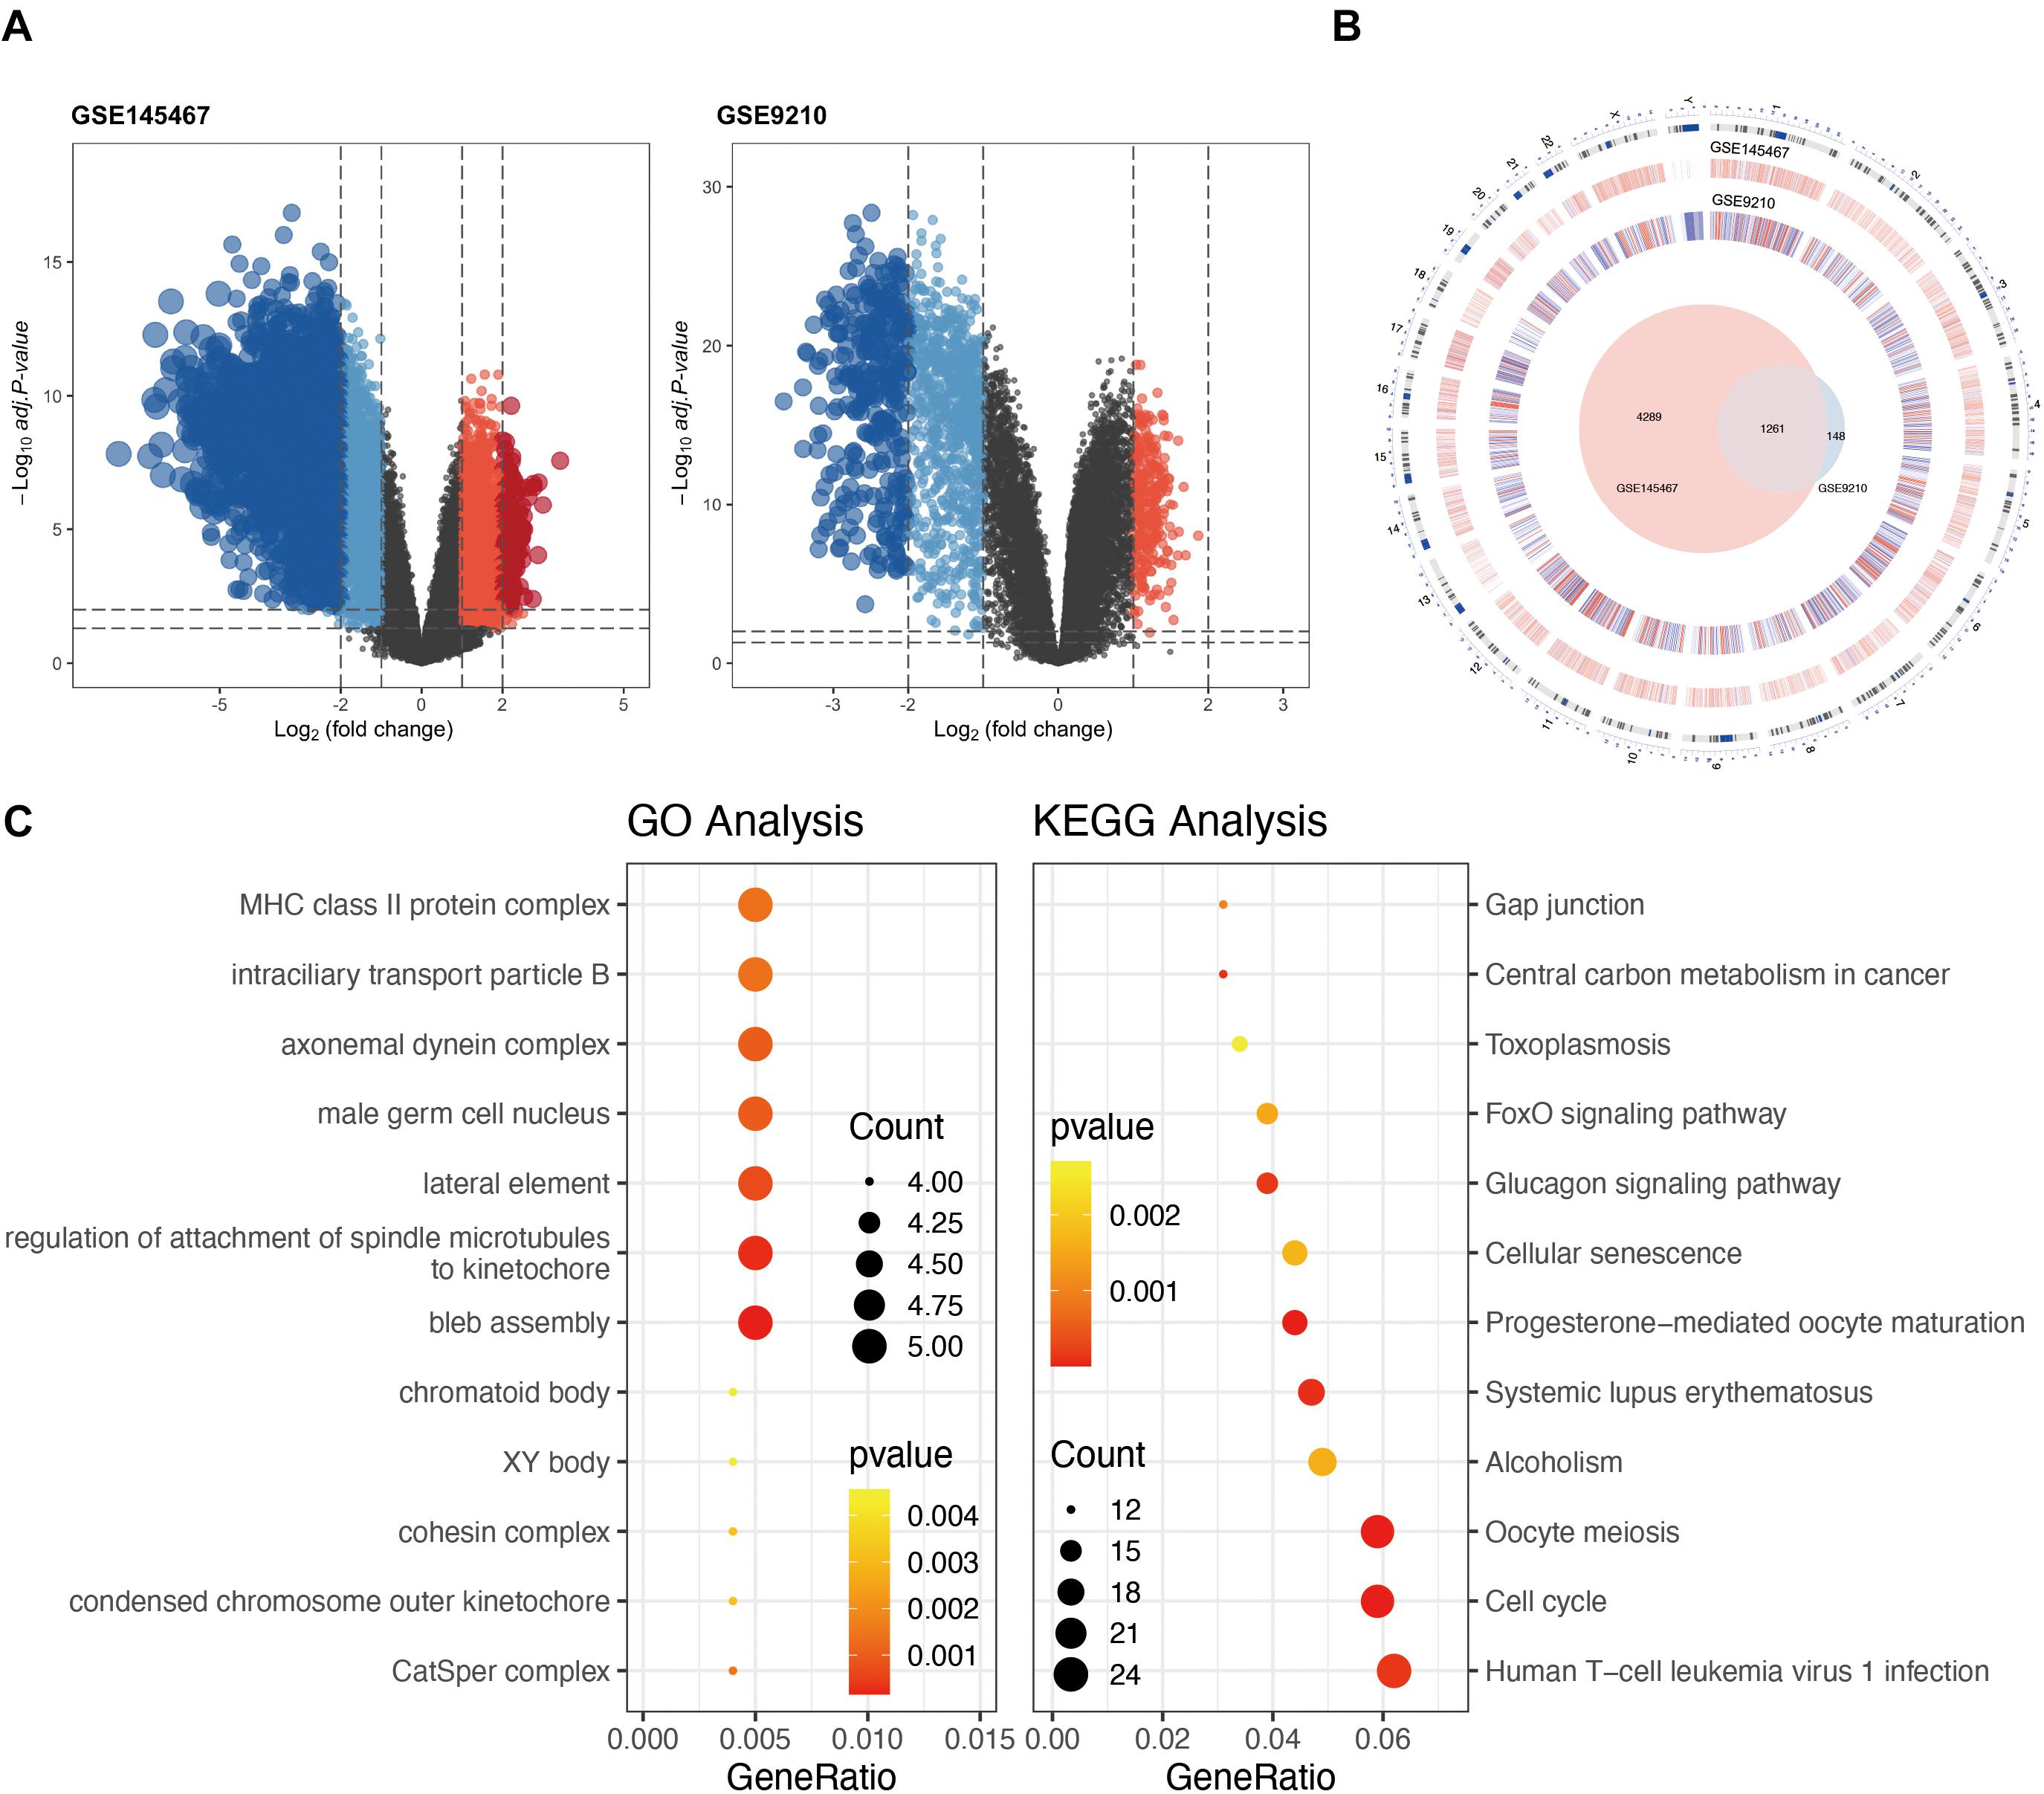
Figure 1. Analysis of differentially expressed genes (DEGs) in non-obstructive azoospermia (NOA). (A) Volcano plots of GSE145467 and GSE9210. Blue spots represent downregulated genes; red spots represent upregulated genes. Genes in black were not differentially expressed. (B) Circle plot of DEGs in both series. The outermost layer of the circle represents the chromosome location of the gene. The second and third levels indicate the positions of differential expression on chromosomes. Blue denotes downregulated genes; red denotes upregulated genes. The innermost Venn diagram represents the genes obtained after cross-analysis of the two series. (C) Enrichment of DEGs using Gene Ontology (GO) (left) or Kyoto Encyclopedia of Genes and Genomes (KEGG) (right) analysis. The larger the circle in the figure, the more genes it contains; lower P values are indicated with a stronger red color.
Functional enrichment on these 1,261 DEGs was performed to identify possible biological functions. GO analysis showed that NOA was related mainly to germ cell development, cilium organization, cilium assembly, nuclear division, spermatid development, and spermatid differentiation. When analyzing the related KEGG pathways, cell cycle, oocyte meiosis, progesterone-mediated oocyte maturation, human T-cell leukemia virus 1 infection, and FoxO signaling appeared to correlate with NOA (Table 1 and Figure 1C).
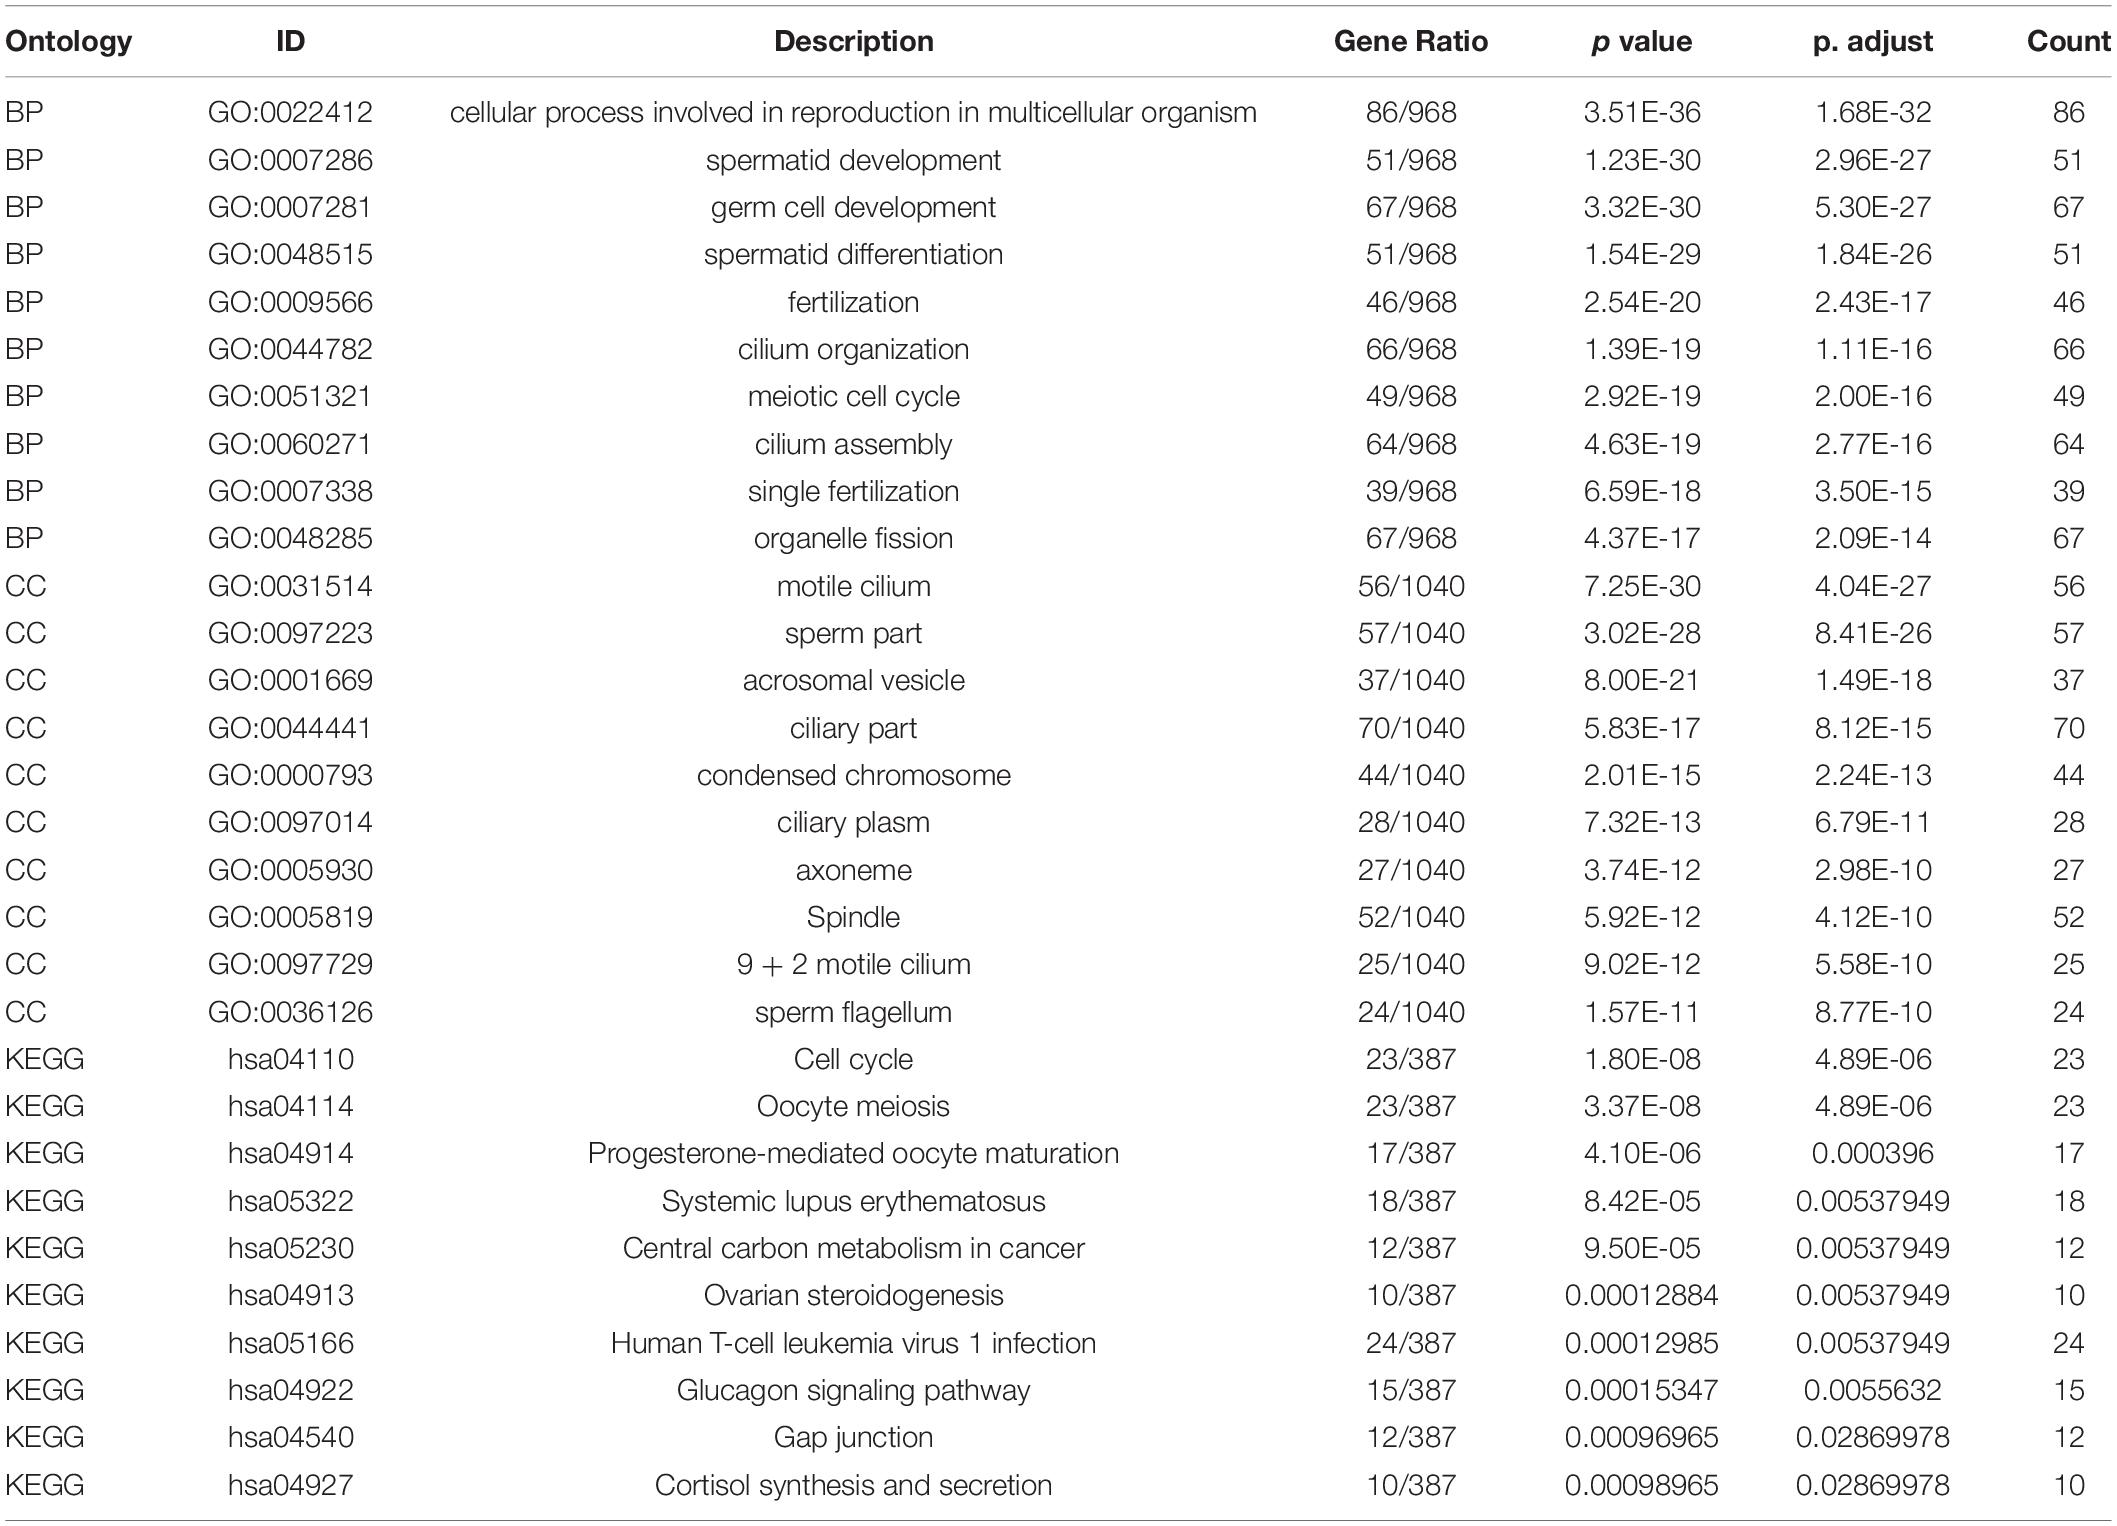
Table 1. Top 10 Enrichment analysis of the DEGs.
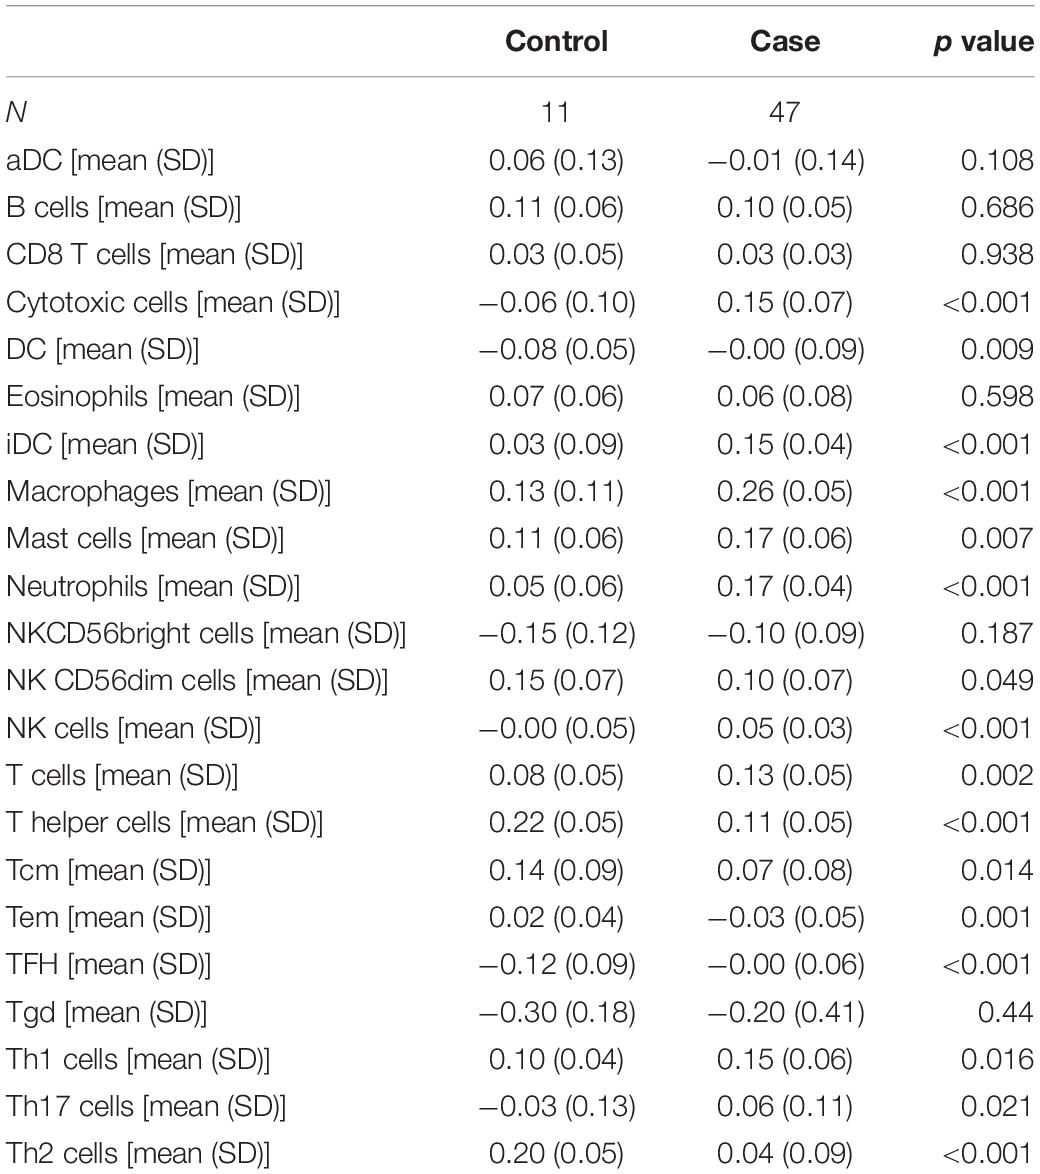
Table 2. Analysis of differential expression of immune infiltration between NOA and OA.
Infiltration of Immune Cells in NOA
The GSVA algorithm was used to analyze immune infiltration in NOA based on the distribution of 24 types of immune cells (Figure 2A). As shown in Figure 2B, there was a strong positive correlation between macrophages and mast cells (R2 = 0.707), as well as between macrophages and natural killer (NK) cells (R2 = 0.599). In contrast, a clear negative correlation was observed between interstitial dendritic cells (iDCs) and T helper cells (R2 = −0.627).
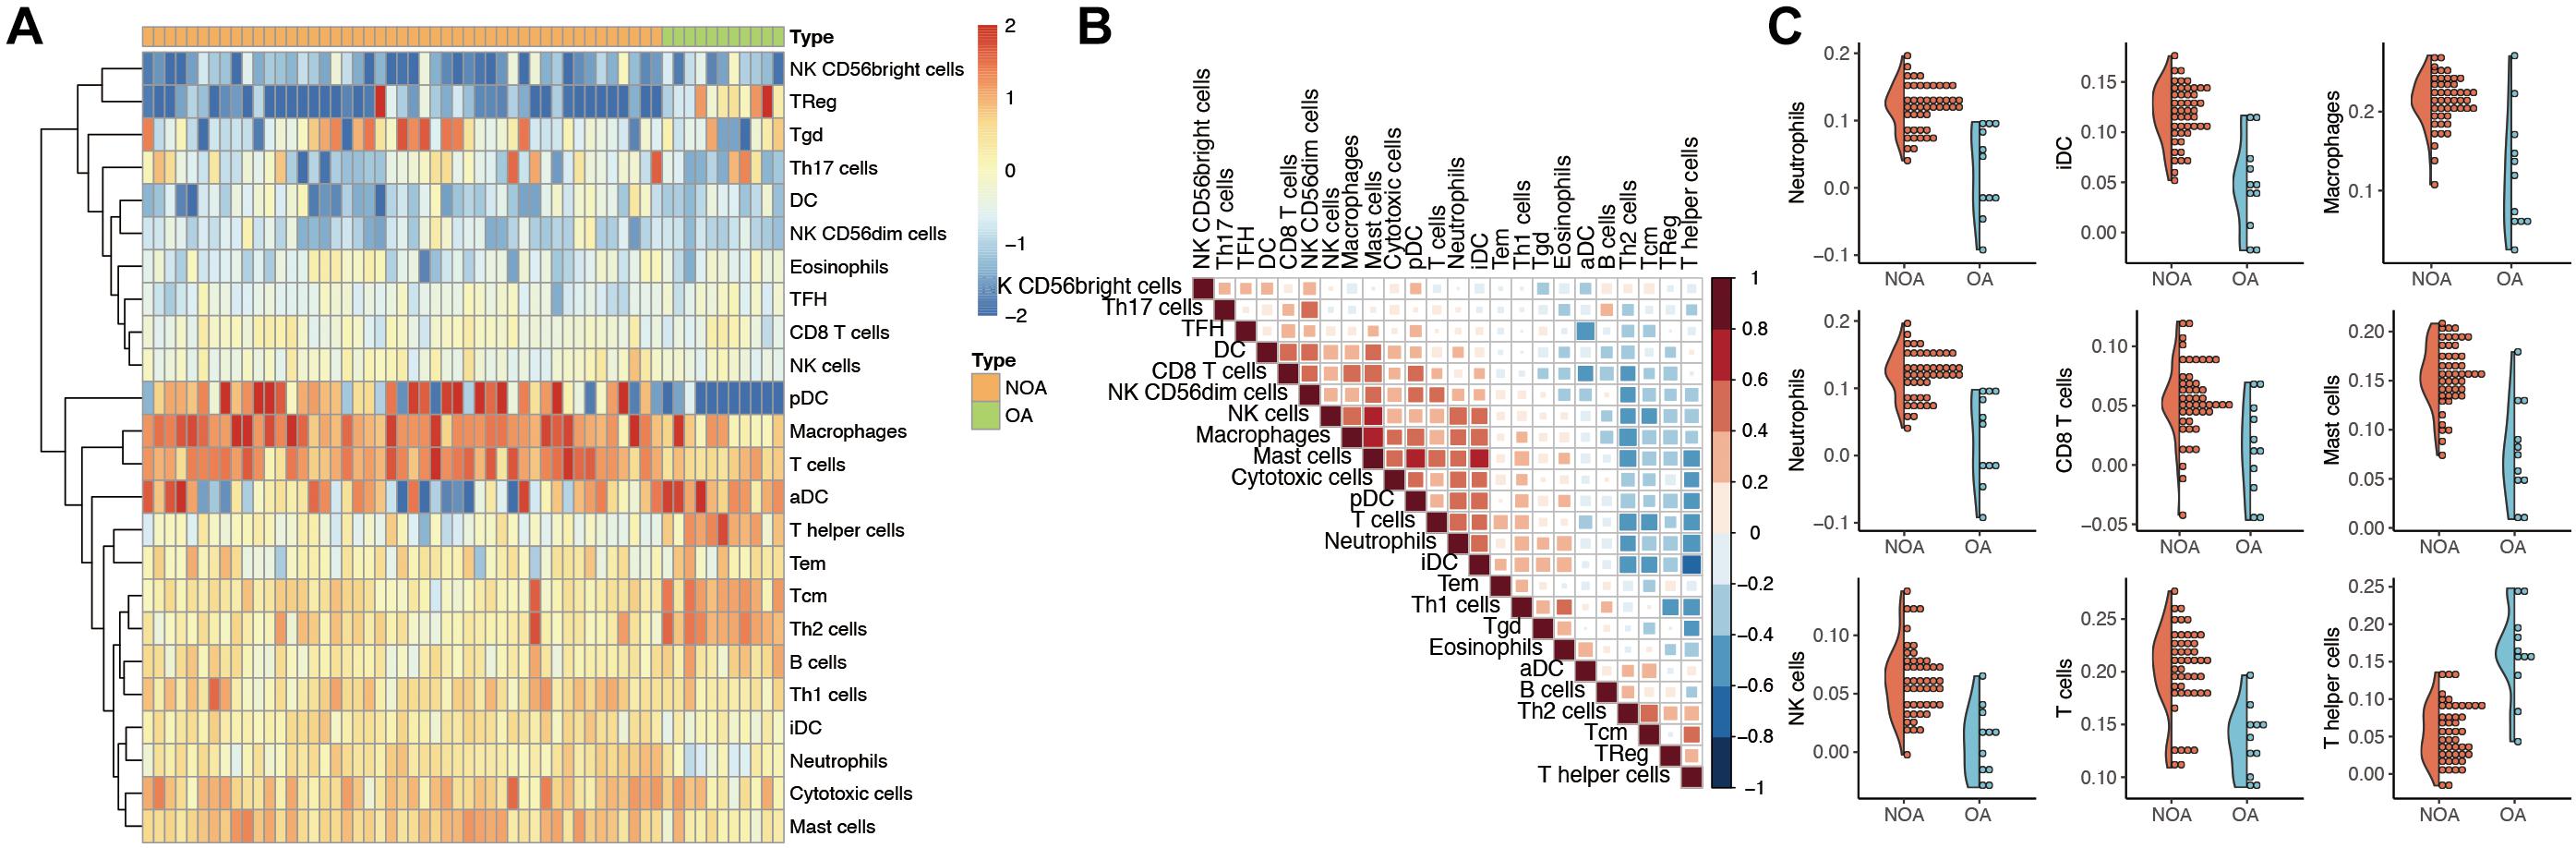
Figure 2. Evaluation of immune infiltration in non-obstructive azoospermia (NOA). (A) Heat map showing the expression of each immune cell in each sample. The horizontal represents each sample. The samples are sorted in the order of NOA and OA. The vertical is each immune cell. Through clustering, we visualize the clustering of immune cells with similar expression. (B) Correlation analysis among various immune cells. The red in the figure represents a positive correlation between the two immune components. Blue means there is a negative correlation between the two. The darker the color, the stronger the correlation. (C) Immune components associated with NOA. The curve generation distribution density in the figure. Scattered points represent the immune infiltration score of each sample.
Moreover, we identified the immune components most clearly associated with NOA (Figure 2C). A comparison between NOA and OA case groups revealed that macrophages, neutrophils, NK cells, T helper cells, iDCs, and other immune cells were all significantly associated with NOA (Table 2).
Module–Trait Correlations and Functional Enrichment Analysis
To investigate the correlation between the above 1,261 DEGs and clinical traits of NOA, we conducted molecular clustering analysis on the GSE45885 series using the WGCNA algorithm. Three types of clinical traits were included in the GSE45885 series: age, localization, and histopathology subtype (postmeiotic arrest, meiotic arrest, premeiotic arrest, and Sertoli cell–only syndrome). According to an initial data evaluation, we selected a power value of 10 as an appropriate soft threshold for further analysis (Figure 3A). As a result, we obtained four related modules marked with different colors: blue (398 genes), brown (84 genes), red (625 genes), and yellow (48 genes) (Figure 3B).

Figure 3. Weighted gene coexpression network analysis (WGCNA) analysis based on clinical characteristics in non-obstructive azoospermia (NOA). (A) Soft threshold selection in WGCNA; 10 as the final soft threshold for subsequent analysis. (B) Module cluster analysis of differentially expressed genes (DEGs). Cluster analysis of different genes. Group genes with similar expressions into one module. (C) Correlation analysis between modules and clinical characteristics. The number above represents the correlation coefficient, and the number below represents the P value. The red in the figure represents a positive correlation between the two immune components. Blue means there is a negative correlation between the two. The darker the color, the stronger the correlation. Correlation coefficient > 0.25 means there is an interaction relationship. (D) Enrichment analysis of clinical traits in the related modules.
To determine the clinical significance of the modules, we analyzed the correlation between the above four modules and clinical parameters. As shown in Figure 3C, none of the modules presented any significant relationship to age or localization. In contrast, the red and blue modules displayed a strong negative correlation with histopathological subtypes, whereas the brown module showed a positive association.
To better understand the possible biological function of the three modules associated with histopathological subtypes, we employed GO analysis. As shown in Figure 3D and Supplementary Table 3, genes in the red module were enriched in various ciliary parts, cilium organization, and cilium assembly; those in the blue module were related mainly to organelle fission, nuclear division, and chromosome segregation; finally, those in the brown module were enriched in extracellular structure organization, extracellular matrix, and skeletal system development.
PPI Network Construction in the Modules
To investigate in more detail the interplay between genes in the above three modules, we constructed a PPI network using the STRING database tool and 304 nodes (Figure 4). A screening for hub genes from the network indicated that the five genes with the highest degree of connectivity number were CDK1, CDC20, CCNB1, CCNB2, and MAD2L1 (Table 3). As shown in Table 3, all of the 5 hub genes were of low expression in NOA.
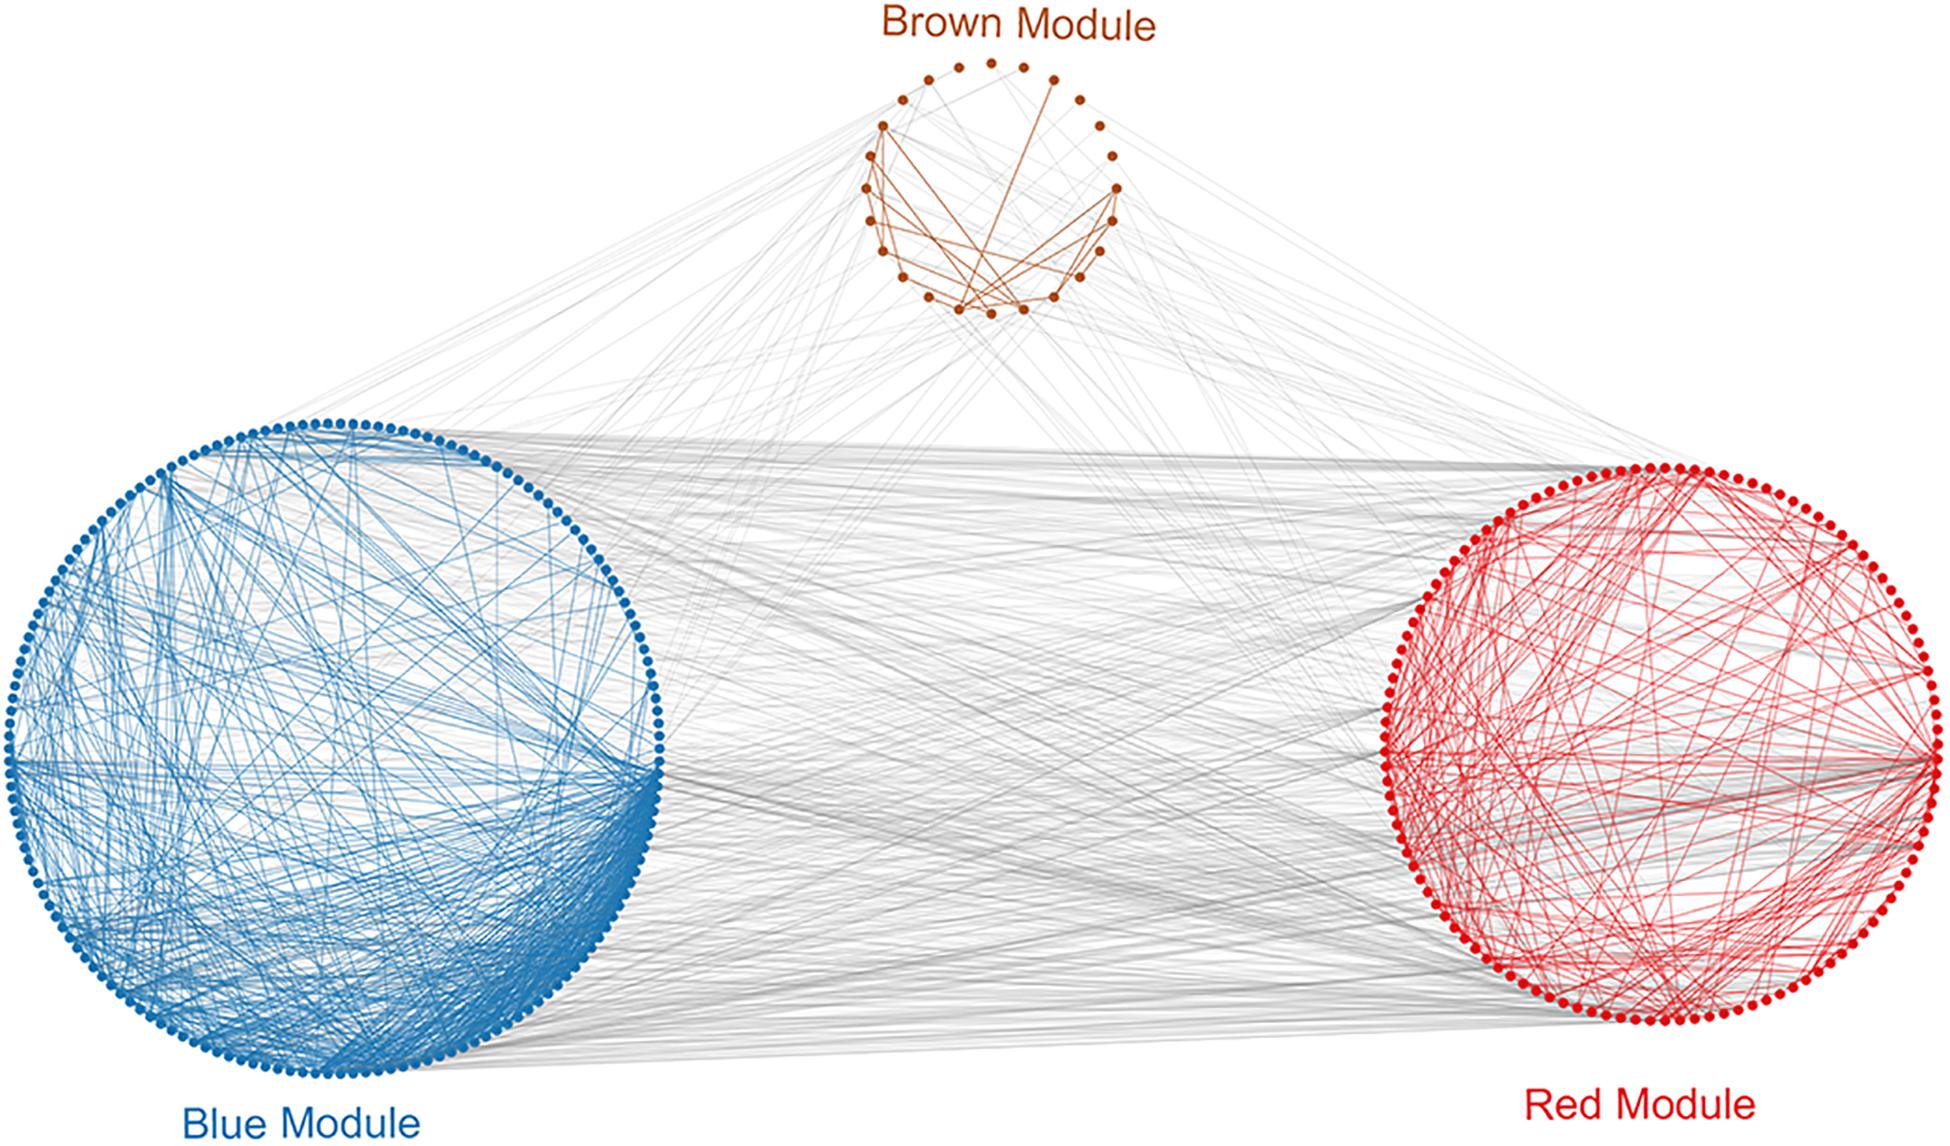
Figure 4. Protein–protein interaction (PPI) analysis of clinically relevant modules. First use the genes in the module to perform protein interaction analysis in the STRING database. Further build an interaction network between the overall related genes based on different module colors. Red spots represent the genes in the red module, blue spots denote those in the blue module, and brown spots denote those in the brown module.
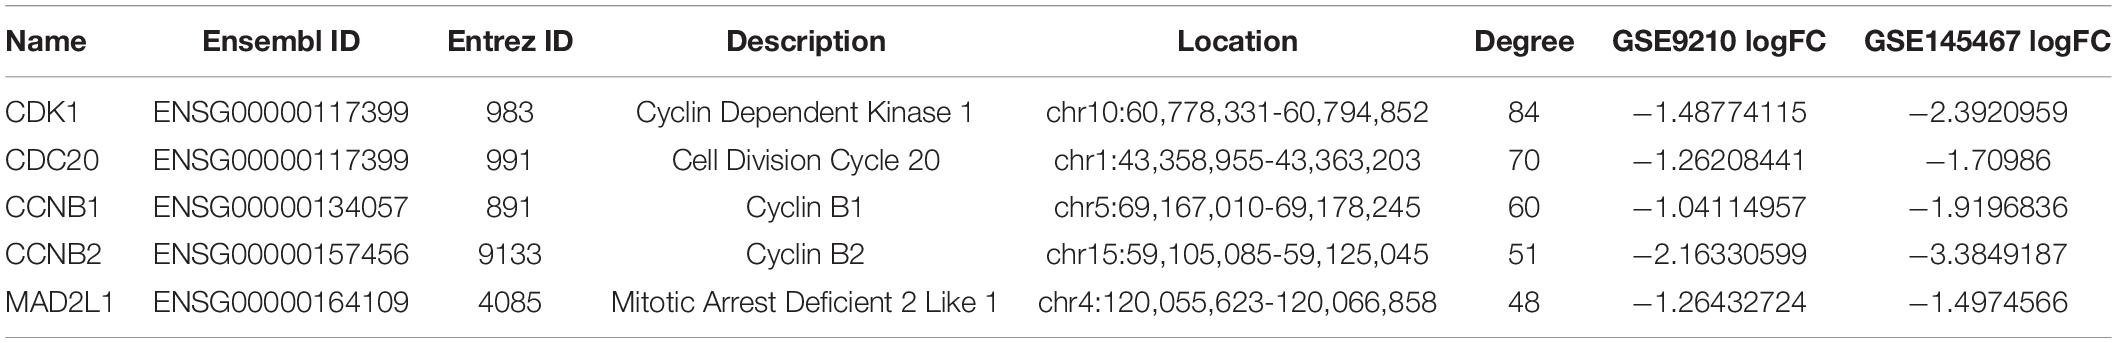
Table 3. Basic information of hub genes.
Discussion
Azoospermia, the most intractable form of male infertility, is divided into obstructive (OA) and non-obstructive (NOA) azoospermia, which have distinct etiology and treatment (Berookhim and Schlegel, 2014; Bracke et al., 2018; Fainberg and Kashanian, 2019). Azoospermia not only can affect fertility, but also is correlated with higher incidence of other diseases such as tumors (Eisenberg et al., 2013). Because of the serious consequences of azoospermia, it is necessary to study the mechanism of this disease. Although it is essential to identify differences between the molecular mechanisms involved in both forms of azoospermia, very few such studies have been done so far. Here, we explored the molecular mechanism and potential diagnostic biomarkers in NOA.
First, we identified DEGs between NOA and OA, which yielded 1,261 overlapping genes with stable differences. We further performed a functional analysis of these DEGs. In order to understand the relationship between these related genes and clinical parameters. We used WGCNA for dimensionality reduction and correlation analysis. WGCNA can effectively detect coexpression modules and genes. Because of its extensive and powerful functions, this method has been widely used in various biological areas, to identify potential biomarkers or therapeutic targets (Fuller et al., 2007; Langfelder and Horvath, 2008; Zhao et al., 2010; Clarke et al., 2013; Huang et al., 2017; Liu et al., 2017).
These DEGs were found to be involved predominantly in germ cell development, nuclear division, and spermatid differentiation, raising the possibility that they may cause lack of sperm in the ejaculate. Moria et al. reported that aberrantly expressed genes such as RBM5 could lead to abnormal spermatid differentiation, germ cell sloughing, and apoptosis, ultimately resulting in the absence of sperm in the ejaculate (O’Bryan et al., 2013). Moreover, DEGs related to the function of ciliary parts, cilium organization or cilium assembly, might promote the occurrence of NOA. Although there is no evidence, we speculate that the reported increase in bacterial infection due to impaired ciliary function may contribute to azoospermia (Balbani et al., 2000). Therefore, the relationship between ciliary dysfunction and NOA should be scrutinized in future studies. Cell cycle and oocyte meiosis were the most significantly enriched pathways of DEGs in NOA. Indeed, DEGs can exert a non-negligible influence on each stage of meiotic progression, resulting in interrupted or incomplete spermatogenesis, or sperm maturation in this case (Dorosh et al., 2013; Long et al., 2017; van der Bijl et al., 2019; Yuan et al., 2019; Wyrwoll et al., 2020). In the pathway enrichment analysis, we have obtained multiple pathways related to NOA. The FoxO signaling pathway mainly regulates downstream genes by activating FoxO protein. This pathway can regulate processes such as apoptosis, cell cycle control, sugar metabolism, and oxidative stress resistance (Ponugoti et al., 2012). In the study of Ge et al., it was found that circRNA related to NOA is also involved in the regulation of FoxO signaling pathway. It shows that FoxO pathway is a key pathway of NOA (Ge et al., 2019). In the pathway analysis, a pathway similar to T-cell leukemia virus 1 was also enriched. There is no report on the study of NOA and T-cell leukemia virus 1. The results of the enrichment analysis can indicate that the genes related to NOA and T-cell leukemia virus 1 overlap, specifically whether NOA is related to T-cell leukemia virus 1. This requires follow-up research.
In the WGCNA analysis, genes in the blue module were significantly involved in nuclear division and chromosome segregation, whereas the genes in all modules were closely related to the occurrence of NOA. As discussed by He et al., in some infertile men, an altered crossover distribution was thought to disrupt the segregation of specific chromosomes (Ren et al., 2016). In the enrichment analysis of WGCNA-related modules, we found that the blue module is mainly related to meiosis, and the red module is mainly related to sperm formation. The brown module is mainly suitable for extracellular matrix organization. For the enrichment results of the red and blue modules, most of the enrichment results are related to NOA. However, there is no relevant research on the results of the brown module. This may be a direction for the next study of the NOA mechanism.
To explore the overall infiltration of immune cells in NOA, we used the GSE45885 series. Analysis of the distribution of 24 types of immune cells revealed that macrophages were one of the significant immune components in NOA, correlating positively with mast cells and NK cells. Using testicular biopsies of NOA patients, Goluza et al. reported substantial numbers of macrophages loaded with phagocytosed material, which is consistent with our bioinformatics analysis (Goluza et al., 2014). Macrophages have been visualized not only in the vicinity of seminiferous tubules, but also increasingly “intermingled” with Leydig cells. Our results suggest that mast cells and NK cells exerted a cooperative effect on macrophages, in line with previous reports on the interaction between macrophages and mast cells (Frungieri et al., 2002).
Finally, the PPI network built using the abovementioned three modules (blue, red, and brown), helped identify the following hub genes: CDK1, CDC20, CCNB1, CCNB2, and MAD2L1. We speculate that these genes may play an important role in histopathological subtypes of NOA. Cyclins (CCNB1, CCNB2) and cyclin-dependent kinases (CDK1) are key regulators of cell cycle, and consequently, they play an important role in meiosis and germ cell development (Chotiner et al., 2019). CDK1, in particular, was highly expressed, which could cause prolonged mitotic arrest during cell cycle in idiopathic NOA because of its extensive targeting for destruction through the APC/CCDC20 pathway (Li et al., 2017). CDK1 is required for meiotic progression to metaphase I in spermatogenesis, and while CDK1-deficient spermatocytes progress to the prometaphase stage, they then fail to reach metaphase I (Clement et al., 2015). Identified as a female infertility gene that initiates sister chromosome separation, CDC20 destroys cyclin B1 (Jin et al., 2010). CDC20 hypomorphic female mice, whether infertile or subfertile, produce aneuploid oocytes and embryos (Jin et al., 2010). CCNB1 and CCNB2 mRNA transcripts were found to be significantly reduced in patients with spermatogenesis disorders and might be considered as prognostic markers for azoospermic patients (Haraguchi et al., 2009). The MAD2L1 gene, which encodes the MAD2 protein, is a component of the mitotic spindle assembly checkpoint that prevents the onset of anaphase (Faisal and Kauppi, 2017). It is functional in both mitosis and meiosis (Lara-Gonzalez et al., 2012; Sun and Kim, 2012) and localizes to kinetochores in mouse spermatocytes (Kallio et al., 2000). Lower MAD2 levels have been found to reduce the apoptotic response to mis-segregating sex chromosomes and allow the formation of aneuploid sperm; hence, MAD2 levels are essential for the efficient elimination of aberrant spermatocytes (Faisal and Kauppi, 2017). Even though there have been only a few studies on the relationship between MAD2L1 and NOA, this gene and its protein product could be considered as potential biomarkers of NOA to focus on in future investigations.
In this article, we used the GEO dataset that contains very few patients with NOA/OA. The lack of sample size may cause some deviations in the analysis of our results. This is one limitation of our article. In addition, in the entire experimental design, NOA and OA may have some deviations in the results because of the difference in cellular complement.
In conclusion, we first performed differential expression analysis and enrichment analysis of between NOA and OA and found that NOA is mainly related to cell cycle, meiosis, and other processes. At the same time, the relationship between NOA and immune infiltration was evaluated. It is found that NOA is related to a variety of immune cells including macrophages. Finally, a key analysis of clinical characteristics was carried out through WGCNA to select key genes that affect NOA. Finally, it was found that CDK1, CDC20, CCNB1, CCNB2, and MAD2L1 are five important key genes. Our study provided useful hints as to which direction functional experiments should proceed.
Data Availability Statement
The original contributions presented in the study are included in the article/Supplementary Material, further inquiries can be directed to the corresponding author.
Ethics Statement
Ethical review and approval was not required for the study on human participants in accordance with the local legislation and institutional requirements. Written informed consent for participation was not required for this study in accordance with the national legislation and the institutional requirements.
Author Contributions
MD: study design, bioinformatics analysis, drafted the manuscript, and contributed to the critical discussion. HL: bioinformatics analysis and manuscript revision. XZ: critical discussion. JT: study design, critical discussion, and manuscript revision. All authors have seen and approved the final version of this article.
Funding
This work was funded by grants from the Key Laboratory of Reproductive Dysfunction Diseases and Fertility Remodeling of Liaoning Province (2018225107).
Conflict of Interest
The authors declare that the research was conducted in the absence of any commercial or financial relationships that could be construed as a potential conflict of interest.
Acknowledgments
Thanks to Mr. Xingchao Li for providing language help and writing assistance.
Supplementary Material
The Supplementary Material for this article can be found online at: https://www.frontiersin.org/articles/10.3389/fgene.2021.617133/full#supplementary-material
Footnotes
References
Bader, G. D., and Hogue, C. W. (2003). An automated method for finding molecular complexes in large protein interaction networks. BMC Bioinformatics 4:2. doi: 10.1186/1471-2105-4-2
Balbani, A. P., Marone, S. A., Butugan, O., and Saldiva, P. H. (2000). [Young’s syndrome: recurrent respiratory tract infections and azoospermia]. Rev. Assoc. Med. Bras. 46, 88–89.
Berookhim, B. M., and Schlegel, P. N. (2014). Azoospermia due to spermatogenic failure. Urol. Clin. North Am. 41, 97–113. doi: 10.1016/j.ucl.2013.08.004
Bindea, G., Mlecnik, B., Tosolini, M., Kirilovsky, A., Waldner, M., Obenauf, A. C., et al. (2013). Spatiotemporal dynamics of intratumoral immune cells reveal the immune landscape in human cancer. Immunity 39, 782–795. doi: 10.1016/j.immuni.2013.10.003
Bracke, A., Peeters, K., Punjabi, U., Hoogewijs, D., and Dewilde, S. (2018). A search for molecular mechanisms underlying male idiopathic infertility. Reprod. Biomed. Online 36, 327–339. doi: 10.1016/j.rbmo.2017.12.005
Cerván-Martín, M., Castilla José, A., Palomino-Morales Rogelio, J., and Carmona, F. D. (2020). Genetic landscape of nonobstructive azoospermia and new perspectives for the clinic. J Clin. Med. 9, undefined. doi: 10.3390/jcm9020300
Chotiner, J. Y., Wolgemuth, D. J., and Wang, P. J. (2019). Functions of cyclins and CDKs in mammalian gametogenesis. Biol. Reprod. 101, 591–601. doi: 10.1093/biolre/ioz070
Clarke, C., Madden, S. F., Doolan, P., Aherne, S. T., Joyce, H., O’Driscoll, L., et al. (2013). Correlating transcriptional networks to breast cancer survival: a large-scale coexpression analysis. Carcinogenesis 34, 2300–2308. doi: 10.1093/carcin/bgt208
Clement, T. M., Inselman, A. L., Goulding, E. H., Willis, W. D., and Eddy, E. M. (2015). Disrupting cyclin dependent kinase 1 in spermatocytes causes late meiotic arrest and infertility in mice. Biol. Reprod. 93:137.
Dorosh, A., Tepla, O., Zatecka, E., Ded, L., Koci, K., and Peknicova, J. (2013). Expression analysis of MND1/GAJ, SPATA22, GAPDHS and ACR genes in testicular biopsies from non-obstructive azoospermia (NOA) patients. Reprod. Biol. Endocrinol. 11:42. doi: 10.1186/1477-7827-11-42
Eisenberg, M. L., Betts, P., Herder, D., Lamb, D. J., and Lipshultz, L. I. (2013). Increased risk of cancer among azoospermic men. Fertil. Steril. 100, 681–685. doi: 10.1016/j.fertnstert.2013.05.022
Fainberg, J., and Kashanian, J. A. (2019). Recent advances in understanding and managing male infertility. F1000Research 8:670. doi: 10.12688/f1000research.17076.1
Faisal, I., and Kauppi, L. (2017). Reduced MAD2 levels dampen the apoptotic response to non-exchange sex chromosomes and lead to sperm aneuploidy. Development 144, 1988–1996. doi: 10.1242/dev.149492
Frungieri, M. B., Calandra, R. S., Lustig, L., Meineke, V., Kohn, F. M., Vogt, H. J., et al. (2002). Number, distribution pattern, and identification of macrophages in the testes of infertile men. Fertil. Steril. 78, 298–306. doi: 10.1016/s0015-0282(02)03206-5
Fuller, T. F., Ghazalpour, A., Aten, J. E., Drake, T. A., Lusis, A. J., and Horvath, S. (2007). Weighted gene coexpression network analysis strategies applied to mouse weight. Mamm. Genome 18, 463–472. doi: 10.1007/s00335-007-9043-3
Ge, P., Zhang, J., Zhou, L., Lv, M. Q., Li, Y. X., Wang, J., et al. (2019). CircRNA expression profile and functional analysis in testicular tissue of patients with non-obstructive azoospermia. Reprod. Biol. Endocrinol. 17:100. Epub 2019/11/30.
Goluza, T., Boscanin, A., Cvetko, J., Kozina, V., Kosovic, M., Bernat, M. M., et al. (2014). Macrophages and leydig cells in testicular biopsies of azoospermic men. Biomed. Res. Int. 2014:828697.
Hanzelmann, S., Castelo, R., and Guinney, J. (2013). GSVA: gene set variation analysis for microarray and RNA-seq data. BMC Bioinformatics 14:7. doi: 10.1186/1471-2105-14-7
Haraguchi, T., Ishikawa, T., Yamaguchi, K., and Fujisawa, M. (2009). Cyclin and protamine as prognostic molecular marker for testicular sperm extraction in patients with azoospermia. Fertil. Steril. 91(4 Suppl.), 1424–1426. doi: 10.1016/j.fertnstert.2008.05.072
Hu, Z., Xia, Y., Guo, X., Dai, J., Li, H., Hu, H., et al. (2011). A genome-wide association study in Chinese men identifies three risk loci for non-obstructive azoospermia. Nat. Genet. 44, 183–186. doi: 10.1038/ng.1040
Huang, H., Zhang, Q., Ye, C., Lv, J. M., Liu, X., Chen, L., et al. (2017). Identification of prognostic markers of high grade prostate cancer through an integrated bioinformatics approach. J. Cancer Res. Clin. Oncol. 143, 2571–2579. doi: 10.1007/s00432-017-2497-0
Jin, F., Hamada, M., Malureanu, L., Jeganathan, K. B., Zhou, W., Morbeck, D. E., et al. (2010). Cdc20 is critical for meiosis I and fertility of female mice. PLoS Genet. 6:e1001147. doi: 10.1371/journal.pgen.1001147
Jarow, J. P., Espeland, M. A., and Lipshultz, L. I. (1989). Evaluation of the azoospermic patient. J. Urol. 142, 62–65. doi: 10.1016/s0022-5347(17)38662-7
Jow, W. W., Steckel, J., Schlegel, P. N., Magid, M. S., and Goldstein, M. (1993). Motile sperm in human testis biopsy specimens. J. Androl. 14, 194–198.
Kallio, M., Eriksson, J. E., and Gorbsky, G. J. (2000). Differences in spindle association of the mitotic checkpoint protein Mad2 in mammalian spermatogenesis and oogenesis. Dev. Biol. 225, 112–123. doi: 10.1006/dbio.2000.9818
Krausz, C. (2011). Male infertility: pathogenesis and clinical diagnosis. Best Pract. Res. Clin. Endocrinol. Metab. 25, 271–285. doi: 10.1016/j.beem.2010.08.006
Krausz, C., and Riera-Escamilla, A. (2018). Genetics of male infertility. Nat. Rev. Urol. 15, 369–384. doi: 10.1038/s41585-018-0003-3
Langfelder, P., and Horvath, S. (2008). WGCNA: an R package for weighted correlation network analysis. BMC Bioinformatics 9:559. doi: 10.1186/1471-2105-9-559
Lara-Gonzalez, P., Westhorpe, F. G., and Taylor, S. S. (2012). The spindle assembly checkpoint. Curr. Biol. 22, R966–R980. doi: 10.1016/j.cub.2012.10.006
Li, L., Fan, L., Peng, N., Yang, L., Mou, L., and Huang, W. (2017). R383C mutation of human CDC20 results in idiopathic non-obstructive azoospermia. Oncotarget 8, 99816–99824. doi: 10.18632/oncotarget.21071
Liu, X., Hu, A. X., Zhao, J. L., and Chen, F. L. (2017). Identification of key gene modules in human osteosarcoma by co-expression analysis Weighted Gene Co-Expression Network Analysis (WGCNA). J. Cell Biochem. 118, 3953–3959. doi: 10.1002/jcb.26050
Long, J., Huang, C., Chen, Y., Zhang, Y., Shi, S., Wu, L., et al. (2017). Telomeric TERB1-TRF1 interaction is crucial for male meiosis. Nat. Struct. Mol. Biol. 24, 1073–1080. doi: 10.1038/nsmb.3496
Malcher, A., Rozwadowska, N., Stokowy, T., Kolanowski, T., Jedrzejczak, P., Zietkowiak, W., et al. (2013). Potential biomarkers of nonobstructive azoospermia identified in microarray gene expression analysis. Fertil. Steril. 100, e1–e7.
O’Bryan, M. K., Clark, B. J., McLaughlin, E. A., D’Sylva, R. J., O’Donnell, L., Wilce, J. A., et al. (2013). RBM5 is a male germ cell splicing factor and is required for spermatid differentiation and male fertility. PLoS Genet. 9:e1003628. doi: 10.1371/journal.pgen.1003628
Ponugoti, B., Dong, G., and Graves, D. T. (2012). Role of forkhead transcription factors in diabetes-induced oxidative stress. Exp. Diabetes Res. 939751. doi: 10.1155/2012/939751
Practice Committee of American Society for Reproductive Medicine in collaboration with Society for Male Reproduction and Urology (2008). The management of infertility due to obstructive azoospermia. Fertil. Steril. 90(5 Suppl.), S121–S124.
Practice Committee of the American Society for Reproductive Medicine in collaboration with the Society for Male Reproduction and Urology (2019). The management of obstructive azoospermia: a committee opinion. Fertil. Steril. 111, 873–880. doi: 10.1016/j.fertnstert.2019.02.013
Ren, H., Ferguson, K., Kirkpatrick, G., Vinning, T., Chow, V., and Ma, S. (2016). Altered crossover distribution and frequency in spermatocytes of infertile men with azoospermia. PLoS One 11:e0156817. doi: 10.1371/journal.pone.0156817
Ritchie, M. E., Phipson, B., Wu, D., Hu, Y., Law, C. W., Shi, W., et al. (2015). limma powers differential expression analyses for RNA-sequencing and microarray studies. Nucleic Acids Res. 43:e47. doi: 10.1093/nar/gkv007
Shannon, P., Markiel, A., Ozier, O., Baliga, N. S., Wang, J. T., Ramage, D., et al. (2003). Cytoscape: a software environment for integrated models of biomolecular interaction networks. Genome Res. 13, 2498–2504. doi: 10.1101/gr.1239303
Subramanian, A., Tamayo, P., Mootha, V. K., Mukherjee, S., Ebert, B. L., Gillette, M. A., et al. (2005). Gene set enrichment analysis: a knowledge-based approach for interpreting genome-wide expression profiles. Proc. Natl. Acad. Sci. U.S.A. 102, 15545–15550. Epub 2005/10/04. doi: 10.1073/pnas.0506580102
Sun, S.-C., and Kim, N.-H. (2012). Spindle assembly checkpoint and its regulators in meiosis. Hum. Reprod. Update. 18, 60–72. doi: 10.1093/humupd/dmr044
Szklarczyk, D., Gable, A. L., Lyon, D., Junge, A., Wyder, S., Huerta-Cepas, J., et al. (2019). STRING v11: protein-protein association networks with increased coverage, supporting functional discovery in genome-wide experimental datasets. Nucleic Acids Res. 47, D607–D613.
Thorsson, V., Gibbs, D. L., Brown, S. D., Wolf, D., Bortone, D. S., Ou Yang, T. H., et al. (2018). The immune landscape of cancer. Immunity 48, 812–830.e14.
van der Bijl, N., Röpke, A., Biswas, U., Wöste, M., Jessberger, R., Kliesch, S., et al. (2019). Mutations in the stromal antigen 3 (STAG3) gene cause male infertility due to meiotic arrest. Hum. Reprod. 34, 2112–2119.
Wosnitzer, M., Goldstein, M., and Hardy, M. P. (2014). Review of azoospermia. Spermatogenesis 4:e28218. doi: 10.4161/spmg.28218
Wyrwoll, M. J., Temel, ŞG., Nagirnaja, L., Oud, M. S., Lopes, A. M., van der Heijden, G. W., et al. (2020). Bi-allelic mutations in M1AP are a frequent cause of meiotic arrest and severely impaired spermatogenesis leading to male infertility. Am. J. Hum. Genet. 107, 342–351. doi: 10.1016/j.ajhg.2020.06.010
Yu, G., Wang, L. G., Han, Y., and He, Q. Y. (2012). clusterProfiler: an R package for comparing biological themes among gene clusters. OMICS 16, 284–287. doi: 10.1089/omi.2011.0118
Yuan, X., Zheng, H., Su, Y., Guo, P., Zhang, X., Zhao, Q., et al. (2019). Drosophila Pif1A is essential for spermatogenesis and is the homolog of human CCDC157, a gene associated with idiopathic NOA. Cell Death Dis. 10:125.
Zhao, W., Langfelder, P., Fuller, T., Dong, J., Li, A., and Hovarth, S. (2010). Weighted gene coexpression network analysis: state of the art. J. Biopharm. Stat. 20, 281–300. doi: 10.1080/10543400903572753
Keywords: non-obstructive azoospermia, immune infiltration, WGCNA (Weighted Gene Co-expression Network Analyses), hub gene, biomarkers
Citation: Dong M, Li H, Zhang X and Tan J (2021) Weighted Correlation Gene Network Analysis Reveals New Potential Mechanisms and Biomarkers in Non-obstructive Azoospermia. Front. Genet. 12:617133. doi: 10.3389/fgene.2021.617133
Received: 14 October 2020; Accepted: 22 February 2021;
Published: 31 March 2021.
Edited by:
Jordi Pérez-Tur, Institute of Biomedicine of Valencia, Superior Council of Scientific Investigations (CSIC), SpainReviewed by:
Peter Schlegel, NewYork-Presbyterian, Weill Cornell Medical Center, United StatesJana Emich, University of Münster, Germany
Copyright © 2021 Dong, Li, Zhang and Tan. This is an open-access article distributed under the terms of the Creative Commons Attribution License (CC BY). The use, distribution or reproduction in other forums is permitted, provided the original author(s) and the copyright owner(s) are credited and that the original publication in this journal is cited, in accordance with accepted academic practice. No use, distribution or reproduction is permitted which does not comply with these terms.
*Correspondence: Jichun Tan, tjczjh@163.com