 Yifei Fang1
 Xinyu Hao1
 Zhong Xu1
 Hao Sun1Qingbo Zhao1Rui Cao1Zhe Zhang2
 Peipei Ma1Yanxiao Sun3Zengmin Qi3Qingkui Wei3
 Qishan Wang2*
 Yuchun Pan2*
- 1Department of Animal Science, School of Agriculture and Biology, Shanghai Jiao Tong University, Shanghai, China
- 2Department of Animal Science, College of Animal Sciences, Zhejiang University, Hangzhou, China
- 3Breeding Company of Pigs, Laiwu, China
Laiwu pigs, distinguished by their high intramuscular fat of 7–9%, is an indigenous pig breed of China, and recent studies also found that Laiwu pigs showed high resistance to Porcine circovirus type 2. However, with the introduction of commercial varieties, the population of Laiwu pigs has declined, and some lineages have disappeared, which could result in inbreeding. Runs of homozygosity (ROH) can be used as a good measure of individual inbreeding status and is also normally used to detect selection signatures so as to map the candidate genes associated with economically important traits. In this study, we used data from Genotyping by Genome Reducing and Sequencing to investigate the number, length, coverage, and distribution patterns of ROH in 93 Chinese Laiwu pigs and identified genomic regions with a high ROH frequency. The average inbreeding coefficient calculated by pedigree was 0.021, whereas that estimated by all detected ROH segments was 0.133. Covering 13.4% of the whole genome, a total of 7,508 ROH segments longer than 1 Mb were detected, whose average length was 3.76 Mb, and short segments (1–5 Mb) dominated. For individuals, the coverage was in the range between 0.56 and 36.86%. For chromosomes, SSC6 had the largest number (n = 688), and the number of ROH in SSC12 was the lowest (n = 215). Thirteen ROH islands were detected in our study, and 86 genes were found within those regions. Some of these genes were correlated with economically important traits, such as meat quality (ECI1, LRP12, NDUFA4L2, GIL1, and LYZ), immunity capacity (IL23A, STAT2, STAT6, TBK1, IFNG, and ITH2), production (DCSTAMP, RDH16, and GDF11), and reproduction (ODF1 and CDK2). A total of six significant Gene Ontology terms and nine significant Kyoto Encyclopedia of Genes and Genomes (KEGG) pathways were identified, most of which were correlated with disease resistance and biosynthesis processes, and one KEGG pathway was related to lipid metabolism. In addition, we aligned all of the ROH islands to the pig quantitative trait loci (QTL) database and finally found eight QTL related to the intramuscular fat trait. These results may help us understand the characteristics of Laiwu pigs and provide insight for future breeding strategies.
Introduction
Laiwu pigs, a precious Chinese indigenous pig breed, are mainly distributed in Shandong Province, China. They are distinguished by a good meat quality, especially a high intramuscular fat (IMF) content of 9–12%, compared with the major commercial lean pig breeds (Yang et al., 2015). Recent studies have also found that Laiwu pigs showed high resistance to certain infectious diseases, such as Porcine circovirus type 2 (PCV2) (Li et al., 2016). These breed-specific features of Laiwu pigs are the consequences of natural and human-mediated selection. Therefore, detection of selection signatures across Laiwu pigs’ genome may help us to reveal the genetic mechanism underlying the process of IMF deposition, as well as the genes involved in resistance to PCV2.
In addition, during the last 40 years, with the introduction of western pig breeds such as Duroc and Large White pigs, the Laiwu pig population has shrunk, and some lineages have disappeared. This caused a decrease in both the nucleotide diversity and additive genetic variance in the Laiwu pig populations and led to inbreeding, which can undermine fitness traits due to the expression of highly homozygous detrimental recessive alleles (Howard et al., 2017). Thus, monitoring the genetic inbreeding levels within populations is of great importance in the genetic protection and improvement of Laiwu pigs.
The classical method for estimating the inbreeding level of a population is by calculating the inbreeding coefficient through pedigree-based information (Wright, 1922), but pedigree errors are not rare in livestock populations (Ron et al., 1996). Therefore, several more efficient alternative methods based on genome-wide sequencing data have been applied to calculate inbreeding coefficients, including ROH-based inbreeding coefficients (FROH) (McQuillan et al., 2008), which has recently become a popular method and has been successfully used in studying genomic inbreeding for various kinds of livestock populations (Ferencakovic et al., 2011; Szmatoła et al., 2019; Zhan et al., 2020). Runs of homozygosity (ROH) are defined as continuous homozygous DNA segments in diploid genomes, which are a result of the inheritance of identical haplotypes under the condition that both parents descended from a common ancestor (Gibson et al., 2006). Inbreeding is one of the main reasons for the formation of ROH (Curik et al., 2014), indicating that ROH can be used as a good measure of individual inbreeding status. Meanwhile, it has been found that both ROH number and length can provide insights into genome-wide inbreeding levels (Purfield et al., 2012), and the length of the identified ROH segments could also reflect the number of generations since inbreeding occurred (McQuillan et al., 2008).
In addition to inbreeding, other population events can also result in the formation of ROH, including genetic drift, population bottleneck, and selection (Frankham, 1996). Thus, the population history, structure, and germplasm features could be revealed by the identification and characterization of ROH (MacLeod et al., 2013; Peripolli et al., 2017). It has been found that the distribution pattern of ROH is not random across a genome (Bosse et al., 2012), and genomic regions with the highest frequency of ROH are named “ROH islands” or “ROH hotspots” (Nothnagel et al., 2010; Pemberton et al., 2012a). ROH islands are observed to be shared among individuals, which is probably a ramification of selection, as genomic regions harboring selection signatures usually overlap with ROH islands (Zhang et al., 2015). As positive directional selection can further reduce genetic diversity and increase homozygosity, thus contributing to the formation of ROH islands, genomic regions under selection are more likely to overlap with ROH islands than the rest of the genome (Pemberton et al., 2012a). Therefore, the analysis of ROH islands is commonly used to reveal putative genomic regions under selection and to disclose the genetic background of economically important traits among livestock populations (Zhang et al., 2015; Xiao et al., 2017; Onzima et al., 2018). In recent years, ROH detection has been used commonly in pigs, but few studies on ROH analysis of Laiwu pigs can be found.
The purposes of this study were to detect and characterize the ROH patterns in Laiwu pig populations using the data obtained by the Genotyping by Genome Reducing and Sequencing (GGRS) (Chen et al., 2013) method, as well as to investigate ROH islands that could contain candidate genes related to the characterized traits. Furthermore, we aimed to compare inbreeding coefficients estimated using ROH, pedigree, and single-nucleotide polymorphism (SNP) information.
Materials and Methods
DNA Sampling and Sequencing
According to the genealogical records, 93 unrelated or distantly related Laiwu pigs (including 17 male pigs and 76 female pigs) were selected from the National Conservation Farm for Laiwu Pigs in Shandong Province, China. DNA samples were extracted from their ear tissues with commercial kits (Lifefeng Biotech, Co., Ltd., Shanghai, China) and then genotyped using the GGRS method (Chen et al., 2013).
The GGRS method includes the following steps: First, the DNA sequencing libraries were prepared. Next, they were sequenced using paired-end (2 × 150 bp) sequencing methodology with an Illumina HiSeq2000 sequencer. Quality control for this procedure was conducted by filtering raw reads, as reads with base average quality scores less than 30 (an error rate of base calling of 0.1%) were excluded using NGS QC Toolkit v2.3 (Patel and Jain, 2012). The other remaining reads were then aligned to the pig genome reference (Sscrofa11.1) by BWA software (Li and Durbin, 2010). Aligned reads were used for further SNP identification and genotyping, SAMTOOLS v1.4 was used with default settings in this procedure, and missing SNP genotypes were imputed with BEAGLE v4.1 (Browning and Browning, 2016). After imputation, quality control was adopted again by applying the following criteria: all SNPs were detected in more than 30% of the samples and had no less than six-fold sequencing depth on average, as well as a minor allele frequency (MAF) ≥5%. In addition, reads mapped to the mitochondrial and sex chromosomes were excluded due to the high rates of discordance during the process of inheritance.
Estimation of Genetic Diversity
We calculated the observed heterozygosity (Ho) and expected heterozygosity (He) by PLINK v1.9 (Purcell et al., 2007). According to the classical theory of quantitative genetics proposed by Falconer D.S., if a population always keeps the same amounts of offspring for each family during the process of breed conservation, the Ne can be estimated using the following formula (Falconer, 1962):
in which Ne is the effective population size, and Nm and Nf are the number of male and female animals in this population, respectively.
Runs of Homozygosity Detection
ROH for each animal were estimated using “- homozyg” of PLINK v1.9 (Purcell et al., 2007) with the default parameter: –homozyg-snp 100, –homozyg-window-snp 50, –homozyg-window-missing 5, and so on. We used a sliding window consisting of an appointed number of SNPs to scan through each sample’s whole genome to locate the homozygous regions. One Mb was set as an ROH length threshold to exclude short homozygous segments induced by LD effects. Other criteria applied for the identification of ROH were as follows (Peripolli et al., 2018): (1) 50 SNPs were contained in each sliding window; (2) an ROH consisted of no less than 100 consecutive SNPs; (3) the density should be higher than one SNP per 50 kb; (4) SNPs with missing genotypes less than five and with a heterozygous genotype less than one were allowed in an ROH due to genotyping error. All homozygous segments filtered were classified into three length classes: 1–5, 5–10, and >10 Mb, identified as ROH1–5 Mb, ROH5–10 Mb, and ROH>10 Mb, respectively.
Inbreeding Coefficients
We used several different methods to calculate inbreeding coefficients according to the pedigree and genomic information, and these inbreeding coefficients were further compared by Pearson’s correlation analysis. The R package “pedigree” was used to estimate the inbreeding coefficients based on pedigree (FPED) for all individuals (Coster and Coster, 2010). Inbreeding coefficients were calculated according to the genomic information, which includes those estimated from ROH (FROH) (McQuillan et al., 2008) and from SNP information (FSNP). FROH was calculated according to the following formula:
where LROH is defined as the total length of the genome covered by all ROH segments for each individual, and Lauto is the length of the sequenced genome, which equaled 2.26 Gb in this research. Following the study of Xu et al. (2019), we divided FROH into four types of estimates based on the length of the observed ROH: FROH_all (>1 Mb), FROH1–5 Mb (1–5 Mb), FROH5–10 Mb (5–10 Mb), and FROH>10 Mb (>10 Mb). It has been reported that a lower limit of ROH length of 1 Mb has a genetic distance of 1 cM approximately (Zanella et al., 2016), which allows us to use the FROH _all (>1 Mb) to trace the ancestral inbreeding events that occurred 50 generations ago. Similarly, the corresponding spans for the last three FROH estimates are 10 to 50 generations, 5 to 10 generations, and 5 generations.
GCTA software was used to obtain the three estimates of inbreeding coefficients based on SNP (FSNP1, FSNP2, and FSNP3) with the option “-ibc” (Yang et al., 2011): they were derived based on the variance of the additive genotypes (VanRaden, 2008), the degree of homozygous excess (Wright, 1948), and the correlation between the uniting gametes (Wright, 1922). Discussed hereafter are the formulae used:
In which Yi is the amount of the reference allele copies at the i-th SNP locus, pi refers to the frequency of the allele at the i-th SNP locus for this individual, hi is calculated as: hi = 2pi(1−pi) and n is the amount of SNPs.
Detection of Runs of Homozygosity Islands and Candidate Genes
To detect the ROH islands, we calculated the frequency of occurrences within the ROH regions of each SNP across the individuals and made a Manhattan figure by plotting these values in conformity with the position of each SNP on chromosomes. The SNPs in the top 1% of the frequency of occurrence were selected as a hint of a potential ROH island (Pemberton et al., 2012b). A chain of adjoining selected SNPs can merge to integrate an ROH island. Genes that were fully or partially contained by these ROH islands were identified and annotated using the University of California, Santa Cruz Genome Browser1. Further analysis of gene functions was performed using the Kyoto Encyclopedia of Genes and Genomes (KEGG) pathway and Gene Ontology (GO) enrichment analyses by DAVID 6.82, and terms with a p-value greater than 0.05 were filtered.
Results
DNA Sequencing and Genetic Diversity
A total of 369 million clean reads were obtained, and each individual pig had approximately 4.75 million clean reads. The average sequencing coverage of the entire genome was 2.5%, and the average sequencing depth was 8×. With the invalid data filtered out, we finally obtained 182,021 informative SNPs. The sequenced SNPs were distributed evenly along the genome (Figure 1), and the average density was approximately 1 SNP per 10.3 Kb. We mapped these SNPs to the Ensemble pig gene annotation set (Ensemble release 92) and found that 91,064 SNPs were within gene regions, including 3,218 SNPs within exons and 9,817 within untranslated regions. The result shows that approximately 50% SNPs were within gene regions, but only 1.7% of SNPs were within exons. This result is unexpected. GGRS libraries were not designed to target polymorphisms within genes, so this proportion seems relatively high. Similar results have been reported in Jinhua pigs (Xu et al., 2019). The average Ho and He of this Laiwu pig population were 0.27 and 0.38, respectively. The value of Ho is lower than the result reported before (0.284), whereas He is higher (0.281) (Wang et al., 2021). In addition, the Ne of this population was 52.6, which suggests it is quite likely that inbreeding has happened.
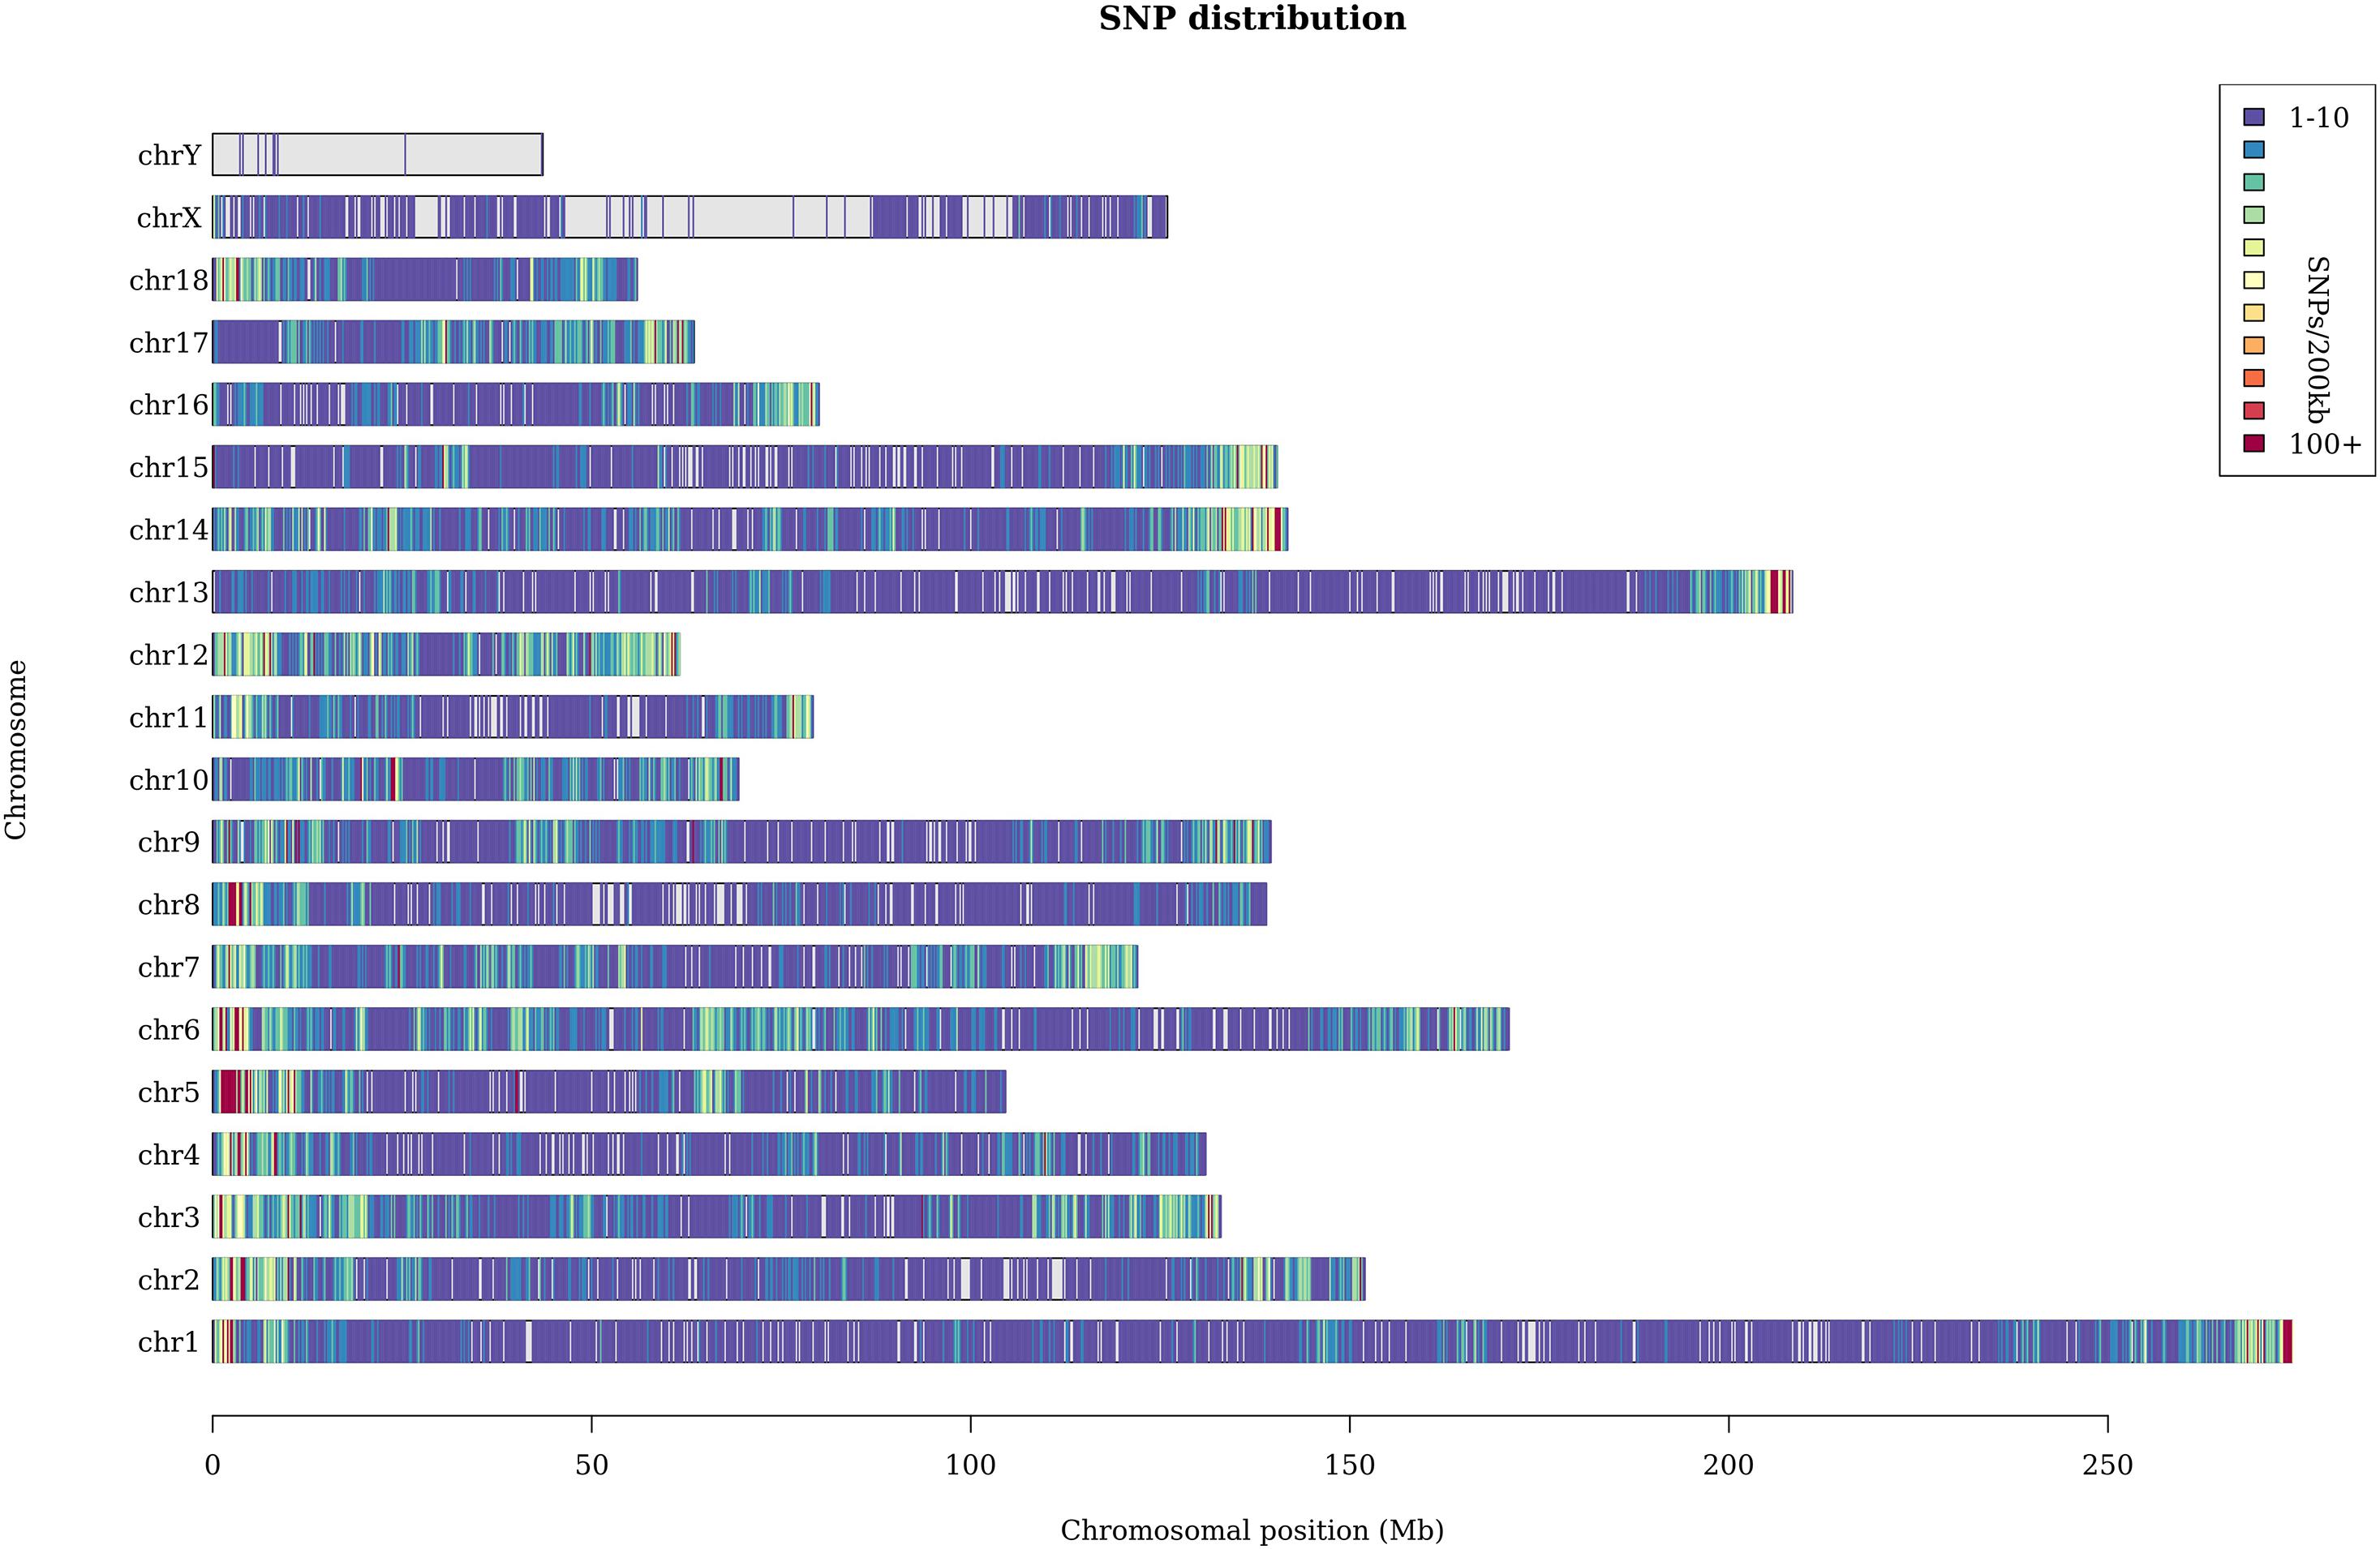
Figure 1. Distribution of the sequenced SNPs on all chromosomes. The y-axis represents chromosomes, and the x-axis represents the corresponding chromosomal position (Mb). Different colors of each 200-kb genome block denote the number of SNPs.
Inbreeding Coefficients Estimate
The inbreeding coefficient of each individual estimation based on pedigree, ROH of different lengths, and the SNPs are shown in Table 1. The average inbreeding coefficient estimates obtained from different lengths of ROH segments follow this order, FROH>10 Mb < FROH5–10 Mb < FROH1–5 Mb. Compared with them, FPED, the average inbreeding coefficient calculated from the pedigree, was the lowest (0.021).
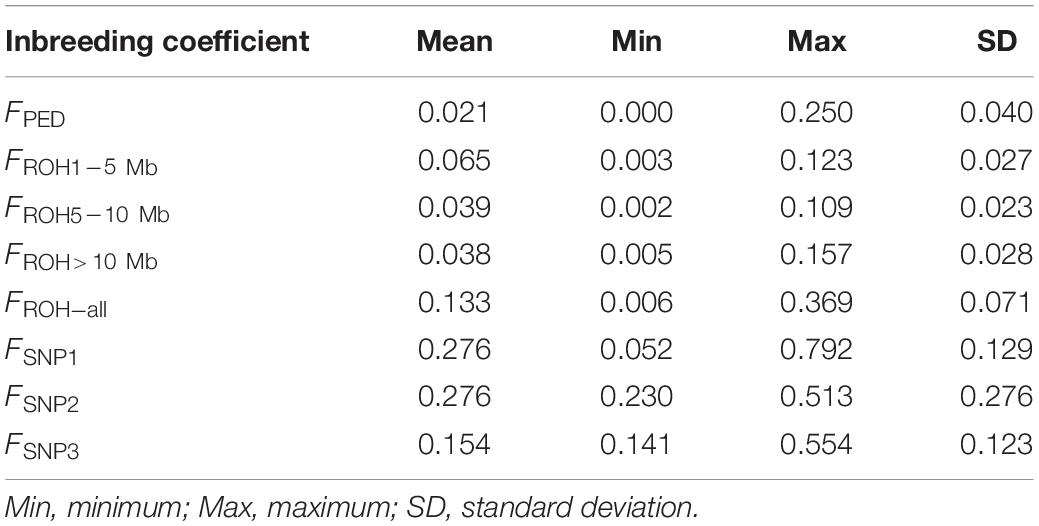
Table 1. Descriptive statistics for the eight types of inbreeding coefficient estimates calculated from the pedigree (FPED), the identified ROH (FROH_ all, FROH1–5 Mb, FROH5–10 Mb, and FROH > 10 Mb), and the SNP information (FSNP1, FSNP2, and FSNP3).
The correlation coefficients among all of the results estimated by different methods are shown in Table 2. The correlation between inbreeding coefficients estimated by the pedigree and the genomic data was weak (varied from −0.188 to 0.055). The correlation among all of the estimates calculated based on the ROH information was strong. FROH_ was strongly correlated with the other ROH-based estimates, and the correlation coefficients between FROH_ all and FROH1–5 Mb were the highest (0.910), whereas the weakest correlation among the ROH-based estimates was between F5–10 Mb and F>10 Mb, which was 0.593. The correlation among all the values calculated by the SNPs was strong and statistically significant. However, the correlations between the estimates based on the SNPs and ROH data were relatively strong, except for FSNP2, which was significantly correlated with all of the ROH-based inbreeding coefficients.
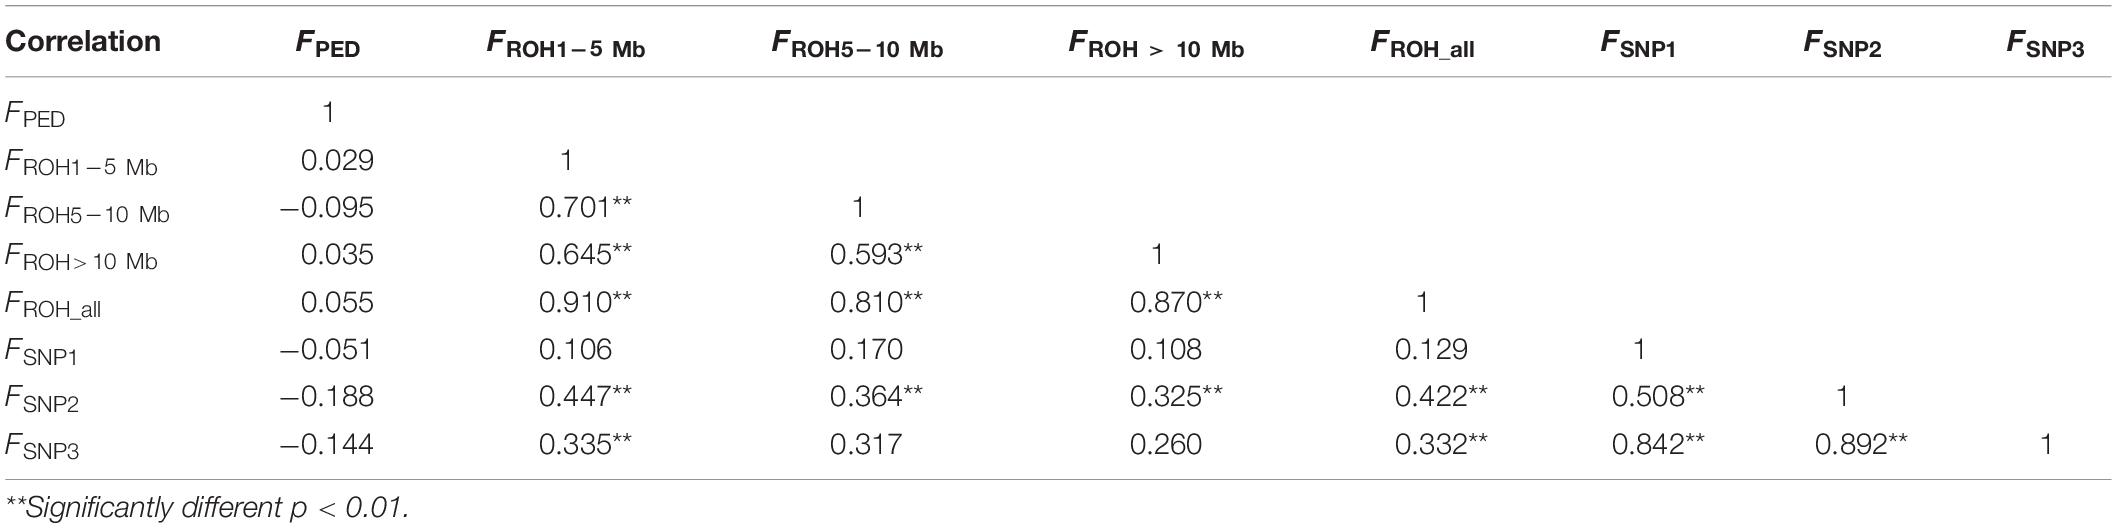
Table 2. Correlation coefficients (lower panel) among eight types of inbreeding coefficient estimates (FPED, FROH1–5 Mb, FROH5–10 Mb, FROH >10 Mb, FROH_ all, FSNP1, FSNP2, and FSNP3).
Genomic Distribution of Runs of Homozygosity
In our study, 7,508 ROH segments were found in 93 individuals, with an average length of 3.76 Mb. The segment with the longest segment (45.15 Mb) was SSC15, which contains 978 SNPs. In contrast, the shortest segment (1 Mb) only consisted of 265 SNPs (Figure 2A). In total, all ROH segments covered 13.4% of the entire genome.
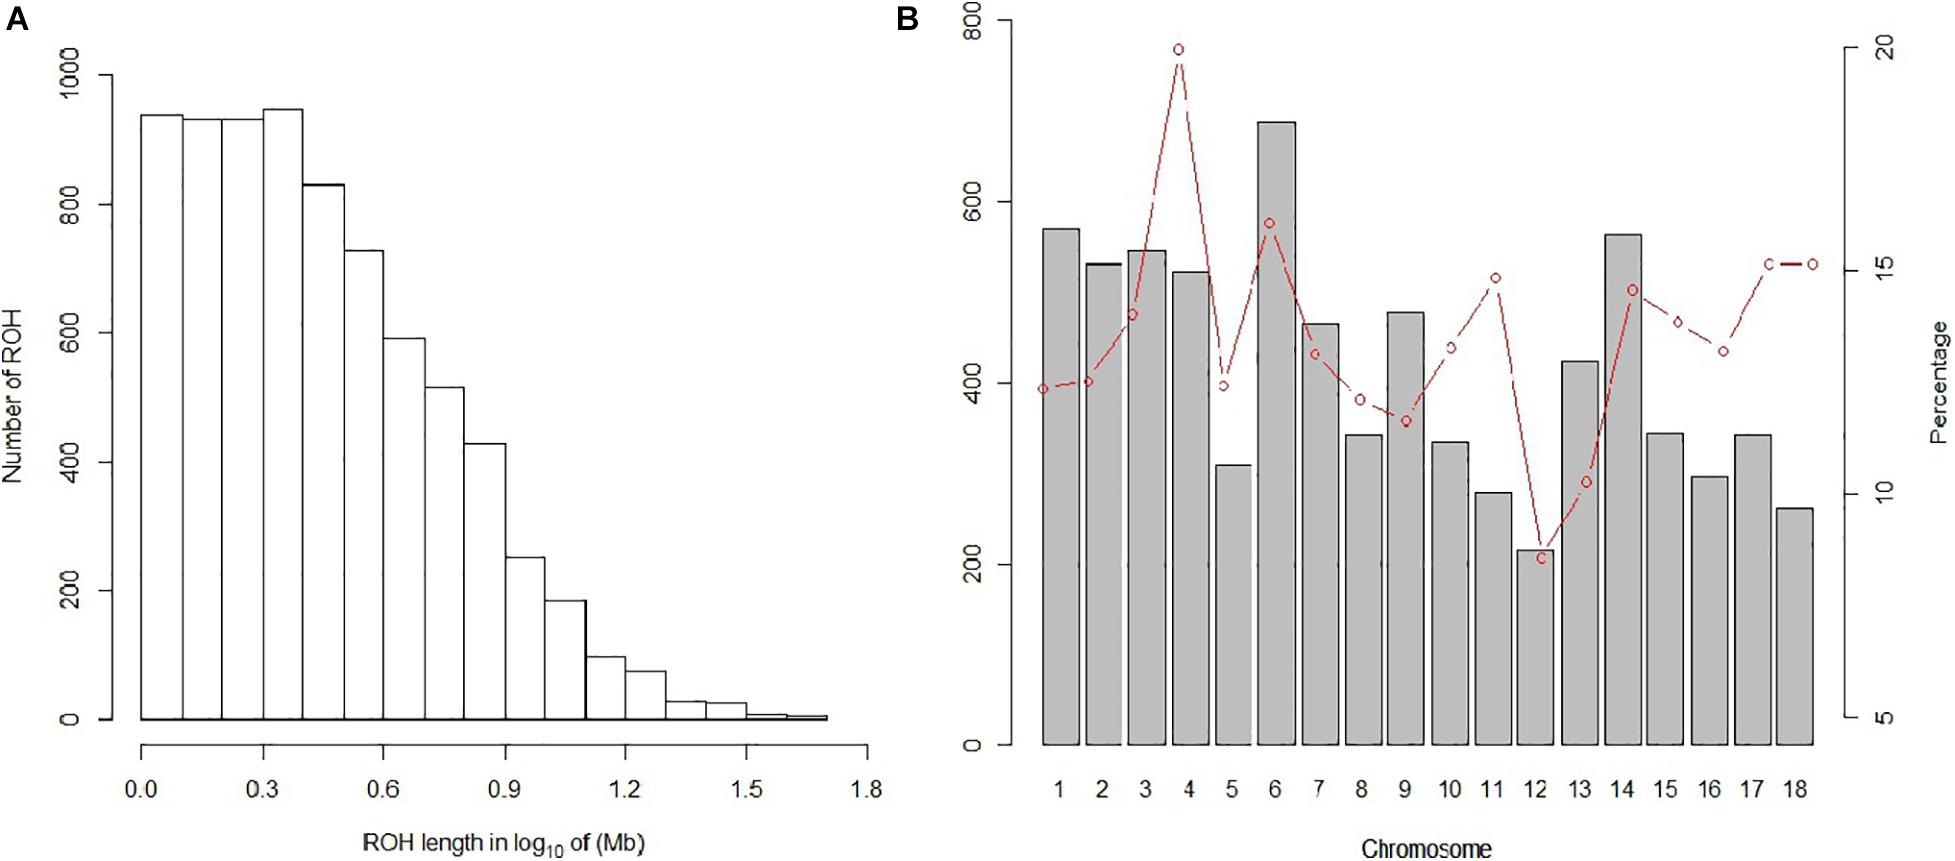
Figure 2. Distribution of the ROH. (A) Length distribution of the ROH. X-axis represents the length of the ROH (Mb) using a base-10 log scale. Y-axis represents the number of ROH for different ROH lengths. (B) Bars and the red dotted line represent the number of ROH and the ROH coverage, respectively, on each chromosome.
The statistics of ROH number and length classified by ROH length are shown in Table 3. Among the three classes of ROH segments, the majority were short ROH segments (1–5 Mb), accounting for 78.46% of the total number of ROH segments, and it also had the highest genome coverage of 48.43% of the total length of all ROH segments. ROH5–10 Mb had a lower quantity of 1,197 (15.94% of the total ROH number), and it made up 28.81% of the total ROH length. The number of long ROH segments was the lowest, only 5.57%, but it still had a coverage ratio of 22.76%.
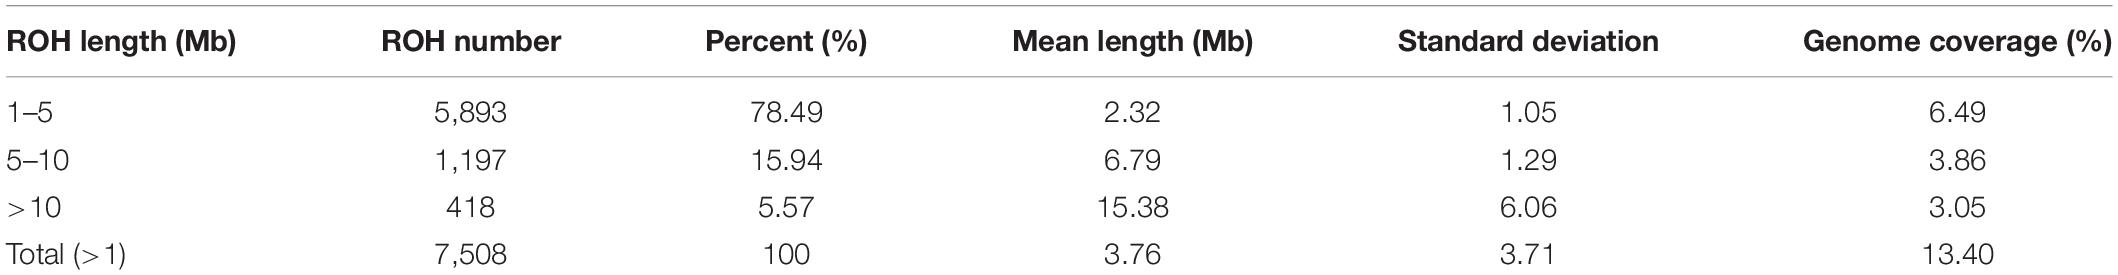
Table 3. Descriptive statistics for ROH of different lengths (Mb): 1–5, 5–10, >10, and >1.
For individuals, high variability was observed in both the number of ROH segments and the genome coverage; the former varied from 6 to 166, and the latter varied from 0.56 to 36.86%. For chromosomes, the number and coverage of ROH on each chromosome are shown in Figure 2B. These results suggest that SSC6 has the highest number of ROH segments of 688, and its coverage is 16.078%. In contrast, ROH segments in SSC12 have the lowest number of 215, and its coverage ratio is also the lowest (8.56%). SSC4 has the highest coverage ratio of 19.95%.
Detection of Runs of Homozygosity Islands
To identify the genomic regions with high ROH frequency, we first calculated the frequency of SNP occurrence in the ROH and selected the top 1% among those with the highest frequency (present in at least 33.3% of the samples) (Figure 3). There were four adjacent SNPs on SSC4 at ∼35 Mb with the highest frequency of 60.2%, which is similar to the findings of Wang et al. (2021), but no gene has been mapped in this region according to the reference genome (Sscrofa11.1). Neighboring selected SNPs that constitute regions with the highest frequency of ROH are called ROH islands. The genomic regions of the ROH islands detected in Laiwu pigs, distributed unevenly on different chromosomes with lengths varying from 0.031 to 14.4 Mb, are presented in Table 4. The longest ROH island was found to be on SSC6 and consisted of 320 contiguous SNPs, and the longest ROH cod-spot was on SSC4, containing 1,177 contagious SNPs.
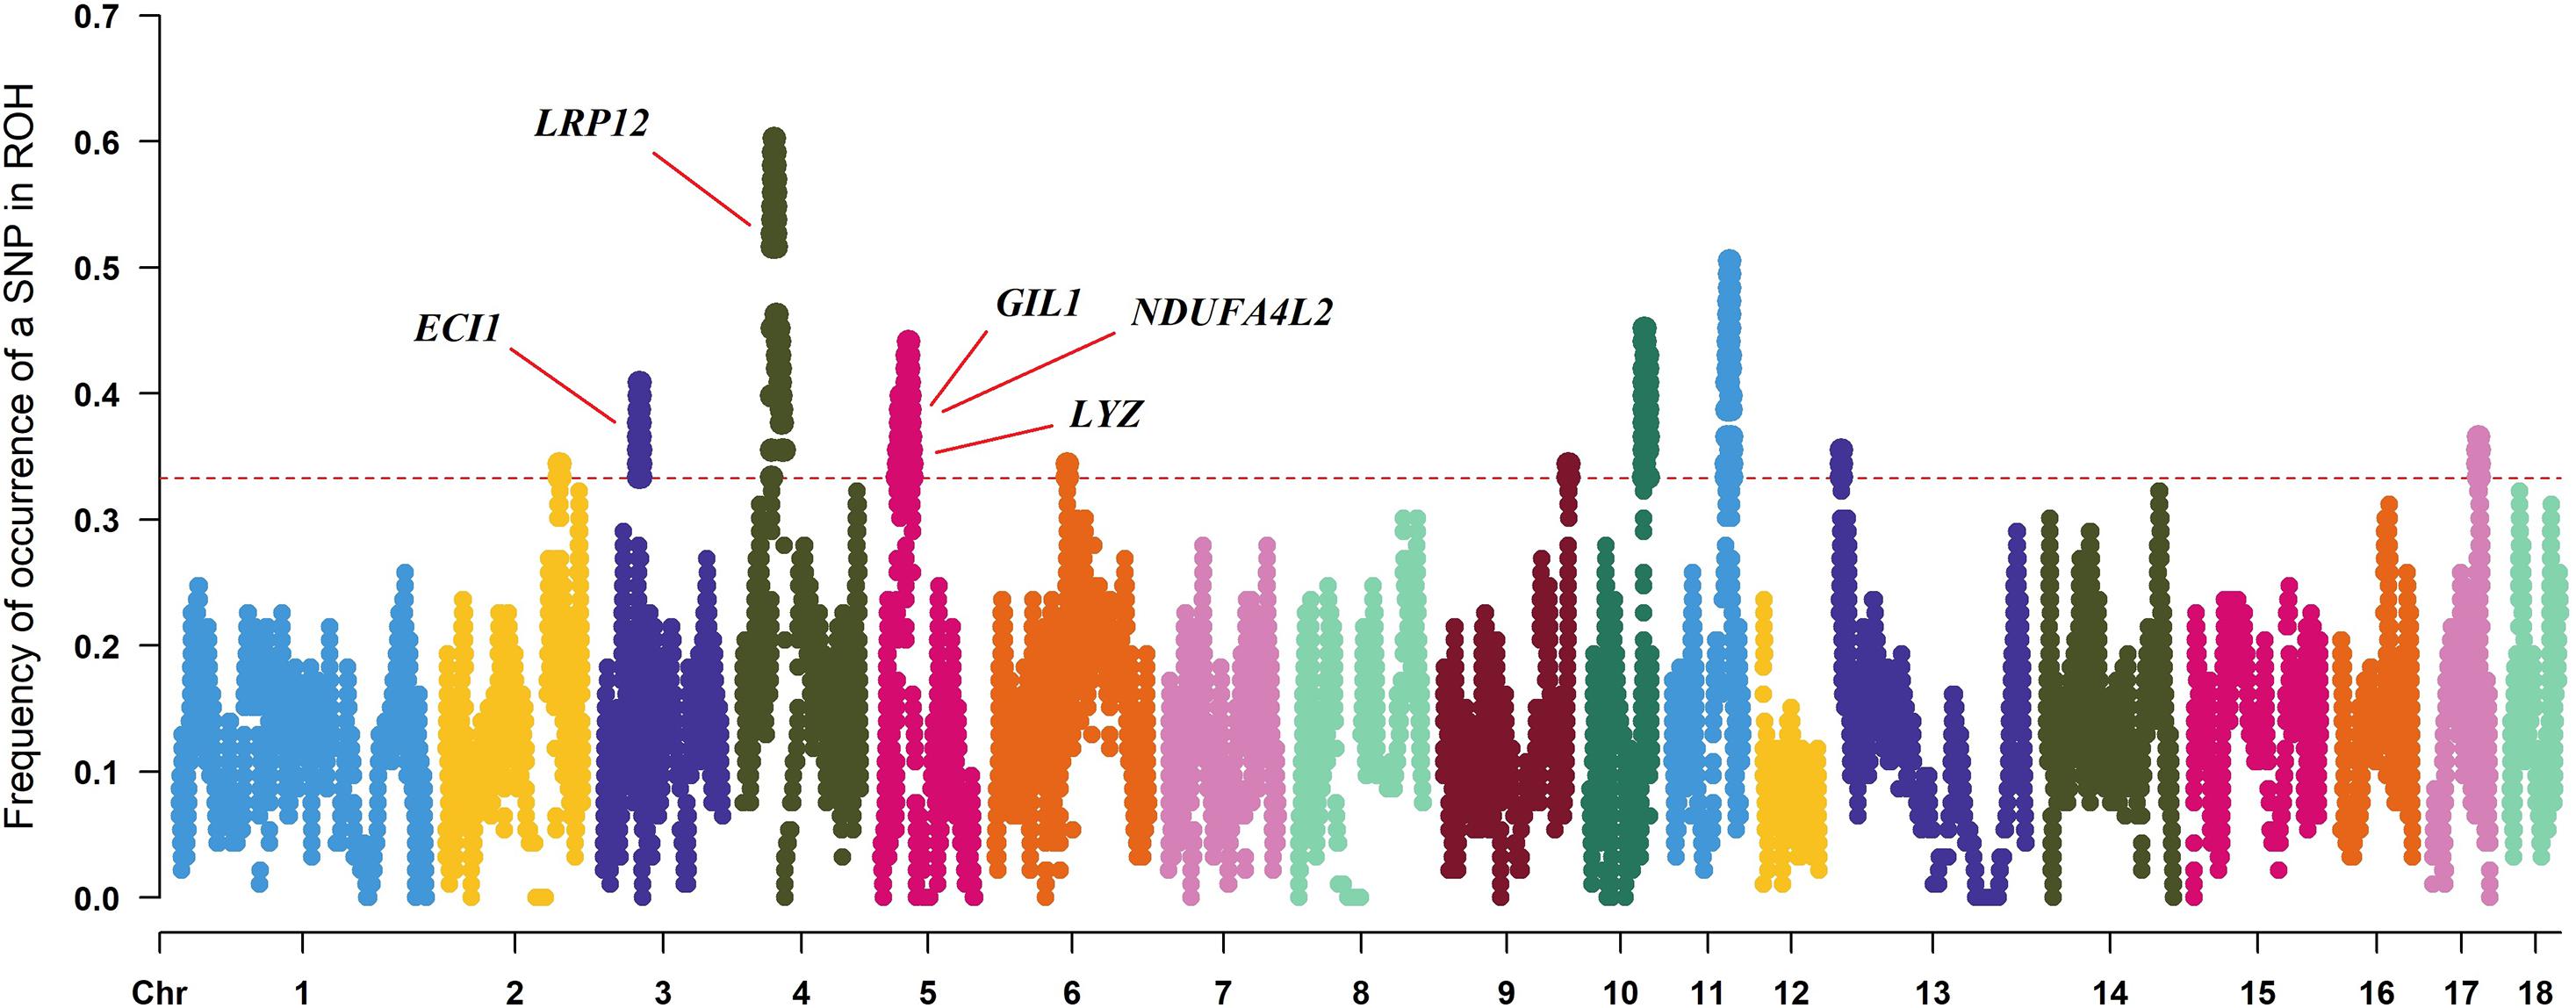
Figure 3. Frequency of occurrences of each SNP within ROH regions among all of the individuals. Horizontal red line represents the 33% threshold. Genes related to meat quality have been identified.
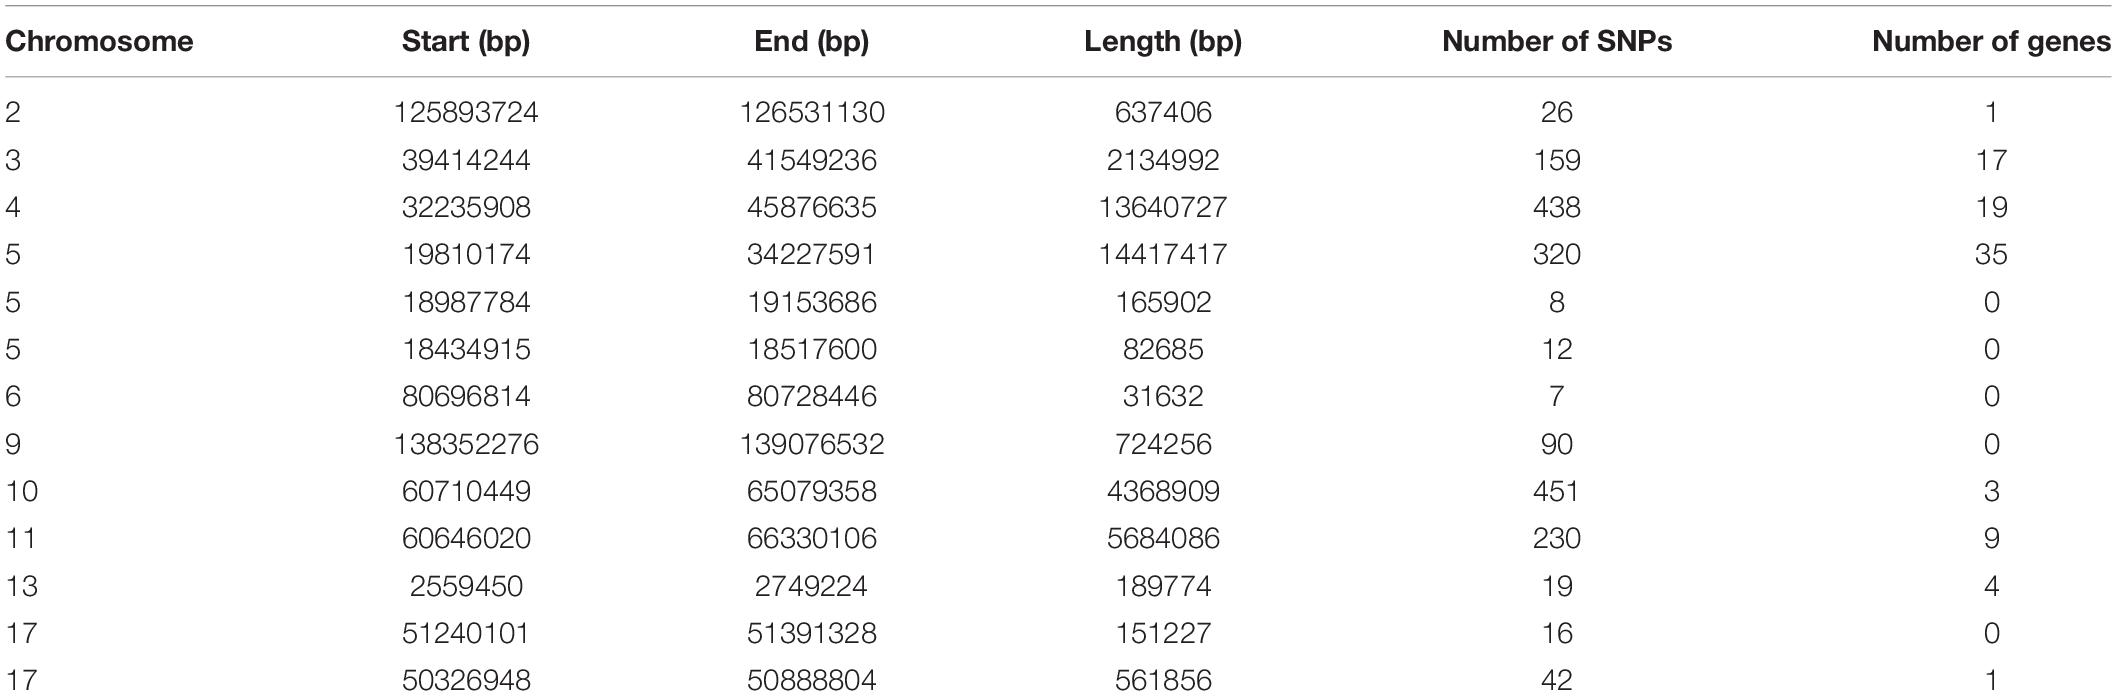
Table 4. List of ROH islands observed in this Laiwu pig population.
Candidate Genes Within Runs of Homozygosity Islands
Thirteen ROH islands were detected in our study, and there were 86 genes within those regions according to the University of California, Santa Cruz database (Supplementary Table 1). The position and number of the constituent SNPs and genes in those ROH islands are listed in Table 4. SSC5 has the most islands, and the longest island, which contains 320 SNPs and 35 genes, is also found between 19,810,174 and 34,227,591 bp. In some ROH islands that contain fewer contagious SNPs, no gene was detected. Candidate genes within all of the ROH islands detected were correlated with many economically important traits, such as meat quality (ECI1, LRP12, NDUFA4L2, GIL1, and LYZ), immunity capacity (IL23A, STAT2, STAT6, TBK1, IFNG, and ITH2), production (DCSTAMP, RDH16, and GDF11), and reproduction (ODF1 and CDK2). All genes found were further subjected to GO and KEGG enrichment analyses. Six significant GO terms and nine significant KEGG pathways are shown in Figure 4 and Supplementary Table 2. Most terms and pathways were correlated with disease resistance and biosynthesis processes, and one KEGG pathway was related to lipid metabolism. In addition, we aligned all of these ROH islands to the pig quantitative trait loci (QTL) database and finally found eight QTLs related to the IMF trait.
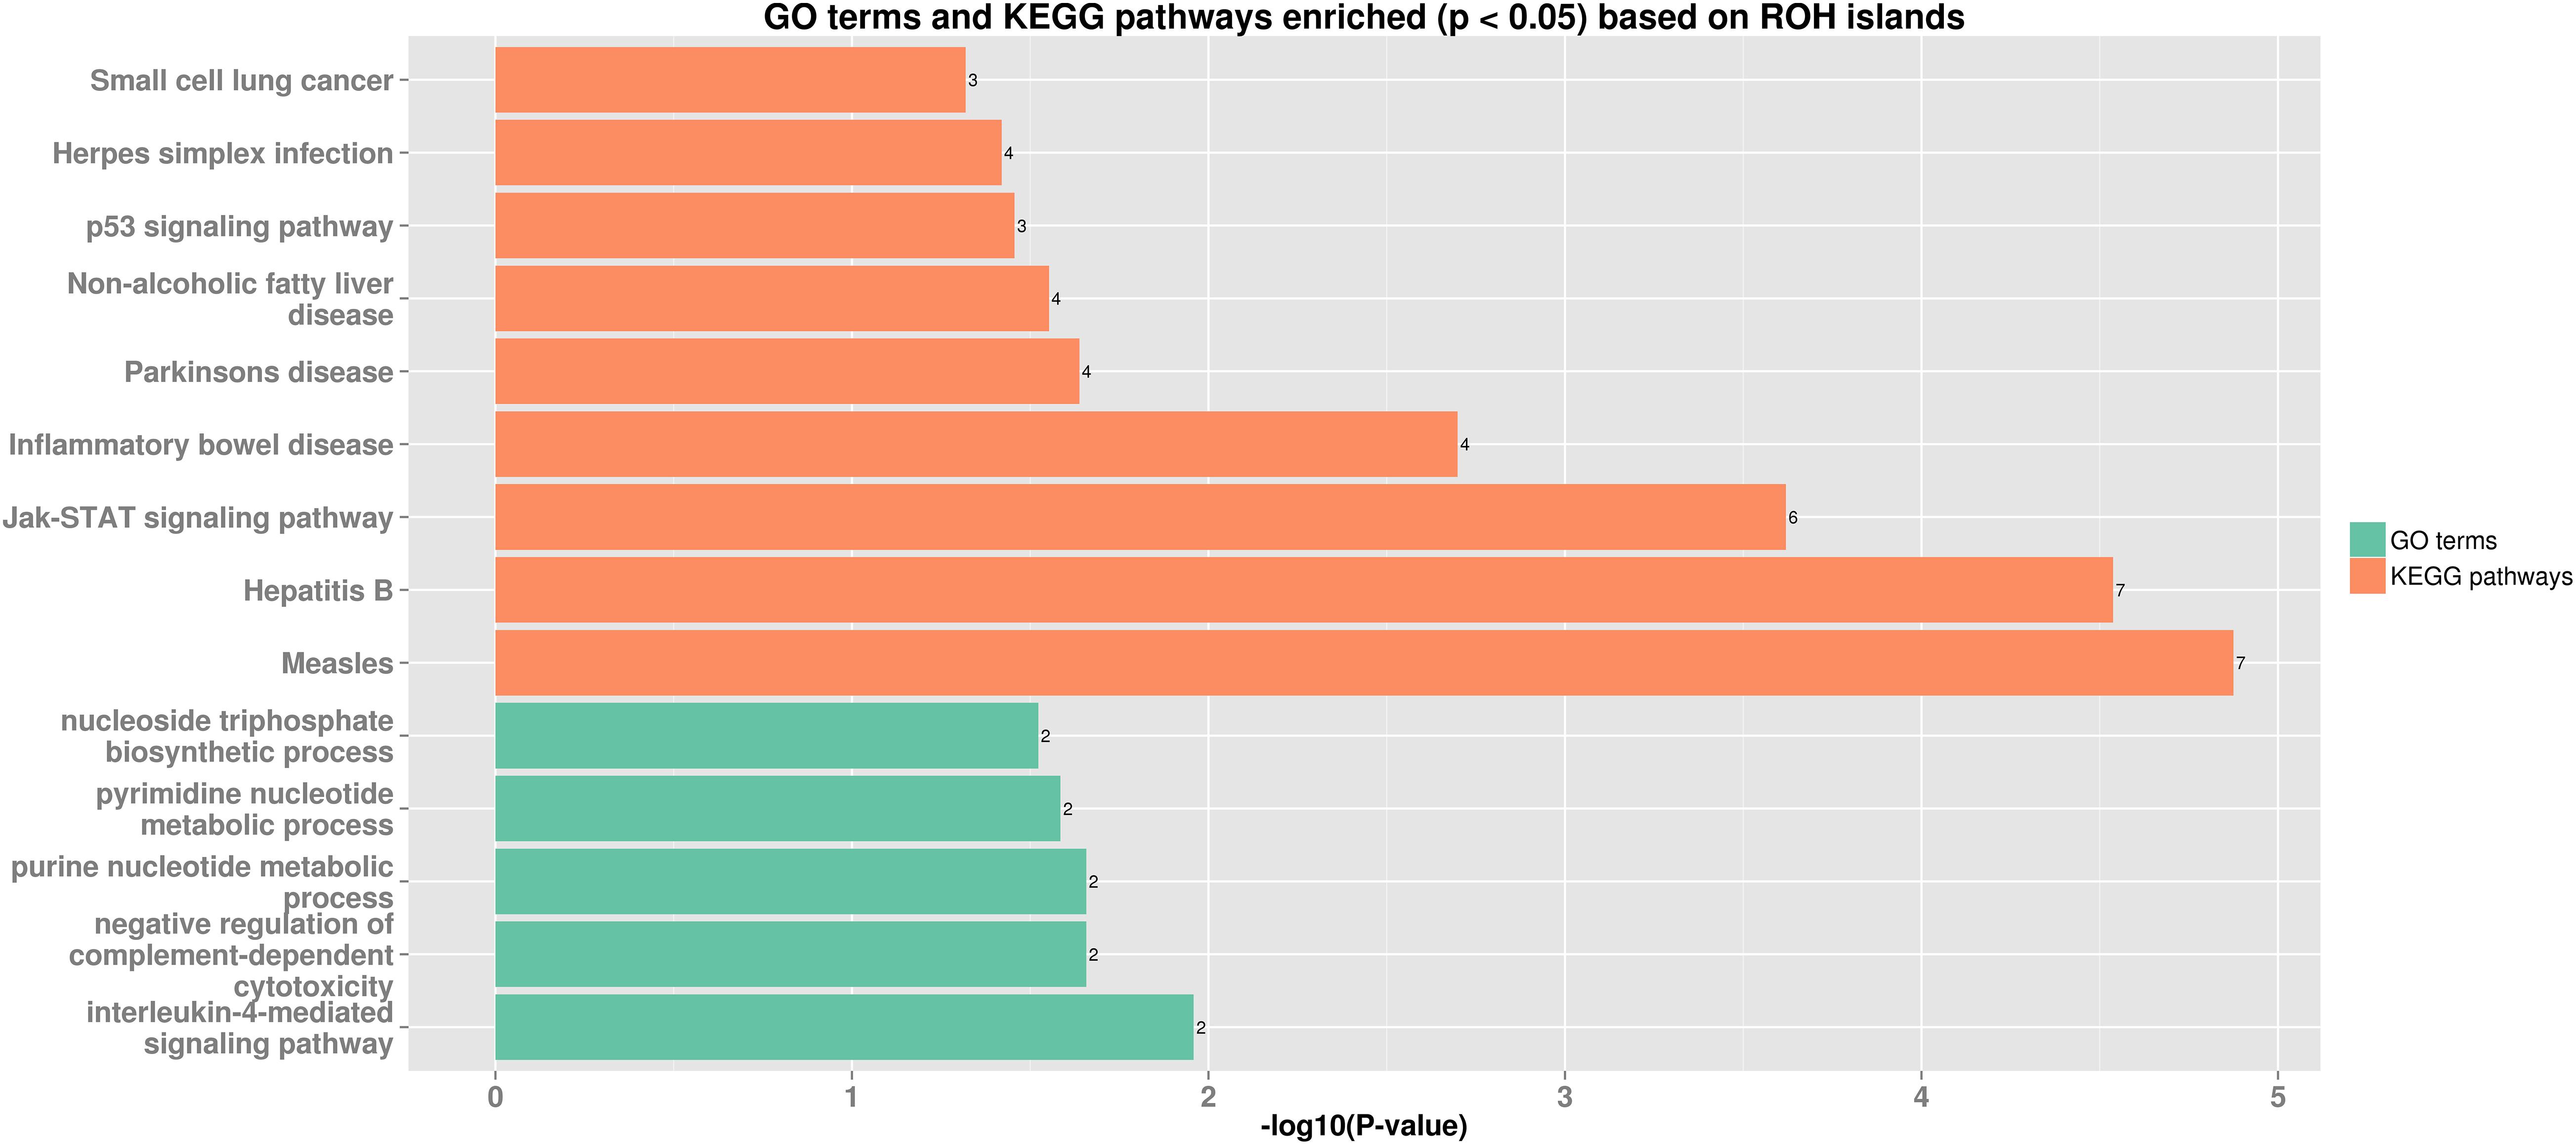
Figure 4. Bar plot of GO terms and KEGG pathways enriched (p < 0.05) based on ROH islands. Orange bars show enriched GO terms, and green bars show KEGG pathways.
Discussion
Characteristics of Runs of Homozygosity
In our study, the number of small ROH segments was the highest, whereas the number of medium and large segments was much lower, especially large segments (>10 Mb). Small ROH can reflect ancestry inbreeding history, whereas large segments are usually formed by recent inbreeding. These results indicated that both ancient and recent inbreeding events might affect this Laiwu population, but recent inbreeding was not frequent. However, it should be noted that the length of ROH may not always reflect the generations from inbreeding events that took place, as randomness exists during the formation of ROH, which can be affected by the dynamic rates of recombination, as well as the stochastic nature during gamete formation (Liu et al., 2010). Kirin et al. (2010) reported that short segments (<4 Mb) could also indicate the consequence of a decreased population size and bottleneck event.
The variability of the number of ROH among individuals was high, which coincides with the results of studies on cattle and sheep (Purfield et al., 2017; Peripolli et al., 2018). ROH number and coverage also differ from chromosome to chromosome, but the number of ROH tends to increase as the length of the chromosome increases. It has been reported that ROH are easy to form and inherit on some chromosomes but relatively difficult on other chromosomes, suggesting that some parts of the genome are less supportive of maintaining the accumulation of IBD than others (Nandolo et al., 2018). This phenomenon could be related to the selection. Chromosomes with high ROH coverage may suggest that they have been affected by positive selection, which will increase the accumulation of advantageous alleles and the neutral alleles genetically linked with them (Smith and Haigh, 1974). In contrast, the chromosome with low ROH coverage could indicate purifying selection, which decreases the number of homozygous deleterious alleles (Ferenčaković et al., 2013). In our study, some genomic regions of SSC4 and SSC12, which have the highest coverage and lowest coverage, respectively, may have been under natural or artificial selection.
The SNPs used to detect ROH regions were obtained from GGRS, a high-throughput reduced representation sequencing method in our study. It is a cost-effective approach and is designed for outbreed population, making it suitable for the population of Laiwu pigs in our research. However, the challenge is that the distribution of the data generated by it is unbalanced among individuals, which often causes a large portion of missing genotypes, which would impact subsequent analysis. To address this issue, imputation is inevitably used, and it has been included in the GGRS protocol. After imputation, we have also taken quality control measures, including filtering out the SNPs with a MAF < 0.05. This filter is necessary to ensure the precision of imputation (Wang et al., 2015).
There might be concerns about the necessity and appropriateness of imputation and the subsequent filtration with MAF, but several researchers have conducted studies that may help address such concerns. Imputed data have been used to detect ROH as found in several published works (Power et al., 2014; Chitneedi et al., 2017). It has been reported that using imputed data for ROH detection can produce comparable results with using the data that are restricted to genotyped SNPs only (Keller et al., 2012); Zhang et al. (2018) have also conducted the simulation to study the reliability of the use of imputed data in ROH detection and found that using imputed data with an average missing genotype rate of 0.7 could give a comparable amount of ROH detected compared with using data with no missing genotypes. Admittedly, removing monomorphic SNPs may reduce the chance to detect ROH, but it helps to exclude false-positive results. It has been reported that removing SNPs with low MAF (<0.05) before the analysis can minimize the trade-off between the exclusion of non-autozygous ROHs and the cost of missing shorter autozygous ROHs (Howrigan et al., 2011).
To date, few studies have been done comparing the performance of software used for ROH detection and the ways of determining appropriate parameters (Howrigan et al., 2011). Actually, a standard methodology for ROH detection is still ambiguous (Biscarini et al., 2020). In our study, we used PLINK software with default parameters to detect ROH; the same method has been applied in several published works (Peripolli et al., 2018; Xu et al., 2019).
Runs of Homozygosity as a Tool of Inbreeding Estimation
The traditional method of estimating inbreeding coefficients is based on pedigree, and it is not as efficient as the method based on genomic information because errors usually exist in pedigree records. FPED only indicates the expectation of homozygosis, whereas FROH and FSNP can reflect the realized homozygous loci (Visscher et al., 2006). In our study, the value of FPED was much lower than FROH, which may be due to errors in the pedigree information. This may also be due to an inadequate pedigree, as FROH could suggest an inbreeding history 50 generations ago, but our pedigree only contains 8–10 generations of records. Some events, such as selection and mutation, were not involved in the method of estimating inbreeding coefficients, so the value of FPED was likely to have a bias (Ceballos et al., 2018). In addition, our sequencing and genotyping method used reduced sequencing, which only covered 2–3% of the whole genome, so we may have overestimated the homozygosity of some regions and produced false-positive results during the process of identifying the ROH segments. Overestimating the number of ROH would also lead to an overestimation of inbreeding coefficients based on ROH.
In our study, the correlation between FPED and FROH or FPED and FSNP was insignificant, which may be due to the inaccuracy of the pedigree. It has been reported that the correlation between FPED and FROH would become stronger as the length of the ROH increase, as long ROH segments can reflect a recent inbreeding situation, which coincides with the trend found in our results (Magi et al., 2014). The correlation among the four indexes calculated by ROH was strong, especially between FROH_all and FROH1–5 Mb because the length of most ROH segments ranged from 1 to 5 Mb. The correlation between FSNP and FROH was relatively strong, which may because the identifying of ROH was based on the results of SNP genotyping. FSNP2 correlates most strongly with FROH because they both directly reflect homozygosity.
Analysis of Candidate Genes Within Runs of Homozygosity Islands
We identified and annotated several candidate genes contained by ROH islands and found they were related to various breeding traits, including meat quality, immunity, production, reproduction, etc. Because Laiwu pigs are characterized for high IMF contents, several candidate genes detected in our study were reported to be associated with lipid deposition and meat quality. ECI1 expression was observed to have a positive correlation with IMF content (Lu et al., 2017). LRP12 was reported to have highly significant associations with gluteus medius saturated fatty acid content in Duroc pigs (Melo et al., 2013). NDUFA4L2 can affect metabolic enzyme activities, which has a direct impact on meat quality (Liu et al., 2016). GIL1 negatively correlates with fat accumulation, and LYZ has been proven to be related to conductivity 24, pH1, and drip loss of porcine meat (Srikanchai et al., 2010). Some candidate genes relating to immunity were identified, such as IL23A, STAT2, STAT6, TBK1, and IFNG. It is noteworthy that ITH2 was reported to be one of the putative PCV2 Cap-interacting host proteins by coimmunoprecipitation combined with liquid chromatography–mass spectrometry approach (Zhou et al., 2020), which may explain the strong ability of PCV2 resistance of Laiwu pigs. Some genes are related to production traits. DCSTAMP can affect feed gain ratio (Tao et al., 2017), and RDH16 is also correlated with feed efficiency (Zhao et al., 2016). GDF11 was proven to be the candidate gene involved in growth and body size in micro pigs (Son et al., 2020) and can raise the number of ribs in knock-out mice (Zhang et al., 2016). ODF1, participating in spermatogenesis and CDK2, affects the meiosis of oocytes, affecting the reproduction traits of pigs. WIF1 could be a crucial mutation associated with ear size (Liang et al., 2019), which can correlate with the big ears of Laiwu pigs.
According to the Pig QTL database, several QTLs related to meat quality, immunity, the reproduction process, and other traits overlapping with the detected ROH islands are listed. In particular, some QTLs involved in the process of IMF deposition have already been reported: ID = 639 (Bink et al., 2000), ID = 145 (Gerbens et al., 2001), ID = 150, ID = 151, ID = 299 (Ovilo et al., 2002a,b), ID = 313 (de Koning et al., 1999), ID = 639 (Bink et al., 2000), and ID = 4169 (Ovilo et al., 2000).
Conclusion
In summary, this study investigated the patterns of ROH and calculated inbreeding coefficients in 93 Laiwu pigs, which revealed how diversity evolved in the Laiwu population. We found that this population has been affected by historical inbreeding events, but recent inbreeding events are not frequent. Moreover, we identified 13 ROH islands putatively under natural and/or artificial selection harboring genes with molecular functions related to characteristic traits. We found that most genes contained by ROH islands were associated with disease resistance and biosynthesis processes. In addition, several genes related to economically important traits, such as meat quality, were also detected. These results may help us understand the characteristics of Laiwu pigs and provide insight for future breeding strategies.
Data Availability Statement
The datasets presented in this study can be found in online repositories. The names of the repository/repositories and accession number(s) can be found in the article/Supplementary Material.
Author Contributions
YP and QWe designed the experiment. YF, XH, ZX, and HS performed the experiment. QZ, PM, and ZZ developed some analysis software used in this study. YF wrote the manuscript with RC’s kind help. All authors have read and approved the final manuscript.
Funding
This study was supported by the National Natural Science Foundation of China (grant nos. 31941007, 31972534, and 31872976) and the Key Technology R&D Program of Laiwu City Finance Bureau and the Laiwu City Science and Technology Bureau (grant no. 2017GRC5211).
Conflict of Interest
YS, ZQ, and QWe were employed by Breeding Company of Pigs, Laiwu, China.
The remaining author declares that the research was conducted in the absence of any commercial or financial relationships that could be construed as a potential conflict of interest.
Supplementary Material
The Supplementary Material for this article can be found online at: https://www.frontiersin.org/articles/10.3389/fgene.2021.629966/full#supplementary-material
Footnotes
References
Bink, M. C., Te Pas, M. F., Harders, F. L., and Janss, L. L. (2000). A transmission/disequilibrium test approach to screen for quantitative trait loci in two selected lines of large white pigs. Genet. Res. 75, 115–121. doi: 10.1017/s0016672399004061
Biscarini, F., Mastrangelo, S., Catillo, G., Senczuk, G., and Ciampolini, R. (2020). Insights into genetic diversity, runs of homozygosity and heterozygosity-rich regions in maremmana semi-feral cattle using pedigree and genomic data. Animals 10:2285. doi: 10.3390/ani10122285
Bosse, M., Megens, H.-J., Madsen, O., Paudel, Y., Frantz, L. A. F., Schook, L. B., et al. (2012). Regions of homozygosity in the porcine genome: consequence of demography and the recombination landscape. PLoS Genet. 8:e1003100. doi: 10.1371/journal.pgen.1003100
Browning, B. L., and Browning, S. R. (2016). Genotype imputation with millions of reference samples. Am. J. Hum. Genet. 98, 116–126. doi: 10.1016/j.ajhg.2015.11.020
Ceballos, F. C., Joshi, P. K., Clark, D. W., Ramsay, M., and Wilson, J. F. (2018). Runs of homozygosity: windows into population history and trait architecture. Nat. Rev. Genet. 19, 220–234. doi: 10.1038/nrg.2017.109
Chen, Q., Ma, Y., Yang, Y., Chen, Z., Liao, R., Xie, X., et al. (2013). Genotyping by genome reducing and sequencing for outbred animals. Plos One 8:e67500. doi: 10.1371/journal.pone.0067500
Chitneedi, P., Arranz, J., Suarez-Vega, A., García-Gámez, E., and Gutiérrez-Gil, B. (2017). Estimations of linkage disequilibrium, effective population size and ROH-based inbreeding coefficients in Spanish Churra sheep using imputed high-density SNP genotypes. Anim. Genet. 48, 436–446. doi: 10.1111/age.12564
Curik, I., Ferenčaković, M., and Sölkner, J. (2014). Inbreeding and runs of homozygosity: a possible solution to an old problem. Livestock Sci. 166, 26–34. doi: 10.1016/j.livsci.2014.05.034
de Koning, D. J., Janss, L. L., Rattink, A. P., van Oers, P. A., de Vries, B. J., Groenen, M. A., et al. (1999). Detection of quantitative trait loci for backfat thickness and intramuscular fat content in pigs (Sus scrofa). Genetics 152, 1679–1690.
Falconer, D. S. (1962). Falconer DS—introduction to quantitative genetics. Population 17, 152–153. doi: 10.2307/1525780
Ferencakovic, M., Hamzic, E., Gredler, B. G., Curik, I., and Sölkner, J. (2011). Runs of homozygosity reveal genome-wide autozygosity in the austrian fleckvieh cattle. Agric. Conspectus Sci. 76, 325–329.
Ferenčaković, M., Hamzić, E., Gredler, B., Solberg, T. R., Klemetsdal, G., Curik, I., et al. (2013). Estimates of autozygosity derived from runs of homozygosity: empirical evidence from selected cattle populations. J. Anim. Breed Genet. 130, 286–293. doi: 10.1111/jbg.12012
Gerbens, F., Verburg, F. J., Van Moerkerk, H. T., Engel, B., Buist, W., Veerkamp, J. H., et al. (2001). Associations of heart and adipocyte fatty acid-binding protein gene expression with intramuscular fat content in pigs. J. Anim. Sci. 79, 347–354. doi: 10.2527/2001.792347x
Gibson, J., Morton, N. E., and Collins, A. (2006). Extended tracts of homozygosity in outbred human populations. Hum. Mol. Genet. 15, 789–795. doi: 10.1093/hmg/ddi493
Howard, J. T., Pryce, J. E., Baes, C., and Maltecca, C. (2017). Invited review: Inbreeding in the genomics era: Inbreeding, inbreeding depression, and management of genomic variability. J. Dairy Sci. 100, 6009–6024. doi: 10.3168/jds.2017-12787
Howrigan, D. P., Simonson, M. A., and Keller, M. C. (2011). Detecting autozygosity through runs of homozygosity: a comparison of three autozygosity detection algorithms. BMC Genom. 12:460. doi: 10.1186/1471-2164-12-460
Keller, M. C., Simonson, M. A., Ripke, S., Neale, B. M., Gejman, P. V., Howrigan, D. P., et al. (2012). Runs of homozygosity implicate autozygosity as a schizophrenia risk factor. PLoS Genet. 8:e1002656. doi: 10.1371/journal.pgen.1002656
Kirin, M., McQuillan, R., Franklin, C. S., Campbell, H., McKeigue, P. M., and Wilson, J. F. (2010). Genomic runs of homozygosity record population history and consanguinity. Plos One 5:e13996. doi: 10.1371/journal.pone.0013996
Li, H., and Durbin, R. (2010). Fast and accurate long-read alignment with burrows–wheeler transform. Bioinformatics 26, 589–595. doi: 10.1093/bioinformatics/btp698
Li, Y. P., Liu, H., Wang, P. F., Wang, L. Y., Sun, Y., Liu, G., et al. (2016). RNA-seq analysis reveals genes underlying different disease responses to porcine circovirus type 2 in pigs. Plos One 11:e0155502. doi: 10.1371/journal.pone.0155502
Liang, J., Zhang, Y., Wang, L., Liu, X., Yan, H., Wang, L., et al. (2019). Molecular cloning of WIF1 and HMGA2 reveals ear-preferential expression while uncovering a missense mutation associated with porcine ear size in WIF1. Anim. Genet. 50, 157–161. doi: 10.1111/age.12759
Liu, G. E., Hou, Y., Zhu, B., Cardone, M. F., Jiang, L., Cellamare, A., et al. (2010). Analysis of copy number variations among diverse cattle breeds. Genom. Res. 20, 693–703.
Liu, X., Trakooljul, N., Murani, E., Krischek, C., Schellander, K., Wicke, M., et al. (2016). Molecular changes in mitochondrial respiratory activity and metabolic enzyme activity in muscle of four pig breeds with distinct metabolic types. J. Bioenerg. Biomemb. 48, 55–65. doi: 10.1007/s10863-015-9639-3
Lu, Y. F., Chen, J. B., Zhang, B., Li, Q. G., Wang, Z. X., Zhang, H., et al. (2017). Cloning, expression, and polymorphism of the ECI1 gene in various pig breeds. J. Integr. Agric. 16, 1789–1799. doi: 10.1016/s2095-3119(16)61624-6
MacLeod, I. M., Larkin, D. M., Lewin, H. A., Hayes, B. J., and Goddard, M. E. (2013). Inferring demography from runs of homozygosity in whole-genome sequence, with correction for sequence errors. Mol. Biol. Evol. 30, 2209–2223. doi: 10.1093/molbev/mst125
Magi, A., Tattini, L., Palombo, F., Benelli, M., Gialluisi, A., Giusti, B., et al. (2014). H3M2: detection of runs of homozygosity from whole-exome sequencing data. Bioinformatics 30, 2852–2859. doi: 10.1093/bioinformatics/btu401
McQuillan, R., Leutenegger, A. L., Abdel-Rahman, R., Franklin, C. S., Pericic, M., Barac-Lauc, L., et al. (2008). Runs of homozygosity in european populations. Am. J. Hum. Genet. 83, 359–372.
Melo, C., Quintanilla, R., Gallardo, D., Zidi, A., Jordana, J., Diaz, I., et al. (2013). Association analysis with lipid traits of 2 candidate genes (LRP12 and TRIB1) mapping to a SSC4 QTL for serum triglyceride concentration in pigs. J. Anim. Sci. 91, 1531–1537. doi: 10.2527/jas.2012-5517
Nandolo, W., Utsunomiya, Y. T., Mészáros, G., Wurzinger, M., Khayadzadeh, N., Torrecilha, R. B. P., et al. (2018). Misidentification of runs of homozygosity islands in cattle caused by interference with copy number variation or large intermarker distances. Genet. Selec. Evol. 50:43.
Nothnagel, M., Lu, T. T., Kayser, M., and Krawczak, M. (2010). Genomic and geographic distribution of SNP-defined runs of homozygosity in europeans. Hum. Mol. Genet. 19, 2927–2935. doi: 10.1093/hmg/ddq198
Onzima, R. B., Upadhyay, M. R., Doekes, H. P., Brito, L. F., Bosse, M., Kanis, E., et al. (2018). Genome-wide characterization of selection signatures and runs of homozygosity in ugandan goat breeds. Front. Genet. 9:318. doi: 10.3389/fgene.2018.00318
Ovilo, C., Clop, A., Noguera, J. L., Oliver, M. A., Barragán, C., Rodriguez, C., et al. (2002a). Quantitative trait locus mapping for meat quality traits in an Iberian x Landrace F2 pig population. J. Anim. Sci. 80, 2801–2808. doi: 10.2527/2002.80112801x
Ovilo, C., Oliver, A., Noguera, J. L., Clop, A., Barragán, C., Varona, L., et al. (2002b). Test for positional candidate genes for body composition on pig chromosome 6. Genet. Sel. Evol. 34, 465–479.
Ovilo, C., Pérez-Enciso, M., Barragán, C., Clop, A., Rodríquez, C., Oliver, M. A., et al. (2000). A QTL for intramuscular fat and backfat thickness is located on porcine chromosome 6. Mamm Genome 11, 344–346. doi: 10.1007/s003350010065
Patel, R. K., and Jain, M. (2012). NGS QC toolkit: a toolkit for quality control of next generation sequencing data. Plos One 7:e30619. doi: 10.1371/journal.pone.0030619
Pemberton, T. J., Absher, D., Feldman Marcus, W., Myers Richard, M., Rosenberg Noah, A., and Li Jun, Z. (2012b). Genomic patterns of homozygosity in worldwide human populations. Am. J. Hum. Genet. 91, 275–292. doi: 10.1016/j.ajhg.2012.06.014
Pemberton, T. J., Absher, D., Feldman, M. W., Myers, R. M., Rosenberg, N. A., and Li, J. Z. (2012a). Genomic patterns of homozygosity in worldwide human populations. Am. J. Hum. Genet. 91, 275–292. doi: 10.1016/j.ajhg.2012.06.014
Peripolli, E., Munari, D. P., Silva, M. V. G. B., Lima, A. L. F., Irgang, R., and Baldi, F. (2017). Runs of homozygosity: current knowledge and applications in livestock. Anim. Genet. 48, 255–271. doi: 10.1111/age.12526
Peripolli, E., Stafuzza, N. B., Munari, D. P., Lima, A. L. F., Irgang, R., Machado, M. A., et al. (2018). Assessment of runs of homozygosity islands and estimates of genomic inbreeding in Gyr (Bos indicus) dairy cattle. BMC Genom. 19:34. doi: 10.1186/s12864-017-4365-3
Power, R. A., Keller, M. C., Ripke, S., Abdellaoui, A., Wray, N. R., Sullivan, P. F., et al. (2014). A recessive genetic model and runs of homozygosity in major depressive disorder. Am. J. Med. Genet. B Neuropsychiatr. Genet. 165, 157–166. doi: 10.1002/ajmg.b.32217
Purcell, S., Neale, B., Todd-Brown, K., Thomas, L., Ferreira, M. A. R., Bender, D., et al. (2007). PLINK: a tool set for whole-genome association and population-based linkage analyses. Am. J. Hum. Genet. 81, 559–575. doi: 10.1086/519795
Purfield, D. C., Berry, D. P., McParland, S., and Bradley, D. G. (2012). Runs of homozygosity and population history in cattle. BMC Genet. 13:70. doi: 10.1186/1471-2156-13-70
Purfield, D. C., McParland, S., Wall, E., and Berry, D. P. (2017). The distribution of runs of homozygosity and selection signatures in six commercial meat sheep breeds. Plos One 12:e0176780. doi: 10.1371/journal.pone.0176780
Ron, M., Blanc, Y., Band, M., Ezra, E., and Weller, J. I. (1996). Misidentification rate in the israeli dairy cattle population and its implications for genetic improvement. J. Dairy Sci. 79, 676–681. doi: 10.3168/jds.s0022-0302(96)76413-5
Smith, J. M., and Haigh, J. (1974). The hitch-hiking effect of a favourable gene. Genet. Res. 23, 23–35. doi: 10.1017/s0016672300014634
Son, D., Hwang, N. H., Chung, W. H., Seong, H., Lim, H., Cho, E. S., et al. (2020). Whole-genome resequencing analysis of 20 Micro-pigs. Genes Genom. 42, 263–272. doi: 10.1007/s13258-019-00891-x
Srikanchai, T., Murani, E., Wimmers, K., and Ponsuksili, S. (2010). Four loci differentially expressed in muscle tissue depending on water-holding capacity are associated with meat quality in commercial pig herds. Mol. Biol. Rep. 37, 595–601. doi: 10.1007/s11033-009-9856-0
Szmatoła, T., Gurgul, A., Jasielczuk, I., Ząbek, T., Ropka-Molik, K., Litwińczuk, Z., et al. (2019). A comprehensive analysis of runs of homozygosity of eleven cattle breeds representing different production types. Animals (Basel) 9:1024. doi: 10.3390/ani9121024
Tao, X., Liang, Y., Yang, X. M., Pang, J. H., Zhong, Z. J., Chen, X. H., et al. (2017). Transcriptomic profiling in muscle and adipose tissue identifies genes related to growth and lipid deposition. Plos One 12:e0184120. doi: 10.1371/journal.pone.0184120
VanRaden, P. M. (2008). Efficient methods to compute genomic predictions. J. Dairy Sci. 91, 4414–4423. doi: 10.3168/jds.2007-0980
Visscher, P. M., Medland, S. E., Ferreira, M. A. R., Morley, K. I., Zhu, G., Cornes, B. K., et al. (2006). Assumption-free estimation of heritability from genome-wide identity-by-descent sharing between full siblings. PLoS Genet. 2:e41. doi: 10.1371/journal.pgen.0020041
Wang, X., Zhang, H., Huang, M., Tang, J., Yang, L., Yu, Z., et al. (2021). Whole-genome SNP markers reveal conservation status, signatures of selection, and introgression in chinese laiwu pigs. Evol. Appl. 14, 383–398. doi: 10.1111/eva.13124
Wang, Z., Chen, Q., Yang, Y., Liao, R., Zhao, J., Zhang, Z., et al. (2015). Genetic diversity and population structure of six chinese indigenous pig breeds in the taihu Lake region revealed by sequencing data. Anim. Genet. 46, 697–701. doi: 10.1111/age.12349
Wright, S. (1922). Coefficients of inbreeding and relationship. Am. Naturalist 56, 330–338. doi: 10.1086/279872
Xiao, Q., Zhang, Z., Sun, H., Wang, Q., and Pan, Y. (2017). Pudong white pig: a unique genetic resource disclosed by sequencing data. Animal 11, 1117–1124. doi: 10.1017/s1751731116002494
Xu, Z., Sun, H., Zhang, Z., Zhao, Q., Olasege, B. S., Li, Q., et al. (2019). Assessment of autozygosity derived from runs of homozygosity in jinhua pigs disclosed by sequencing data. Front. Genet. 10:274. doi: 10.3389/fgene.2019.00274
Yang, H., Huang, X., Zeng, Z., Zhang, W., Liu, C., Fang, S., et al. (2015). Genome-wide association analysis for blood lipid traits measured in three pig populations reveals a substantial level of genetic heterogeneity. Plos One 10:e0131667. doi: 10.1371/journal.pone.0131667
Yang, J., Lee, S. H., Goddard, M. E., and Visscher, P. M. (2011). GCTA: a tool for genome-wide complex trait analysis. Am. J. Hum. Genet. 88, 76–82. doi: 10.1016/j.ajhg.2010.11.011
Zanella, R., Peixoto, J. O., Cardoso, F. F., Cardoso, L. L., Biegelmeyer, P., Cantão, M. E., et al. (2016). Genetic diversity analysis of two commercial breeds of pigs using genomic and pedigree data. Genet. Selec. Evol. 48:24.
Zhan, H., Zhang, S., Zhang, K., Peng, X., Xie, S., Li, X., et al. (2020). Genome-wide patterns of homozygosity and relevant characterizations on the population structure in piétrain pigs. Genes (Basel) 11:577. doi: 10.3390/genes11050577
Zhang, L. C., Yue, J. W., Pu, L., Wang, L. G., Liu, X., Liang, J., et al. (2016). Genome-wide study refines the quantitative trait locus for number of ribs in a large white x minzhu intercross pig population and reveals a new candidate gene. Mol. Genet. Genom. 291, 1885–1890. doi: 10.1007/s00438-016-1220-1
Zhang, Q., Guldbrandtsen, B., Bosse, M., Lund, M. S., and Sahana, G. (2015). Runs of homozygosity and distribution of functional variants in the cattle genome. BMC Genom. 16:542. doi: 10.1186/s12864-015-1715-x
Zhang, Z., Zhang, Q., Xiao, Q., Sun, H., Gao, H., Yang, Y., et al. (2018). Distribution of runs of homozygosity in chinese and western pig breeds evaluated by reduced-representation sequencing data. Anim. Genet. 49, 579–591. doi: 10.1111/age.12730
Zhao, Y. X., Hou, Y., Liu, F., Liu, A., Jing, L., Zhao, C. Z., et al. (2016). Transcriptome analysis reveals that vitamin A metabolism in the liver affects feed efficiency in pigs. G3-Genes Genom. Genet. 6, 3615–3624. doi: 10.1534/g3.116.032839
Keywords: runs of homozygosity, inbreeding coefficient, candidate genes, selection, Laiwu pig
Citation: Fang Y, Hao X, Xu Z, Sun H, Zhao Q, Cao R, Zhang Z, Ma P, Sun Y, Qi Z, Wei Q, Wang Q and Pan Y (2021) Genome-Wide Detection of Runs of Homozygosity in Laiwu Pigs Revealed by Sequencing Data. Front. Genet. 12:629966. doi: 10.3389/fgene.2021.629966
Received: 16 November 2020; Accepted: 08 March 2021;
Published: 29 April 2021.
Edited by:
Jiuzhou Song, University of Maryland, College Park, United StatesReviewed by:
Filippo Biscarini, National Research Council (CNR), ItalyXiaozhu Wang, Auburn University, United States
Copyright © 2021 Fang, Hao, Xu, Sun, Zhao, Cao, Zhang, Ma, Sun, Qi, Wei, Wang and Pan. This is an open-access article distributed under the terms of the Creative Commons Attribution License (CC BY). The use, distribution or reproduction in other forums is permitted, provided the original author(s) and the copyright owner(s) are credited and that the original publication in this journal is cited, in accordance with accepted academic practice. No use, distribution or reproduction is permitted which does not comply with these terms.
*Correspondence: Qishan Wang, wangqishan@zju.edu.cn; wangqishan@sjtu.edu.cn; Yuchun Pan, panyuchun1963@aliyun.com