 Qian Ding
 Yan Sun1
 Junliang Shang
 Feng Li
 Yuanyuan Zhang
 Jin-Xing Liu
- 1School of Computer Science, Qufu Normal University, Rizhao, China
- 2School of Information and Control Engineering, Qingdao University of Technology, Qingdao, China
Pancreatic cancer (PC) is a highly fatal disease, yet its causes remain unclear. Comprehensive analysis of different types of PC genetic data plays a crucial role in understanding its pathogenic mechanisms. Currently, non-negative matrix factorization (NMF)-based methods are widely used for genetic data analysis. Nevertheless, it is a challenge for them to integrate and decompose different types of genetic data simultaneously. In this paper, a non-NMF network analysis method, NMFNA, is proposed, which introduces a graph-regularized constraint to the NMF, for identifying modules and characteristic genes from two-type PC data of methylation (ME) and copy number variation (CNV). Firstly, three PC networks, i.e., ME network, CNV network, and ME–CNV network, are constructed using the Pearson correlation coefficient (PCC). Then, modules are detected from these three PC networks effectively due to the introduced graph-regularized constraint, which is the highlight of the NMFNA. Finally, both gene ontology (GO) and pathway enrichment analyses are performed, and characteristic genes are detected by the multimeasure score, to deeply understand biological functions of PC core modules. Experimental results demonstrated that the NMFNA facilitates the integration and decomposition of two types of PC data simultaneously and can further serve as an alternative method for detecting modules and characteristic genes from multiple genetic data of complex diseases.
Introduction
Pancreatic cancer (PC) is a highly fatal disease of the digestive system and it is becoming an increasingly common cause of cancer mortality, yet its pathogenic mechanisms remain unclear (Mizrahi et al., 2020). Therefore, comprehensively analyzing multiple types of PC genetic data to understand its pathogenic mechanisms has become a hot topic and many studies have been conducted. For instance, Wu et al. (2011) applied the lasso penalized Cox regression to transcriptome data to identify genes that are directly related to PC survival. Yang et al. (2013) identified thousands of differentially expressed genes of PC and then six genes were predicted to be involved in PC development. Gong et al. (2014) integrated pathway information into PC survival analysis and applied the doubly regularized Cox regression model to microarray data to identify both PC-related genes and pathways. Kwon et al. (2015) used the support vector machine to evaluate the diagnostic performance of PC biomarkers based on miRNA and mRNA expression data. Tao et al. (2016) performed a comprehensive search of electronic literature sources to evaluate the association between K-ras gene mutations and PC survival. Li et al. (2018) identified two hub genes of PC from the integrated microarray data and then validated them in RNA-sequencing data by k-nearest neighbor and random forest algorithms. These studies provided several underlying biomarkers and can help cancer researchers design new strategies for the early detection and diagnosis of PC (Gong et al., 2014).
Currently, non-negative matrix factorization (NMF)-based methods are widely used for genetic data analysis. For example, Mishra and Guda (2016) applied the NMF to genome-scale methylome analysis of PC data and detected three distinct molecular subtypes. Wang et al. (2013) proposed the maximum correntropy criterion-based NMF (NMF-MCC) method for cancer clustering on gene expression (GE) data. Zhao et al. (2018) used the NMF bi-clustering method to identify subtypes of pancreatic ductal adenocarcinoma, which is the most common type of PC. Xiao et al. (2018) proposed the graph-regularized NMF to discover potential associations between miRNAs and diseases. These methods show that the NMF is a powerful tool for genetic data analysis. Nevertheless, it is a challenge for them to integrate and decompose different types of genetic data simultaneously. Zhang et al. (2012) adopted the joint NMF (jNMF) method to address this challenge, which projects multiple types of genomic data onto a common coordinate system, and applied the jNMF to the methylation (ME), GE, and miRNA expression data of ovarian cancer to identify cancer-related multidimensional modules. Yang and Michailidis (2016) introduced the integrative NMF (iNMF) to analyze multimodal data, which includes a sparsity option for jointly decomposing heterogeneous data, and also evaluated the iNMF on ME, GE, and miRNA expression data of ovarian cancer. These integrated NMF methods can reveal pathogenic mechanisms that would have been overlooked with only a single type of data, and uncover associations between different layers of cellular activities (Zhang et al., 2012).
However, most of these NMF-based methods only consider individual genetic effects and ignore interaction effects among different features. It has been widely accepted that interaction effects could unveil a large portion of unexplained pathogenic mechanisms of cancers (Ding et al., 2019). For capturing these interaction effects, several NMF-based network analysis methods have been proposed due to network facilitating presenting interactions between features. Liu et al. (2014) developed a network-assisted co-clustering algorithm for the identification of cancer subtypes, which first assigns weights to genes based on their impact in the network, and then utilizes the non-negative matrix trifactorization (TriNMF) to cluster cancer patients (Ding et al., 2006). Chen and Zhang adopted the NMF framework in a network manner (NetNMF) to integrate pairwise genomic data for identifying two-level modular patterns and the relationships among these modules (Chen and Zhang, 2018). Elyanow et al. (2020) proposed the netNMF-sc method to cluster cells based on prior knowledge of gene–gene interactions. Nevertheless, the netNMF-sc ignored interaction effects among different features and used the decomposed submatrix to construct the network, which might weaken the internal connection between nodes in the network. Gao et al. (2019) proposed the integrated graph-regularized NMF (iGMFNA) model for clustering and network analysis of cancers, which decomposes the integrated data into submatrices for constructing networks. Zheng et al. (2019) used the NMF to integrate ME and copy number variation (CNV) networks for identifying prognostic biomarkers in ovarian cancer. These NMF-based network analysis methods provide new insights into the pathogenic mechanisms of cancers, especially their interaction effects.
Inspired by both integration and network-assisted strategies of the NMF, in this paper, we presented a NMF network analysis method, NMFNA for short, based on graph-regularized constraint, to identify modules and characteristic genes from integrated ME and CNV data of PC. Firstly, the Pearson correlation coefficient (PCC) is employed to construct three PC networks, i.e., ME network, CNV network, and ME–CNV network. Then, these networks are further integrated and decomposed simultaneously to identify modules effectively due to the introduced graph-regularized constraint, which is the highlight of the NMFNA. Finally, both gene ontology (GO) and pathway enrichment analyses are performed, and characteristic genes are detected by the multimeasure score, to deeply understand biological functions of PC core modules. Experimental results demonstrated that the NMFNA facilitates the integration and decomposition of two types of PC data simultaneously and can further serve as an alternative method for detecting modules and characteristic genes from multiple genetic data of complex diseases.
Methods
Non-negative Matrix Factorization Methods
The NMF (Lee and Seung, 1999) and its variants have been increasingly applied to identify modules in biological networks (Chen and Zhang, 2018; Wang et al., 2018; Gao et al., 2019). For a biological network Xm×n, the NMF can decompose it into two non-negative matrices Um×k and Vk×n, such that X ≈ V, where k < min (m,n). The Euclidean distance between X and its approximation matrix UV is applied to minimize the factorization error, which can be written as,
where is the Frobenius norm of a matrix. Since it is difficult to find a global minimal solution by optimizing the convex and non-linear objective function, the NMF adopts the multiplicative iterative update algorithm to approximate U and V,
In addition to the two-factor NMF, the three-factor NMF also plays an important role in matrix factorization, which constrains scales of U and V by an extra factor S, i.e., X ≈ USV. This factored matrix S not only provides an additional degree of freedom to make the approximation tight, but also indicates associations between identified modules (Chen and Zhang, 2018). A three-factor NMF variant TriNMF (Ding et al., 2006) is defined as,
which minimizes the objective function by,
Particularly, if X is the symmetric similarity matrix, it could be decomposed into USUT. For pairwise biological networks with the same samples but two types of features, and , combining the idea of two-factor and three-factor NMF, the NetNMF (Chen and Zhang, 2018) is defined as,
where and are the symmetric feature similarity matrices of X1 and X2, respectively, that is, their respective co-expression networks; is the two-type feature similarity matrix (co-expression network) between X1 and X2; and are the non-negative factored matrices used for identifying modules in their respective networks; and are also symmetric matrices whose diagonal elements can be used for measuring associations between identified modules; k is the user prespecified dimension parameter; α and β are used to balance three terms of the objective function and default settings are m1/m2 and (m1/m2)2, respectively (Chen and Zhang, 2018). The NetNMF minimizes the objective function by,
Non-negative Matrix Factorization Network Analysis Method
In order to further improve the capability of identifying modules and capturing interaction effects, we proposed the NMFNA method by introducing the graph-regularized constraint into the NetNMF, which can preserve the inherent geometrical structure of input networks (Deng et al., 2011). For demonstrating its effectiveness, in the study, we applied the NMFNA to two-type PC data of ME and CNV to identify modules and characteristic genes. In fact, the NMFNA is universally useful and can be applied to any type of genetic data in various complex diseases.
The overall workflow of the NMFNA for identifying modules and characteristic genes by integrating ME and CNV data of PC is shown in Figure 1. It is seen that the NMFNA mainly has three stages. In the first stage, three co-expression networks are constructed from ME and CNV data of PC. In the second stage, these three networks are applied to the objective function to identify modules. In the third stage, both GO and pathway enrichment analyses are performed, and characteristic genes are detected, to deeply understand biological functions of PC core modules. Among them, the objective function, which introduces the graph-regularized constraint, is the highlight of the NMFNA.
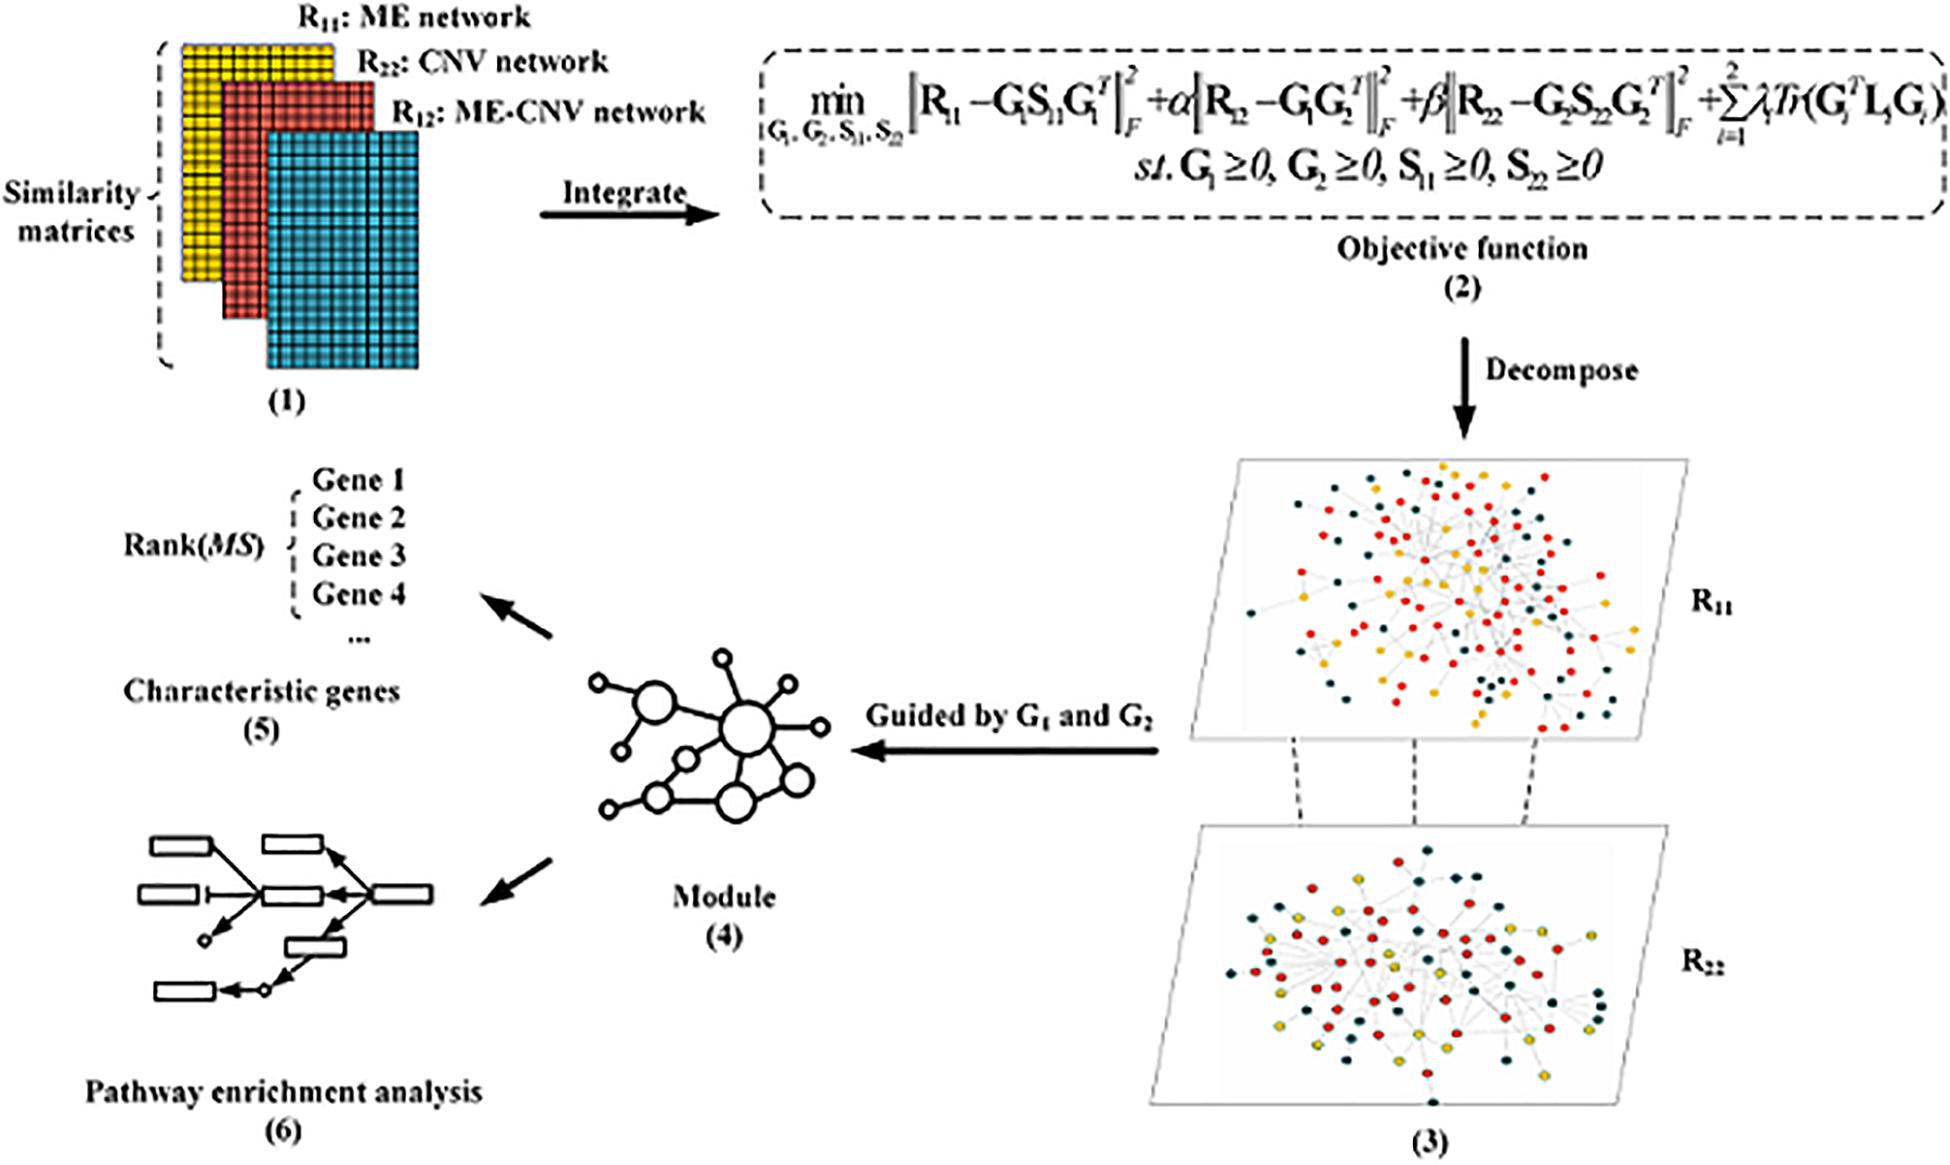
Figure 1. The overall workflow of the non-negative matrix factorization network analysis (NMFNA) for identifying modules and characteristic genes by integrating methylation (ME) and copy number variation (CNV) data of pancreatic cancer (PC).
The graph-regularized constraint indicates the inherent geometrical structure of the input networks. In other words, the graph-regularized constraint ensures that interactive features in the Euclidean space are also close to each other in the low-dimensional space, which is defined as,
where Z is the sparse weight matrix established using the geometrical information of X (Xiao et al., 2018), and Zij represents the similarity between gene vi and vj. Tr(⋅) represents the trace of a matrix, and G is the factored matrix of the biological network X by the NMF. Define a diagonal matrix D whose elements are column sums of matrix Z, that is, Dii = ∑i Zij, and L is the graph Laplacian matrix defined as:
Based on the NetNMF and the graph-regularized constraint, the objective function of the NMFNA is defined as,
where R11 and R22 are the ME and CNV co-expression networks, R12 is the ME–CNV co-expression network, λ is the tuning parameter to adjust the closeness between interactive features, and other notation meanings and parameter settings are the same as those in the NetNMF.
The multiplicative iterative update algorithm is adopted here to minimize the objective function of the NMFNA. Suppose ψ1, ψ2, ψ3, and ψ4 are matrices of Lagrange multipliers that, respectively, constrain S11 ≥ 0, S22 ≥ 0, G1 ≥ 0, and G2 ≥ 0, the Lagrange function f of the NMFNA is,
Hence, partial derivatives of f with respect to S11, S22, G1, and G2 are,
According to Karush–Kuhn–Tucher conditions (Dreves et al., 2011), i.e., ψ1S11 = 0, ψ2S22 = 0, ψ3G1 = 0, and ψ4G2 = 0, iterative formulas can be written as,
Two types of modules, namely, ME modules and CNV modules, can be identified from R11 and R22 guided by G1 and G2, respectively. In particular, G1 and G2 are first z-score normalized; then for each column (1,⋯,k) of them, those genes whose corresponding weights are greater than or equal to the threshold are considered as a cluster; finally, according to these clusters, subnetworks of R11 and R22 can be captured as ME modules and CNV modules. Here, the threshold is set to be 2 according to the reference (Chen and Zhang, 2018). In addition, similar to previous studies (Hou et al., 2019; Zhao et al., 2020), modules with the most genes are known as core modules.
To identify characteristic genes from core modules, which may play an important role in deeply understanding the biological functions of modules, we employ the multimeasure score (MS) to numerically quantify the importance of each gene, which is defined as,
where DC(v), BC(v), and EC(v) are the degree centrality, betweenness centrality, and eccentricity centrality of gene v in and , which are networks filtered from R11 and R22, respectively, with edge weights higher than a given threshold. Betweenness centrality and eccentricity centrality focus on the global feature of a gene in the network, while degree centrality focuses on the local feature of a gene in the network (Shang et al., 2019); hence, the MS combines both global and local features of a gene.
Results and Discussion
Data and Parameter Settings
Two types of PC data, i.e., ME data and CNV data, are downloaded from the TCGA database1. These two data have the same samples (176 tumor samples and 4 normal samples) but different features: 21,031 methylations in ME data and 23,627 CNVs in CNV data. Based on these PC data, three co-expression networks, i.e., the ME network , the CNV network , and the ME–CNV network , are constructed using the PCC. Besides, to further prove the experimental results of two types of PC data, we also analyze the GEO datasets of PC. Four profile datasets, i.e., GSE62452, GSE15471, GSE16515, and GSE28735, of PC are downloaded from the GEO database2 for this study. Details of these four datasets are shown in Table 1.
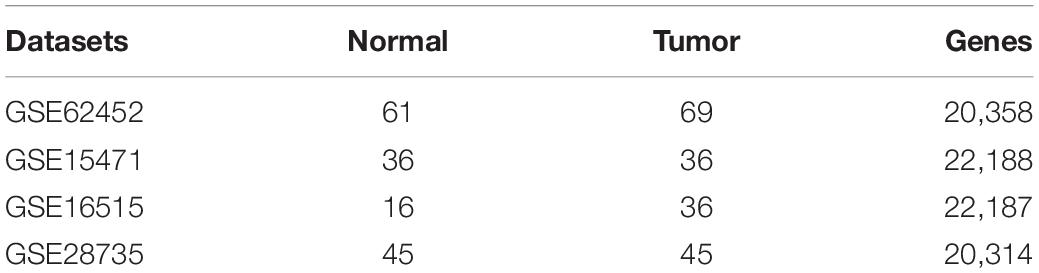
Table 1. Details of GEO datasets of PC.
In the NMFNA, four parameters should be set, which is, tuning parameters λ1 and λ2, the dimension parameter k, and the iteration number. λ reflects the degree of imposed graph-regularized constraint. A large one focuses on reaching consensus across views, while a small one cannot tolerate matrix factorization error (Liu et al., 2013). Since these different items have no distinction of importance, and the dimension reduction parameter k has a greater impact compared with parameter λ, considering the convenience of comparison, both λ1 and λ2 are set to be the same value. We run the NMFNA with different λ values ranging from 0 to 0.1 to select the proper one based on the measure of total module similarity (Wang et al., 2018), which is defined as,
where Mx represents members in module x. According to experiment results (Figure 2A), λ1 and λ2 are set to be 0.03. The dimension parameter k is determined by the singular value decomposition method (Qiao, 2015), and its first inflection point, i.e., 6,834, is selected to k. In order to reduce the decomposition error, a large iteration number is used. In the study, we set it to 200 since the decomposition error here has already reached a relatively stable state (Figure 2B).
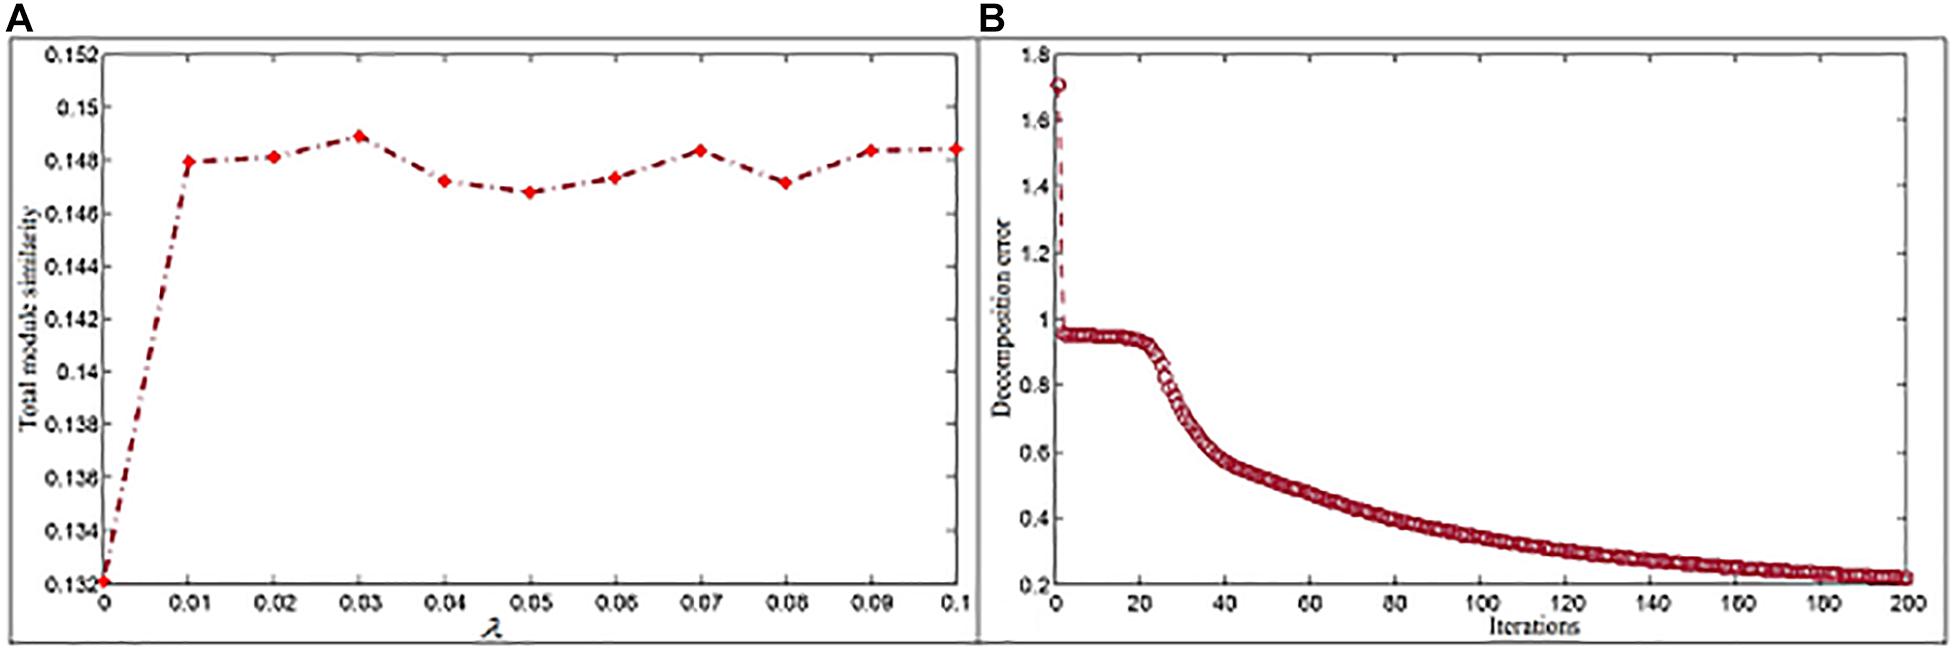
Figure 2. Parameter settings for the NMFNA. (A) Is the influence of parameter and (B) is the convergence analysis of NMFNA.
GO and Pathway Enrichment Analyses
To demonstrate the validity of the NMFNA, we compared it with the NMF, TriNMF, and NetNMF by performing GO and pathway enrichment analyses on their respective identified core modules. The GO enrichment analysis was carried out by an online tool, DAVID Bioinformatics Resources3 (Dennis et al., 2003). The pathway enrichment analysis was conducted using the KOBAS v3.0 web server4 (Kanehisa et al., 2016), in which, the KEGG pathway, BioCyc, PANTHER, and Reactome databases were used. The numbers of GO terms and pathways (p-value < 0.05) obtained from enrichment analyses of ME and CNV core modules identified by the compared methods are shown in Figure 3. It is seen that either ME or CNV core modules identified by the NMFNA have more GO terms and pathways than those identified by other methods, implying that modules identified by the NMFNA might contain more biological information related to understanding the pathogenic mechanisms of PC.
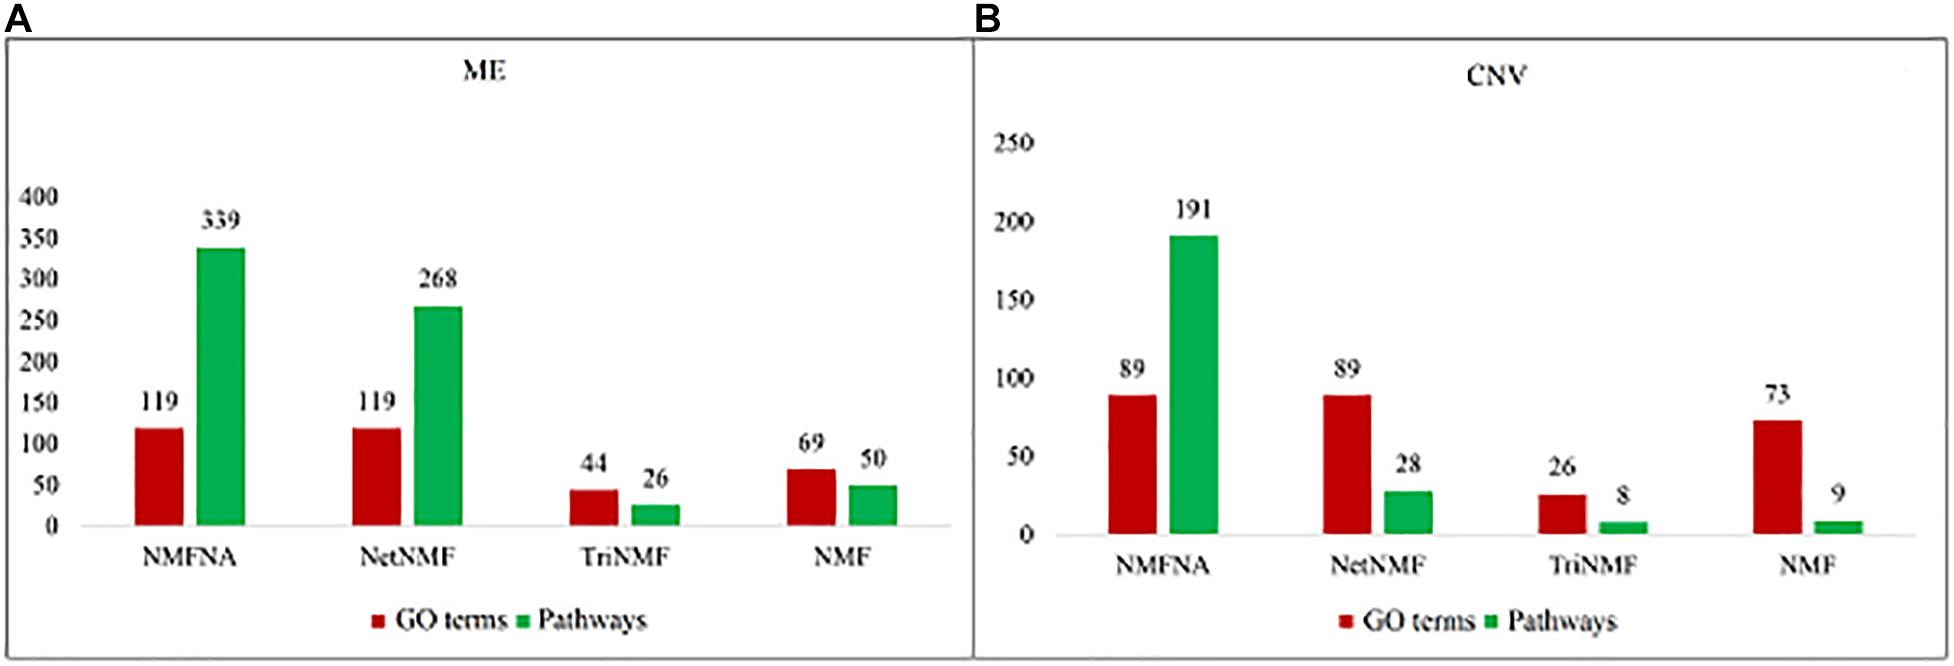
Figure 3. Numbers of GO terms and pathways obtained from enrichment analyses of ME and CNV core modules that identified by compared methods. (A) Represents the details of the ME core module and (B) represents the details of the CNV core module.
The numbers of enriched genes in GO terms obtained from the enrichment analyses of ME and CNV core modules identified by the NMFNA are shown in Figure 4. It is seen that for the ME core module, genes are mainly enriched in GO:0005515, GO:0005737, GO:0005829, GO:0070062, GO:0005654, GO:0016020, GO:0005615, and GO:0005739, corresponding to protein binding, cytoplasm, cytosol, extracellular exosome, nucleoplasm, membrane, extracellular space, and mitochondrion; for the CNV core module, genes are mainly enriched in GO:0005515, GO:0006351, GO:0003676, and GO:0005789, corresponding to protein binding, DNA-templated, DNA binding, and endoplasmic reticulum. Details of these significant GO terms are listed in Table 2. Several studies have confirmed that these GO terms contribute to the development of PC cells. The protein binding (GO:0005515) is the most significantly enriched GO term among molecular functions in both ME and CNV core modules. As one of the specific binding protein, IGF binding protein-1 has been confirmed to inhibit the activity of insulin-like growth factor I, which has growth-promoting effects on PC cells (Wolpin et al., 2007). The cytoplasm (GO:0005737) plays an important role in the development of PC by regulating the expression of carbonic anhydrase IX (Juhász et al., 2003). As a member of the cadherin/catenin family, p120(ctn) has been found in the cytosol (GO:0005829) of PC cells (Mayerle et al., 2003), which is correlated to the degree of tumor dedifferentiation. The fractional volume of the extracellular space (GO:0005615) in the PC tissue has been reported to be statistically larger than that in the normal tissue (Yao et al., 2012). The novel mitochondrion interfering compound NPC-26 may effectively inhibit the growth of PC cells by destroying the mitochondria (GO:0005739) (Dong et al., 2016). Genes involved in the DNA-templated (GO:0006351) have been clinically used for treating lung cancer (Lu et al., 2016), which might be speculated to affect other cancers by their pan-cancer co-regulation mechanisms. The nicotine can induce the inhibitor of the DNA binding (GO:0003676) and has been confirmed as an established risk factor for PC (Treviño et al., 2011). The endoplasmic reticulum (GO:0005789) has been identified as the key target in PC, which shows its potential for antitumor drug development (Gajate et al., 2012). Other three GO terms, including extracellular exosome (GO:0070062), nucleoplasm (GO:0005654), and membrane (GO:0016020) also have been reported to associate with PC (Sakai et al., 2019; Zhou et al., 2019).
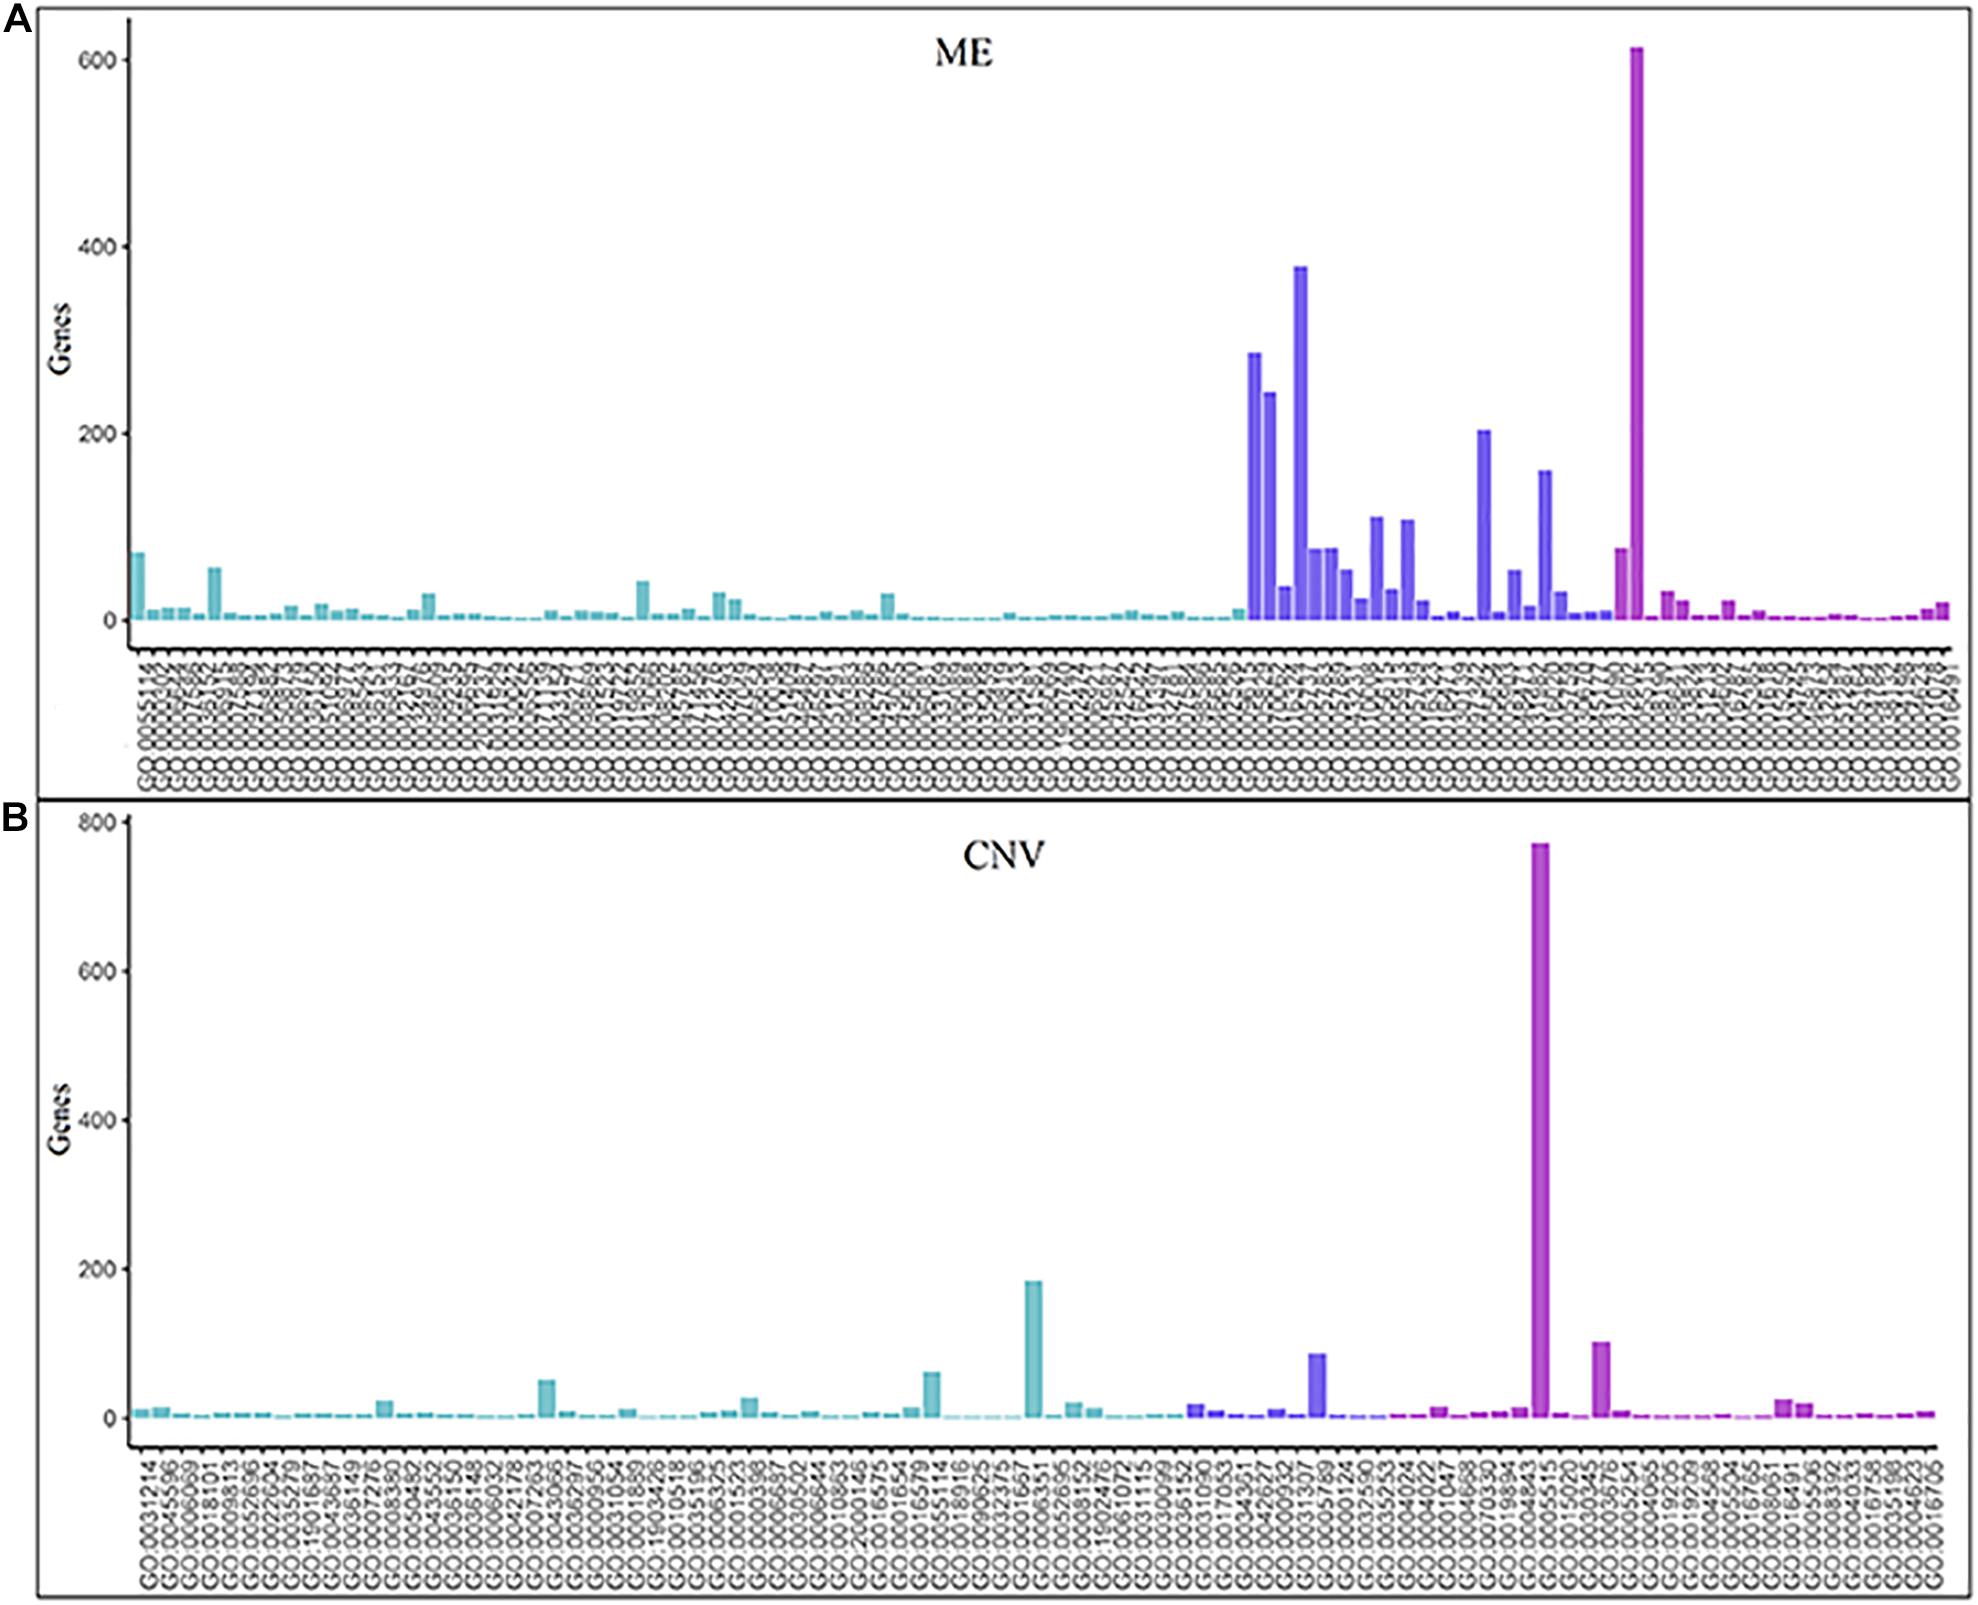
Figure 4. Numbers of enriched genes in GO terms obtained from enrichment analyses of ME and CNV core modules identified by the NMFNA. (A) Represents numbers of the enriched gene of the ME core module and (B) represents numbers of the enriched gene of the CNV core module.
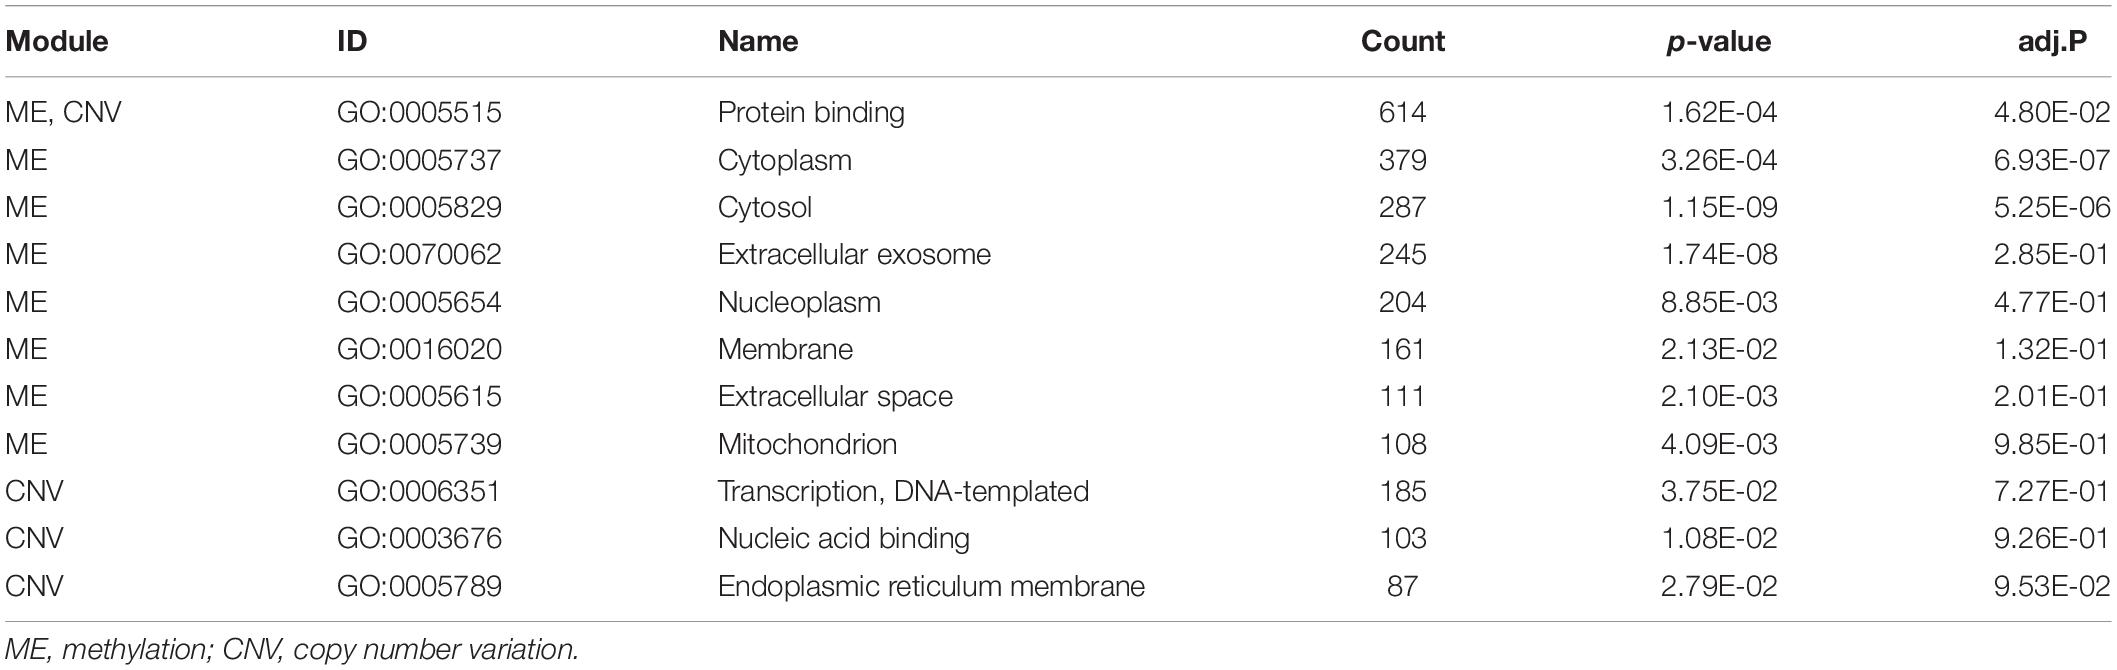
Table 2. Details of significant GO terms obtained from enrichment analyses of ME and CNV core modules identified by the NMFNA. adj.P is the p-value corrected by the FDR.
Among all pathways obtained from enrichment analyses of ME and CNV core modules identified by the compared methods (Figure 3), we recorded common pathways that appear in at least three out of four methods in Table 3. It is seen that in terms of p-values, as well as p-values corrected by the false discovery rate (FDR), namely adj.P, the NMFNA performs best among all compared methods, implying that pathways enriched in core modules identified by the NMFNA are more significant than those enriched in core modules identified by other compared methods. To further analyze these core modules, the top 10 pathways according to their adj.P enriched in ME and CNV core modules identified by the NMFNA are listed in Figure 5, in which, the node size and color represent the number of genes enriched in the pathway and the significance of the pathway, respectively. Specifically, two pathways, i.e., transport of small molecules and arachidonic acid metabolism, have already been reported to be associated with PC. The former can filter downregulated differentially expressed genes of PC, while the latter can promote the progress of PC (Biswas et al., 2014; Long et al., 2016). To aid early diagnosis, the metabolism pathway can be used individually or in combination to differentiate people with and without PC. The metabolism of xenobiotics by cytochrome P450 pathway has been considered as an important pathway associated with the progression of cancer (Hu and Chen, 2012). Besides, three other metabolism-related pathways, namely, lipid metabolism and autophagy, glutamine-regulatory enzymes, and Akt/c-Myc pathway (Dando et al., 2013; Blum and Kloog, 2014), have been identified to directly affect the growth of PC cells. The small molecule metabolic process also has been found as the enriched pathway for the biological process of PC (Hu et al., 2017). The identification of immune system-related regulation pathways has been reported to provide several new insights for PC treatment and prognosis (Yang and Michailidis, 2016).
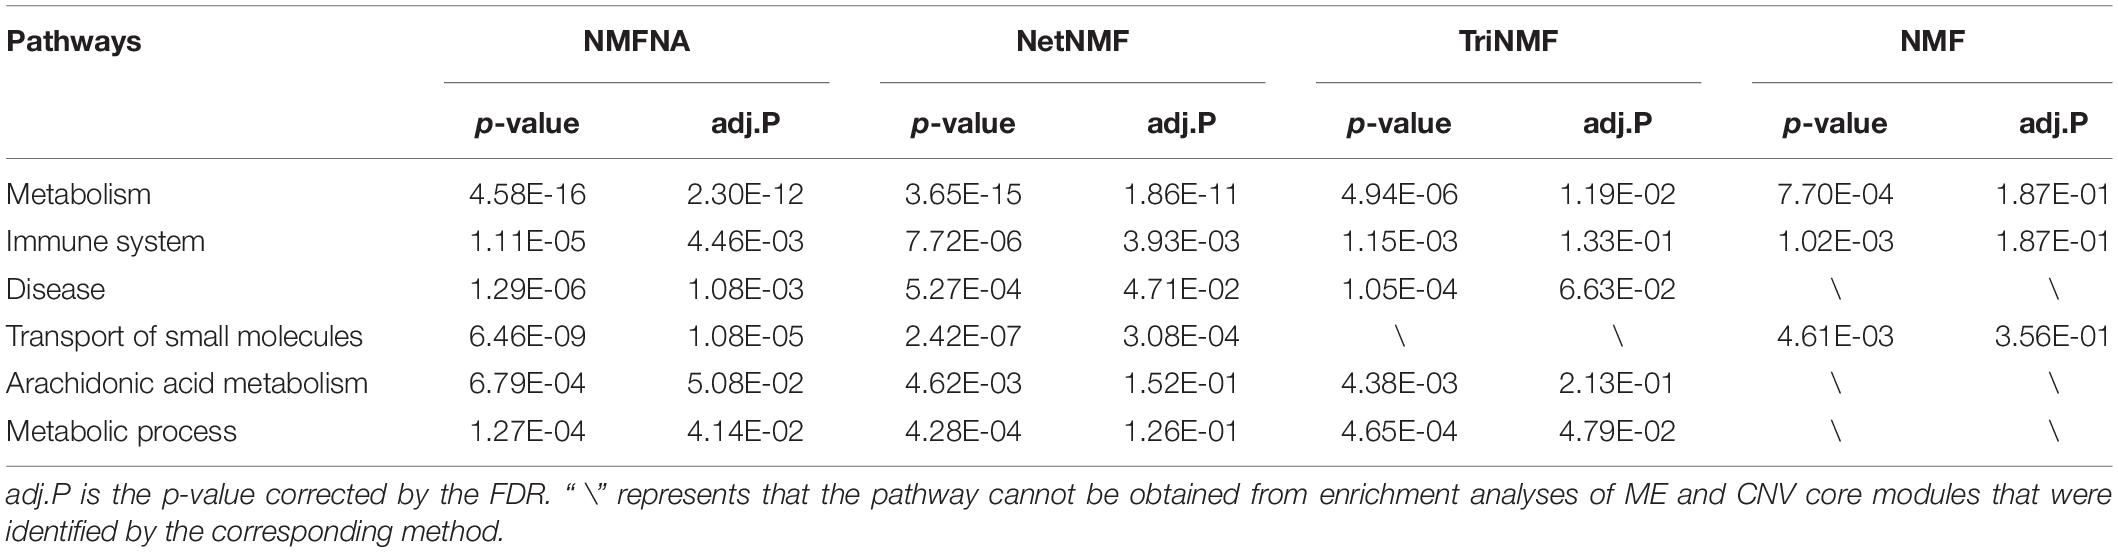
Table 3. Common pathways appearing in at least three out of four methods.
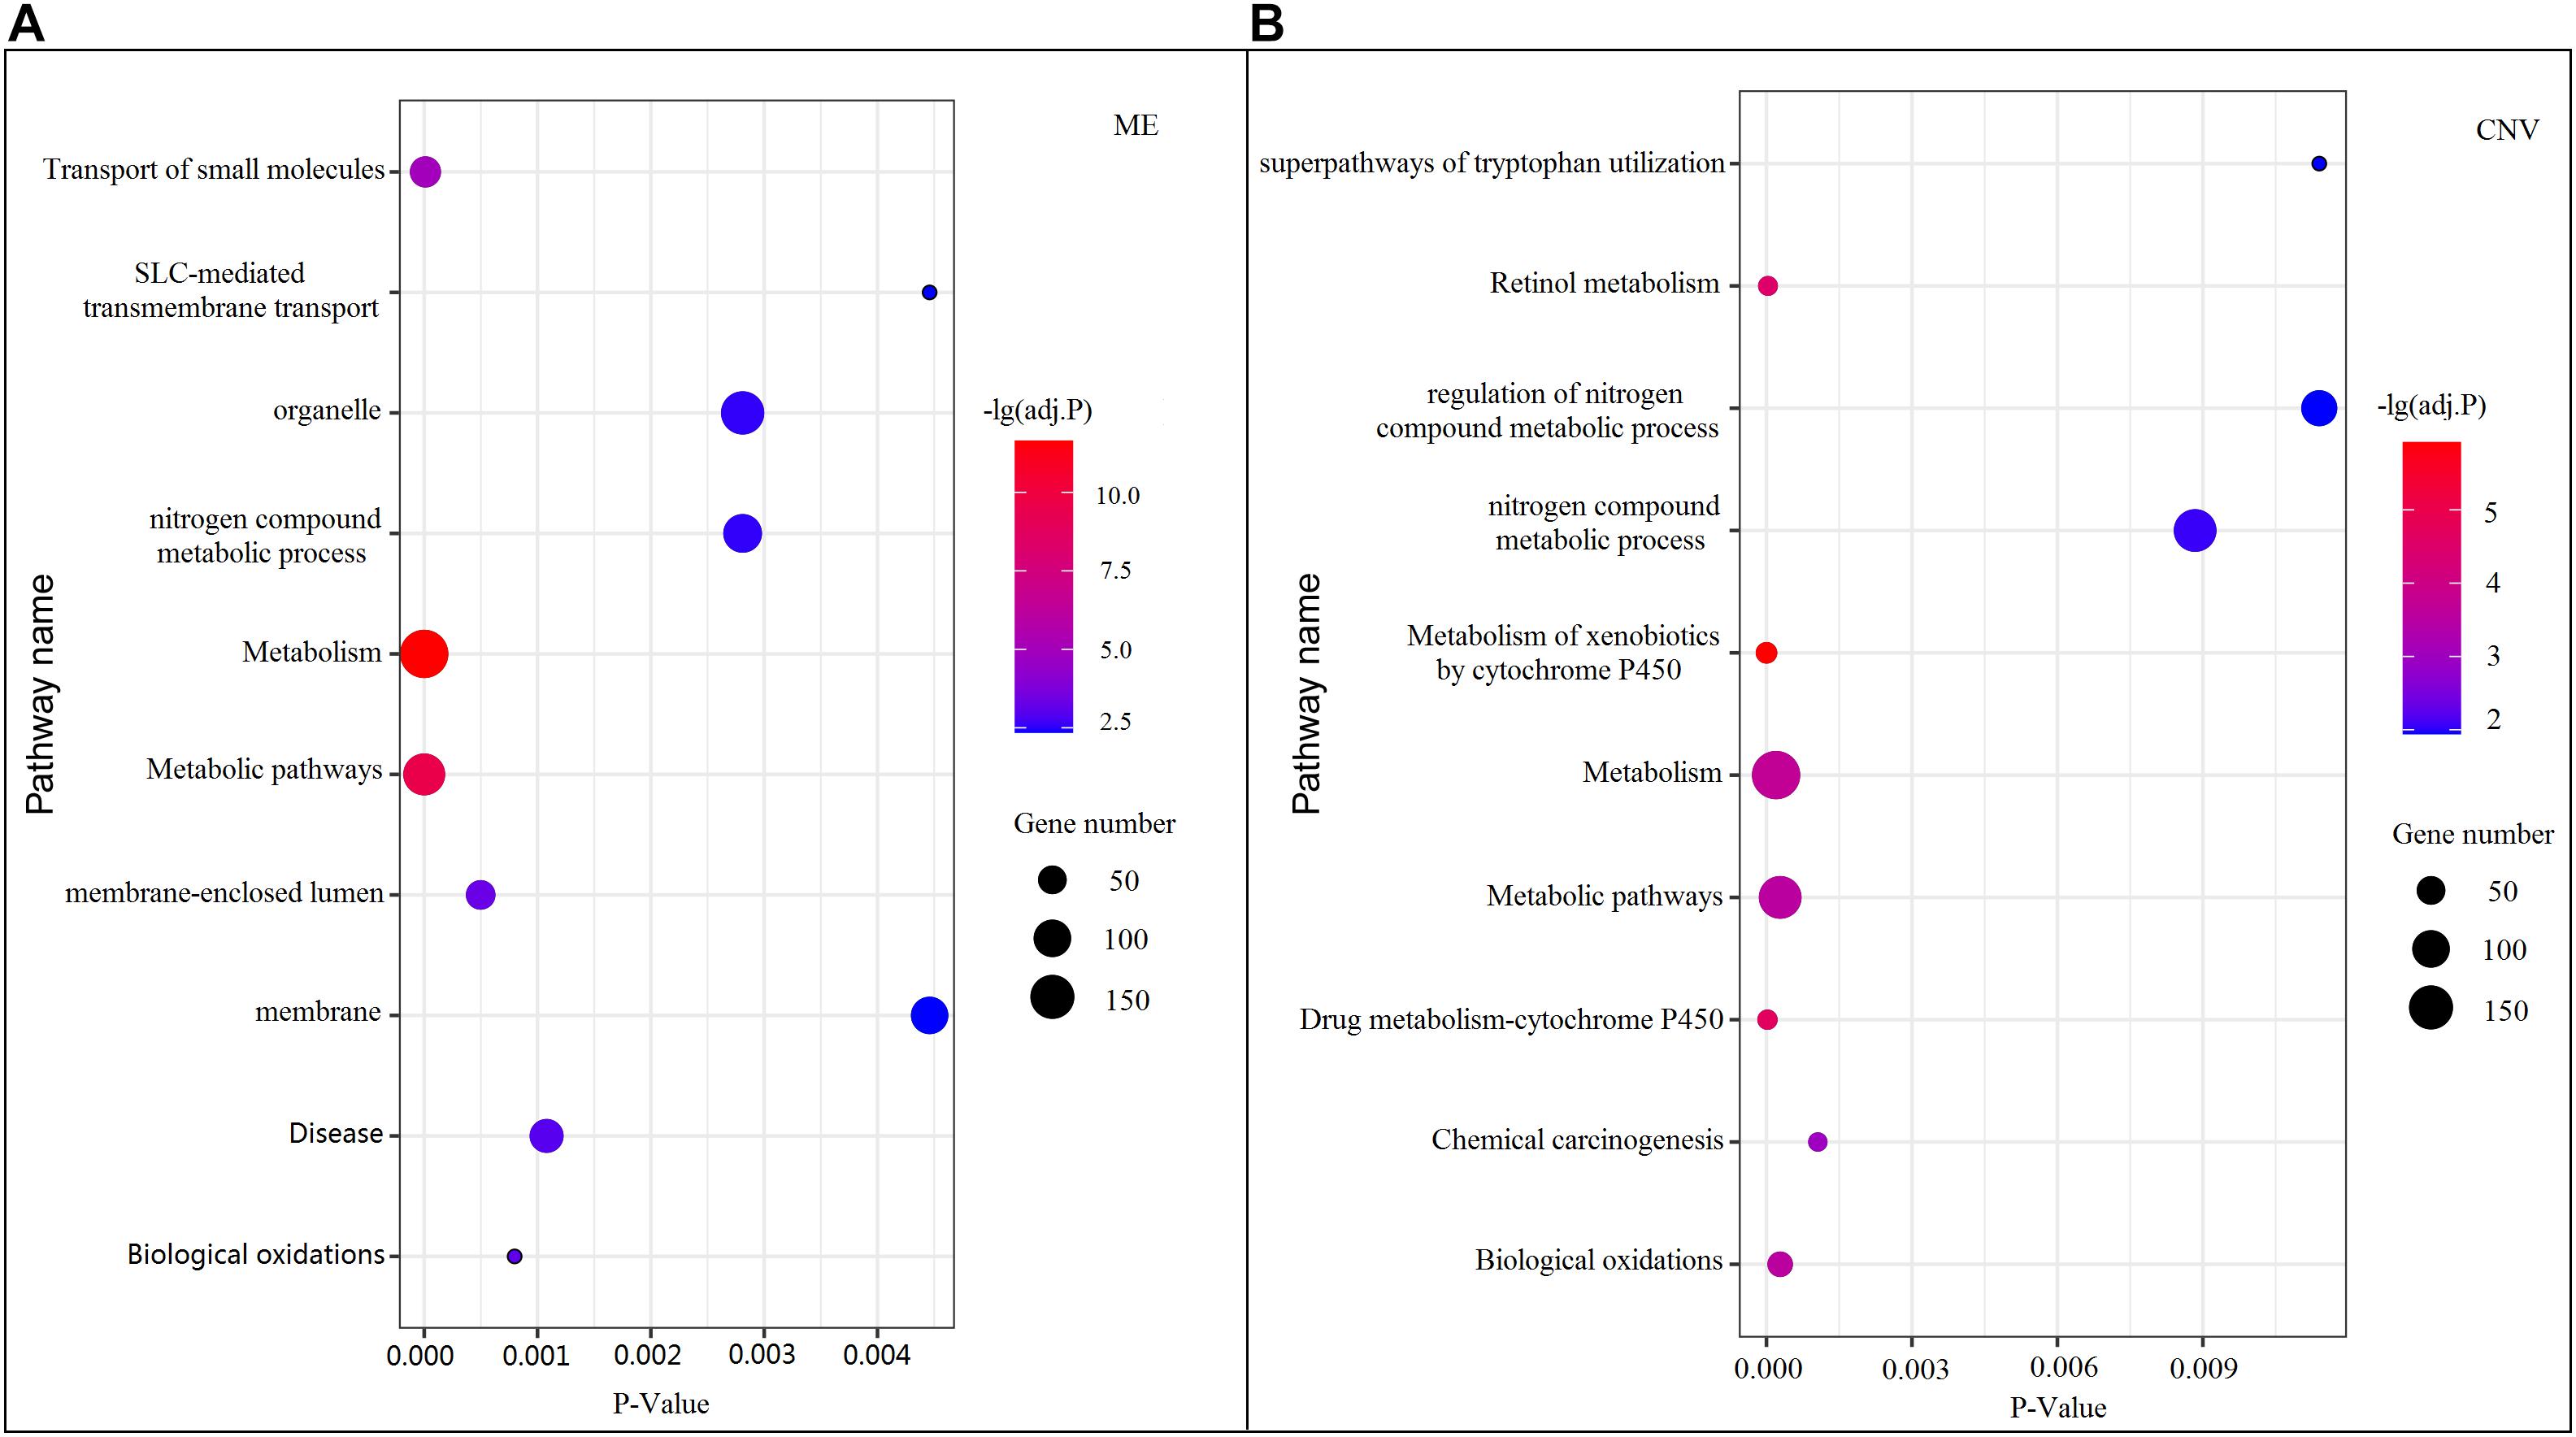
Figure 5. Top 10 pathways enriched in ME and CNV core modules identified by the NMFNA. (A) Represents pathways enriched in the ME core module and (B) represents pathways enriched in the CNV core module.
Analysis of Characteristic Genes
In order to further demonstrate the validity of the NMFNA and deeply understand biological functions of core modules, we detect and analyze characteristic genes from these core modules. First, ME and CNV core modules identified by four compared methods are filtered by removing weak edges with their PCC less than or equal to 0.8. Second, based on these filtered networks, the MS of each gene in the corresponding module is calculated, which can be considered as its contribution to interactions among genes in the module. Third, genes in each core module are sorted in descending order according to the MS, and the top ones are viewed as characteristic genes. In the study, the top 10, 30, and 50 characteristic genes in each core module are, respectively, selected and sent to GeneCards5 to measure their relevance scores, which represent association strengths between corresponding genes and PC. After that, for each compared method, relevance scores of characteristic genes in both ME and CNV core modules are summated together and recorded in Table 4. It is seen that in all scenarios, scores of the NMFNA are significantly larger than the scores of other compared methods, which implies that characteristic genes detected by the NMFNA are more relevant to PC and are more likely to reveal the pathogenic mechanisms of PC.
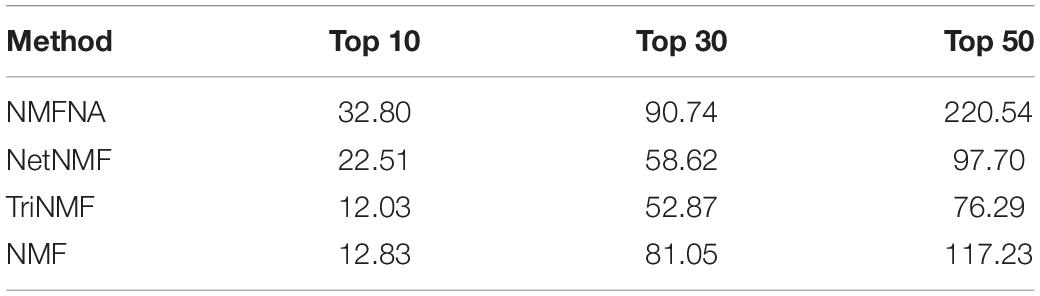
Table 4. Summated relevance scores of characteristic genes in both ME and CNV core modules identified by each compared method.
In addition, for each compared method, PC-related genes in the top 10 characteristic genes of both ME and CNV core modules are retrieved from GeneCards and listed in Table 5. It is seen that the NMFNA hits eight genes and is the winner of all compared methods. We then analyzed in detail the biological functions of these PC-related genes. The TNKS1BP1 has been reported to regulate cancer cell invasion, which might further affect the progression of PC (Mayerle et al., 2003). The TK1 level is upregulated 4-fold in the mice PC specimen (Yao et al., 2012); therefore, we naturally speculate that it might also play a potential role in the human PC. The variation of the KCNJ1 has been claimed to be associated with diabetes (Farook et al., 2002), which is a closely related disease to PC and is generally thought of as the important risk factor of PC. As an independent prognostic biomarker, the SDC1 has been confirmed to be upregulated in PC (Juuti et al., 2005). Since the SDC1 is an important paralog of the SDC3, we infer that the SDC3 might be related to PC. The NR3C2 has been identified as the target of miR-135b-5p, which promotes migration and invasion of PC cells (Zhang et al., 2017). Though the TTC21A, USF1, and MAN1C1 have been marked as PC-related genes in GeneCards, and they are indeed associated with several PC complicating diseases, including hyperlipidemia and alcohol-induced mental disorder, there are few supporting literature studies.
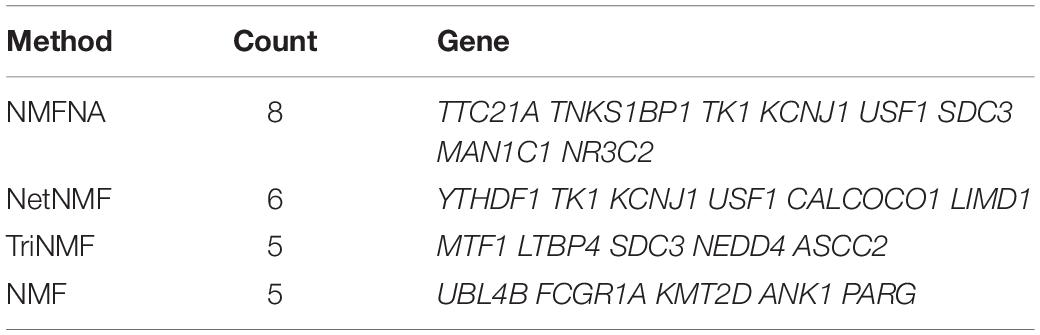
Table 5. PC-related genes in the top 10 characteristic genes of both ME and CNV core modules.
Besides, the experiments of the GEO datasets are also performed to further verify the effectiveness of modules and characteristic genes identified by the NMFNA method. Firstly, we calculated the numbers of common genes of the four datasets GSE62452, GSE15471, GSE16515, and GSE28735. As shown in Supplementary Figure 1, there are 17,327 common genes, which are more likely to be related to PC. Secondly, Table 6 lists the number of genes in the modules obtained by different methods that overlap with these common genes. It can be seen from Table 6 that genes of the core modules identified by the NMFNA method contain the largest number of common genes, which indicates that these core modules have been verified to be related to PC in different databases.

Table 6. Numbers of common genes in ME and CNV core modules.
Conclusion
Pancreatic cancer is a disease with a poor prognosis, in which malignant cells originate in the pancreatic tissue. To understand its pathogenic mechanisms, in this study, based on NMF and graph-regularized constraint, we presented NMFNA to identify modules and characteristic genes from integrated ME and CNV data of PC. First, the ME network, CNV network, and ME–CNV network are constructed by the PCC. Then, these networks are further integrated and decomposed simultaneously to identify modules effectively due to the introduced graph-regularized constraint, which is the highlight of the NMFNA. Finally, both GO and pathway enrichment analyses are performed, and characteristic genes are detected by the multimeasure score, to deeply understand the biological functions of PC core modules. Compared with the NMF, TriNMF, and NetNMF, the NMFNA identified more PC-related GO terms, pathways, and characteristic genes in core modules, demonstrating that the NMFNA facilitates the integration and decomposition of two types of PC data simultaneously and can further serve as an alternative method for detecting modules and characteristic genes from multiple genetic data of complex diseases.
The NMFNA has several advantages. First, it performs well in integrating and decomposing different types of genetic data simultaneously. Second, introducing the graph-regularized constraint into the NMFNA eases the heterogeneity of multiple networks, which is beneficial to detect core modules. Third, the NMFNA can not only consider individual genetic effects but also capture interaction effects among different features contributing to the development of PC. Nevertheless, it still has some limitations. For instance, associations between ME modules and CNV modules, i.e., S11, S22, are not deeply analyzed in theory and experiment; it only supports the integration and decomposition of two types of genetic data and fails three or higher types. These limitations inspire us to continue working in the future.
Data Availability Statement
The original contributions presented in the study are included in the article/Supplementary Material, further inquiries can be directed to the corresponding author/s.
Author Contributions
QD and YS designed the NMFNA method. QD and JS implemented and performed the experiments. QD, FL, YZ, and J-XL analyzed the experiment results and wrote the manuscript. All authors read and approved the final manuscript.
Funding
This work was supported by the National Natural Science Foundation of China (61972226, 61902216, 61902430, and 61872220) and the China Postdoctoral Science Foundation (2018M642635). The funder played no role in the design of the study and collection, analysis, and interpretation of data and in the writing of the manuscript.
Conflict of Interest
The authors declare that the research was conducted in the absence of any commercial or financial relationships that could be construed as a potential conflict of interest.
Supplementary Material
The Supplementary Material for this article can be found online at: https://www.frontiersin.org/articles/10.3389/fgene.2021.678642/full#supplementary-material
Supplementary Figure 1 | Common genes of four GEO datasets.
Footnotes
- ^ https://cancergenome.nih.gov/
- ^ http://www.ncbi.nlm.nih.gov/geo/
- ^ https://david.ncifcrf.gov
- ^ https://github.com/xmao/kobas
- ^ http://www.genecards.org
References
Biswas, N. K., Das, S., Maitra, A., Sarin, R., and Majumder, P. P. (2014). Somatic mutations in arachidonic acid metabolism pathway genes enhance oral cancer post-treatment disease-free survival. Nat. Commun. 5:5835.
Blum, R., and Kloog, Y. (2014). Metabolism addiction in pancreatic cancer. Cell Death Dis. 5:e1065. doi: 10.1038/cddis.2014.38
Chen, J., and Zhang, S. (2018). Discovery of two-level modular organization from matched genomic data via joint matrix tri-factorization. Nucleic Acids Res. 46, 5967–5976. doi: 10.1093/nar/gky440
Dando, I., Donadelli, M., Costanzo, C., Pozza, E. D., and Palmieri, M. (2013). Cannabinoids inhibit energetic metabolism and induce AMPK-dependent autophagy in pancreatic cancer cells. Cell Death Dis. 4:e664. doi: 10.1038/cddis.2013.151
Deng, C., He, X., Han, J., and Huang, T. S. (2011). Graph regularized nonnegative matrix factorization for data representation. IEEE Trans. Pattern Anal. Mach. Intell. 33, 1548–1560. doi: 10.1109/tpami.2010.231
Dennis, G., Sherman, B. T., Hosack, D. A., Yang, J., Gao, W., Lane, H. C., et al. (2003). DAVID: database for annotation. Vis. Integrat. Discov. Genome Biol. 4:3.
Ding, C., Li, T., Peng, W., and Park, H. (2006). “Orthogonal nonnegative matrix t-factorizations for clustering,” in Proceedings of the 12th ACM SIGKDD International Conference on Knowledge Discovery and Data Mining, (Philadelphia, PA).
Ding, Q., Shang, J., Sun, Y., Wang, X., and Liu, J.-X. (2019). HC-HDSD: A method of hypergraph construction and high-density subgraph detection for inferring high-order epistatic interactions. Computat. Biol. Chem. 78, 440–447. doi: 10.1016/j.compbiolchem.2018.11.031
Dong, Y. Y., Zhuang, Y. H., Cai, W. J., Liu, Y., and Zou, W. B. (2016). The mitochondrion interfering compound NPC-26 exerts potent anti-pancreatic cancer cell activity in vitro and in vivo. Tumour Biol. 37, 15053–15063. doi: 10.1007/s13277-016-5403-5
Dreves, A., Facchinei, F., Kanzow, C., and Sagratella, S. (2011). On the solution of the KKT conditions of generalized Nash equilibrium problems. SIAM J. Opt. 21, 1082–1108. doi: 10.1137/100817000
Elyanow, R., Dumitrascu, B., Engelhardt, B. E., and Raphael, B. J. (2020). NetNMF-SC: leveraging gene-gene interactions for imputation and dimensionality reduction in single-cell expression analysis. Genome Res. 30, 195–204. doi: 10.1101/gr.251603.119
Farook, V. S., Hanson, R. L., Wolford, J. K., Bogardus, C., and Prochazka, M. (2002). Molecular analysis of KCNJ10 on 1q as a candidate gene for type 2 diabetes in pima Indians. Diabetes 51, 3342–3346. doi: 10.2337/diabetes.51.11.3342
Gajate, C., Matos-Da-Silva, M., Dakir, L. H., Fonteriz, R. I., Alvarez, J., and Mollinedo, F. (2012). Antitumor alkyl-lysophospholipid analog edelfosine induces apoptosis in pancreatic cancer by targeting endoplasmic reticulum. Oncogene 31, 2627–2639. doi: 10.1038/onc.2011.446
Gao, Y., Hou, M., Liu, J., and Kong, X. (2019). An integrated graph regularized non-negative matrix factorization model for gene co-expression network analysis. IEEE Access 7, 126594–126602. doi: 10.1109/access.2019.2939405
Gong, H., Wu, T. T., and Clarke, E. M. (2014). Pathway-gene identification for pancreatic cancer survival via doubly regularized Cox regression. BMC Syst. Biol. 8(Suppl. 1):S3.
Hou, M.-X., Liu, J.-X., Gao, Y.-L., Shang, J., Wu, S.-S., and Yuan, S.-S. (2019). A new model of identifying differentially expressed genes via weighted network analysis based on dimensionality reduction method. Curr. Bioinform. 14, 762–770. doi: 10.2174/1574893614666181220094235
Hu, B., Shi, C., Jiang, H. X., and Qin, S. Y. (2017). Identification of novel therapeutic target genes and pathway in pancreatic cancer by integrative analysis. Medicine (Baltimore) 96:e8261. doi: 10.1097/md.0000000000008261
Hu, K., and Chen, F. (2012). Identification of significant pathways in gastric cancer based on protein-protein interaction networks and cluster analysis. Genet. Mol. Biol. 35, 701–708. doi: 10.1590/s1415-47572012005000045
Juhász, M., Chen, J., Lendeckel, U., Kellner, U., and Ebert, M. P. A. (2003). Expression of carbonic anhydrase IX in human pancreatic cancer. Aliment. Pharmacol. Therapeut. 18, 837–846. doi: 10.1046/j.1365-2036.2003.01738.x
Juuti, A., Nordling, S., Lundin, J., Louhimo, J., and Haglund, C. (2005). Syndecan-1 expression - a novel prognostic marker in pancreatic cancer. Oncology 68, 97–106.
Kanehisa, M., Furumichi, M., Tanabe, M., Sato, Y., and Morishima, K. (2016). KEGG: new perspectives on genomes, pathways, diseases and drugs. Nucleic Acids Res. 45, D353–D361.
Kwon, M. S., Kim, Y., Lee, S., Namkung, J., Yun, T., Yi, S. G., et al. (2015). Integrative analysis of multi-omics data for identifying multi-markers for diagnosing pancreatic cancer. BMC Genomics 16(Suppl. 9):S4.
Lee, D. D., and Seung, H. S. (1999). Learning the parts of objects by non-negative matrix factorization. Nature 401, 788–791. doi: 10.1038/44565
Li, C., Zeng, X., Yu, H., Gu, Y., and Zhang, W. (2018). Identification of hub genes with diagnostic values in pancreatic cancer by bioinformatics analyses and supervised learning methods. World J. Surgical Oncol. 16, 1–12.
Liu, J., Wang, C., Gao, J., and Han, J. (2013). “Multi-view clustering via joint nonnegative matrix factorization,” in Proceedings of the 2013 SIAM International Conference on Data Mining. Society for Industrial and Applied Mathematics (Philadelphia PA), 252–260.
Liu, Y., Gu, Q., Hou, J. P., Han, J., and Ma, J. (2014). A network-assisted co-clustering algorithm to discover cancer subtypes based on gene expression. BMC Bioinform. 15:37. doi: 10.1186/1471-2105-15-37
Long, J., Liu, Z., Wu, X., Xu, Y., and Ge, C. (2016). Screening for genes and subnetworks associated with pancreatic cancer based on the gene expression profile. Mol. Med. Rep. 13, 3779–3786. doi: 10.3892/mmr.2016.5007
Lu, J., Zhang, X., Shen, T., Chao, M., Wu, J., Kong, H., et al. (2016). Epigenetic profiling of H3K4Me3 reveals herbal medicine jinfukang-induced epigenetic alteration is involved in anti-lung cancer activity. Evid Based Comp. Alternat. Med. 7276161, 1–13. doi: 10.1155/2016/7276161
Mayerle, J., Friess, H., Büchler, M. W., Schnekenburger, J., Weiss, F. U., Zimmer, K. P., et al. (2003). Up-regulation, nuclear import, and tumor growth stimulation of the adhesion protein p120ctn in pancreatic cancer. Gastroenterology 124, 949–960. doi: 10.1053/gast.2003.50142
Mishra, N. K., and Guda, C. (2016). Genome-wide DNA methylation analysis reveals molecular subtypes of pancreatic cancer. Oncotarget 8, 28990–29012. doi: 10.18632/oncotarget.15993
Mizrahi, J. D., Surana, R., Valle, J. W., and Shroff, R. T. (2020). Pancreatic cancer. The Lancet 395, 2008–2020.
Qiao, H. (2015). New SVD based initialization strategy for non-negative matrix factorization. Pattern Recog. Lett. 63, 71–77. doi: 10.1016/j.patrec.2015.05.019
Sakai, Y., Honda, M., Matsui, S., Komori, O., Murayama, T., Fujiwara, T., et al. (2019). Development of novel diagnostic system for pancreatic cancer, including early stages, measuring mRNA of whole blood cells. Cancer Sci. 110, 1364–1388. doi: 10.1111/cas.13971
Shang, J., Ding, Q., Yuan, S., Liu, J.-X., Li, F., and Zhang, H. (2019). Network analyses of integrated differentially expressed genes in papillary thyroid carcinoma to identify characteristic genes. Genes 10:45. doi: 10.3390/genes10010045
Tao, L. Y., Zhang, L. F., Xiu, D. R., Yuan, C. H., Ma, Z. L., and Jiang, B. (2016). Prognostic significance of K-ras mutations in pancreatic cancer: a meta-analysis. World J. Surgical Oncol. 14:146.
Treviño, J. G., Pillai, S. R., Kunigal, S. S., and Chellappan, S. P. (2011). Nicotine regulates DNA-binding protein inhibitor (Id1) through a Src-dependent pathway promoting tumorigenic properties and chemoresistance in pancreatic adenocarcinoma. Cancer Res. 71, 1972–1972.
Wang, J. Y., Wang, X., and Gao, X. (2013). Non-negative matrix factorization by maximizing correntropy for cancer clustering. BMC Bioinform. 14:107. doi: 10.1186/1471-2105-14-107
Wang, P., Gao, L., Hu, Y., and Li, F. (2018). Feature related multi-view nonnegative matrix factorization for identifying conserved functional modules in multiple biological networks. BMC Bioinform. 19:394.
Wolpin, B. M., Michaud, D. S., Giovannucci, E. L., Schernhammer, E. S., Stampfer, M. J., Manson, J. E., et al. (2007). Circulating insulin-like growth factor binding protein-1 and the risk of pancreatic cancer. Cancer Res. 67, 7923–7928.
Wu, T. T., Gong, H., and Clarke, E. M. (2011). A transcriptome analysis by lasso penalized Cox regression for pancreatic cancer survival. J. Bioinform. Computat. Biol. 9(Suppl. 1) 63–73. doi: 10.1142/s0219720011005744
Xiao, Q., Luo, J., Liang, C., Cai, J., and Ding, P. (2018). A graph regularized non-negative matrix factorization method for identifying microRNA-disease associations. Bioinformatics 34, 239–248. doi: 10.1093/bioinformatics/btx545
Yang, D., Zhu, Z., Wang, W., Shen, P., Wei, Z., Wang, C., et al. (2013). Expression profiles analysis of pancreatic cancer. Eur. Rev. Med. Pharmacol. Sci. 17, 311–317.
Yang, Z., and Michailidis, G. (2016). A non-negative matrix factorization method for detecting modules in heterogeneous omics multi-modal data. Bioinformatics 32, 1–8.
Yao, X., Zeng, M., Wang, H., Sun, F., Rao, S., and Ji, Y. (2012). Evaluation of pancreatic cancer by multiple breath-hold dynamic contrast-enhanced magnetic resonance imaging at 3.0 T. Eur. J. Radiol. 81, 917–922.
Zhang, S., Liu, C.-C., Li, W., Shen, H., Laird, P. W., and Zhou, X. J. (2012). Discovery of multi-dimensional modules by integrative analysis of cancer genomic data. Nucleic Acids Res. 40, 9379–9391. doi: 10.1093/nar/gks725
Zhang, Z., Che, X., Yang, N., Bai, Z., Wu, Y., Zhao, L., et al. (2017). miR-135b-5p Promotes migration, invasion and EMT of pancreatic cancer cells by targeting NR3C2. Biomed. Pharmacother. 96, 1341–1348. doi: 10.1016/j.biopha.2017.11.074
Zhao, L., Zhao, H., and Yan, H. (2018). Gene expression profiling of 1200 pancreatic ductal adenocarcinoma reveals novel subtypes. BMC Cancer 18:603.
Zhao, S., Lv, N., Li, Y., Liu, T., Sun, Y., and Chu, X. (2020). Identification and characterization of methylation-mediated transcriptional dysregulation dictate methylation roles in preeclampsia. Human Genomics 14, 1–10. doi: 10.1155/2012/170172
Zheng, M., Hu, Y., Gou, R., Wang, J., Nie, X., Li, X., et al. (2019). Integrated multi-omics analysis of genomics, epigenomics, and transcriptomics in ovarian carcinoma. Aging (Albany NY) 11, 4198–4215. doi: 10.18632/aging.102047
Keywords: pancreatic cancer, non-negative matrix factorization, module, network analysis, characteristic gene
Citation: Ding Q, Sun Y, Shang J, Li F, Zhang Y and Liu J-X (2021) NMFNA: A Non-negative Matrix Factorization Network Analysis Method for Identifying Modules and Characteristic Genes of Pancreatic Cancer. Front. Genet. 12:678642. doi: 10.3389/fgene.2021.678642
Received: 10 March 2021; Accepted: 03 June 2021;
Published: 22 July 2021.
Edited by:
Pan Zheng, University of Canterbury, New ZealandReviewed by:
Shanfeng Zhu, Fudan University, ChinaTao Song, Polytechnic University of Madrid, Spain
Copyright © 2021 Ding, Sun, Shang, Li, Zhang and Liu. This is an open-access article distributed under the terms of the Creative Commons Attribution License (CC BY). The use, distribution or reproduction in other forums is permitted, provided the original author(s) and the copyright owner(s) are credited and that the original publication in this journal is cited, in accordance with accepted academic practice. No use, distribution or reproduction is permitted which does not comply with these terms.
*Correspondence: Junliang Shang, shangjunliang110@163.com