 Changmin Hu1,2†Jianhua Jiang1†Yulong Li3Shaojie Song1
 Yu Zou1Chunyu Jing1Ying Zhang1Dezheng Wang1Qiang He4*
 Xiaojing Dang1*
- 1Institute of Rice Research, Anhui Academy of Agricultural Sciences, Hefei, China
- 2College of Agronomy, Anhui Agricultural University, Hefei, China
- 3Institute of Crop Research, Anhui Academy of Agricultural Sciences, Hefei, China
- 4State Key Laboratory of Hybrid Rice, Hunan Hybrid Rice Research Center, Changsha, China
Heat tolerance (HT) of rice at anthesis is a key trait that ensures high and stable yields under heat stress. Finding the quantitative trait loci (QTLs) and gene loci controlling HT is crucial. We used relative spikelet fertility (RSF) as a measure of HT. The phenotypic values of RSF in 173 rice accessions were investigated in two environments and showed abundant variations. We performed a genome-wide association study on RSF using 1.2 million single nucleotide polymorphisms (SNPs). Five QTLs were significantly associated with RSF were identified, four were found in previously reported QTLs/genes, and one was novel. The novel QTL qRSF9.2 was mapped into the 22,059,984-22,259,984 bp region, which had 38 positional candidate genes. By combining the linkage disequilibrium analysis, the QTL region was narrowed to 22,110,508–22,187,677 bp, which contained 16 candidate genes. Among them, only gene LOC_Os09g38500 contained nonsynonymous SNPs that were significantly associated with RSF. In addition, accessions with large and small RSF values had corresponding respective high and low gene expression levels. Furthermore, the RSF of the CC allele was significantly higher than that of the TT allele. Hap 2 and Hap 3 can increase heat tolerance by 7.9 and 11.3%, respectively. Our results provide useful information that recommends further cloning of qRSF9.2 and breeding heat-tolerant rice varieties by marker-assisted selection.
Introduction
Globally, rice is a vital food crop and is the staple food of the majority of the world’s population (Pan et al., 2020). Heat damage caused by climate warming is one of the main abiotic stresses affecting rice production. In the reproductive growth period, especially in the flowering period, rice plants are sensitive to high temperature, which hinders their flowering and fertilization and thereby reduces the seed setting rate and yield (Nubankoh et al., 2020).
Recently, heat damage frequently occurred in the rice-planting area. For example, in 2006 and 2007, the rice-planting areas of the Yangtze River Valley in China experienced unusually high temperatures for >20 d, which lead to a 50% reduction in the rice seed setting rate in some areas (Xiao et al., 2011). In 2013 and 2017, during the rice booting and flowering periods, the high temperature weather in the Yangtze River Valley in China continued for >20 d. In 2017, a 2.67×10⁵ hm2 of rice was damaged by heat in the Anhui Region (Zhang et al., 2020). Studies have shown that for every 1°C the air temperature increases, the rice yield will decrease by 3.2% (Zhao et al., 2017). Gourdji et al. (2013) predicted that by 2030, about 16% of global rice production will experience heat stress above the critical point for at least 5 d during reproductive growth. However, the main rice varieties that are currently used are generally sensitive to high temperature, and so improving their heat tolerance has become an urgent task (Shi et al., 2018). Bhardwaj et al. (2022) indicated that it is necessary to use an ‘omics’ approaches in developing combined drought and heat tolerance in food crops.
Heat tolerance is an extremely complex quantitative trait in rice, which is controlled by many genes (Ishimaru et al., 2010). To date, 205 quantitative trait loci (QTLs) controlling heat tolerance-related traits have been identified, which were located on all 12 chromosomes. These QTLs were detected based on different populations, such as F2 (Asako et al., 2007; Ye et al., 2012, 2015a,b; Zheng et al., 2017; Nubankoh et al., 2020), F2:3 (Chen et al., 2021), doubled haploid (DH) (Cao et al., 2002), backcross inbred lines (BILs) (Zhu et al., 2006; Tazib et al., 2015; Cao et al., 2020), recombinant inbred lines (RILs) (Tabata et al., 2007; Chen et al., 2008; Jagadish et al., 2010; Xiao et al., 2011; Wada et al., 2015; Shanmugavadivel et al., 2017; Kilasi et al., 2018; Li et al., 2018), chromosome segment substitution lines (CSSLs) (Zhao et al., 2016; Zhu et al., 2017) and natural population (Pan et al., 2021), a different growth and development period from seedling stage to grain filling stage, different ways of heat stress, such as natural or artificial high temperature stress, different evaluation indexes, such as heading and flowering time, and indexes related to yield/seed setting rate and quality. Among them, 40 QTLs were detected at the heading and anthesis stages, which were most susceptible to high temperature stress (Jagadish et al., 2010; Cheng et al., 2012; Ye et al., 2012; Ye et al., 2015a; Ye et al., 2015b; Shanmugavadivel et al., 2017; Li et al., 2018; Nubankoh et al., 2020; Chen et al., 2021).
During this period, several QTLs or genes for heat tolerance were successively cloned at the seedling stage. OsTT1 (Thermo-tolerance 1) is the first cloned QTL for heat tolerance of rice at the seedling stage. The OsTT1 protein protects cells from heat stress by allowing more efficient elimination of cytotoxic denatured proteins and more effective maintenance of heat-response processes to reduce the yield loss caused by heat stress (Li et al., 2015). TOGR1 (Thermotolerant growth required 1) encodes a DEAD-box RNA helicase regulated by both temperature and the circadian clock and is associated with the pre-rRNA processome at high temperatures, which regulates the thermotolerant growth of rice (Wang et al., 2016). OsHTAS (Heat tolerance at seedling stage) encodes a ring finger ubiquitin ligase and modulated hydrogen peroxide-induced stomatal closure to enhance heat tolerance at the seedling stage in rice (Liu et al., 2016). Chen et al. (2019) identified AET1, a tRNAHis guanylytransferase, which regulates auxin signaling in response to high temperatures and the environmental temperature response in rice. Cao et al. (2022) identified HTH5 from Oryza rufipogen Griff, which reduced reactive oxygen species accumulation at high temperatures by increasing the level of the heat-induced pyridoxal 5′-phosphate, increasing pollen vitality, and thereby improving spikelet fertility. The heat tolerance QTL qHTSF4.1 was introgressed into the IR64 background using the molecular marker-assisted selection method and the near isogenic lines IR64HT4 were developed. The seed setting rate of IR64HT4 was significantly higher than that of its recurrent parent IR64 under high temperature (Ye et al., 2022).
Therefore, screening and identifying germplasm resources, mining more genes, and breeding new rice varieties with greater heat tolerance are the main ways of reducing heat stress and stabilizing grain yield. Here, we investigated the phenotype values of the relative seed setting rate in 173 rice materials and performed a genome-wide association study (GWAS) to mine markers associated with heat tolerance and predict candidate genes. These results provide a theoretical foundation for elucidating the genetic mechanism of heat tolerance at the heading and flowering stage and a material foundation for breeding new heat-tolerant rice varieties.
Materials and methods
Plant materials and field planting
A set of 173 rice materials were obtained from Dang et al. (2020), of which, 134 were from China, including 74 improved and 60 local varieties, and 39 from Southeast Asian countries. The details of these rice samples, including their names, origins, and sequence IDs, are summarized in Supplementary Table S1. Fengliangyou 4hao was selected as the high temperature tolerant control based on its high heat tolerance, high yield, and wide use, and Yanhui 559 was selected as the high temperature sensitive control. These materials were grown at the Experimental Station of Anhui Academy of Agricultural Sciences (Hefei, Anhui Province, China) in 2020 and 2021, respectively. Routine field management guidelines followed. The seeds were planted on May 10, 2020. On June 8, the seedlings were transplanted into a 20 cm × 30 cm plastic basin loaded with substrate (1 kg) and natural air-dried soil (3 kg). One plastic basin was considered a single plot. Each plant sample was planted in four plots with four plants. A completely random design was used regardless of natural or heat treatment. The same process was performed in 2021.
High temperature stress treatment
The high temperature stress treatment was conducted like Zhang et al. (2020). For one sample, > 10 panicles heading on the same day were selected and labeled with a plastic tag. At 09:30 in the morning, two plots with the plastic tag were put into the intelligent greenhouse of Rice Research Institute of Anhui Academy of Agricultural Sciences. The temperature settings for each time period are as follows: 07:01-09:30 for 32.5 °C; 09:31-14:30, 40.0 °C; 14:31-17:00, 36.5 °C; 17:01-21:00, 32.0 °C; and 21:01-07:00, 29.0 °C. The relative humidity in the greenhouse was controlled at 60–70%. The treatment continued for 5 d. The treated plants were removed from the greenhouse at 09:30 on the sixth day and placed under natural conditions to grow until mature. In addition, the other two plots with labeled tags were used as controls to grow to maturity under natural conditions.
Trait investigation and heat resistance evaluation
On the 20th day after the high temperature treatment, 10 panicles with labeled tags were taken from the control and treatment groups. The total number of spikelets (TNS) and the number of filled spikelets (NFS) of each panicle were counted. The spikelet fertility (SF) for a single panicle was calculated. The formula was SF (%) = (NFS/TNS) × 100. The SF under natural conditions was recorded as SFn. The SF in the high temperature condition was recorded as SFht. The relative spikelet fertility (RSF) was calculated as follows: RSF (%) = (SFht/SFn) × 100. The RSF was used as the measure for heat tolerance at anthesis in rice.
Genotypic data
The sequences of the accessions are available at the NCBI Sequence Read Archive with accession number PRJNA554986 (Dang et al., 2020). All paired-end sequence reads were aligned against the Os-Nipponbare-Reference-IRGSP 1.0 with Bowtie 2 (Li and Durbin, 2010). More than 95% of the reads with a mapping score >60 were found and mapped to the reference genome. The SNP calling was performed by HaplotypeCaller from GATK 3.8-0. The missing genotype data was completed with Beagle v4.1 (Browning and Browning, 2009). A total of 1,224,254 SNPs with a minor allele frequency (MAF) > 5% and a missing rate <20% were obtained to estimate population structure, kinship coefficients, and perform GWAS.
Population structure analysis
STRUCTURE 2.3.4 software (Pritchard et al., 2000) was used to analyze the population structure with a burn-in of 50,000 replicates and 100,000 Markov chain Monte Carlo iterations. Ten repeats for each K value (K = 1-10) were performed. The EVANNO method with STRUCTURE HARVESTER (Earl and vonHoldt, 2012) was used to analyze the results, and CLUMPP V 1.1.2 (Jakobsson and Rosenberg, 2007) was used to permute run clusters. The ΔK was calculated to determine the suitable K value. We used DISTRUCT (Rosenberg, 2004) to plot results. The non-admixed individual in each subgroup with Q-matrix assignment was >0.85. PHYLIP 3.2 (Felsenstein, 1993) was used to construct the neighbor-joining tree and MEGA 5.0 (Tamura et al., 2011) was used to display the tree. The smartpca program from gcta64 (Price et al., 2006) was used to perform principal component analysis and plot the first two principal components in two dimensions.
Genome-wide association analysis
The kinship matrix was calculated using TASSEL 5.2.1 (Bradbury et al., 2007). GWAS was performed using the R package Genomic Association and Prediction Integrated Tool (Lipka et al., 2012) based on a mixed linear model. Referring to the methods reported by Yang et al. (2014), the region was recognized as a QTL when the associations loci exceeded the p-value thresholds (<1 × 10⁻⁴) with clear peak-like signals (≥3 significant SNPs) and they were in the 200 kb region of the leading SNP. The linkage disequilibrium (LD) heatmaps surrounding peaks in the GWAS (Shin et al., 2006) were constructed using the R package “LDheatmap.” We used the R package qqman (Turner, 2014) to draw the manhattan and quantile-quantile plots. The Benjamini and Hochberg (1995) correction method was used to determine the genome-wide significance thresholds of the GWAS, which was 1.0 × 10⁻⁴ at a nominal level of 0.05.
Candidate gene analysis
The candidate genes were predicted within a 200 kb genomic region, i.e., ± 100 kb of the significant leading SNP of the QTL based on the Rice Genome Annotation Project MSU7 database (http://rice.plantbiology.Msu.edu). LD analysis was performed with Haploview to define LD blocks surrounding significant SNPs (Barrett et al., 2005). The causal gene for each locus was decided based on the gene annotation and expression analysis.
Quantitative reverse transcription PCR analysis of candidate genes
Three accessions with high RSF values were subject to 38 °C heat stress from 09:30 a.m. to 15:30 p.m. during the day for 3 d in a phytotron, and three plants were used for each sample. The same was done for three accessions with low RSF. After a 3 d heat treatment, we sampled the panicle tissues at different times, i.e., at 08:30 a.m., 09:30 a.m., 10:30 a.m., 11:30 a.m., 12:30 p.m., 13:30 p.m., 14:30 p.m., 15:30 p.m., 16:30 p.m., and 17: 30 p.m., and we named the sampling periods in order from No. 1 to 10.
The total RNA was extracted using the TianGen Pure Plant Plus Kit (TianGen Biotech Co., Ltd., Beijing) following the manufacturer’s protocol. We used the HisScript II Reverse Transcriptase system (Vazyme Biotech Co., Ltd., Nanjing, China) to synthesize the first-strand cDNA with random oligonucleotides. The UBQ rRNA gene was used as an internal control. The 96-well thermocycler (Roche Applied Science LightCycler 480, https://lifescience.roche.com/) was used to perform the real-time quantitative PCR (qRT-PCR) by SYBR Green (Vazyme). The cycling conditions were as follows: first, denaturation occurred at 95 °C for 5 min; second, an amplification and quantification program with 40 cycles (a single fluorescence measurement) at 95 °C for 10 s, 60 °C for 30 s, and 72 °C for 60 s occurred; third, the melting curve (continuous fluorescence measurement) occurred at 60-95 °C with a heating rate of 0.1 °C sec−1; and finally, a cooling step occurred at 40 °C. Three biological replicate experiments were conducted. The primers used for qRT-PCR are listed in Supplementary Table S2. The transcript levels of gene expression were calculated (Livak and Schmittgen, 2001) following the equation exp = 2−ΔCt, where ΔCt = Cttarget gene − CtUBQ rRNA.
Haplotype analysis
Using the RiceVarMap (http://ricevarmap.ncpgr.cn/) and China Rice Data Center (https://www.ricedata.cn/) databases, the haplotypes of candidate genes were determined. When haplotypes were represented by more than 20 accessions, we considered it a haplotype.
Data analysis
The statistical data analysis was conducted by the Statistix 8.0 software (Analytical Software, Tallahassee, Florida, USA). The random model was used for analysis of variance (ANOVA). The broad-sense heritability was calculated using the following formula based on the results described in the ANOVA table. The formula is H2B (%) = [(MSg-MSe)/r]/[(MSg-MSe)/r + MSe]*100%. MSg is the mean square of the genotype, MSe is mean square of the error, and r is number of replicates.
Results
Phenotypic analysis of SF under natural and high temperature stress conditions
The maximum, minimum, and mean values as well as coefficients of variation (CV) of heat tolerance-related traits are listed in Figure 1A. Figure 1B shows the SF of rice panicles for materials under natural and high temperature treatment conditions. The SF of II-32B was 83.36% under natural conditions and 37.49% under high temperature treatment with a difference value of 45.87%. The SF of Chenwan 3hao was 56.77% under natural conditions and 29.55% under the high temperature treatment with a difference value of 27.22%. These results suggest that RSF is a reliable measurement indicator of heat tolerance at the flowering stage in rice.
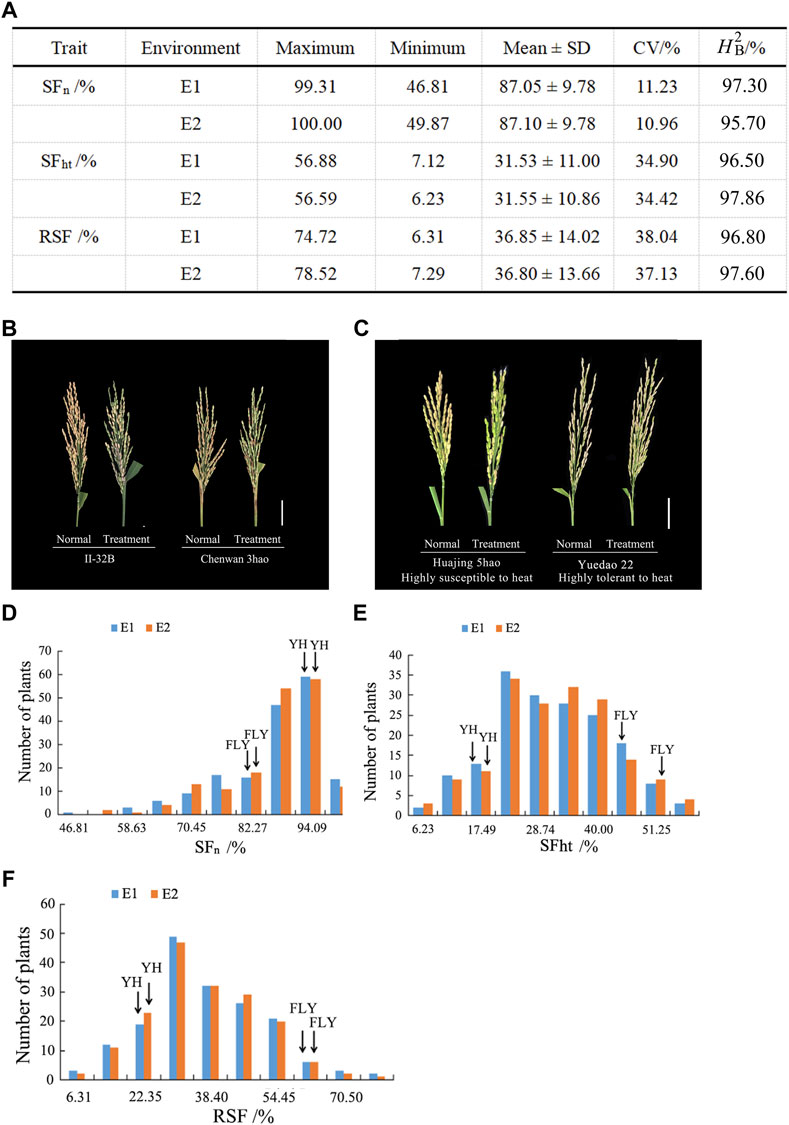
FIGURE 1. Phenotypic diversity of heat tolerance relative traits in rice. (A) Phenotypic statistics of heat tolerance relative traits in E1 and E2. (B) Panicle morphology of materials II-32B and Chenwan 3hao in the normal and treatment conditions, respectively. Scale bar, 5 cm. (C) Panicle morphology of material Huajing 5hao that is highly susceptible to heat and highly tolerant to heat material Shengtangqing in normal and treatment conditions, respectively. Scale bar, 5 cm. (D) Variation of SFn among the 173 rice accessions in E1 and E2. (E) Variation of SFht among the 173 rice accessions in E1 and E2. (F) Variation of RSF among the 173 rice accessions in E1 and E2. H2B, the broad-sense heritability; SFn, spikelet fertility in normal conditions; SFht, spikelet fertility in high temperature conditions; RSF, relative spikelet fertility.
Figure 1C displays the rice panicle morphology of the genotypes that are highly tolerant and susceptible to heat. The maximum value of the SFn was 100% and the minimum value was 46.81% among the two environments (Figures 1A,D). The CV ranged from 11.23 to 10.96% across the two environments. Figure 1D shows that the SFn of Yanhui 559 was 92.44% in E1 and 93.42% in E2, and the SFn of Fengliangyou 4hao was 80.64% in E1 and 82.15% in E2.
The maximum value of SFht was 56.88% and the minimum value was 6.23% among the two environments, and the CV ranged from 34.90 to 34.42% (Figures 1A,E). The SFht of Yanhui 559 was 18.59% in E1 and 20.03% in E2, and the SFht of Fengliangyou 4hao was 47.70% in E1 and 51.31% in E2 (Figure 1E).
For the RSF trait, the mean value was 36.85 ± 14.02% in E1 and 36.80 ± 13.66% in E2 with the CV ranging from 37.13 to 38.22% (Figures 1A,F). The RSF of Yanhui 559 was 20.10% in E1 and 21.44% in E2, with the RSF of Fengliangyou 4hao was 58.87% in E1 and 62.77% in E2 (Figure 1F). The average broad-sense heritability across two years was 96.5% for SFn, 97.18% for SFht and 97.20% for RSF (Figure 1A). The scatterplots of SFn, SFht and RSF across two years were conducted and shown in Supplementary Figure S1. Based on the results of analysis of variance for SFn, SFht, and RSF, we found that there were significant differences among genotypes and no significant differences among the environments (Table 1). These results suggest that the traits of SFn, SFht, and RSF were genetically stable and controlled by genotypes in two environments.
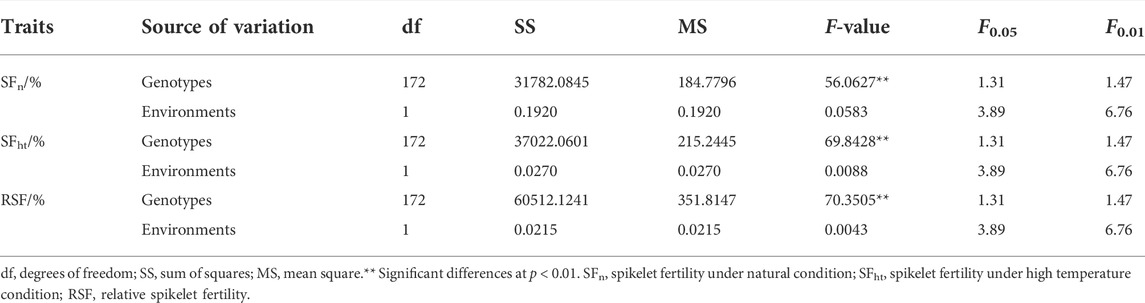
TABLE 1. The results of analysis of variance for the heat tolerance-related traits.
Population structure
STRUCTURE was used to calculate the genetic composition of each variety. When K = 2, the inflection point appears on the broken line (Figure 2A). Then, the logarithmic likelihood value decreases as the K value increases. To determine subgroups, we calculated the ΔK value. When K = 2, ΔK reaches its maximum value (Figure 2B). Therefore, we divided the 173 rice varieties into two subgroups named POP1 and POP2 (Figure 2C). The materials were divided into a special subgroup with a Q value > 0.90. The results showed that POP1 contained 91 materials that mainly belonged to Japonica, and POP2 contained 59 materials that mainly belong to Indica. The remaining 23 accessions could not be divided into fixed subgroups and were considered a mixed group. Based on Nei’s genetic distance (Nei et al., 1983), the neighbor trees showed that 173 materials were divisible into two subgroups (Figure 2D). According to the eigenvector distribution, the 173 accessions could be divided into two clusters by principal component analysis (Figure 2E). The first and second principal component accounted for 7.40 and 2.48% of the total genetic variation, respectively. These results indicate that the population can be reliably divided into two subgroups.
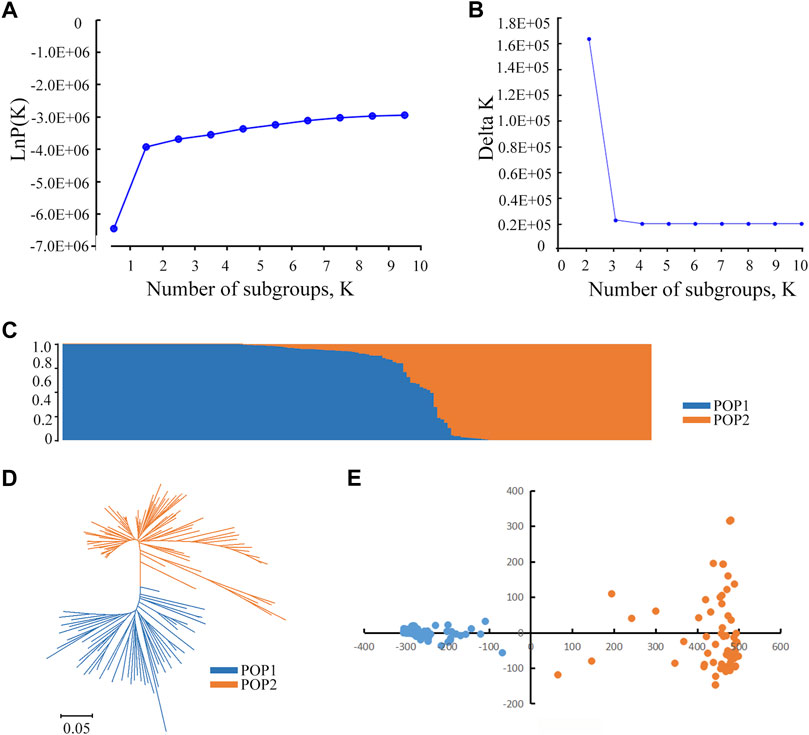
FIGURE 2. Population structure analysis of 173 rice accessions. (A) Changes of the mean LnP(K). A graph of Y axis means of mean LnP(K) and X axis means for the number of subgroups. (B) Changes in the mean delta K. A graph of Y axis means of mean delta K and X axis means for the number of subgroups. (C) The population structure based on a Bayesian model. Each vertical bar represents one accession, and the length of each vertical bar represents the ancestral proportion. (D) Phylogenetic tree of 173 accessions based on whole-genome SNPs. The scale bar at the bottom represents genetic distance. Accessions within different subgroups are displayed by different colors. (E) Principal component analysis showing the population structure in the diversity panel. The red lines indicate Indica accessions. The blue lines indicate Japonica accessions.
Identification of QTLs for heat tolerance-related traits by GWAS
Based on the 1,224,254 SNP, we performed a GWAS to investigate the possible natural variation in heat tolerance of rice and constructed the Manhattan plots to illustrate the significant SNPs related to rice heat tolerance. When >3 SNPs exceeded the significance threshold value of 1 × 10⁻⁴, we considered the 200 kb interval of the leading SNP as a QTL. For the SFn trait, a total of six QTLs were detected, which were located on chromosomes 2, 5, 6, 7, 10 and 12 (Figures 3A,B). There were 39 significant SNPs in the qSFn7 region. The phenotypic variation explained (PVE) ranged from 10.57 to 12.68%. For the SFht trait, we identified two QTLs located on chromosomes 5 and 7 (Figures 3C,D) with PVEs of 12.30 and 11.44%, respectively. For RSF, a total of five QTLs were identified, which were located on chromosomes 1, 2, 9 and 10 (Figures 3E,F). The PVE ranged from 8.93 to 13.52%. Among them, the largest number of significant SNPs (19) existed in the qRSF9.2 region on chromosome 9, which was considered a major QTL for relative spikelet fertility. Next, we focused our investigation on qRSF9.2.
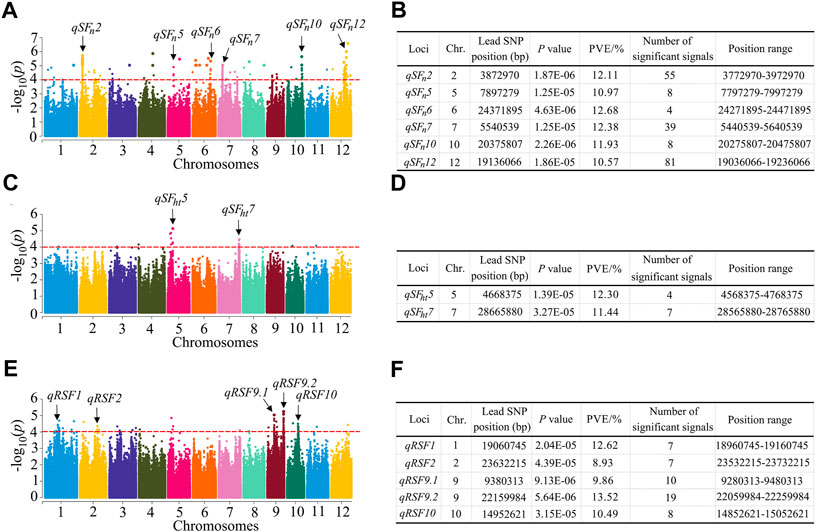
FIGURE 3. Identification of QTLs by GWAS in rice. (A) Manhattan plots for SFn in the whole population of rice accessions. (B) Information of the identified QTL for SFn. (C) Manhattan plots for SFht in the whole population of rice accessions. (D) Information of the identified QTL for SFht. (E) Manhattan plots for RSF in the whole population of rice accessions. (F) Information of the identified QTL for RSF. Y axis means negative log10 transformed p-values and dots above the red line show the significant SNPs in the QTL region. The black arrows indicate the QTL identified. SFn, spikelet fertility in normal condition; SFht, spikelet fertility in high temperature condition; RSF, relative spikelet fertility. PVE: phenotypic variation explained.
Identification of candidate genes
To further analyze the candidate genes in the chromosome region containing qRSF9.2, all potential candidates within 200 kb were analyzed (Figure 4A). A total of 38 positional candidate genes were identified for qRSF9.2. Combining the LD analysis, we determined the LD block region as 22, 110, 508–22, 187, and 677 bp, which contained 16 candidate genes (Figure 4B). Based on SNP information, 6 of the 16 genes contained nonsynonymous SNPs (Supplementary Tables S3, S4). However, only one nonsynonymous SNP was significantly associated with RSF by GWAS (Supplementary Table S3), which was located within the gene locus LOC_Os09g38500. The full length of LOC_Os09g38500 is 2,936 bp, which includes three exons and three introns (Figure 4C). Gene LOC_Os09g38500 encodes a 224 amino acid protein. The SNP polymorphisms occurred in the 3′-primer UTR, the intron, and the coding sequence of the gene. This resulted in the identification of three haplotypes (Figure 4C). The haplotype Hap 1 was associated with a smaller RSF, while haplotypes Hap 2 and Hap 3 were associated with a larger RSF (Figure 4D). The SNP site (22,154,863) causes a change from base C to base T at nt 170 in the cDNA sequence, which results in an amino acid change from arginine (A) to lysine (L) at amino acid 57. The average RSF values of 110 accessions carrying the TT allele was 33.2 ± 12.7%, while those with the CC allele had an RSF of 42.3 ± 11.1%. There were highly significant differences between the TT allele and CC allele at p < 0.01 (Figure 4E).
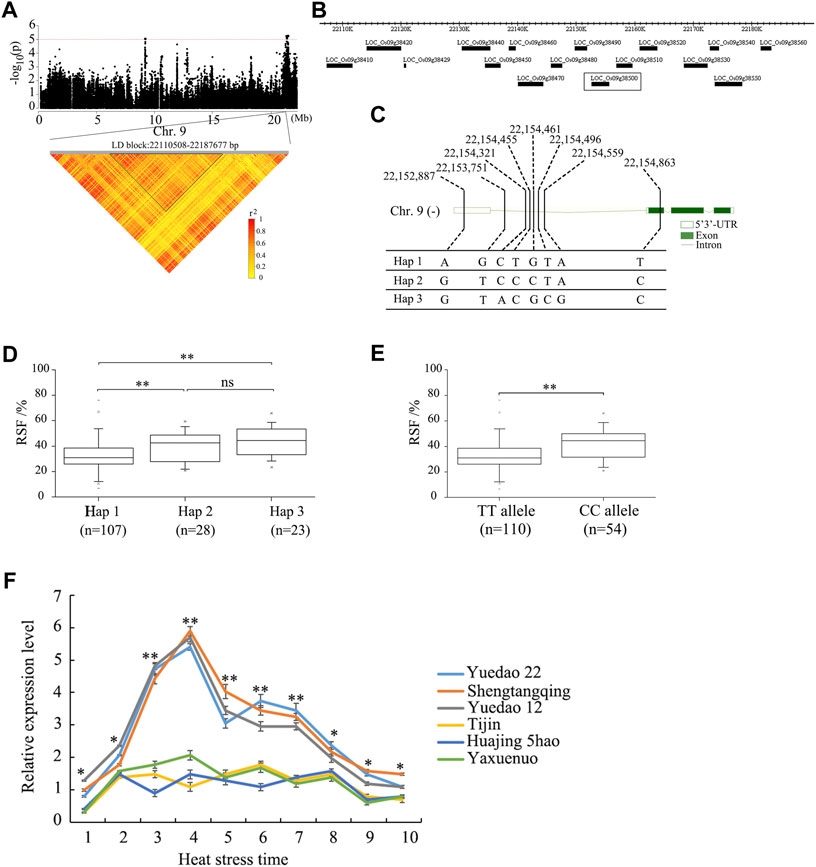
FIGURE 4. Identification of the candidate genes for the QTL qRSF9.2 for relative spikelet fertility as determined by integrated analyses of GWAS and gene expression data in rice. (A) Identification of the haplotype block of qRSF9.2. Y axis means negative log10 transformed p-values and dots above the red line show the significant SNPs in the QTL region. Pairwise LD was determined by calculation of r2 (the square of the correlation coefficient between SNP states). (B) Identification of candidate genes in the region of qRSF9.2. (C) Haplotypes of LOC_Os09g38500 associated with relative spikelet fertility in rice. (D, E) Box-plots of relative spikelet fertility in accessions containing the different haplotypes (D) and elite alleles (E). (F) Expression analysis of candidate gene LOC_Os09g38500 in different materials under heat stress for various time periods. The relative expression values were normalized to the rice UBQ gene. The error bars indicate standard deviation, and asterisks indicate significant differences using the Student’s t-test (*p < 0.05, **p < 0.01). Numbers 1-10 on X axis indicate the sampling time at 08:30 a.m., 09:30 a.m., 10:30 a.m., 11:30 a.m., 12:30 p.m., 13:30 p.m., 14:30 p.m., 15:30 p.m., 16:30 p.m., and 17:30 p.m.
The relative expression levels of 16 candidate genes in the panicle between three accessions each with high or low RSF were analyzed under different durations of heat stresses through qRT-PCR. The qRT-PCR results showed no significant expression difference among 16 candidate genes except gene LOC_Os09g38500 (Figure 4F, Supplementary Figure S2). The expression of the CC allele in each of the three accessions (Yuedao 22, Shengtangqing, and Yuedao12) with large RSFs was significantly higher than that of the TT allele in each of the three accessions (Tijin, Huajing 5hao, and Yaxuenuo) with small RSFs (Figure 4F). The expression of LOC_Os09g38500 in high-RSF accessions was significantly higher (p < 0.01) than that in low-RSF accessions at heat stress times ranging from 10:30 a.m. to 14:30 p.m. The expression of LOC_Os09g38500 in the accessions with high RSF was higher (p < 0.05) than that in accessions with low RSF at a heat stress time ranging from 08:30 a.m. to 09:30 a.m. and from 15:30 p.m. to 17:30 p.m. (Figure 4F). The expression of LOC_Os09g38500 in the accessions with large RSF showed gradual increases at heat stress timed from 08:30 a.m. to 11:30 a.m., reaching a maximum at 11:30 a.m. After 12:30 p.m., the expression of LOC_Os09g38500 started to gradually decline (Figure 4F). These results suggest that enhanced expression of the CC allele may increase RSF.
Discussion
Presently, natural high temperatures in the field and artificial climate simulation methods are generally used to identify the heat tolerance of rice varieties. However, artificial climate chambers are more advantageous to the selection of heat-resistant rice varieties because of their environmental controllability. Kumar et al. (2016) evaluated the heat tolerance of the same rice materials in the field and under climate chamber conditions and found that the SF at high temperature field conditions was higher than that at high temperature conditions in a climate chamber. This difference may be caused by factors such as humidity, wind speed, and light intensity (Pan et al., 2015).
In this study, to improve the accuracy of identifying heat tolerance, we sowed 173 accessions in stages and marked the panicles under the heat temperature at the flowering stage. The heat tolerance of 173 rice cultivars were evaluated based on the SF of marked panicles. Although field identification is affected by climate change, it is more suitable for rice production and breeding practice and can accurately reflect the heat tolerance of rice (Zhao et al., 2016). In this study, the rice canopy temperature in the field was approximately 40 °C. The SF of different materials at high temperature was obviously different, but the average SF was 64%, which is much higher than that observed at 38 °C in a greenhouse by Lafarge et al. (2017). We found three materials (Yuedao 12, Yuedao 22, and Shengtangqing) with the same heat tolerance as Fengliangyou 4hao. Among them, Yuedao 12 and Yuedao 22 belong to breeding varieties. These varieties were suitable for planting in high temperature-prone areas to reduce the yield loss. Shengtangqing belongs to Taihu Valley local varieties. After a long-term adaptive evolution, these local varieties have rich genetic diversity and strong stress tolerance. Therefore, these materials can be used as donor parents for the future genetic improvement of heat tolerance.
We detected six QTLs for SFn, two for SFht and five for RSF (Figure 3). We then compared them with the previously reported QTLs through the Gramene website (http://www.gramene.org/markers/), BLAST (http://blast.ncbi.nlm.nih.gov/Blast.cgi), and the China Rice Data Center database (http://www.ricedata.cn/gene/list/1499.htm). The position range of one QTL, qSFn5 for SFn, overlapped with the flanking region previously reported (Li et al., 2018) (Supplementary Table S5), and the remaining five QTLs were newly identified in this study. The position range of one QTL, qSFht7 for SFht, overlapped with a previously reported flanking region (Ye et al., 2012) (Supplementary Table S5), and the remaining one, QTL qSFht5, was newly identified in this study. The position range of four QTLs for RSF overlapped with the flanking regions of three QTLs and one previously reported gene (OsHTAs) (Jagadish et al., 2010; Ye et al., 2012; Liu et al., 2016; Li et al., 2018) (Supplementary Table S5), and the remaining QTL, qRSF2, was newly identified in this study. In conclusion, these results indirectly demonstrate the reliability of our GWAS results.
The qRT-PCR results showed that only gene, LOC_Os09g38500, had a significant expression difference among 16 candidate genes (Figure 4F, Supplementary Figure S2). The expression of LOC_Os09g38500 in the accessions with large RSF showed a tendency of increasing first (at a heat stress time from 08:30 a.m. to 11:30 a.m.) and then decreasing (at a heat stress time from 12:30 p.m. to 17:30 p.m.). These results again confirmed that heat tolerance in rice is a stress response adaptation for temperature change during the long period of domestication. Before the heat of day arrives, the heat-resistant rice have already adjusted accordingly.
In this study, gene LOC_Os09g38500 was identified as a new candidate gene by GWAS and qRT-PCR. The full length of gene LOC_Os09g38500 is 2,936 bp including three exons and three introns. Gene LOC_Os09g38500 encodes a mitochondrial glycoprotein (Supplementary Table S4). We speculated that this protein could protect the mitochondrial membrane system from damage at high temperatures and thereby maintain the plant’s energy needs. According to the haplotype classification, the average RSF of Hap 1, Hap 2, and Hap 3 was 32.6, 40.5, and 43.9%, respectively. Hap 2 and Hap 3 can increase heat tolerance by 7.9 and 11.3%, respectively. Therefore, LOC_Os09g38500 has potential application value in improving the molecular breeding of heat tolerance in rice.
Data availability statement
The data presented in the study are deposited in the Sequence Read Archive (SRA), NCBI with the accession code PRJNA554986.
Author contributions
XD, CH, and QH designed the experiments and managed the project. JJ, YL, SS, YZ, CJ, YZ, and DW conducted field planting and phenotypic identification. JJ and YL prepared RNA samples and conducted the qRT-PCR and transformation analysis. XD, CH, and JJ performed the data analysis. XD, CH, and QH wrote the manuscript draft and reviewed the manuscript. All authors reviewed the manuscript.
Funding
This research was supported by the Major Science and Technology Program of Anhui Province, China (202003a06020005 and 2021d06050002), the Talent Program of Anhui Academy of Agricultural Sciences (QNYC-201903 and QNYC-202103), and the Natural Science Foundation of Anhui Province (2108085MC100).
Acknowledgments
We would like to thank the Platform of National Crop Germplasm Resources of China for providing Oryza sativa germplasms.
Conflict of interest
The authors declare that the research was conducted in the absence of any commercial or financial relationships that could be construed as a potential conflict of interest.
Publisher’s Note
All claims expressed in this article are solely those of the authors and do not necessarily represent those of their affiliated organizations, or those of the publisher, the editors, and reviewers. Any product that may be evaluated in this article or claim that may be made by its manufacturer is not guaranteed or endorsed by the publisher.
Supplementary material
The Supplementary Material for this article can be found online at: https://www.frontiersin.org/articles/10.3389/fgene.2022.983525/full#supplementary-material
Abbreviations
ANOVA, analysis of variance; BIL, backcross inbred line; CSSL, chromosome segment substitution line; CV, coefficients of variation; DH, doubled haploid; GWAS, genome-wide association study; HTAS, heat tolerance at seedling stage; LD, linkage disequilibrium; MAF, minimum allele frequency; MLM, mixed linear model; NFS, the number of filled spikelets; PVE, phenotypic variation explained; qRT-PCR, quantitative real-time polymerase chain reaction; QTL, quantitative trait loci; RIL, recombinant inbred line; RSF, relative spikelet fertility; SNP, single nucleotide polymorphism; SF, spikelet fertility; SFn, spikelet fertility in natural condition; SFht, spikelet fertility in high temperature condition; TNS, the total number of spikelets; TOGR1, thermotolerant growth required 1; TT1, thermo-tolerance 1.
References
Asako, K., Bao, G. L., Ye, S. H., and Katsura, T. (2007). Detection of quantitative trait loci for white-back and basal-white kernels under high temperature stress in Japonica rice varieties. Breed. Sci. 57, 107–116. doi:10.1270/jsbbs.57.107
Barrett, J. C., Fry, B., Maller, J., and Daly, M. J. (2005). Haploview: analysis and visualization of LD and haplotype maps. Bioinformatics 21, 263–265. doi:10.1093/bioinformatics/bth457
Benjamini, Y., and Hochberg, Y. (1995). Controlling the false discovery rate: a practical and powerful approach to multiple testing. J. R. Stat. Soc. Ser. B 57, 289–300. doi:10.1111/j.2517-6161.1995.tb02031.x
Bhardwaj, A., Devi, P., Chaudhary, S., Rani, A., Jha, U. C., Kumar, S., et al. (2022). ‘Omics’ approaches in developing combined drought and heat tolerance in food crops. Plant Cell Rep. 41, 699–739. doi:10.1007/s00299-021-02742-0
Bradbury, P. J., Zhang, Z., Kroon, D. E., Casstevens, T. M., Ramdoss, Y., and Buckler, E. S. (2007). TASSEL: software for association mapping of complex traits in diverse samples. Bioinformatics 23, 2633–2635. doi:10.1093/bioinformatics/btm308
Browning, B. L., and Browning, S. R. (2009). A unified approach to genotype imputation and haplotype-phase inference for large data sets of trios and unrelated individuals. Am. J. Hum. Genet. 84, 210–223. doi:10.1016/j.ajhg.2009.01.005
Cao, L. Y., Zhu, J., Zhao, S. T., He, L. B., and Yan, Q. C. (2002). Mapping QTLs for heat tolerance in a DH population from indica-japonica cross of rice (Oryza sativa L). J. Agric. Biotechnol. 10, 210–214. Available at: http://en.cnki.com.cn/Article_en/CJFDTOTAL-NYSB200203002.htm.
Cao, Z. B., Li, Y., Tang, H. W., Zeng, B. H., Tang, X. Y., Long, Q. Z., et al. (2020). Fine mapping of the qHTB1-1QTL, which confers heat tolerance at the booting stage, using an Oryza rufipogon Griff. introgression line. Theor. Appl. Genet. 133, 1161–1175. doi:10.1007/s00122-020-03539-7
Cao, Z. B., Tang, H. W., Cai, Y. H., Zeng, B. H., Zhao, J. L., Tang, X. Y., et al. (2022). Natural variation of HTH5 from wild rice, Oryza rufipogon Griff., is involved in conferring high-temperature tolerance at the heading stage. Plant Biotechnol. J. 20, 1591–1605. doi:10.1111/pbi.13835
Chen, K., Guo, T., Li, X. M., Zhang, Y. M., Yang, Y. B., Ye, W. W., et al. (2019). Translation regulation of plant response to high temperature by a dual-function tRNAHis guanylytransferase in rice. Mol. Plant 12, 1123–1142. doi:10.1016/j.molp.2019.04.012
Chen, L., Wang, Q., Tang, M., Zhang, X., Pan, Y., Yang, X., et al. (2021). QTL mapping and identification of candidate genes for heat tolerance at the flowering stage in rice. Front. Genet. 11, 621871. doi:10.3389/fgene.2020.621871
Chen, Q. Q., Yu, S. B., Li, C. H., and Mu, T. M. (2008). Identification of QTLs for heat tolerance at flowering stage in rice. Sci. Agric. Sin. 41, 315–321. doi:10.3864/j.issn.0578-1752.2008.02.001
Cheng, L. R., Wang, J. M., Uzokwe, V., Meng, L. J., Wang, Y., Sun, Y., et al. (2012). Genetic analysis of cold tolerance at seedling stage and heat tolerance at anthesis in rice (Oryza sativa L.). J. Integr. Agric. 11, 359–367. doi:10.1016/S2095-3119(12)60020-3
Dang, X. J., Yang, Y., Zhang, Y. Q., Chen, X. G., Fan, Z. L., Liu, Q. M., et al. (2020). OsSYL2AA, an allele identified by gene-based association, increases style length in rice (Oryza sativa L.). Plant J. 104, 1491–1503. doi:10.1111/tpj.15013
Earl, D. A., and vonHoldt, B. M. (2012). STRUCTURE HARVESTER: a website and program for visualizing STRUCTURE output and implementing the evanno method. Conserv. Genet. Resour. 4, 359–361. doi:10.1007/s12686-011-9548-7
Felsenstein, J. (1993). PHYLIP (phylogeny inference package) version 3.52. Seattle (WA): Department of Genome Sciences, University of Washington. Available at: http://evolution.gs.washington.edu/phylip/oldversion.html.
Gourdji, S. M., Sibley, A. M., and Lobell, D. B. (2013). Global crop exposure to critical high temperatures in the reproductive period: Historical trends and future projections. Environ. Res. Lett. 8, 024041. doi:10.1088/1748-9326/8/2/024041
Ishimaru, T., Hirabayashi, H., Ida, M., Takai, T., Kondo, M., Yoshinaga, S., et al. (2010). A genetic resource for early-morning flowering trait of wild rice Oryza officinalis to mitigate high temperature-induced spikelet sterility at anthesis. Ann. Bot. 106, 515–520. doi:10.1093/aob/mcq124
Jagadish, S. V. K., Cairns, J., Lafifitte, R., Wheeler, T. R., Price, A. H., and Craufurd, P. Q. (2010). Genetic analysis of heat tolerance at anthesis in rice. Crop Sci. 50, 1633–1641. doi:10.2135/cropsci2009.09.0516
Jakobsson, M., and Rosenberg, N. A. (2007). CLUMPP: a cluster matching and permutation program for dealing with label switching and multimodality in analysis of population structure. Bioinformatics 23, 1801–1806. doi:10.1093/bioinformatics/btm233
Kilasi, N. L., Singh, J., Vallejos, C. E., Ye, C. R., Jagadish, K. S. V., Kusolwa, P., et al. (2018). Heat stress tolerance in rice (Oryza sativa L.): identification of quantitative trait loci and candidate genes for seedling growth under heat stress. Front. Plant Sci. 9, 1578–1611. doi:10.3389/fpls.2018.01578
Kumar, P. S., Ranjan, B. S., Ambika, S., Sudipti, M., Kumar, N. D., Anumalla, M., et al. (2016). Population structure, genetic diversity and molecular marker-trait association analysis for high temperature stress tolerance in rice. PLoS ONE 11, e0160027. doi:10.1371/journal.pone.0160027
Lafarge, T., Bueno, C., Frouin, J., Jacquin, L., Courtois, B., and Ahmadi, N. (2017). Genome-wide association analysis for heat tolerance at flowering detected a large set of genes involved in adaptation to thermal and other stresses. PLoS ONE 12, e0171254. doi:10.1371/journal.pone.0171254
Li, H., and Durbin, R. (2010). Fast and accurate long-read alignment with Burrows-Wheeler transform. Bioinformatics 26, 589–595. doi:10.1093/bioinformatics/btp698
Li, M. M., Li, X., Yu, L. Q., Wu, J. W., Li, H., Liu, J., et al. (2018). Identification of QTLs associated with heat tolerance at the heading and flowering stage in rice (Oryza sativa L.). Euphytica 214, 70–80. doi:10.1007/s10681-018-2136-0
Li, X. M., Chao, D. Y., Wu, Y., Huang, X. H., Chen, K., Cui, L. G., et al. (2015). Natural alleles of a proteasome α2 subunit gene contribute to thermotolerance and adaptation of African rice. Nat. Genet. 47, 827–833. doi:10.1038/ng.3305
Lipka, A. E., Tian, F., Wang, Q. S., Peiffer, J., Li, E., Bradbury, P. J., et al. (2012). GAPIT: genome association and prediction integrated tool. Bioinformatics 28, 2397–2399. doi:10.1093/bioinformatics/bts444
Liu, J. P., Zhang, C. C., Wei, C. C., Liu, X., Wang, M. G., Yu, F. F., et al. (2016). The ring finger ubiquitin E3 ligase OsHTAS enhances heat tolerance by promoting H2O2-induced stomatal closure in rice. Plant Physiol. 170, 429–443. doi:10.1104/pp.15.00879
Livak, K. J., and Schmittgen, T. D. (2001). Analysis of relative gene expression data using real-time quantitative PCR and the 2-ΔΔCt method. Methods 25, 402–408. doi:10.1006/meth.2001.1262
Nei, M., Tajima, F. A., and Tateno, Y. (1983). Accuracy of estimated phylogenetic trees from molecular data. II. Gene frequency data. J. Mol. Evol. 19, 153–170. doi:10.1007/BF02300753
Nubankoh, P., Wanchana, S., Saensuk, C., Ruanjaichon, V., Cheabu, S., Vanavichit, A., et al. (2020). QTL-seq reveals genomic regions associated with spikelet fertility in response to a high temperature in rice (Oryza sativa L.). Plant Cell Rep. 39, 149–162. doi:10.1007/s00299-019-02477-z
Pan, X. W., Li, X. X., Li, Y. C., Yao, Y., Liu, W. Q., and Sheng, X. N. (2015). Advance on molecular and genetic mechanisms of rice heat tolerance at the reproductive stage. Biotechnol. Bull. 31, 40–46. doi:10.13560/j.cnki.biotech.bull.1985.2015.03.001
Pan, X. W., Li, Y. C., Liu, W. Q., Xiong, H. B., Dong, Z., Sheng, X. N., et al. (2021). Genome wide association study of heat tolerance at the anthesis stage in rice. J. Plant Genet. Resour. 22, 407–415. doi:10.13430/j.cnki.jpgr.20200719001
Pan, Y. H., Liang, H. F., Gao, L. J., Dai, G. X., Chen, W. W., Yang, X. H., et al. (2020). Transcriptomic profiling of germinating seeds under cold stress and characterization of the cold-tolerant gene LTG5 in rice. BMC Plant Biol. 20, 371. doi:10.1186/s12870-020-02569-z
Price, A., Patterson, N., Plenge, R., Weinblatt, M., Shadick, N., and Reich, D. (2006). Principal components analysis corrects for stratification in genome-wide association studies. Nat. Genet. 38, 904–909. doi:10.1038/ng1847
Pritchard, J. K., Stephens, M., Rosenberg, N. A., and Donnelly, P. (2000). Association mapping in structured populations. Am. J. Hum. Genet. 67, 170–181. doi:10.1086/302959
Rosenberg, N. (2004). Distruct: a program for the graphical display of population structure. Mol. Ecol. Notes 4, 137–138. doi:10.1046/j.1471-8286.2003.00566.x
Shanmugavadivel, P. S., Amitha Mithra, S. V., Chandra, P., Ramkumar, M. K., Ratan, T., Trilochan, M., et al. (2017). High resolution mapping of QTLs for heat tolerance in rice using a 5K SNP array. Rice 10, 28–11. doi:10.1186/s12284-017-0167-0
Shi, W., Li, X., Schmidt, R. C., Struik, P. C., Yin, X., and Jagadish, S. V. K. (2018). Pollen germination and in vivo fertilization in response to high-temperature during flowering in hybrid and inbred rice. Plant Cell Environ. 41, 1287–1297. doi:10.1111/pce.13146
Shin, J. H., Blay, S., McNeney, B., and Graham, J. (2006). LDheatmap: an R function for graphical display of pairwise linkage disequilibria between single nucleotide polymorphisms. J. Stat. Softw. 16, 1–10. doi:10.18637/jss.v016.c03
Tabata, M., Hirabayashi, H., Takeuchi, Y., Ando, I., Iida, Y., and Ohsawa, R. (2007). Mapping of quantitative trait loci for the occurrence of white-back kernels associated with high temperatures during the ripening period of rice (Oryza sativa L.). Breed. Sci. 57, 47–52. doi:10.1270/jsbbs.57.47
Tamura, K., Peterson, D., Peterson, N., Stecher, G., Nei, M., and Kumar, S. (2011). MEGA5: molecular evolutionary genetics analysis using maximum likelihood, evolutionary distance, and maximum parsimony methods. Mol. Biol. Evol. 28, 2731–2739. doi:10.1093/molbev/msr121
Tazib, T., Kobayashi, Y., Koyama, H., and Matsui, T. (2015). QTL analyses for anther length and dehiscence at flowering as traits for the tolerance of extreme temperatures in rice (Oryza sativa L.). Euphytica 203, 629–642. doi:10.1007/s10681-014-1291-1
Turner, S. D. (2014). qqman: an R package for visualizing GWAS results using QQ and Manhattan plots. BioRxiv. doi:10.1101/005165
Wada, T., Miyahara, K., Sonoda, J. Y., Tsukaguchi, T., Miyazaki, M., Tsubone, M., et al. (2015). Detection of QTLs for white-back and basal-white grains caused by high temperature during ripening period in japonica rice. Breed. Sci. 65, 216–225. doi:10.1270/jsbbs.65.216
Wang, D., Qin, B. X., Li, X., Tang, D., Zhang, Y. E., Cheng, Z. K., et al. (2016). Nucleolar DEAD-box RNA helicase TOGR1 regulates thermotolerant growth as a pre-rRNA chaperone in rice. PLoS Genet. 12, e1005844. doi:10.1371/journal.pgen.1005844
Xiao, Y. H., Pan, Y., Luo, L. H., Zhang, G. L., Deng, H. B., Dai, L. Y., et al. (2011). Quantitative trait loci associated with seed set under high temperature stress at the flowering stage in rice (Oryza sativa L.). Euphytica 178, 331–338. doi:10.1007/s10681-010-0300-2
Yang, W., Guo, Z., Huang, C., Duan, L., Chen, G., Jiang, N., et al. (2014). Combining high-throughput phenotyping and genome-wide association studies to reveal natural genetic variation in rice. Nat. Commun. 5, 5087. doi:10.1038/ncomms6087
Ye, C., Ishimaru, T., Lambio, L., Li, L., Long, Y., He, Z. Z., et al. (2022). Marker-assisted pyramiding of QTLs for heat tolerance and escape upgrades heat resilience in rice (Oryza sativa L.). Theor. Appl. Genet. 135, 1345–1354. doi:10.1007/s00122-022-04035-w
Ye, C. R., Argayoso, M. A., Redoña, E. D., Sierra, S. L., Laza, M. A., Dilla, C. J., et al. (2012). Mapping QTL for heat tolerance at flowering stage in rice using SNP markers. Plant Breed. 131, 33–41. doi:10.1111/j.1439-0523.2011.01924.x
Ye, C. R., Tenorio, F. A., Argayoso, M. A., Laza, M. A., Koh, H. J., Redoña, E. D., et al. (2015a). Identifying and confirming quantitative trait loci associated with heat tolerance at flowering stage in different rice populations. BMC Genet. 16, 41–50. doi:10.1186/s12863-015-0199-7
Ye, C. R., Tenorio, F. A., Redoña, E. D., Morales-Cortezano, P. S., Cabrega, G. A., Jagadish, K. S. V., et al. (2015b). Fine-mapping and validating QHTSF41 to increase spikelet fertility under heat stress at flowering in rice. Theor. Appl. Genet. 128, 1507–1517. doi:10.1007/s00122-015-2526-9
Zhang, D., Wang, W., and Zhang, W. (2020). Study on identification technology of rice heat tolerance in Jianghuai Region. J. Anhui Agric. Sci. 48, 20–22. doi:10.3969/j.issn.0517-6611.2020.12.006
Zhao, C., Liu, B., Piao, S., Wang, X. H., Lobell, D. B., Huang, Y., et al. (2017). Temperature increase reduces global yields of major crops in four independent estimates. Proc. Natl. Acad. Sci. U. S. A. 114, 9326–9331. doi:10.1073/pnas.1701762114
Zhao, L., Lei, J. G., Huang, Y. J., Zhu, S., Chen, H. P., Huang, R. L., et al. (2016). Mapping quantitative trait loci for heat tolerance at anthesis in rice using chromosomal segment substitution lines. Breed. Sci. 66, 358–366. doi:10.1270/jsbbs.15084
Zheng, J., Li, X. X., Su, H. Y., Zhou, J. J., Qin, X. J., Nan, W. B., et al. (2017). Construction of a genetic linkage map and QTL location for heat tolerance in Japonica rice resources Rejing35. J. Nucl. Agric. Sci. 31, 844–851. Available at: http://en.cnki.com.cn/Article_en/CJFDTOTAL-HNXB201705003.htm.
Zhu, C. L., Jiang, L., Zhang, W. W., Wang, C. M., Zhai, H. Q., and Wan, J. M. (2006). Identifying QTLs for thermo-tolerance of amylose content and gel consistency in rice. Chin. J. Rice Sci. 20, 248–252. doi:10.16819/j.1001-7216.2006.03.004
Keywords: anthesis, heat tolerance, genome-wide association study, qRSF9.2, high and stable yield
Citation: Hu C, Jiang J, Li Y, Song S, Zou Y, Jing C, Zhang Y, Wang D, He Q and Dang X (2022) QTL mapping and identification of candidate genes using a genome-wide association study for heat tolerance at anthesis in rice (Oryza sativa L.). Front. Genet. 13:983525. doi: 10.3389/fgene.2022.983525
Received: 01 July 2022; Accepted: 16 August 2022;
Published: 15 September 2022.
Edited by:
Ahmed Sallam, Assiut University, EgyptReviewed by:
Uday Chand Jha, Indian Institute of Pulses Research (ICAR), IndiaRakesh Singh, National Bureau of Plant Genetic Resources (ICAR), India
Copyright © 2022 Hu, Jiang, Li, Song, Zou, Jing, Zhang, Wang, He and Dang. This is an open-access article distributed under the terms of the Creative Commons Attribution License (CC BY). The use, distribution or reproduction in other forums is permitted, provided the original author(s) and the copyright owner(s) are credited and that the original publication in this journal is cited, in accordance with accepted academic practice. No use, distribution or reproduction is permitted which does not comply with these terms.
*Correspondence: Qiang He, heqiang@hhrrc.ac.cn; Xiaojing Dang, dangxj@aaas.org.cn
†These authors have contributed equally to this work