 Fatima Valdes-Mora1,2*
 Kristina Handler3
 Andrew M. K. Law3
 Robert Salomon4Samantha R. Oakes2,3Christopher J. Ormandy2,3
 David Gallego-Ortega2,3*
- 1Genomics and Epigenetics Division, Garvan Institute of Medical Research, Darlinghurst, NSW, Australia
- 2St. Vincent's Clinical School, Faculty of Medicine, University of New South Wales, Sydney, NSW, Australia
- 3The Kinghorn Cancer Centre, Garvan Institute of Medical Research, Darlinghurst, NSW, Australia
- 4Garvan-Weizmann Centre for Cellular Genomics, Garvan Institute of Medical Research, Darlinghurst, NSW, Australia
Cancer is a heterogeneous and complex disease. Tumors are formed by cancer cells and a myriad of non-cancerous cell types that together with the extracellular matrix form the tumor microenvironment. These cancer-associated cells and components contribute to shape the progression of cancer and are deeply involved in patient outcome. The immune system is an essential part of the tumor microenvironment, and induction of cancer immunotolerance is a necessary step involved in tumor formation and growth. Immune mechanisms are intimately associated with cancer progression, invasion, and metastasis; as well as to tumor dormancy and modulation of sensitivity to drug therapy. Transcriptome analyses have been extensively used to understand the heterogeneity of tumors, classifying tumors into molecular subtypes and establishing signatures that predict response to therapy and patient outcomes. However, the classification of the tumor cell diversity and specially the identification of rare populations has been limited in these transcriptomic analyses of bulk tumor cell populations. Massively-parallel single-cell RNAseq analysis has emerged as a powerful method to unravel heterogeneity and to study rare cell populations in cancer, through unsupervised sampling and modeling of transcriptional states in single cells. In this context, the study of the role of the immune system in cancer would benefit from single cell approaches, as it will enable the characterization and/or discovery of the cell types and pathways involved in cancer immunotolerance otherwise missed in bulk transcriptomic information. Thus, the analysis of gene expression patterns at single cell resolution holds the potential to provide key information to develop precise and personalized cancer treatment including immunotherapy. This review is focused on the latest single-cell RNAseq methodologies able to agnostically study thousands of tumor cells as well as targeted single-cell RNAseq to study rare populations within tumors. In particular, we will discuss methods to study the immune system in cancer. We will also discuss the current challenges to the study of cancer at the single cell level and the potential solutions to the current approaches.
Introduction
In the last few years the use of single cell transcriptomics for the understanding of complex biological systems has boomed, producing remarkable insights in the fields of immunology, neurobiology, or cancer biology (1–3). Because of the outstanding prospective to reveal new cell types and states, the analysis of gene expression profiles at the single cell resolution has an exceptional potential to understand the complex interconnections that occur in the tumor microenvironment. In this review, we take a journey on the study of tumor immunobiology one cell at the time, discussing different approaches, technologies and providing a glimpse of the achievements that single-cell RNAseq will bring in the near future.
Cancer Heterogeneity and the Immune System
Tumor Microenvironment
The majority of solid tumors have an epithelial origin but tumors are not exclusively formed by epithelial cancer cells, they consist of a complex and heterogeneous conglomerate of multiple cell types from different origins, which can be divided into two groups: cancer cells transformed from the epithelium of the tissue of origin; and stromal cells, comprised of seemingly normal tissues including fibroblasts, adipocytes, endothelial, and immune cells (Figure 1). This later group, together with the extracellular matrix, forms the tumor microenvironment (TME). TME is comprised of highly diverse cell types that have clearly contributed to the hallmarks of cancer (4, 5). The stromal cells can be classified into: infiltrating immune cells (IICs), endothelial vascular cells, and cancer-associated fibroblasts (CAFs). These stromal cells within the TME contribute to seven out of the eight acquired hallmarks of cancer: (1) the evasion of growth suppressors; (2) sustaining proliferative signaling; (3) the resistance to cell death; (4) reprogramming energy cellular metabolism; (5) the initiation of angiogenesis; (6) the evasion of the immune destruction; and (7) the induction of invasion and metastasis (4).
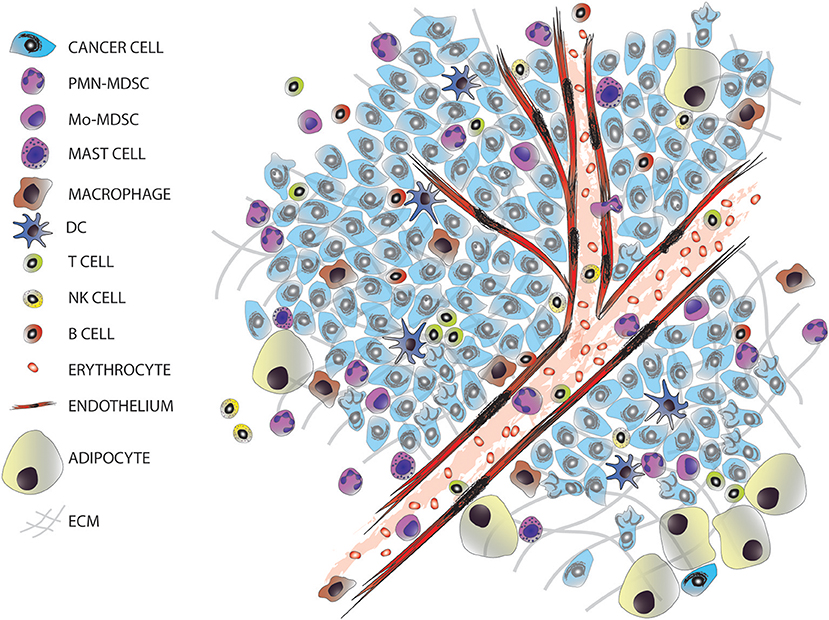
Figure 1. The tumor microenvironment. Tumors are entities formed by different cell types, including many infiltrated cells from the innate and adaptive immune system.
The Role of the Immune System in Cancer
Major Mechanisms of Action of the Immune System in Cancer
A common feature of all cancers, regardless of its origin, is the presence of different clusters of immune cells (6) (Figure 1). Due to the intense heterogeneity of the IICs these cells are able to influence on the fate of cancer cells in many different and contrasting ways (Figure 2 and Table 1). For example, in general many tumor types with extensive infiltration of pro-inflammatory immune cells and CD8+ T lymphocytes have better prognosis and, in contrast, tumors with high presence of immunosuppressive IICs like regulatory T lymphocytes or myeloid-derived suppressor cells show worse outcomes [reviewed in Barnes et al. (54)]. Research has focused on trying to unravel how the different subtypes of IICs are selected or recruited to tumors to explain this dichotomy [reviewed Palucka and Coussens (55)]. These studies have come to the conclusion that it is the specific intercommunication among cancer cells, the TME and immune cells that determines the balance toward immunotolerance or immunerejection. In fact, these interactions are a dynamic “yin-yang” process, where the immune system is able to recognize cancer cells as “foreign” to suppress the progression of cancer; while a sustained anti-tumor immune response will trigger mechanisms designed to prevent tissue damage and to maintain tissue homeostasis by inhibiting natural killer (NK) cells and effector T cells. This ultimately produces the suppression of the immune system that subsequently allows the cancer to escape the immune control, bypass apoptotic pathways and maintain inflammation and angiogenesis (56).
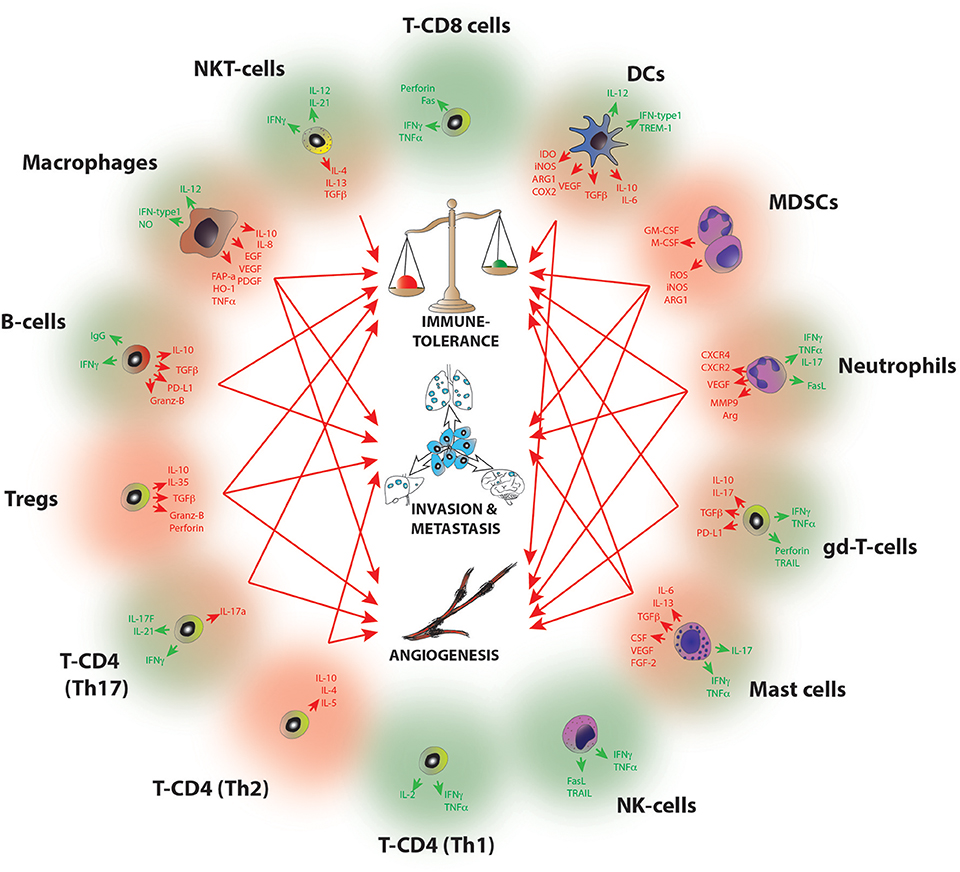
Figure 2. Molecular pathways of tumor progression driven by IICs. Diagram summarizing the main pro-tumorigenic (red) and anti-tumorigenic (green) mechanisms exerted by infiltrated immune cell species. Red arrows indicate the hallmarks of cancer progression where each cell has been implicated, B-cells (I, M); Mast cells (I,A,M); Macrophages (I,A,M); Dendritic cells (I,A); MDSCs (I, A, M); Neutrophils (I, A,M); NKT (I); gd-T cells (I, A); Th2 T-CD4 (A,M); Th17 T-CD4 (I,A); Tregs (I,A,M). I, Immune tolerance; A, Angiogenesis; M, Metastasis. For a full reference please see Table 1.
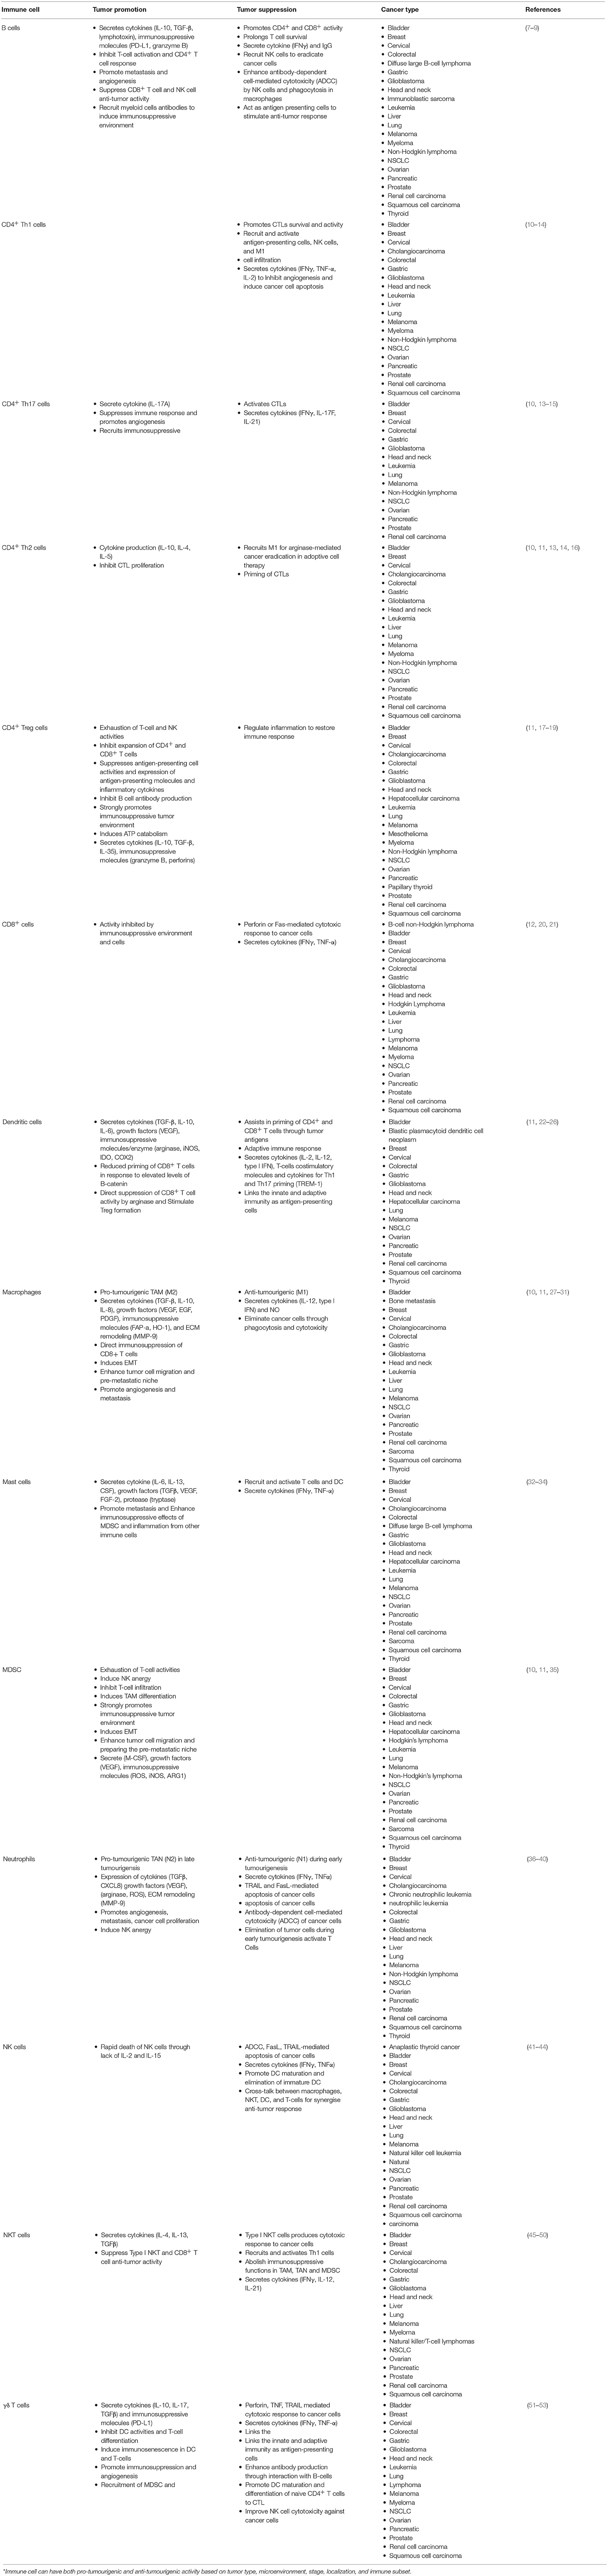
Table 1. Pro-tumourigenic and anti-tumourigenic functions of immune cells*.
Multiple pathways of immunesuppression take place in the TME (Table 1), and they involve different immune cell subtypes including but not restricted to Th2-polarized macrophages, myeloid-derived suppressor cells (MDSCs) and regulatory T cells (Tregs) (Figures 1, 2). TME and cancer cells are responsible for producing chemokines and signaling pathways to block the effector function of T cells (e.g., checkpoints that control cytotoxic T-cell differentiation and function) and to attract immunosuppressive immune cells to the tumor. For example, intratumoural C-C motif chemokine 22 (CCL22) is induced in tumor-infiltrating dendritic cells through interleukin-1 alpha (IL-1α) secreted by cancer cells; the accumulation of CCL22 induces the recruitment of regulatory T cells through the expression of CC chemokine receptor 4 (CCR4) and these tumor-infiltrating Tregs suppress local effector T cell responses (57).
As mentioned above, IICs are indirectly involved in seven out of eight acquired cancer hallmark capabilities (55), but also they drive two major “direct” pro-oncogenic mechanisms that lead to tumor progression: chronic inflammation and immune tolerance.
Chronic inflammation network
The onset of inflammation and its duration is a critical feature in the balance between immune rejection and immune tolerance. In fact, inflammation is a hallmark of cancer where immune cells have either pro- or anti-tumor properties (5). In this context, there are contrasting findings regarding the impact of the immune system in inflammation, for example, it has been shown that chronic inflammation is a risk factor for cancer development (58) but on the other hand treatment with bacterial mixtures that induce acute inflammation led to tumor regression in sarcomas (59). These paradoxical properties of leukocytes are due in part to their functional plasticity and this makes them an attractive cancer therapeutic target (6). Cancer-associated inflammation encompasses a broad spectrum of immune cells (both myeloid and lymphoid) and soluble factors (Figure 2), such interacting networks will be discussed below in a cell-subtype basis.
The immunosuppressive tumor network
Tumors have developed mechanisms to create an immunosuppressive environment enriched for soluble mediators, receptors and cells. In fact, TME contains high leukocytic infiltrations that present immunosuppressive activities similar to the wound-healing stage: they are able to block CTLs, in the case of cancer anti-tumor CTLs; or inhibit Natural Killer T (NKT) cells that in the neoplastic context mediate the elimination of cancer cells. These immunosuppresive IICs comprise Tregs, MDSCs, tumor-associated macrophages (TAMs, programmed by Th2-type cytokines), tolerogenic dendritic cells (DCs), regulatory B cells and mast cells (60). Thus, despite the intense presence of tumor-infiltrating T cells (TIL) in many cancers, often their cytotoxic activity is impaired by the presence of these immunosuppressive IICs and in turn these TILs are not able to successfully attack cancer cells.
Immune Cell Subtypes With Pro-tumoral Characteristics
Here, we present a summary of the most important myeloid and lymphoid populations responsible of an immune response to cancer and how their physiological processes are exploited by cancer cells to escape immunosurveillance (Figure 2 and Table 1). Consequently, these IICs have become clear candidates for an effective immunotherapy in cancer.
Myeloid compartment (innate response)
Macrophage progenitors can differentiate to become alternatively activated TAMs when exposed to Th2 cytokines (e.g., IL-4, IL-13) and other factors (e.g., thymic stromal lymphopoietin, immune complexes) (10). TAMs are one of the main components of the leukocytic infiltrate in tumors (61), these are usually M2 like macrophages with the capability to promote tumourigenesis. Some of the mechanisms include: (1) the production of growth and survival factors of tumor cells [transforming growth factor beta (TGFβ), epidermal growth factor (EGF), IL-6, etc.]; (2) production of angiogenic factors [vascular endothelial growth factor (VEGF), platelet-derived growth factor (PDGF), IL-8, etc.]; (3) degradation of the extracellular matrix; (4) activation of tissue remodeling; and (5) suppression of adaptive response by the production of immunosuppressive factors [IL-10, prostaglandin E2 (PGE2), etc.], the reduction of immunostimulatory cytokines (IL-12) and releasing chemokines (CCL17, CCL18, etc.) to recruit Tregs (27, 28).
MDSCs represent a heterogeneous population composed of precursors of the myeloid-cell lineage that resemble immature neutrophils. Pro-inflammatory cytokines skew myeloid cell differentiation and perturb their maturation, resulting in a spectrum of immature myeloid cells (IMC) that are morphologically analogous to granulocytes and monocytes (62, 63) but can be distinguished from these cells by their potent immunosuppressive activities (64). MDSC are recruited to the tumor site by growth factors and pro-inflammatory molecules secreted by cancer cells; for example tumor-produced granulocyte-macrophage colony stimulating factor (GM-CSF) recruits and accumulates MDSC in the TME through GM-CSF receptor (65); tumor-produced VEGF is also able to chemoattract MDSC through the expression of VEGF receptor (66); S100A4 and A9 are soluble factors produced by the cancer cells that attract MDSCs through the receptor for advanced glycation end products (RAGE) (67) and, more recently, Blattner and colleagues have shown that melanoma cells are able to recruit C-C chemokine receptor type 5 (CCR5)-positive MDSCs into the TME through the production of its ligands (IL-6, GM-CSF, CCL3/4/5) (68, 69). Once recruited and expanded in the TME, MDSCs are able to induce NK cell and T-cell anergy, angiogenesis, and epithelial-mesenchymal transition (EMT). As immature myeloid precursors, MDSCs are very plastic and can be programmed on site to specific phenotypes and functions by the signals present in the TME (70). MDSCs were originally described as cells that potently suppress both innate and adaptive anti-tumor immunity. MDSCs inhibit T cells (both CD8+ and CD4+) by producing arginase I (ARG I) and reactive oxygen species (ROS) and through the induction of nitric oxide synthase expression (71); but also suppress NK and NKT cells and inhibit DCs maturation (71–73). It is now clear that the contribution of MDSCs to tumourigenesis is not restricted to immune-suppression and includes regulation of tumor growth, progression, the formation of the pre-metastatic niche, and metastasis (74, 75). Tumor activated MDSC infiltrate in normal organs and assist in establishing a premetastatic niche, supporting seeding of metastatic cells by promoting their survival and suppressing immune rejection (76–80). The specific tumor-derived soluble factors that induce MDSC-migration, aberrant activation and expansion are still largely unknown. Clinically, increased circulating MDSC correlated with poor patient prognosis and survival (81–83).
Tumor-infiltrated DCs are defective functional mature DCs that are unable to properly stimulate the immune system as a result of the significantly increased myelopoiesis that takes place in cancer (84). In addition, many soluble factors present in the TME affect DC differentiation and function including VEGF, macrophage colony-stimulating factor (M-CSF), IL-6 and accumulation of adenosine and hypoxia (85). Hypoxia-inducible factor-1 (HIF-1) activates DCs to up-regulate the adenosine receptor, which activates Th2 cells (86, 87). Adenosine-activated DCs express pro-inflammatory IL-6, pro-angiogenic VEGF, and immunosuppressive mediators IL-10, cyclooxygenase 2 (COX2), TGFβ and indoleamine 2,3-dioxygenase (IDO) (22).
Lymphoid compartment (adaptive response)
The mechanisms used by the cells involved in an adaptive response are summarized in Table 1 and Figure 2. In this section we reviewed the most common pro-tumourigenic lymphocytes subtypes found in cancer.
Despite the critical role of T lymphocytes in immune surveillance and control of early tumor growth, later sustained tumor cell and TME secretion of cytokines and other soluble factors with pro-tumourigenic/immunosuppresive capabilities, alter T cell function and recruitment (88–90).
Tregs cells are CD4+ T lymphocytes characterized by the expression of the FoxP3 transcription factor that can also be identified by the expression of CD25 and CD127 in humans. Tumor-derived factors can promote the recruitment and expansion of Tregs. This T cell subtype is able to suppress excessive immune responses to pathogens, a mechanism that is widely adopted by cancer cells (17, 18). Tregs are able to polarize immunity away from an anti-tumor response, block CD8+ T cell activation and NK cell “killing” activity (19). High Treg–CD8 ratios in tumor infiltrates correlate with poor patient survival (91).
NKT cells are a subclass of T cells that express natural killer cell surface markers. Type II NKT cells have been reported to down-regulate tumor immune surveillance and suppress anti-tumor responses. Type II NKT cells are activated by endogenous ligands, such as lysophosphatidylcholines (92), which initiate the production of IL-4, IL-13, and TGF-β. The presence of these factors block CTL and NK cell functions (45, 46, 93). IL-13 secretion, via the IL-4R–STAT6 signaling pathway, can induce production of the pro-tumourogenic and pro-metastatic TGF-β-producing MDSCs (47).
The Use of Immunotherapy in Cancer
The immune system is a key player in both pro-tumor and anti-tumor responses (94). Due to its plasticity, cancer cells have developed mechanisms to skew immune responses toward tumor immune tolerance to create an immunosuppressive environment. Thus, the re-education of the immune system toward tumor rejection is a very promising strategy for cancer therapy (95). An immunotherapy strategy would ideally require a combined stimulation of potent anti-tumor immune response and the eradication or reprogramming of the immunosuppressive environment. In fact, a few immunotherapy approaches have produced very impressive results in some cancer types like lung cancer and melanoma (96). Despite these exciting results, there are still unresponsive patients and tumor types where immunotherapy is not effective (97). Therefore, understanding the role of IICs in different tumor types and patients is currently a field of intense research. Different immunotherapy-based strategies are the focus of the current research, this includes: (1) neutralization of chronic tumor inflammation (6); (2) cancer vaccination to increase T-cell repertoires, both DC-based vaccination (98) and adoptive T-cell transfer (99), which could be dramatically enhanced when combined with strategies to eliminate or differentiate MDSCs (63, 100); (3) To identify inducers of immunogenic cell death (ICD) to re-activate immune rejection through the production of damage-associated molecular patterns (DAMPs) from the stressed or dying cancer cells (101); and, (4) elucidating the mechanisms and cell identity of the IICs that regulate tumor tolerance and cytotoxic T-cell activity (MDSC, T-regs, NKT cells).
Direct and indirect immunotherapeutic strategies that target immunosuppressive cells are now in the clinic. For example, Ipilimumab or Nivolumab are monoclonal antibodies that are being used to target the checkpoint pathway of CTLs [antagonize cytotoxic T-lymphocyte-associated protein 4 (CTLA-4) and Programmed Death 1 (PD-1), respectively] (102). The inhibition B7 family members and/or their ligands (PDL-1 and PDL-2) have a huge potential use in the clinic as they are expressed in many immunosuppressive IICs like Treg cells, MDSCs, tolerogenic DCs, and TILs (103).
Another mechanism of immune activation with a potential use in cancer therapy is ICD. Radiotherapy and some chemotherapeutic agents [e.g., Doxorubicin (104) or Vorinostat (105)] induce ICD in cancer cells. These dying cancer cells release factors and/or express danger molecules so called DAMPs as a consequence of the activation of ROS and endoplasmic reticulum stress pathways. These DAMPs act as adjuvants being able to stimulate anti-tumor immune responses and subsequently to elicit tumor rejection (101). Thus, the identification of specific ICD inducers and the activation pathways within the cancer cells to actively produce DAMPs is also a very active area of research for immune-based cancer therapy.
Altogether a combinatorial therapy to target both cancer cells and cells from the TME or their mediators (including immunotherapy) will constitute a synergistic strategy toward a potent cancer treatment response. Therefore, a complete understanding of the mechanisms and immune cell diversity and their molecular activation status in each patient and tumor type are crucial in order to design personalized and targeted immune-based therapy.
Heterogeneity of IICs
It is evident that a myriad of complex interactions exists between cancer cells and immune cells that are pivotal for both pro-tumourigenic and anti-tumourigenic roles (56, 106, 107) (Figure 2 and Table 1). As such, tumor infiltrated immune cells are highly heterogenous (Figure 1), and this complexity is amplified by the dynamic interactions that can occur among cancer cells, immune cells and the TME. This high heterogeneity explains in part the development of resistance to immunotherapy as the current targets might not fully trigger all the immunesuppresive IICs or potentiate the anti-tumor effect of the right effector T cells.
Bulk transcriptome profiling of IICs has been critical to identify plausible novel targets, to understand their pro/anti-oncogenic function and their association with patient survival (108–110). For instance, both TILs and TAMs are relatively abundant populations in many cancers and as such are amenable for study using conventional transcriptomic analysis techniques. This has probably contributed to the high number of studies addressing the role of these populations in cancer (108–110). For example, a study by De Simone and colleagues analyzed the transcriptome of isolated TILs (Tregs, Th1 and Th17 T cells) from lung and colorectal tumors. They found that TILs are molecularly different from peripheral T cells, suggesting an active re-education by the TME and cancer cells. They also found that a Treg-gene signature correlated with poorer patient outcome in both cancer types (108). Despite the advantages offered by bulk transcriptome analyses, this methodology is not sufficient to uncover the full spectrum of immune diversity within tumors (2) and in turn this has made the development of novel immunotherapies very challenging (97). In addition, the study of underrepresented and/or highly heterogeneous tumor infiltrated immune populations has challenged the conventional bulk transcriptome analyses. Recent research on TILs using single-cell RNAseq (scRNAseq) has shown that this methodology offers superior understanding of cell diversity (111–117). The finding of these studies are further discussed below and clearly demonstrates that scRNAseq is an exceptionally suited technology for the understanding of the contribution of IICs different populations to tumor initiation and progression (2).
Heterogeneity of Low Abundant Populations: The MDSCs Example
MDSCs are a low abundant and highly heterogeneous tumor infiltrated immune population with strong relevance in the cancer progression. In mice, CD11b and Gr-1 surface markers define the MDSC immunosuppressive cell population (118, 119). Gr-1 expression can be then subclassified using the Ly6G and Ly6C epitopes. Thus, CD11b+Ly6G+Ly6Clow MDSCs correspond to polymorphonuclear granulocytes (PMN-MDSC), while CD11b+Ly6GlowLy6C+ MDSCs present monocytic morphology (M-MDSC). Various reports indicate that these two populations might have distinct functions in infectious and autoimmune diseases, graft vs. host disease, and cancer (75, 120); where they display various functions depending on the tumor type, disease stage, factors present in the TME and anatomical location. Despite considerable efforts and progress using marker-based approaches, most of MDSC heterogeneity is not explained by these markers and is not truly compatible with any of the myeloid lineage classification schemes. Thus, the main characteristic to define the identity of MDSCs in cancer is their immunosuppressive capacity (71), however recent studies have demonstrated a ROS-mediated anti-metastatic role of tumor-associated neutrophils in mice bearing 4T1 mammary tumors (121). This new data suggests a possible divergent polarization or differentiation of neutrophils and that organ and tumor-specific myeloid cells have major differences in their molecular phenotypes and CTL suppressive activity. Altogether, these contrasting findings show that the identity of the MDSC subsets in tumors and their molecular mechanism of interaction with the TME, including their pro or anti-tumourigenic role, remain to be discovered. Due to their low abundance and their extensive heterogeneity, single-cell molecular profiling of tumor infiltrated MDSCs is an excellent suited methodology for the understanding of this population.
The Use of Transcriptomics to Study Cancer
Transcriptomic analysis of bulk tumor populations is a very powerful tool to study cancer. In fact, the analysis of 44 drug sensitive predictive algorithm by the National Cancer Institute and the Dialogue on Reverse Engineering Assessment and Methods (NCI-DREAM) project has demonstrated that gene expression profiling is superior on predicting drug sensitivity and its power increases when including multiple independent datasets (122).
The introduction of international cancer consortiums like The Cancer Genome Atlas (TCGA), that contain publicly available information on clinical, pathological transcriptomic, genomic, and methylation data of multiple human tumor types, has resulted in a stellar acceleration of findings (123, 124). This database has enabled the stratification of samples into tumor subtypes; the prediction of patient prognosis, drug-resistance, and response to treatment; and a deeper understanding of tumor biology (125–127). These studies have also shown that “omic” heterogeneity exists within individual tumor types and a comprehensive understanding of such heterogeneity is crucial for cancer treatment (128). Thus, the response rate to targeted therapies increase when a stratification based on the molecular characteristics of the tumors is applied, for example the use of imatinib in chronic myelogenous leukemia (129) or estrogen antagonists for estrogen-receptor-positive breast cancers (130).
Molecular Portraits of Breast Cancer as a Lead Example
Breast cancer is a highly heterogenous disease; as such its subclassification has been under intense research in the last two decades. In the clinic, breast cancer is classified according to the presence of three nuclear receptors: human epidermal growth factor receptor 2 (HER2), estrogen receptor (ER) and progesterone receptor (PgR). The presence of the biomarkers in immunohistochemical analyses classifies breast cancer into 3 different subtypes: ER+, Triple Negative (TNBC), and HER2+ breast cancers. This subclassification determines therapeutic intervention, for example anti-estrogen therapy for ER+ tumors or chemotherapy for the TNBC. However, within each group there are still differential responses to treatment, for example about 1/3 of the ER+ patients will become resistant to anti-estrogen therapy. In 2000, Perou and colleagues published a seminal paper describing a new molecular classification of breast cancer subtypes based on significant differences in their gene expression profiles (131). This study was the beginning of a tsunami of papers on gene expression analyses in hundreds of breast cancer samples as a tool for differential diagnosis, prognosis and prediction of therapeutic sensitivity (132–137). In 2009, Parker et al. created a minimal gene set called PAM50 to stratify “intrinsic” subtypes of breast cancer (138). This PAM50 signature is now been commonly used to subdivide breast cancer patients as it has shown a strong agreement with other larger “intrinsic” gene sets previously used for subtyping. Functional modules using transcriptional profiles are also informative of patient prognosis (139), thus, the most informative parameters in the ER+ subtype is related to proliferation, further classifying this subtype into luminal A and B, the latter highly proliferative and associated to poorer prognosis. In contrast, in the TNBC subgroup, only the immune response module was associated with prognosis, whereas in the HER2+ tumors, the tumor invasion and immune response modules displayed significant association with survival.
With the advance of next-generation technologies and the formation of large consortiums like TCGA, now it is possible to have a comprehensive genome-wide transcriptomic (RNAseq), genomic (exome or DNA sequencing), and epigenomics (Methyl-seq) data in hundreds of tumor samples (140, 141). The integration of this information is an invaluable source to explain breast cancer heterogeneity. For example, exome sequencing, Methyl-seq, gene expression (mRNA and miRNA), and protein expression on more than 800 breast cancer patients identified more than 30,000 genomic mutations (141) and interestingly these authors found that of all the breast cancer subtypes, the Basal-like subtype has more molecular similarities to high-grade serous ovarian cancer than any other breast cancer subtypes. These new results suggest that Basal-like breast cancer patient could benefit from drugs commonly use to treat ovarian cancer (e.g., PARP inhibitors) and illustrates the potential of the implementation of genomic analysis for the clinical management of cancer.
Single-Cell RNA-Sequencing in Cancer
These advances in next generation sequencing methods have been key in the new era of precision medicine that is rewriting clinical cancer treatment. However, there is still significant percentage of patients that do not respond to molecularly designed personalized therapies even when their tumors are cataloged based on both molecular and pathologic criteria. One plausible explanation to this matter is that all of these analyses are based on bulk tumor data. This omic information of ensembles of cells is dominated by the most abundant cell populations, normally the cancer cells, and masks the omic profiles of low abundant or rare populations, including rare cancer cell types with differentiated properties such as cancer initiating cells, but also cells from the TME. Differential transcriptional programs explain much of the functional cell diversity and also provide information on the possible interactions of the cancer cells with the TME. In fact, the transcriptomic information of the cells from the TME will provide invaluable information to design new targets on these cells to use in combination with conventional drugs that target the cancer epithelial cells. Thus, single cell characterization of cancer will allow a more precise characterization and stratification of patients according to single cell “omic” information, and holds the potential for the development of novel and more targeted molecular therapies. The characterization of IICs could also identify better strategies to target immunosuppressive signaling or ICD pathways aimed to potentiate natural cancer immunerejection and immune surveillance.
In the last few years, advances in single cell isolation and the reduction of sequencing costs has allowed an stellar growth in methods to analyse the genome, transcriptome, and epigenome at the single cell level (142). Of the vast array of single cell genomic technologies currently available, single-cell RNAseq (scRNAseq) is currently the most informative and robust method to understand the biology of lowly represented cell populations within the tumor. Single-cell RNAseq can also illustrate tumor paracrine-signaling networks, and can be used as a strategy to develop combined therapies to target multiple and relevant cell populations within tumors.
Initially, scRNAseq allowed the analysis of dozens of cells, which due to subsampling limitations and the high heterogeneity of tumors generated a very poor understanding of TME biology and rare populations. The introduction of targeted scRNAseq (143), droplet-based and other high-throughput scRNAseq methods (144–148) and the reduction of the sequencing costs (149) has enabled the analysis of thousands of tumor cells. Thus, in the last 5 years, studies on single-cell transcriptome of tumors of different cancer types have emerged, this includes (Table 2): glioma (150, 151, 157), melanoma (112), colorectal cancer (159), hepatocellular carcinoma (113, 152), renal carcinoma (153), non-small-cell lung cancer (NSCLC) (115, 116, 154), breast cancer (111, 114, 117, 148, 156), and myeloid leukemia (155).
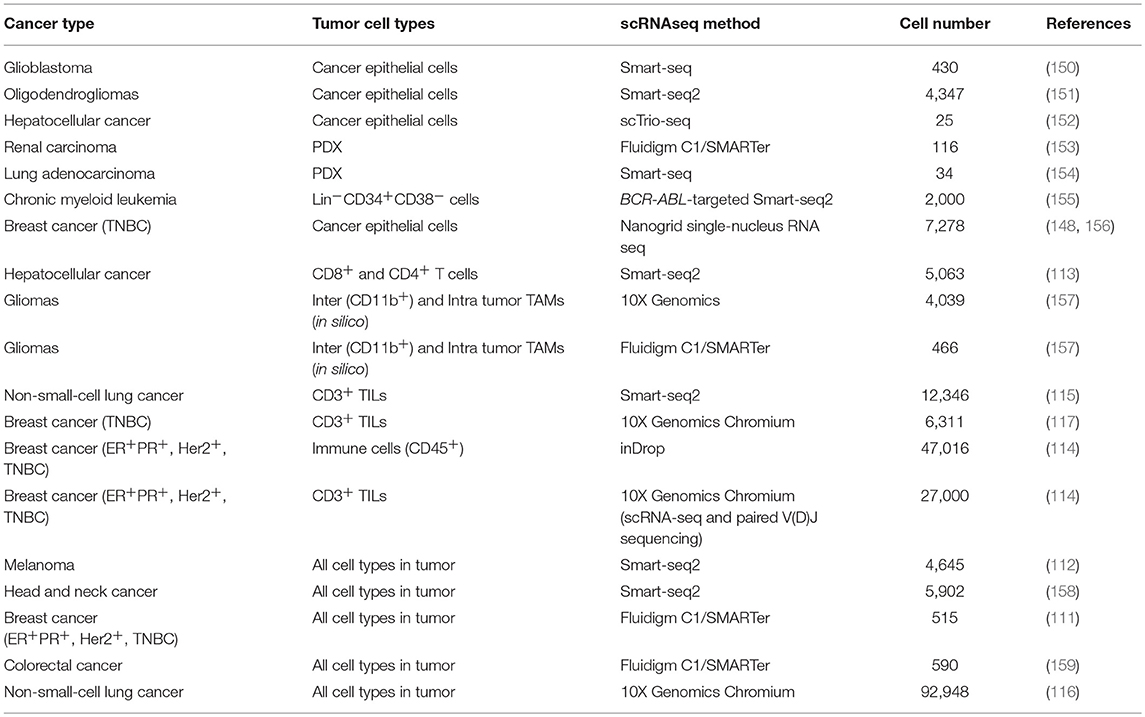
Table 2. Summary of the studies in human tumors using scRNAseq.
Single-Cell Transcriptomics of the Epithelial Compartment From Human Tumors
Initial scRNAseq studies on human tumors were exclusively focused on the malignant epithelial compartment with the aim to study intratumoural heterogeneity of cancer cells. The major motivation of these studies was to identify subpopulations of epithelial cells or rare populations of tumor initiating cells that could explain resistance to targeted therapy, overcoming the limitations of bulk RNA-seq or microarray studies. The very first study of scRNAseq in tumor samples was done by Patel et al. (150). A total of 430 single cells were isolated from five primary glioblastomas and full-length mRNAseq was performed using the Smart-seq approach (160). Their major findings showed an extremely high intratumoural heterogeneity at different levels: (1) Mosaic expression for typical receptors and ligands from glioblastoma-related pathways that have been used as targets for therapy, e.g., EGFR or receptor tyrosine kinases. (2) Gradient expression of stemness and differentiation cell states, and (3) Expression of markers of different glioblastoma subtypes within the same tumor sample. All of these heterogeneous features have a direct impact on prognosis prediction and therapeutic strategies. This study uncovered the heterogeneity of tumor cells of human glioblastoma, however these tumor samples were depleted of tumor-infiltrated leukocytes (CD45+) prior scRNAseq and then the downstream analyses were only focused on cancer cells [420 cells with cancer-related copy number variations (CNVs)] thus a bigger picture of tumor heterogeneity beyond cancer cells could not be established. Despite of this limitation, the authors identified TME-related signaling pathways in the cancer cells, including immune response and hypoxia pathways (150). Two years later, Tirosh et al were able to increase the number of single cells analyzed by 10 times (4,347 cells from six human oligodendrogliomas) using Smart-seq2 protocol (149, 151, 161). The authors identified for the first time a rare subpopulation of undifferentiated cells associated with a neural stem cell expression program. These cells were classified as cancer initiating cells that represent promising targets to affect tumor growth for this incurable glioma subtype. Although this study initially did not deplete the tumor infiltrated leukocyte CD45+ population, non-malignant cells were subsequently excluded by estimating CNVs, so their downstream bioinformatic analyses were only focused on the cancer cells and the authors did not perform further analyses on the cells from the TME (303 cells in total).
In another study in hepatocellular cancer, 25 single cells were analyzed by RNAseq using the Tang-Surani method (152, 162). Despite of the low number of cells analyzed in this study the real advantage was the development of a novel method to simultaneously analyse DNA copy number, DNA methylome, and transcriptome (scTrio-seq) in single cells that allows a more comprehensive analysis of tumor heterogeneity. Thus, this multiomic analysis revealed two subpopulations with differences in CNVs, DNA methylation, and RNA expression profiles, in which the lowest represented subpopulation showed more malignant markers, this include more gain of CNVs, more gene signatures of cell invasion and evasion of immune surveillance. Again however, this study exclusively focused on the cancer cells and excluded cells from the TME.
Kim et al. analyzed a total of 116 cells from a single metastatic renal carcinoma patient using C1™ Single-Cell Auto Prep System (Fluidigm) followed by SMARTer kit [commercial kit based on Smart-seq (160)] (153). This study focused on the differences between primary and metastatic tumor sites in order to identify intratumoural heterogeneity to explain drug resistance. Single-cell analyses showed the presence of subpopulations with distinct drug sensitivities between the primary and metastatic sites, an also among individual cancer cells in each tumor location. They went one step further and showed that the combinatorial drug treatment targeting those differential pathways significantly improved therapeutic responses in both in vitro and in vivo models. This study was also limited by the lack of information on the TME for several reasons, the first one is that the only looked at around 30–40 cells per tumor site/model which it will give an extremely low representation of the cells from the TME (which normally accounts 30–40% of the total cells from the tumor); and the second reason comes from the origin of the tumor sample, where 82 cells came from patient-derived xenografts (PDXs): 36 cells from PDXs from the metastatic site and 46 cells from PDXs from the primary tumor (153). PDXs are useful models to have “unlimited” tumor samples from a given patient and useful for in vivo drug screening (163, 164). PDX cells reflect their parental tumors but with lower normal stromal cells content, which is replaced by mouse stroma and gets diluted out throughout the xenograft passages. The second limitation is that human cancer cells grow in immunocompromised hosts, thus this model cannot be used to study the effect of the immune system on tumor progression or cancer therapy (153). The same authors did a very similar study but this time using exclusively PDXs from a lung adenocarcinoma patient tumor where they identified a candidate tumor cell subgroup associated with anti-cancer drug resistance (154), hence this study presents the same limitation on studying the TME involvement in drug resistance.
Another study analyzed more than 2,000 single cells by FACS and Smart-seq2 from patients with chronic myeloid leukemia (CML) at diagnosis, remission and disease progression (155). In addition, this team developed a new method to simultaneously obtain high-sensitivity mutation detection of BCR-ABL (a fusion gene present in CML and used as therapeutic target) and transcriptome analysis of the same single cell. This method was BCR-ABL-targeted Smart-seq2 protocol where BCR-ABL-specific primers were multiplexed at the reverse transcription and amplification steps. This technique revealed heterogeneity of CML single cells, including the identification of a subgroup of CML cells with a differential molecular signature that selectively persevered during sustained therapy.
Recently, the introduction of a novel scRNAseq methodology called Nanogrid single-nucleus RNA sequencing has allowed the analysis of isolated single nuclei from archived fresh frozen tumor tissues (148). The creators of this new method were able to sequenced the polyA mRNA from 416 nuclei in one study (148) and 6,862 nuclei in another one from frozen breast tumor samples (156). This latter study combined single cell DNA seq and scRNAseq to study the acquisition of chemoresistance in TNBC and found that while the genotype of resistant cells was pre-existent to neoadjunvant chemotherapy treatment, the transcriptome presented a very different transcriptional profile pre- and post- treatment (156). This study underscores the high plasticity of transcriptome in the development of chemoresistance that might correspond to the pre-existing resistant cancer cells. As such, these cells might be cancer-initiating cells present in the tumor since its inception and constitute the perfect targets to tackle chemoresistance in TNBC. One of the limitations of these studies is that the image system only selects the nuclei from cancer epithelial cell and excludes stromal cells (> 8 microns) and also the bioinformatics analyses only focused on aneuploidy cells to make sure none of the cell from the TME were included in their downstream analyses. Thus, any contribution of the TME to chemoresistance remains elusive.
Single-Cell Transcriptomics of IICs From Human Tumors
Recently large-scale studies focus on the tumor stroma and particularly in IICs have flourished. Zheng et al., Savas et al., and Guo et al. exclusively focused their studies on tumor-infiltrated T cells from liver cancer, TNBC, and non-small-cell lung cancer, respectively (Table 2). The common motivation underlying these studies was the identification new immunotherapeutic strategies for poorly responsive tumors to the current immunotherapy-based drugs, as well as for a better patient stratification to be selected for the current checkpoint inhibitor immunotherapy (113, 115, 117). Thus, all these three studies primarily found interesting results in CD8+ T cells and their exhaustion (lost of self-renewal capacity) and effector properties and in Tregs heterogeneity and their immunosuppressive activity.
In the liver cancer study, the transcriptome of 5,063 FACS isolated T cells (CD4+ or CD8+) from peripheral blood, tumor, and adjacent normal tissues from 6 hepatocellular carcinoma patients was sequenced (Smart-seq2). Transcriptional profiles of these individual cells, combined with single cell TCR sequences, identified 11 T cell subsets (5 clusters for CD8+ and 6 clusters for CD4+ cells) with diverse tissue distribution patterns, molecular characteristics and functional properties. Specific subsets of Tregs and exhausted CD8+ T cells were more abundant in the liver primary tumors compared to the T cells from the peripheral blood or adjacent normal tissue. They were also able to validate one novel gene signature in CD8+ T cells governed by the layilin gene (LAYN). The overexpression of LAYN in CD8+ T cells from normal peripheral blood resulted in inhibition of IFN-γ production (a cytokine involved in immune-mediated tumor rejection), this suggests that LAYN might be a master regulator of a major signaling pathway involved in the inhibition of the cytotoxic activity of CD8+ T cells and that it could mediate immunesuppression in the TME.
Savas et al. identified a very similar T cell heterogeneity (10 clusters) from 2 samples of human primary TNBC tumors where 6,311 tumor-infiltrated T cells were sequenced (117) using the 10X Genomic Chromium platform. The major findings of this study were the identification of a new subclass of tissue-resident memory CD8+ T cells (CD8+CD103+, TRM) that may be responsible of cancer immunesurveillance as these cells showed cytotoxic and pro-inflammatory characteristics both in the scRNAseq data as well as in in vitro functional assays. Furthermore, the gene signature of this TRM cells was significantly associated with better patient prognosis. Altogether this study identified a T cell subpopulation resident in breast tumors as a potential new target of immune-intervention.
Guo and colleagues performed scRNAseq (Smart-seq2) in 14 naïve-treated NSCLC (115) identifying a higher T cell diversity than the previous two studies (7 CD8+ clusters and 9 CD4+ clusters). This study found two interesting CD8+ T cell clusters with pre-exhaustion markers that were associated with a significant better patient survival in lung cancer patients. A highly migratory T cell cluster that might be linked to a positive response to checkpoint inhibitors was also identified and lastly they also observed a very high heterogeneity within the Tregs subpopulations that might suggest different stages of activation.
There is one study that exclusively focuses on the other highly abundant IIC population in tumors, TAMs, in the context of gliomas, which are particularly abundant in this tumor type. Inter and intra-tumor TAMs were analyzed by two scRNAseq methods, C1 Fluidigm/SMARTer and 10X Genomics Chromium, (Table 2) and were also combined with public scRNAseq data from this tumor type (157). Interesting the authors found that blood-derived TAMs present a different gene signature than the microglial TAMs and that contribute to a more M2 phenotype (express immunesupressive cytokines and have an altered metabolism) for pre-treatment gliomas and its presence correlates with poorer survival in low-grade gliomas suggesting a potential use as a blood-based prognostic biomarker and suggest a more TAM-targeted immunotherapeutic strategy.
Recently Azizi et al. built the first human breast tumor immune single cell atlas sequencing the transcritpome of 47,016 immune cells from breast cancer tumors of different subtype origin (114) (Table 2). This very high resolution was only possible by the use of the inDrop (indexing droplet) platform (145) after FACS CD45+ cells from tumors. Their data revealed a very high heterogeneity of these cells where they were able to identify 83 clusters that correspond to 38 T cell (15 CD8+ and 21 CD4+), 27 myeloid cell, 9 B cell and 9 NK cell clusters. In-depth bionformatic analyses of the T cell and myeloid lineages, which were the most abundant and are the most clinically relevant, showed a higher diversity of these cell populations in the tumors when compared with their matched normal mammary tissue, peripheral blood or lymph nodes. Very interestingly they found that the TAMs present in the tumors have co-exiting gene signatures of M1 and M2 states suggesting that tumor-infiltrated macrophages are quite plastic and can exist along a continuum between 2 states, this has been also observed in gliomas (157) and NSCLC (116). Their comprehensive analysis on the T cells compartment also suggest a spectrum of activation transitions rather than classical discrete states and such stages are TCR-induced and tumor microenvironment-dependent.
All these studies in IICs underscore the capability of high-throughput scRNAseq methods on revealing the high complexity and diversity of the IICs in tumors; they are also an invaluable resource for future further mechanistic studies and for the development of novel immunotherapy strategies. In the future the combined information of the corresponding gene-signatures coming from the other stromal cells as well as from the cancer epithelial cells will also add further insight of how these different T cells and TAM transitions are regulated; this could be achieved using the same type of high-throughput scRNAseq platforms in a unbiased manner both in the single cell isolation and bioinformatics analysis steps. Another missing piece in these studies is a deeper analysis and/or focus on rare IICs that are clinically relevant like MDSCs, which with the current technology is now possible to obtain high-resolution transcriptome profiling of such low-abundant populations.
With the exponentially growing studies generating sc transcriptome data on IICs in different human cancer types it would be very interesting to combine this information to look for common immunogenic transcriptional signatures or immune cell subtypes involved in tumor immunesuppression or immunesurveillance for the design of globally effective immunotherapeutic treatments independent to tumor type and also to use this data for stratification of patient that could benefit of such treatments.
Unbiased Single-Cell Transcriptomics of Human Tumors
In 2016, the studies of scRNAs-seq analyzing both malignant and stromal cells emerged. This has demonstrated that the inclusion the single cell transcriptome of cells from the TME added an important layer of information key for deeper understanding of the cancer ecosystem, for the design of novel TME-based therapeutic targets and to explain drug resistance, particularly, resistance to immunotherapy. Tirosh et al. analyzed 4,645 single cells from 19 melanoma patients with a variety of clinical and therapeutic backgrounds, profiling malignant cells (CD45− and inferring CNVs) and non-malignant cells (CD45+ and inferring of CNVs): immune, stromal, and endothelial cells (112). These tumors were dissociated to single cells followed by FACS (alive and CD45 positive cells) and Smart-seq2 for single-cell RNAseq analyses. Globally, single-cell analyses of all cells suggested different TME profiles that highlighted cell-to-cell interactions between cancer and stromal cells with direct implications for both targeted and immune therapies. In particular, the authors found that malignant cells show high diversity in the abundance of a dormant and drug-resistant melanoma subpopulation that directly impacts on drug resistance. In the non-malignant subpopulation they identified six different cell subpopulations: T cells, B cells, macrophages, NK cells, endothelial cells, and CAFs. Single-cell expression analysis of 2,068 infiltrating T cells from 15 melanomas cells further allowed the definition of a core exhaustion signature for CD8+ T cells of 28 genes that were consistently increased in high-exhaustion T cells. Full-length scRNAseq is highly informative of TCR mRNA clonality in T cells, allowing the correlation of T cell clonal expansion with their exhaustion, in this study low exhausted T cells were practically non-expanded. These novel findings could be highly informative to evaluate tumor response and resistance to the current checkpoint inhibitors available in the clinic. This is the first study where the single-cell analysis of the cells from the TME are considered and showed for the first time the huge potential of scRNAseq in TME-cell types, in particular in the study of the differential transcriptional programs of the tumor-infiltrated T cells.
A study using similar approaches in head a neck squamous cell carcinoma (HNSCC) was published at the end of 2017 (158) where 5,902 cells from 18 HNSCC primary tumors and matching lymph node metastases were sequenced in an unbiased manner (FACS of alive cells). One of the highlights of this work was the discovery of complex interactions between malignant and non-malignant cells, in particular they found a paracrine crosstalk of partial EMT (defined as a signature with some EMT markers and moderated epithelial markers) between a subset of malignant cells from the leading edge of the tumor and CAFs from the TME with potential implications on tumor invasion. This work is particularly interesting as they are able to build interconnexions between the TME and epithelial cells and also to identify specific pathways of intra-tumor heterogeneity from the malignant cells regardless inter-tumor heterogeneity.
Another report contemplating all cell types in the tumor was published in the context of breast cancer (111). A total of 515 single cells from 11 patients representing the four subtypes of breast cancer (HER2+, luminal A, luminal B, and TNBC) were isolated using C1™ Single-Cell Auto Prep System followed by Smart-seq (SMARTer kit). This microfluidic-based method allowed marker-free isolation of malignant and non-malignant cells from tumors, obtaining 317 epithelial breast cancer cells, 175 tumor-associated immune cells and 23 non-carcinoma stromal cells. The analysis of breast cancer cells revealed a high grade of intratumour heterogeneity with the HER2 and TNBC subtypes showing the highest heterogeneity on their transcriptional programs. Interestingly, they identified rare populations of cells that expressed markers of aggressiveness, however not major conclusions from these cells could be drawn due to the low number of cancer cells analyzed per patient (<25). The investigation of the infiltrated immune cells revealed that the TNBC had the highest number of IICs compared to the other subtypes and that the mostly represented IIC subpopulations were: B cells (often from samples containing lymph nodes), T cells and TAMs (both mostly found in the primary tumors). Interestingly, the transcriptional programs of the T cells from the TNBC showed signatures of T-cell exhaustion but with low expression level of PD-1, suggesting the need to target different checkpoint molecules. In the same breast cancer subtype TAM subpopulations expressing many immunosuppressive M2-type genes were found. This study acknowledges the necessity of large-scale single-cell gene expression profiling projects for the comprehensive characterization malignant and non-malignant cells from heterogeneous tumors.
Li and colleagues performed scRNA–seq analysis (based on Smart-seq) of 590 cells (after quality control) isolated with the C1™ System from 11 primary colorectal cancer (CRC) tumors (375 cells) and matched normal samples (215 cells) (159). Besides the analysis of the cells from the TME, this study has the advantage of comparing matched normal samples that allow a more accurate differential expression analyses between normal and cancer cells coming from the same patient. scRNAseq data was able to stratify the tumors into cancer epithelial cells, fibroblasts, endothelial cells and major immune cell populations, some of which could be further divided into novel subtypes. In fact, two distinct subtypes of CAFs were identified where epithelial–mesenchymal transition-related genes were found to be up-regulated only in one CAF subpopulation. Thus, these results further underscore the potential relevance of this important cell type from the TME to CRC outcome.
This year, a seminal paper on high-resolution single cells profiling of NSCLC tumors has set the first stepping-stone toward the generation of reference atlas of high-resolution unbiased maps of tumors (116). Lambrechts and colleagues sequenced the single-cell transcriptome of NSCLC and matching adjacent normal tissue at the highest resolution ever reached before in tumors (Table 2). A total of 92,948 single cells (52,698 cell in a first cohort and 40,250 cells in a validation cohort) were subjected to unbiased scRNAseq (10X Genomics Chromium) and identified a total of 52 stromal cell subtypes of 12 cancer cell subtypes. Their analyses mostly focused on the TME due to several reasons: (1) Stromal cells showed higher than expected heterogeneity and complexity, even in cell types that are suppose to be homogeneous like endothelial cells; (2) These cells clustered according to cell type and, in contrast to the cancer epithelial cells, did not show any patient-bias; (3) TME is the most unexplored area of research in the context of tumors and sc transcritomics. As an example of one of their major findings they found that tumor endothelial cells showed up-regulation of Myc target genes that correlated with a higher global transcription of these cells and suggesting a role for Myc in angiogenesis. These tumor endothelial cells also present down-regulation of immune activation and immune cell homing suggesting an active role of this cell type in tumor immunetolerance. This study also briefly associated the tumor characteristics (histology and stage) with the TME using single-cell RNAseq information, correlating particular TME signatures or cell types/states with lung cancer subtypes [lung adenocarcinoma (LUAD) and lung squamous carcinoma (LUSC)]. In this context they identified 9 out of 42 TME cell subtypes that showed differences between lung cancer subtypes, that could be explained by the cell of origin of lung tumors, histopathology and stage. They also found that one of the CD8+ T cell clusters with high proliferative characteristics were positively associated with mutational load, suggesting a more T CD8+ effector response due to a higher number of tumor neo-antigens; the rest of the stromal clusters/signatures were correlated with a reduced mutational rate. However, more comprehensive functional associations between TME-cancer epithelial cells using scRNAseq information from both of them could have been challenging due to the high patient-to-patient bias in the epithelium compartment.
In conclusion, during 2018 we are witnessing a tsunami of new studies in scRNAseq of human tumors reaching a very high resolution and contemplating all cell types in the tumor (Table 2) that will lead to the establishment of single cell atlases of human tumors. These catalogs will set up the reference for further advances in cancer cell biology after functional validation in vitro and in vivo and will fuel major progresses in cancer diagnosis and therapy.
The application of high-throughput scRNAseq in pre-clinical models is also going to revolutionize the areas of cancer cell biology, cancer diagnosis and therapy. These models will be particularly useful for the study of TME-cancer epithelial interactions as mouse model are genetically homogeneous and controlled and allow further functional validation studies and in vivo drug testing.
ScRNAseq Methods to Study IICs
Initially the most common scRNAseq methods to study human tumors are all based on Smart-seq (160) or its latest update Smart-seq2 (149) after single cell isolation by C1™ Fluidigm system or targeted FACS isolation, which limited the cell number throughput (Tables 2, 3). These methods allow targeting and sequencing of full-length transcripts using Illumina-based sequencing (149). Cells are sorted into 96 well plates containing lysis buffer and oligo-d(T) primers for reverse transcription. cDNA is amplified via polymerase chain reaction (PCR) and tagmentation (fragmentation and adapter ligation) is used for library preparation. All the molecular pipeline is performed cell by cell individually and samples are only pooled after adapter ligation for Illumina sequencing, thus the cost per cell is high and the throughput limited. These methods have allowed the analysis of up to ~5,000 single-cells from tumors [with the exception of one study where 12,000 cells were performed (115)], however due to the high heterogeneity of tumors, an increase of cell numbers from each compartment is crucial in order to have a enough resolution to resolve cell states as well as of low represented cell populations (cancer initiating cells or MDSCs). The introduction of cell barcoding prior to library preparation or even prior retro-transcription has significantly increased the throughput of scRNAseq enabling the simultaneous analysis of thousands of cells in a cost-effective manner (Tables 2, 3). Thus, studies analyzing tens of thousands of cells in human tumors (114, 116) have just emerged that are now more focused on the heterogeneity of cells from the TME. Thus, in the coming years there is an expectation of an explosion of new studies on high-throughput scRNAseq in whole tumors that will allow the generation of high-resolution human tumor atlases and the analysis of rare cell populations within tumors.
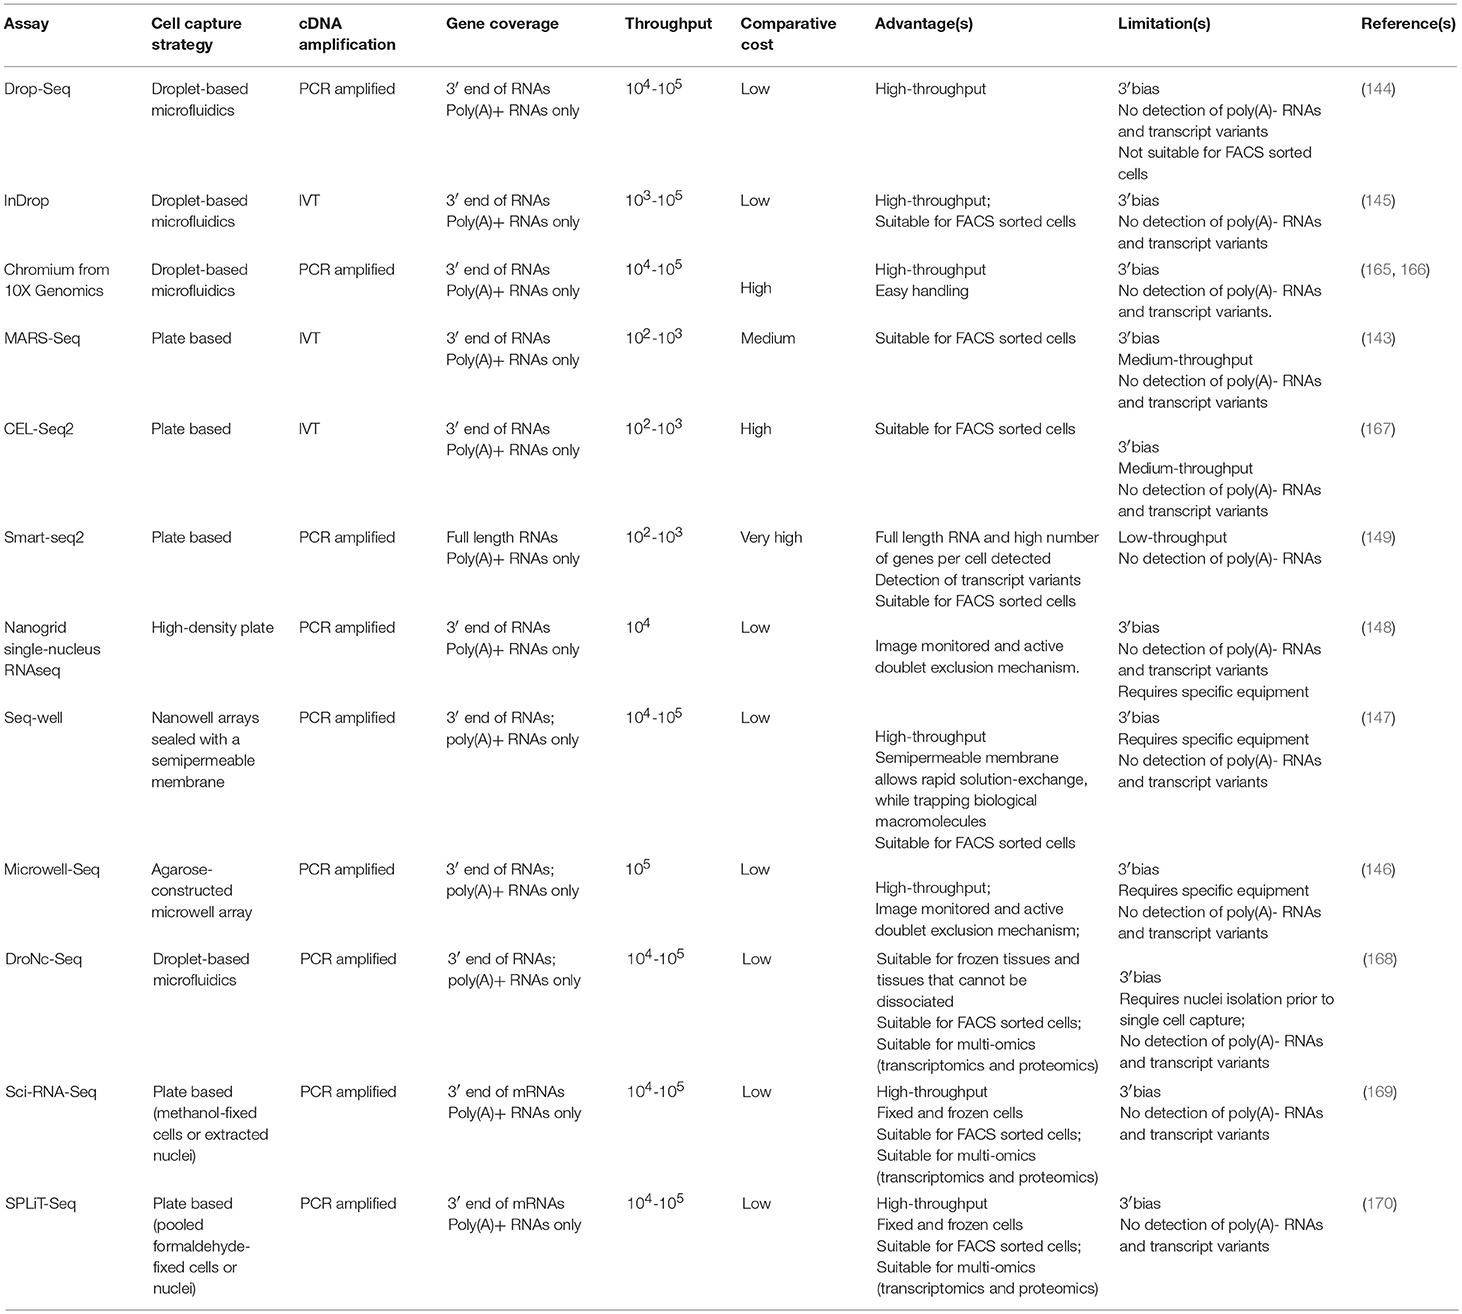
Table 3. Comparison of scRNAseq methods for the analysis of IICs.
Droplet-based scRNAseq methods allow high-throughput analyses ideal to obtain high-resolution molecular phenotyping of complex tissues. These high-throughput technologies meet the need of extensive sampling of cells necessary to understand the complexity present in the TME; allowing the study of the signals arising from low-abundant populations. Thus, this technology is especially well-suited to unravel the contribution of tumor infiltrated immune cell populations involved in the onset of cancer.
Because of their potential, droplet-based scRNAseq have experimented a rapid technological development in the last years, resulting in the establishment of a number of different platforms. These methods present advantages and limitations and the choice of platform needs to be tailored to the scientific question aimed to answer; sample characteristics and abundance of the cell type of study. Here we provide an overview of the scRNAseq methods most suitable for analyzing the role of the immune system in cancer (Figure 3) including their advantages and limitations (Table 3). For example, the use of agnostic scRNAseq approaches without isolation bias maximizes the chance for novel cell type identification in tumor-associated subpopulations that may reveal new target populations for therapeutic intervention. This contrasts with, antibody-based isolation methods prior to scRNAseq, which are limited by preconceived cell marker information and the availability of high-affinity antibodies.
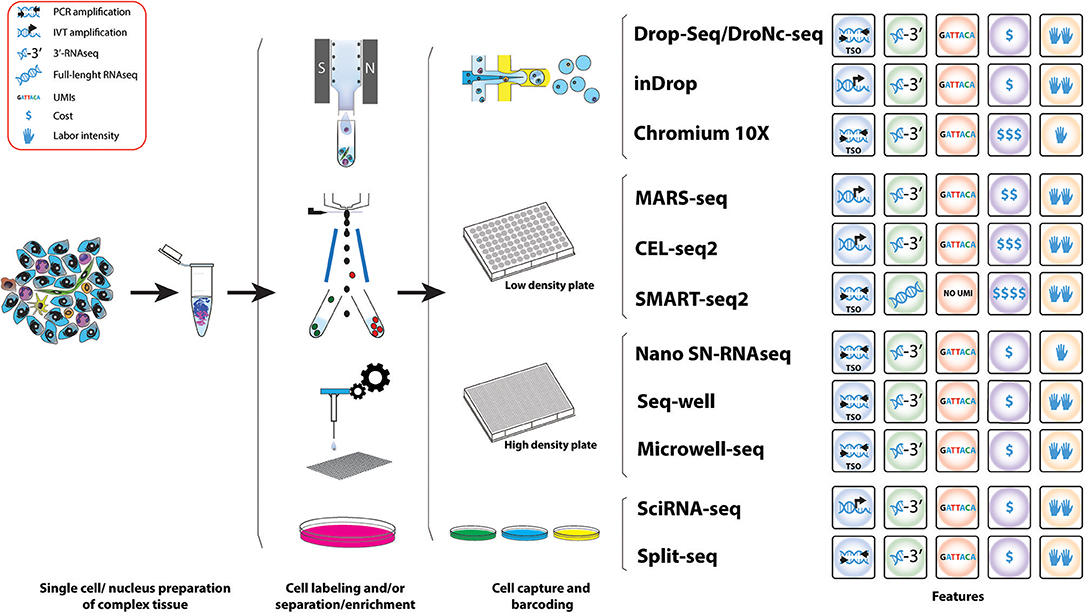
Figure 3. Workflow of various methods used for the study of IICs. Schematic representation of the different methods for scRNAseq analysis useful for the study tumor infiltrated immune cell species. A comparative summary of their main characteristics is shown.
The major challenge of scRNAseq compared to bulk RNA-Seq is the minute amount of starting material, a mammalian cell only contains 1–50 pg of RNA and only 1–5 per cent are transcribed to mRNA (171). This problem has been overcome from two different angles: (1) by whole-transcriptome amplification of cDNA by PCR or RNA by in-vitro transcription (IVT), and (2) the introduction of random oligonucleotide barcodes that enable processing and sequencing of pools of barcoded cells in single reactions, but yet allowing assigning identified genes to their cell of origin. The disadvantage of these molecular methods is that individual cells need to be contained, normally in micro-wells, thus limiting the number of cells to be analyzed at same time as these approaches are highly time-consuming.
Droplet-Based Microfluidic ScRNAseq Methods
The development of droplet-based microfluidic single-cell RNA-Seq approaches like Drop-Seq and inDrop, has allowed high throughput capture and barcoding of tens-of-thousands of single cells in a short time, followed by pooling the extracted barcoded material on a single molecular reaction, massively reducing the cost per cell. In both techniques polyadenylated (poly(A)) RNAs are captured and barcoded with a cell barcode and a unique molecular identifier (UMI) (144, 145). These are unique oligonucleotide sequences that can hybridize to RNA via a poly(T) anchor. Transcripts of a single cell receive the same cell barcode but UMIs are unique throughout transcripts, which allows to account for PCR amplification biases (172).
In Drop-Seq, single cells are encapsulated into nanoliter-sized oil droplets containing lysis buffer and oligo barcodes attached to Toyopearl HW-65S beads. At encapsulation, single cells are lysed and RNA is barcoded by binding to the Poly(T) tails of the oligos on the beads producing so called STAMPs (single-cell transcriptomics attached to micro particles). The droplet emulsion is then broken and beads in suspension are recovered allowing a single reverse transcription reaction. cDNA is then amplified via PCR using a TSO primer (161). Amplified PCR products undergo tagmentation (fragmentation and adapter ligation) and library amplification before sequencing and bioinformatics analysis (144).
InDrop is based on the same principle of capturing single cells in droplets containing barcodes and UMIs, but there are some differences. Individual cells are encapsulated with hydrogel (polyacrylamide) microspheres containing barcoded primers in a solution containing lysis buffer and reverse transcription mix. Barcoded primers are released via UV exposure and captured poly(A) RNA is transcribed to cDNA before drop breakage. In contrast to Drop-Seq where amplification takes place by PCR of cDNA, inDrop cDNA is linearly amplified via T7 in vitro transcription. Next, the in vitro amplified and barcoded RNA becomes fragmented and sequencing adapters are ligated before another round of reverse transcription. Resulting cDNA fragments are amplified, sequenced and analyzed (145).
It is worth mentioning that commercial platforms for droplet-based scRNAseq are also available following the same principles. The Nadia instrument (Dolomite Bio) is an automated microfluidic encapsulation device that streamlines Drop-Seq into a user-friendly interface and the possibility of running multiple samples at the same time. ddSEQ™ Single-Cell Isolator (Bio-Rad) is another Drop-Seq-based device that uses polystyrene beads. Finally, the Chromium Single Cell Gene Expression Solution (10X Genomics) also multiplexes up to 8 samples per run and uses hydrogel beads in a microfluidic architecture (using the Chromium Controller, 10X Genomics) more similar to inDrop but with a TSO molecular approach (165). The advantage is that company-based devices provide fully automatic instruments for capturing and molecularly barcoding cells. However, the easier handling comes along with loss of control during the emulsion formation and an increase in costs per cell (Table 3).
Microfluidic-based approaches have two key advantages for the study of tumors and TME. First, they offer abroad range of cell sizes that can be captured which it is ideal for a complex tissue, where it is expected to contain small cell types such as lymphocytes and bigger cells such as macrophages or epithelial cancer cells. The second advantage is their capacity of capturing many cells in a single run and in short time. Thus, these technologies are extremely useful to generate an overall picture of cell types present in a tumor.
ScRNAseq Methods for Specific Targeted Populations
Tumors generally harbor an overrepresentation of epithelial cancer cells, thus in unbiased capture approaches the presence of rare populations is proportional to their abundance, so a large number of cells would need to be sequenced to properly study low-abundant cell populations present in the TME, including some subtypes of IICs like MDSCs. An effective approach to comprehensively study rare immune cells subtypes is enriching for these populations before single-cell capture. Cell surface markers can be targeted using antibodies coupled to fluorophores and subsequent fluorescent activating cell sorting (FACS) to enrich for specific cell populations. For example, the enrichment of MDSCs by sorting for CD45+F4/80−CD11b+Gr1+ cells can give a better insight about M-MDSCs and PMN-MDSCs (119).
Droplet-based scRNAseq are suitable for targeted scRNAseq but they require pre-enrichment of the cell population of interest. Staining and sorting of cells might be coupled to cellular activation and/or cellular stress, which might contribute to an altered transcriptome and a decrease in cell viability. Additionally, even after cell sorting, the number of cells recovered could limit the application of subsequent droplet-based techniques. Therefore, these caveats need to be taken into consideration in the experimental design and choice of scRNAseq platform. Drop-Seq involves high flow rates and low cell capture efficiency (144, 173), while inDrop performs at lower flow rates and present much higher cell capture efficiency (145). As an alternative to FACS, an antibody-based cell enrichment approach useful as a preparatory technique before droplet encapsulation is the magnetic cell separation, both targeting the cell population of interest or depleting indifferent and/or dead/dying cells.
Another approach for scRNAseq analysis of targeted cell populations is the use of static-microfluidic devices like the Fluidigm C1 system combined with the CEL-Seq2 (or Smart-seq2 protocol). Here the automatic microfluidics instrument is able to allocate cells into nanoliter wells and subsequently load the CEL-seq2 barcodes (167). Cells are lysed, RNA is reverse transcribed and amplified by IVT before samples are pooled for library preparation.
Finally, there are approaches that directly FACS sort cells in high-density microwell plates. MARS-Seq (Massively parallel single-cell RNA-Seq) is designed to directly correlate FACS sorting profiles with transcriptomics on the same single cell (143). Cells are stained with specific cell surface markers and individual cells are index-sorted into wells of a 384-well plate containing UMI-barcoded primers and lysis buffer. After reverse transcription, cDNA of single cells is pooled, cDNA is in-vitro transcribed for amplification and RNA is fragmented and combined with adapters for sequencing of libraries. Through index-sorting MARS-Seq can be used to sort different cell types derived from the same tumor. Paul et al. used MARS-Seq to study the heterogeneity in cells of the myeloid lineage derived from the bone marrow and identified seven groups of progenitors with defined cell fates (174). This overruled the view of hematopoiesis as a progressive loss of differentiation potential along the lineage, however, this study showed that hematopoietic cells undergo lineage commitment at early stages. It proved that MARS-Seq is a powerful tool to study the myeloid lineage and could be used to study this lineage in the TME to reveal alterations in progenitors that are necessary for tumor progression.
Other High-Throughput ScRNAseq Methods
Single-cell RNAseq technics are constantly improving. Two recently developed methods combining microfluidics and plate-based approaches are Seq-well (147) and Microwell-Seq (146) enabling to sequence low-input samples on a high-throughput fashion. Seq-well uses arrays of nanoliter size wells that are loaded with barcoded beads and cells by gravity in combination with microfluidics to isolate single cells (147). Microwell-Seq uses agarose-constructed microwells to trap single cells with barcoded beads that are loaded using microfluidics (146). Another recently developed method uses the high-throughput of Drop-Seq in combination with sNuc-Seq (DroNc-seq) that allows sequencing of single nuclei from tissues that cannot be easily dissociated into a single-cell suspension (168). Nuclei are first isolated from a complex tissue and then single nuclei are captured together with a barcode bearing bead using a similar device as in Drop-Seq, however the channel of the microfluidic device is narrower accommodate the smaller size of the nuclei compared to a single cell; but also creates smaller droplets, compensating the lower RNA input from single nuclei compared to single cells. This technique was developed for brain tissues to preserve the integrity of neurons (168) and could have potential to be useful for studying tumor cells and the TME from archived paraffin-fixed samples. Furthermore, this technique has been successfully used for frozen human and mouse brain tissues (168), which could be advantage for patient tumor samples that cannot be processes freshly. Thus, in this context, there is another high-throughput scRNAseq method developed recently, Nanogrid single-nucleus RNAseq, that has been able to obtain scRNAseq from isolated nuclei from archived fresh frozen tumor tissues (148). This automated method (ICELL8 system, Wafergen, Inc.) nanodispenses isolated nuclei into an alloy nanogrid that contains 5,184 nanowells with preprinted oligos containing cell and UMI barcodes and an oligo dT. Then a sophisticated and automated imaging system selects the nanowells that contain one nuclei of the selected size and only those wells will have the reagents deposited to perform downstream cDNA preparation and amplification by SCRB-Seq (175).
All of the above methods are based on the isolation of cells from their physical compartments, this could alter a cell's transcriptome due to the activation and repression of cellular pathways including stress signals. Only recently two methods were developed enabling scRNAseq experiments with fixed cells or extracted nuclei (169, 170). In both of these methods transcripts are labeled in-cell with a combination of different barcodes introduced via split and pool method. Sci-RNA-seq (Single cell Combinatorial Indexing RNA sequencing) developed by Cao et al. in 2017 is able to incorporate a total of three different barcodes after cell fixation and permeabilization with methanol. A first barcode is introduced via poly(T) primer containing also a UMI. After reverse transcription cells are pooled and redistributed, 10–100 cells per well, using FACS where second strand synthesis and tagmentation using Tn5 transposase takes place. Thereby a second index is incorporated via Tn5 adapter. Subsequently cells are lysed and fragments are PCR amplified using a primer binding the barcoded poly(T) primer on the one side and the Tn5 adapter insertion on the other side. Thereby, a third index can be introduced via PCR primer (169). The SPLiT-seq method (Split Pool Ligation-based Transcriptome sequencing) is even able to incorporate up to 4 barcodes enabling parallel labeling of over 1 million cells. Thereby RNA of formaldehyde-fixed cells or nuclei pooled in wells of a 96-well of 384-well plate is reverse transcribed which incorporates the first index via barcoded primer. The second index is introduced using an in-cell ligation reaction and a third barcode containing also an UMI is introduced with a second ligation reaction. Cells are then pooled and split a last time before the introduction of sequencing primers PCR containing a fourth barcode (170). For data analysis, in both methods, sequencing reads that contain the same combination of barcodes are collapsed.
Analytical Computational Frameworks for scRNAseq
The boom of single cell transcriptomics has also been encompassed with an equally important and challenging tsunami of development of computational methods and analytical frameworks to extract biological information from the vast amount of information generated by scRNAseq experiments. These computational methods typically aim to assign phenotypic characteristics that can produce biologically meaningful information proposing functional annotation of each of the cells analyzed. In cancer, these methods have been used to propose in silico simulations of the tumor composition (116); to resemble the acquisition of hallmarks of cancer progression, such as to model the inflammatory processes that govern the TME (157); to estimate the invasive and metastatic capacity of cancer cells (111, 153, 154); or to study transcriptional rewiring that results in anti-cancer therapy resistance (156).
Despite the wide variety of computational methods to analyse scRNAseq data [reviewed in Zappia et al. (176)] a typical workflow can be depicted (177). At a glance, this computational workflow can be grouped into two stages: (1) Data processing and (2) Data analysis. Data processing involves the manipulation of the sequencing data from a fastq or bcl file to a data matrix of expression values for each gene in each cell, often called “digital expression matrix” (DGE). This stage involves sequence quality control (QC), poly(A) trimming, and alignment to the reference genome for transcript identification, de-duplication and de-multiplexing of barcodes and UMIs, and digital quantification of the expression levels of each gene identified in each cell captured (DGE). The DGE data frame will then be used as an input for the second stage.
The Data analysis stage is by far the most variable in methods as it greatly depends on the nature of the sample and the biological questions to be answered with the dataset, but in general most if not all the computational pipelines will include tools for (1) data normalization and QC; (2) cell clustering and classification using variable genes, marker gene identification, principal component analysis, and dimensional reduction; and (3) cell alignment along functional signatures, pseudotiming modeling, or trajectory analysis (176).
An additional level of complexity on the computational methods consists on overlaying muti-omics data from the same biological entity. This approach enable a much deeper characterization of complex biological tissues and it is in increasing demand, examples of this includes overlaying data from CNV analysis (112, 150, 151, 156, 158), scDNAseq (156), targeted scDNAseq (114, 155), scDNA methylation and scDNAseq (152), or protein information in form cell surface marker definition (143, 174). This approach also allows in silico deconvolution of bulk sequencing data not only from RNA (178) but also from genomic data (179).
Limitations of the 3′ mRNA Sequencing-Based Methods and Future Solutions
Another important methodological difference is the type of sequencing output that provides each platform. The major limitation of 3′biased methods (Table 3 and Figure 3) is the lack of information of transcript variants. There are several studies demonstrating the importance of alternative splicing in cancer and the immune system and their impact on therapy responsiveness (180–184). One example is the CD19 gene in leukemia, where an alternative splicing variant impairs patient response to immunotherapy (185). Several immune-related diseases were found to be linked to alternative splicing events [reviewed in Schaub and Glasmacher (184)]. This could also have an impact on the TME in cancer progression. ScRNAseq of full transcripts can not only reveal interesting changes in splice variants in the IICs in cancer but also allows the study of TCR clonality to explain T cell exhaustion in cancer, as previously shown (112). Thus, the most comprehensive scRNAseq to date to give full-length mRNA information is Smart-seq2, thus ideally an adaptation of this into a more high-throughput workflows would be ideal for a complete understanding of tumor biology at the single-cell level. One of these possible adaptations would be to perform long read sequencing. In 3′based methods, the transcript is captured using a polyT oligo, subsequent molecular pipelines process the original full-length transcript and only the cell barcoded and UMI 3′-end of each molecule is sequenced using Illumina short reads sequencing. However, there is a possibility of pairing these 3′-based methods with sequencing methods that allow long reads. Third generation sequencing technologies (TGS) developed by for example Pacific Biosciences (PacBio) and Oxford Nanopore Technology (ONT) allow single molecule long-read sequencing (1–100kb), which allows sequencing of full-length transcripts without fragmentation that is needed for Illumina sequencing (186–190). PacBio has developed single-molecule real-time sequencing (SMRT), in this method hairpin adapters are ligated to both ends of the dsDNA template forming a single-stranded circular DNA molecule. The circular DNA is loaded to a SMRT-cell containing a polymerase and fluorescent-labeled nucleotides, the polymerase binds to the molecule and incorporation of a nucleotide produces a light signal that is recorded (189).
The MinION system from ONT uses nanopores that measure a change in electrical conductivity dependent on the nucleotide when a single DNA molecule passes through the pore (191). This system has been successfully used in combination with the Smart-seq2 protocol to identify transcript variants in mouse B1a cells (192).
Further Use of Single Cell Transcriptomics
Apart from using single-cell RNAseq to analyze transcriptomics to define cell types, its combination with other molecular and bioinformatics technics can increase its power to study immune compartments of the TME. Thus, single-cell transcriptomics can be combined with other omics technics. For example, the combination of single-cell genomics and transcriptomics can help to draw a connection between alterations in the cancer genome and its influences on immune cells. This is possible for example with methods like G&T-Seq, that separate poly-adenylated RNAs from genomic DNA by using biotinylated poly(A) primer prior to sequencing (193). ScTrio-Seq goes even further by combining three omics approaches, genomics, transcriptomics, and epigenomics on the same single cell (152). This has the potential to also study the influence of epigenetic changes on cells of the TME by simultaneous analyzing the genome and transcriptome.
Single-cell RNAseq data could be used for deconvolution of bulk RNA-seq data. Deconvolution infers by mathematical modeling the presence and proportion of cells of a specific compartment in a complex tissue based on the expression of reference genes in a certain compartment (178). This strategy can be applied to large databases built from bulk RNAseq data of tumor tissues (such as the TCGA) to analyze the composition of the TME. A deconvolution approach called Epigenomic Deconvolution (EDec) has been developed to in silico model the cell composition of complex tissues, in this case breast tumors, based on DNA methylation profiles (179). The algorithm uses reference profiles of a certain tissue to select loci based on different methylation profiles (feature selection). RNAseq data is then dissected into subgroups based on a reference-free deconvolution approach based on their molecular profile. These two datasets are then combined to identify cell types by comparing molecular profiles with methylation profiles. With this approach, the proportion of immune cells in breast tumors was inferred and used to predict patient outcome. Single-cell epigenomics data could improve this approach by producing information of methylation pattern of rare cell types to get an even more accurate modeling of cell type compositions.
Another application of scRNAseq data is their usage for reconstructing cell trajectories to follow cell differentiation. To model cell state transitions several bioinformatics algorithms, using unsupervised or supervised (with a little prior information about cell types and marker gene expression) modeling, have been developed to reconstruct cell trajectories (194–196).
A very recent published algorithm is CellRouter, which is very robust in reconstructing trajectories between early cell states and transitory cell states to model cell differentiation (197). CellRouter works in a way that is not dependent on a priori knowledge about cell structure relationships. Single-cell data are first split into subpopulations based on community detection algorithms and then trajectories are determined across subpopulations based on calculated weights, which are weaker between unrelated cell types and stronger within related subpopulations.
ScRNAseq has a great potential to increase our knowledge about immune cancer tolerance to help us find new targets for immunotherapies. However, the main limitation of scRNAseq approaches is that cells are isolated from their environment, making difficult the analysis of connections between cells of different compartments (198, 199). The field of single-cell spatial transcriptomic is of intense research and multiple technologies have been developed in the last few years like seqFISH (200), MERFISH (201), FISSEQ (202), or TIVA (203). SeqFISH and MERFISH use single-molecule FISH (smFISH) techniques, using probes that bind to the same mRNA, but have different fluorophores attached. During several rounds of in situ hybridization and stripping off probes RNAs get a unique fluorescent barcode. This allows the simultaneous detection of many transcripts, although theoretically the usage of 4 dyes and 8 rounds of hybridization would cover the whole transcriptome (48 = 65,5336) these methods are based on background information about marker genes that could be provided by scRNAseq data. The FISSEQ (fluorescent in-situ) technique uses reverse transcription in situ to convert RNA into cross-linked cDNA amplicons followed by a sequencing-by-ligation technique (SOLiD). Finally, TIVA (transcriptome in vivo analysis) uses a photoactivatable biotin-labeled TIVA-tags, which upon photoactivation enable mRNA capture from single cells in live tissue. All these methods allow the detection of expressed genes in vivo in the context of a specific tissue architecture, and thus inference of the interactions between different cell types. Thus, they are a potential approach to study the connection of epithelial cancer cells and the TME in vivo to model the influence of immune cells to cancer cell progression.
Conclusions
Single cell RNAseq has arisen as the preferred method to understand complex biological systems and thus the number of scRNAseq studies in tumor biology is gaining momentum. Initial studies were focussed on the analysis of cancer cells but the increased capacity of newly developed scRNAseq methods opened the door to the simultaneous study of the composition of tumors, including stromal and immune cells. We predict the number of publications analyzing tumor cell diversity will exponentially increase both in preclinical models and human samples; this will allow, not only a better understanding of the cell types and states present in tumors but also it will set the first roadmap for more focussed studies aiming to increase resolution in specific cell compartments that are still poorly characterized. For example, cancer initiating cells or tumor infiltrated populations of myeloid-derived suppressor cells where canonical studies using the analysis of cell surface markers have not been able to resolve the identity and heterogeneity of these controversial populations. The targeted study of specific cell populations will result in enhanced molecular resolution, useful to determine for example the clonality of reactive and exhausted T-cell species in tumors, a key basic understanding that is greatly needed for the refinement of immunotherapies. Finally, scRNAseq will be the basis to unravel networks of cell-to-cell communication that ultimately could be translated to the clinic, as a measurement of therapeutic response or as targets for novel therapies. We are immersed in very exciting times for tumor biology and the next frontier is the development of devices, tools and methods that will allow us to apply scRNAseq analysis to the routine clinical practice in cancer management.
Author Contributions
FV-M and DG-O organized and directed the manuscript writing. They conceived the outline and rational flow and are the main writing contributors with executive editorial responsibility. KH, AL, and RS wrote specific sections of this review. SO and CO provided critical review and suggestions. All authors proofread the manuscript.
Conflict of Interest Statement
The authors declare that the research was conducted in the absence of any commercial or financial relationships that could be construed as a potential conflict of interest.
Acknowledgments
FV-M is supported by a postdoctoral fellowship from the National Breast Cancer Foundation (PF-11-13). DG-O is supported by a Cancer Institute NSW Career Development Fellowship (DG00625 and Cancer Council NSW RG 18-03). RS receives support from the International Society for the Advancement of Cytometry SRL EL program.
References
1. Behjati S, Haniffa M. Genetics: taking single-cell transcriptomics to the bedside. Nat Rev Clin Oncol. (2017) 14:590–2. doi: 10.1038/nrclinonc.2017.117
2. Giladi A, Amit I. Single-cell genomics: a stepping stone for future immunology discoveries. Cell (2018) 172:14–21. doi: 10.1016/j.cell.2017.11.011
3. Ofengeim D, Giagtzoglou N, Huh D, Zou C, Yuan J. Single-cell RNA sequencing: unraveling the brain one cell at a time. Trends Mol Med. (2017) 23:563–76. doi: 10.1016/j.molmed.2017.04.006
4. Hanahan D, Coussens LM. Accessories to the crime: functions of cells recruited to the tumor microenvironment. Cancer Cell (2012) 21:309–22. doi: 10.1016/j.ccr.2012.02.022
5. Hanahan D, Weinberg RA. Hallmarks of cancer: the next generation. Cell (2011) 144:646–74. doi: 10.1016/j.cell.2011.02.013
6. Coussens LM, Zitvogel L, Palucka AK. Neutralizing tumor-promoting chronic inflammation: a magic bullet? Science (2013) 339:286–91. doi: 10.1126/science.1232227
7. DiLillo DJ, Yanaba K, Tedder TF. B cells are required for optimal CD4+ and CD8+ T cell tumor immunity: therapeutic B cell depletion enhances B16 melanoma growth in mice. J Immunol. (2010) 184:4006–16. doi: 10.4049/jimmunol.0903009
8. Sarvaria A, Madrigal JA, Saudemont A. B cell regulation in cancer and anti-tumor immunity. Cell Mol Immunol. (2017) 14:662–74. doi: 10.1038/cmi.2017.35
9. Yuen GJ, Demissie E, Pillai S. B lymphocytes and cancer: a love-hate relationship. Trends Cancer (2016) 2:747–57. doi: 10.1016/j.trecan.2016.10.010
10. Grivennikov SI, Greten FR, Karin M. Immunity, inflammation, and cancer. Cell (2010) 140:883–99. doi: 10.1016/j.cell.2010.01.025
11. Disis ML. Immune regulation of cancer. J Clin Oncol. (2010) 28:4531–8. doi: 10.1200/JCO.2009.27.2146
12. Hadrup S, Donia M, Thor Straten P. Effector CD4 and CD8 T cells and their role in the tumor microenvironment. Cancer Microenviron. (2013) 6:123–33. doi: 10.1007/s12307-012-0127-6
13. Kaiko GE, Horvat JC, Beagley KW, Hansbro PM. Immunological decision-making: how does the immune system decide to mount a helper T-cell response? Immunology (2008) 123:326–38. doi: 10.1111/j.1365-2567.2007.02719.x
14. Kim HJ, Cantor H. CD4 T-cell subsets and tumor immunity: the helpful and the not-so-helpful. Cancer Immunol Res. (2014) 2:918. doi: 10.1158/2326-6066.CIR-13-0216
15. Bailey SR, Nelson MH, Himes RA, Li Z, Mehrotra S, Paulos CM. Th17 cells in cancer: the ultimate identity crisis. Front Immunol. (2014) 5:276. doi: 10.3389/fimmu.2014.00276
16. Lorvik KB, Hammarstrom C, Fauskanger M, Haabeth OA, Zangani M, Haraldsen G, et al. Adoptive transfer of tumor-specific Th2 cells eradicates tumors by triggering an in situ inflammatory immune response. Cancer Res. (2016) 76:6864–76. doi: 10.1158/0008-5472.CAN-16-1219
17. Takeuchi Y, Nishikawa H. Roles of regulatory T cells in cancer immunity. Int Immunol. (2016) 28:401–9. doi: 10.1093/intimm/dxw025
18. Frydrychowicz M, Boruczkowski M, Kolecka-Bednarczyk A, Dworacki G. The Dual Role of Treg in Cancer. Scand J Immunol. (2017) 86:436–43. doi: 10.1111/sji.12615
19. Chang WC, Li CH, Chu LH, Huang PS, Sheu BC, Huang SC. Regulatory T cells suppress natural killer cell immunity in patients with human cervical carcinoma. Int J Gynecol Cancer (2016) 26:156–62. doi: 10.1097/IGC.0000000000000578
20. Durgeau A, Virk Y, Corgnac S, Mami-Chouaib F. Recent advances in targeting CD8 T-cell immunity for more effective cancer immunotherapy. Front Immunol. (2018) 9:14. doi: 10.3389/fimmu.2018.00014
21. Klebanoff CA, Gattinoni L, Restifo NP. CD8+ T-cell memory in tumor immunology and immunotherapy. Immunol Rev. (2006) 211:214–24. doi: 10.1111/j.0105-2896.2006.00391.x
22. Novitskiy SV, Ryzhov S, Zaynagetdinov R, Goldstein AE, Huang Y, Tikhomirov OY, et al. Adenosine receptors in regulation of dendritic cell differentiation and function. Blood (2008) 112:1822–31. doi: 10.1182/blood-2008-02-136325
23. Gardner A, Ruffell B. Dendritic cells and cancer immunity. Trends Immunol. (2016) 37:855–65. doi: 10.1016/j.it.2016.09.006
24. Karthaus N, Torensma R, Tel J. Deciphering the message broadcast by tumor-infiltrating dendritic cells. Am J Pathol. (2012) 181:733–42. doi: 10.1016/j.ajpath.2012.05.012
25. Shi Y, Wang E. Blastic plasmacytoid dendritic cell neoplasm: a clinicopathologic review. Arch Pathol Lab Med. (2014) 138:564–9. doi: 10.5858/arpa.2013-0101-RS
26. Tran Janco JM, Lamichhane P, Karyampudi L, Knutson KL. Tumor-infiltrating dendritic cells in cancer pathogenesis. J Immunol. (2015) 194:2985–91. doi: 10.4049/jimmunol.1403134
27. Yang L, Zhang Y. Tumor-associated macrophages: from basic research to clinical application. J Hematol Oncol. (2017) 10:58. doi: 10.1186/s13045-017-0430-2
28. Bremnes RM, Al-Shibli K, Donnem T, Sirera R, Al-Saad S, Andersen S, et al. The role of tumor-infiltrating immune cells and chronic inflammation at the tumor site on cancer development, progression, and prognosis: emphasis on non-small cell lung cancer. J Thorac Oncol. (2011) 6:824–33. doi: 10.1097/JTO.0b013e3182037b76
29. Aras S, Zaidi MR. TAMeless traitors: macrophages in cancer progression and metastasis. Br J Cancer (2017) 117:1583–91. doi: 10.1038/bjc.2017.356
30. Dandekar RC, Kingaonkar AV, Dhabekar GS. Role of macrophages in malignancy. Ann Maxillofac Surg. (2011) 1:150–4. doi: 10.4103/2231-0746.92782
31. Guo C, Buranych A, Sarkar D, Fisher PB, Wang XY. The role of tumor-associated macrophages in tumor vascularization. Vasc Cell (2013) 5:20. doi: 10.1186/2045-824X-5-20
32. Conti P, Castellani ML, Kempuraj D, Salini V, Vecchiet J, Tete S, et al. Role of mast cells in tumor growth. Ann Clin Lab Sci. (2007) 37:315–22.
33. Maciel TT, Moura IC, Hermine O. The role of mast cells in cancers. F1000Prime Rep. (2015) 7:9. doi: 10.12703/P7-09
34. Varricchi G, Galdiero MR, Loffredo S, Marone G, Iannone R, Marone G, et al. Are mast cells MASTers in cancer? Front Immunol. (2017) 8:424. doi: 10.3389/fimmu.2017.00424
35. Gabrilovich DI, Nagaraj S. Myeloid-derived suppressor cells as regulators of the immune system. Nat Rev Immunol. (2009) 9:162–74. doi: 10.1038/nri2506
36. Coffelt SB, Wellenstein MD, de Visser KE. Neutrophils in cancer: neutral no more. Nat Rev Cancer (2016) 16:431–46. doi: 10.1038/nrc.2016.52
37. Fridlender ZG, Albelda SM. Tumor-associated neutrophils: friend or foe? Carcinogenesis (2012) 33:949–55. doi: 10.1093/carcin/bgs123
38. Mishalian I, Granot Z, Fridlender ZG. The diversity of circulating neutrophils in cancer. Immunobiology (2017) 222:82–8. doi: 10.1016/j.imbio.2016.02.001
39. Tecchio C, Micheletti A, Cassatella MA. Neutrophil-derived cytokines: facts beyond expression. Front Immunol. (2014) 5:508. doi: 10.3389/fimmu.2014.00508
40. Uribe-Querol E, Rosales C. Neutrophils in cancer: two sides of the same coin. J Immunol Res. (2015) 2015:983698. doi: 10.1155/2015/983698
41. Deniz G, Erten G, Kucuksezer UC, Kocacik D, Karagiannidis C, Aktas E, et al. Regulatory NK cells suppress antigen-specific T cell responses. J Immunol. (2008) 180:850–7. doi: 10.4049/jimmunol.180.2.850
42. Fan Z, Yu P, Wang Y, Wang Y, Fu ML, Liu W, et al. NK-cell activation by LIGHT triggers tumor-specific CD8+ T-cell immunity to reject established tumors. Blood (2006) 107:1342–51. doi: 10.1182/blood-2005-08-3485
43. Ferlazzo G, Moretta L. Dendritic cell editing by natural killer cells. Crit Rev Oncog. (2014) 19:67–75. doi: 10.1615/CritRevOncog.2014010827
44. Larsen SK, Gao Y, Basse PH. NK cells in the tumor microenvironment. Crit Rev Oncog. (2014) 19:91–105. doi: 10.1615/CritRevOncog.2014011142
45. Moodycliffe AM, Nghiem D, Clydesdale G, Ullrich SE. Immune suppression and skin cancer development: regulation by NKT cells. Nat Immunol. (2000) 1:521–5. doi: 10.1038/82782
46. Crane CA, Han SJ, Barry JJ, Ahn BJ, Lanier LL, Parsa AT. TGF-beta downregulates the activating receptor NKG2D on NK cells and CD8+ T cells in glioma patients. Neurooncology (2010) 12:7–13. doi: 10.1093/neuonc/nop009
47. Terabe M, Matsui S, Noben-Trauth N, Chen H, Watson C, Donaldson DD, et al. NKT cell-mediated repression of tumor immunosurveillance by IL-13 and the IL-4R-STAT6 pathway. Nat Immunol. (2000) 1:515–20. doi: 10.1038/82771
48. McEwen-Smith RM, Salio M, Cerundolo V. The regulatory role of invariant NKT cells in tumor immunity. Cancer Immunol Res. (2015) 3:25–35. doi: 10.1158/2326-6066.CIR-15-0062
49. Nair S, Dhodapkar MV. Natural killer T cells in cancer immunotherapy. Front Immunol. (2017) 8:1178. doi: 10.3389/fimmu.2017.01178
50. Renukaradhya GJ, Khan MA, Vieira M, Du W, Gervay-Hague J, Brutkiewicz RR. Type I NKT cells protect (and type II NKT cells suppress) the host's innate antitumor immune response to a B-cell lymphoma. Blood (2008) 111:5637–45. doi: 10.1182/blood-2007-05-092866
51. Fleming C, Morrissey S, Cai Y, Yan J. Gammadelta T cells: unexpected regulators of cancer development and progression. Trends Cancer (2017) 3:561–70. doi: 10.1016/j.trecan.2017.06.003
52. Peng G, Wang HY, Peng W, Kiniwa Y, Seo KH, Wang RF. Tumor-infiltrating gammadelta T cells suppress T and dendritic cell function via mechanisms controlled by a unique toll-like receptor signaling pathway. Immunity (2007) 27:334–48. doi: 10.1016/j.immuni.2007.05.020
53. Zhao Y, Niu C, Cui J. Gamma-delta (gammadelta) T cells: friend or foe in cancer development? J Transl Med. (2018) 16:3. doi: 10.1186/s12967-017-1378-2
54. Barnes TA, Amir E. HYPE or HOPE: the prognostic value of infiltrating immune cells in cancer. Br J Cancer (2017) 117:451–60. doi: 10.1038/bjc.2017.220
55. Palucka AK, Coussens LM. The basis of oncoimmunology. Cell (2016) 164:1233–47. doi: 10.1016/j.cell.2016.01.049
56. Chow MT, Moller A, Smyth MJ. Inflammation and immune surveillance in cancer. Semin Cancer Biol. (2012) 22:23–32. doi: 10.1016/j.semcancer.2011.12.004
57. Wiedemann GM, Knott MM, Vetter VK, Rapp M, Haubner S, Fesseler J, et al. Cancer cell-derived IL-1alpha induces CCL22 and the recruitment of regulatory T cells. Oncoimmunology (2016) 5:e1175794. doi: 10.1080/2162402X.2016.1175794
58. Bausch-Fluck D, Hofmann A, Bock T, Frei AP, Cerciello F, Jacobs A, et al. A mass spectrometric-derived cell surface protein atlas. PLoS ONE (2015) 10:e0121314. doi: 10.1371/journal.pone.0121314
59. Gresser I, Chekhov A. Coley's toxins. N Engl J Med. (1987) 317:457. doi: 10.1056/NEJM198708133170716
60. Ruffell B, DeNardo DG, Affara NI, Coussens LM. Lymphocytes in cancer development: polarization towards pro-tumor immunity. Cytokine Growth Factor Rev. (2010) 21:3–10. doi: 10.1016/j.cytogfr.2009.11.002
61. Talmadge JE, Donkor M, Scholar E. Inflammatory cell infiltration of tumors: Jekyll or Hyde. Cancer Metastasis Rev. (2007) 26:373–400. doi: 10.1007/s10555-007-9072-0
62. Gabrilovich DI, Ostrand-Rosenberg S, Bronte V. Coordinated regulation of myeloid cells by tumours. Nat Rev Immunol. (2012) 12:253–68. doi: 10.1038/nri3175
63. de Haas N, de Koning C, Spilgies L, de Vries IJ, Hato SV. Improving cancer immunotherapy by targeting the STATe of MDSCs. Oncoimmunology (2016) 5:e1196312. doi: 10.1080/2162402X.2016.1196312
64. Gabrilovich DI, Bronte V, Chen SH, Colombo MP, Ochoa A, Ostrand-Rosenberg S, et al. The terminology issue for myeloid-derived suppressor cells. Cancer Res. (2007) 67:425. doi: 10.1158/0008-5472.CAN-06-3037
65. Morales JK, Kmieciak M, Knutson KL, Bear HD, Manjili MH. GM-CSF is one of the main breast tumor-derived soluble factors involved in the differentiation of CD11b-Gr1- bone marrow progenitor cells into myeloid-derived suppressor cells. Breast Cancer Res Treat. (2010) 123:39–49. doi: 10.1007/s10549-009-0622-8
66. Kusmartsev S, Eruslanov E, Kubler H, Tseng T, Sakai Y, Su Z, et al. Oxidative stress regulates expression of VEGFR1 in myeloid cells: link to tumor-induced immune suppression in renal cell carcinoma. J Immunol. (2008) 181:346–53. doi: 10.4049/jimmunol.181.1.346
67. Sinha P, Okoro C, Foell D, Freeze HH, Ostrand-Rosenberg S, Srikrishna G. Proinflammatory S100 proteins regulate the accumulation of myeloid-derived suppressor cells. J Immunol. (2008) 181:4666–75. doi: 10.4049/jimmunol.181.7.4666
68. Blattner C, Fleming V, Weber R, Himmelhan B, Altevogt P, Gebhardt C, et al. CCR5(+) myeloid-derived suppressor cells are enriched and activated in melanoma lesions. Cancer Res. (2018) 78:157–67. doi: 10.1158/0008-5472.CAN-17-0348
69. Umansky V, Blattner C, Gebhardt C, Utikal J. CCR5 in recruitment and activation of myeloid-derived suppressor cells in melanoma. Cancer Immunol Immunother. (2017) 66:1015–23. doi: 10.1007/s00262-017-1988-9
70. Meyer C, Sevko A, Ramacher M, Bazhin AV, Falk CS, Osen W, et al. Chronic inflammation promotes myeloid-derived suppressor cell activation blocking antitumor immunity in transgenic mouse melanoma model. Proc Natl Acad Sci USA. (2011) 108:17111–6. doi: 10.1073/pnas.1108121108
71. Lindau D, Gielen P, Kroesen M, Wesseling P, Adema GJ. The immunosuppressive tumour network: myeloid-derived suppressor cells, regulatory T cells and natural killer T cells. Immunology (2013) 138:105–15. doi: 10.1111/imm.12036
72. Yanagisawa K, Exley MA, Jiang X, Ohkochi N, Taniguchi M, Seino K. Hyporesponsiveness to natural killer T-cell ligand alpha-galactosylceramide in cancer-bearing state mediated by CD11b+ Gr-1+ cells producing nitric oxide. Cancer Res. (2006) 66:11441–6. doi: 10.1158/0008-5472.CAN-06-0944
73. Sinha P, Clements VK, Ostrand-Rosenberg S. Interleukin-13-regulated M2 macrophages in combination with myeloid suppressor cells block immune surveillance against metastasis. Cancer Res. (2005) 65:11743–51. doi: 10.1158/0008-5472.CAN-05-0045
74. Gallego-Ortega D, Ledger A, Roden DL, Law AM, Magenau A, Kikhtyak Z, et al. ELF5 drives lung metastasis in luminal breast cancer through recruitment of Gr1+ CD11b+ myeloid-derived suppressor cells. PLoS Biol. (2015) 13:e1002330. doi: 10.1371/journal.pbio.1002330
75. Ouzounova M, Lee E, Piranlioglu R, El Andaloussi A, Kolhe R, Demirci MF, et al. Monocytic and granulocytic myeloid derived suppressor cells differentially regulate spatiotemporal tumour plasticity during metastatic cascade. Nat Commun. (2017) 8:14979. doi: 10.1038/ncomms14979
76. Erler JT, Bennewith KL, Cox TR, Lang G, Bird D, Koong A, et al. Hypoxia-induced lysyl oxidase is a critical mediator of bone marrow cell recruitment to form the premetastatic niche. Cancer Cell (2009)15:35–44. doi: 10.1016/j.ccr.2008.11.012
77. Sica A, Bronte V. Altered macrophage differentiation and immune dysfunction in tumor development. J Clin Invest. (2007) 117:1155–66. doi: 10.1172/JCI31422
78. Condamine T, Mastio J, Gabrilovich DI. Transcriptional regulation of myeloid-derived suppressor cells. J Leukoc Biol. (2015) 98:913–22. doi: 10.1189/jlb.4RI0515-204R
79. Yan HH, Pickup M, Pang Y, Gorska AE, Li Z, Chytil A, et al. Gr-1+CD11b+ myeloid cells tip the balance of immune protection to tumor promotion in the premetastatic lung. Cancer Res. (2010) 70:6139–49. doi: 10.1158/0008-5472.CAN-10-0706
80. Gao D, Joshi N, Choi H, Ryu S, Hahn M, Catena R, et al. Myeloid progenitor cells in the premetastatic lung promote metastases by inducing mesenchymal to epithelial transition. Cancer Res. (2012) 72:1384–94. doi: 10.1158/0008-5472.CAN-11-2905
81. Solito S, Marigo I, Pinton L, Damuzzo V, Mandruzzato S, Bronte V. Myeloid-derived suppressor cell heterogeneity in human cancers. Ann N Y Acad Sci. (2014) 1319:47–65. doi: 10.1111/nyas.12469
82. Weide B, Martens A, Zelba H, Stutz C, Derhovanessian E, Di Giacomo AM, et al. Myeloid-derived suppressor cells predict survival of patients with advanced melanoma: comparison with regulatory T cells and NY-ESO-1- or melan-A-specific T cells. Clin Cancer Res. (2014) 20:1601–9. doi: 10.1158/1078-0432.CCR-13-2508
83. Filipazzi P, Huber V, Rivoltini L. Phenotype, function and clinical implications of myeloid-derived suppressor cells in cancer patients. Cancer Immunol Immunother (2012) 61:255–63. doi: 10.1007/s00262-011-1161-9
84. Gabrilovich D. Mechanisms and functional significance of tumour-induced dendritic-cell defects. Nat Rev Immunol. (2004) 4:941–52. doi: 10.1038/nri1498
85. Pinzon-Charry A, Maxwell T, Lopez JA. Dendritic cell dysfunction in cancer: a mechanism for immunosuppression. Immunol Cell Biol. (2005) 83:451–61. doi: 10.1111/j.1440-1711.2005.01371.x
86. Yang M, Ma C, Liu S, Shao Q, Gao W, Song B, et al. HIF-dependent induction of adenosine receptor A2b skews human dendritic cells to a Th2-stimulating phenotype under hypoxia. Immunol Cell Biol. (2010) 88:165–71. doi: 10.1038/icb.2009.77
87. Elia AR, Cappello P, Puppo M, Fraone T, Vanni C, Eva A, et al. Human dendritic cells differentiated in hypoxia down-modulate antigen uptake and change their chemokine expression profile. J Leukoc Biol. (2008) 84:1472–82. doi: 10.1189/jlb.0208082
88. Wang RF. CD8+ regulatory T cells, their suppressive mechanisms, and regulation in cancer. Hum Immunol. (2008) 69:811–4. doi: 10.1016/j.humimm.2008.08.276
89. Jarnicki AG, Lysaght J, Todryk S, Mills KH. Suppression of antitumor immunity by IL-10 and TGF-beta-producing T cells infiltrating the growing tumor: influence of tumor environment on the induction of CD4+ and CD8+ regulatory T cells. J Immunol. (2006) 177:896–904. doi: 10.4049/jimmunol.177.2.896
90. Gilliet M, Liu YJ. Generation of human CD8 T regulatory cells by CD40 ligand-activated plasmacytoid dendritic cells. J Exp Med. (2002)195:695–704. doi: 10.1084/jem.20011603
91. Gobert M, Treilleux I, Bendriss-Vermare N, Bachelot T, Goddard-Leon S, Arfi V, et al. Regulatory T cells recruited through CCL22/CCR4 are selectively activated in lymphoid infiltrates surrounding primary breast tumors and lead to an adverse clinical outcome. Cancer Res. (2009) 69:2000–9. doi: 10.1158/0008-5472.CAN-08-2360
92. Chang DH, Deng H, Matthews P, Krasovsky J, Ragupathi G, Spisek R, et al. Inflammation-associated lysophospholipids as ligands for CD1d-restricted T cells in human cancer. Blood (2008)112:1308–16. doi: 10.1182/blood-2008-04-149831
93. Terabe M, Matsui S, Park JM, Mamura M, Noben-Trauth N, Donaldson DD, et al. Transforming growth factor-beta production and myeloid cells are an effector mechanism through which CD1d-restricted T cells block cytotoxic T lymphocyte-mediated tumor immunosurveillance: abrogation prevents tumor recurrence. J Exp Med. (2003) 198:1741–52. doi: 10.1084/jem.20022227
94. Ostrand-Rosenberg S. Immune surveillance: a balance between protumor and antitumor immunity. Curr Opin Genet Dev. (2008) 18:11–8. doi: 10.1016/j.gde.2007.12.007
95. Schreiber RD, Old LJ, Smyth MJ. Cancer immunoediting: integrating immunity's roles in cancer suppression and promotion. Science (2011) 331:1565–70. doi: 10.1126/science.1203486
96. Couzin-Frankel J. Cancer immunotherapy. Science (2013) 342:1432–3. doi: 10.1126/science.342.6165.1432
97. Sharma P, Hu-Lieskovan S, Wargo JA, Ribas A. Primary, adaptive, and acquired resistance to cancer immunotherapy. Cell (2017) 168:707–23. doi: 10.1016/j.cell.2017.01.017
99. Bethune MT, Joglekar AV. Personalized T cell-mediated cancer immunotherapy: progress and challenges. Curr Opin Biotechnol. (2017) 48:142–52. doi: 10.1016/j.copbio.2017.03.024
100. Draghiciu O, Lubbers J, Nijman HW, Daemen T. Myeloid derived suppressor cells-An overview of combat strategies to increase immunotherapy efficacy. Oncoimmunology (2015) 4:e954829. doi: 10.4161/21624011.2014.954829
101. Krysko DV, Garg AD, Kaczmarek A, Krysko O, Agostinis P, Vandenabeele P. Immunogenic cell death and DAMPs in cancer therapy. Nat Rev Cancer (2012) 12:860–75. doi: 10.1038/nrc3380
102. Tan S, Zhang CW, Gao GF. Seeing is believing: anti-PD-1/PD-L1 monoclonal antibodies in action for checkpoint blockade tumor immunotherapy. Signal Transduct Target Ther. (2016) 1:16029. doi: 10.1038/sigtrans.2016.29
103. Leung J, Suh WK. The CD28-B7 family in anti-tumor immunity: emerging concepts in cancer immunotherapy. Immune Netw. (2014) 14:265–76. doi: 10.4110/in.2014.14.6.265
104. Fucikova J, Kralikova P, Fialova A, Brtnicky T, Rob L, Bartunkova J, et al. Human tumor cells killed by anthracyclines induce a tumor-specific immune response. Cancer Res. (2011) 71:4821–33. doi: 10.1158/0008-5472.CAN-11-0950
105. West AC, Mattarollo SR, Shortt J, Cluse LA, Christiansen AJ, Smyth MJ, et al. An intact immune system is required for the anticancer activities of histone deacetylase inhibitors. Cancer Res. (2013) 73:7265–76. doi: 10.1158/0008-5472.CAN-13-0890
106. Burkholder B, Huang RY, Burgess R, Luo S, Jones VS, Zhang W, et al. Tumor-induced perturbations of cytokines and immune cell networks. Biochim Biophys Acta (2014) 1845:182–201. doi: 10.1016/j.bbcan.2014.01.004
107. Salgado R, Denkert C, Demaria S, Sirtaine N, Klauschen F, Pruneri G, et al. The evaluation of tumor-infiltrating lymphocytes (TILs) in breast cancer: recommendations by an International TILs Working Group 2014. Ann Oncol. (2015) 26:259–71. doi: 10.1093/annonc/mdu450
108. De Simone M, Arrigoni A, Rossetti G, Gruarin P, Ranzani V, Politano C, et al. Transcriptional landscape of human tissue lymphocytes unveils uniqueness of tumor-infiltrating T regulatory cells. Immunity (2016) 45:1135–47. doi: 10.1016/j.immuni.2016.10.021
109. Liu Z, Li M, Jiang Z, Wang X. A comprehensive immunologic portrait of triple-negative breast cancer. Transl Oncol. (2018) 11:311–29. doi: 10.1016/j.tranon.2018.01.011
110. Plitas G, Konopacki C, Wu K, Bos PD, Morrow M, Putintseva EV, et al. Regulatory T cells exhibit distinct features in human breast cancer. Immunity (2016) 45:1122–34. doi: 10.1016/j.immuni.2016.10.032
111. Chung W, Eum HH, Lee HO, Lee KM, Lee HB, Kim KT, et al. Single-cell RNA-seq enables comprehensive tumour and immune cell profiling in primary breast cancer. Nat Commun (2017) 8:15081. doi: 10.1038/ncomms15081
112. Tirosh I, Izar B, Prakadan SM, Wadsworth MH II, Treacy D, Trombetta JJ, et al. Dissecting the multicellular ecosystem of metastatic melanoma by single-cell RNA-seq. Science (2016) 352:189–96. doi: 10.1126/science.aad0501
113. Zheng C, Zheng L, Yoo JK, Guo H, Zhang Y, Guo X, et al. Landscape of infiltrating T cells in liver cancer revealed by single-cell sequencing. Cell (2017) 169:1342–56 e16. doi: 10.1016/j.cell.2017.05.035
114. Azizi E, Carr AJ, Plitas G, Cornish AE, Konopacki C, Prabhakaran S, et al. Single-cell map of diverse immune phenotypes in the breast tumor microenvironment. Cell (2018) 174:1293–308 e36. doi: 10.1016/j.cell.2018.05.060
115. Guo X, Zhang Y, Zheng L, Zheng C, Song J, Zhang Q, et al. Global characterization of T cells in non-small-cell lung cancer by single-cell sequencing. Nat Med. (2018) 24:978–85. doi: 10.1038/s41591-018-0045-3
116. Lambrechts D, Wauters E, Boeckx B, Aibar S, Nittner D, Burton O, et al. Phenotype molding of stromal cells in the lung tumor microenvironment. Nat Med. (2018) 24:1277–89. doi: 10.1038/s41591-018-0096-5
117. Savas P, Virassamy B, Ye C, Salim A, Mintoff CP, Caramia F, et al. Single-cell profiling of breast cancer T cells reveals a tissue-resident memory subset associated with improved prognosis. Nat Med. (2018) 24:986–93. doi: 10.1038/s41591-018-0078-7
118. Law AM, Lim E, Ormandy CJ, Gallego-Ortega D. The innate and adaptive infiltrating immune systems as targets for breast cancer immunotherapy. Endocr Relat Cancer (2017) 24:R123–44. doi: 10.1530/ERC-16-0404
119. Yang R, Cai Z, Zhang Y, Yutzy WHT, Roby KF, Roden RB. CD80 in immune suppression by mouse ovarian carcinoma-associated Gr-1+CD11b+ myeloid cells. Cancer Res. (2006) 66:6807–15. doi: 10.1158/0008-5472.CAN-05-3755
120. Maenhout SK, Thielemans K, Aerts JL. Location, location, location: functional and phenotypic heterogeneity between tumor-infiltrating and non-infiltrating myeloid-derived suppressor cells. Oncoimmunology (2014) 3:e956579. doi: 10.4161/21624011.2014.956579
121. Granot Z, Henke E, Comen EA, King TA, Norton L, Benezra R. Tumor entrained neutrophils inhibit seeding in the premetastatic lung. Cancer Cell (2011) 20:300–14. doi: 10.1016/j.ccr.2011.08.012
122. Costello JC, Heiser LM, Georgii E, Gonen M, Menden MP, Wang NJ, et al. A community effort to assess and improve drug sensitivity prediction algorithms. Nat Biotechnol. (2014) 32:1202–12. doi: 10.1038/nbt.2877
123. Tomczak K, Czerwinska P, Wiznerowicz M. The Cancer Genome Atlas (TCGA): an immeasurable source of knowledge. Contemp Oncol. (2015) 19:A68–77. doi: 10.5114/wo.2014.47136
125. Robertson AG, Shih J, Yau C, Gibb EA, Oba J, Mungall KL, et al. Integrative analysis identifies four molecular and clinical subsets in uveal melanoma. Cancer Cell (2017) 32:204–20 e15. doi: 10.1016/j.ccell.2017.07.003
126. Ceccarelli M, Barthel FP, Malta TM, Sabedot TS, Salama SR, Murray BA, et al. Molecular profiling reveals biologically discrete subsets and pathways of progression in diffuse glioma. Cell (2016) 164:550–63. doi: 10.1016/j.cell.2015.12.028
127. Cancer Genome Atlas Research Network. Integrated genomic and molecular characterization of cervical cancer. Nature (2017) 543:378–84. doi: 10.1038/nature21386
129. Druker BJ, Guilhot F, O'Brien SG, Gathmann I, Kantarjian H, Gattermann N, et al. Five-year follow-up of patients receiving imatinib for chronic myeloid leukemia. N Engl J Med. (2006) 355:2408–17. doi: 10.1056/NEJMoa062867
130. Heiser LM, Sadanandam A, Kuo WL, Benz SC, Goldstein TC, Ng S, et al. Subtype and pathway specific responses to anticancer compounds in breast cancer. Proc Natl Acad Sci USA. (2012) 109:2724–9. doi: 10.1073/pnas.1018854108
131. Perou CM, Sorlie T, Eisen MB, van de Rijn M, Jeffrey SS, Rees CA, et al. Molecular portraits of human breast tumours. Nature (2000) 406:747–52. doi: 10.1038/35021093
132. Bertucci F, Finetti P, Rougemont J, Charafe-Jauffret E, Cervera N, Tarpin C, et al. Gene expression profiling identifies molecular subtypes of inflammatory breast cancer. Cancer Res. (2005) 65:2170–8. doi: 10.1158/0008-5472.CAN-04-4115
133. Desmedt C, Haibe-Kains B, Wirapati P, Buyse M, Larsimont D, Bontempi G, et al. Biological processes associated with breast cancer clinical outcome depend on the molecular subtypes. Clin Cancer Res. (2008) 14:5158–65. doi: 10.1158/1078-0432.CCR-07-4756
134. Rouzier R, Perou CM, Symmans WF, Ibrahim N, Cristofanilli M, Anderson K, et al. Breast cancer molecular subtypes respond differently to preoperative chemotherapy. Clin Cancer Res. (2005) 11:5678–85. doi: 10.1158/1078-0432.CCR-04-2421
135. Sorlie T, Perou CM, Tibshirani R, Aas T, Geisler S, Johnsen H, et al. Gene expression patterns of breast carcinomas distinguish tumor subclasses with clinical implications. Proc Natl Acad Sci USA. (2001) 98:10869–74. doi: 10.1073/pnas.191367098
136. van't Veer LJ, Dai H, van de Vijver MJ, He YD, Hart AA, Mao M, et al. Gene expression profiling predicts clinical outcome of breast cancer. Nature (2002) 415:530–6. doi: 10.1038/415530a
137. Yang XR, Sherman ME, Rimm DL, Lissowska J, Brinton LA, Peplonska B, et al. Differences in risk factors for breast cancer molecular subtypes in a population-based study. Cancer Epidemiol Biomarkers Prev. (2007) 16:439–43. doi: 10.1158/1055-9965.EPI-06-0806
138. Parker JS, Mullins M, Cheang MC, Leung S, Voduc D, Vickery T, et al. Supervised risk predictor of breast cancer based on intrinsic subtypes. J Clin Oncol. (2009) 27:1160–7. doi: 10.1200/JCO.2008.18.1370
139. Desmedt C, Ruiz-Garcia E, Andre F. Gene expression predictors in breast cancer: current status, limitations and perspectives. Eur J Cancer (2008) 44:2714–20. doi: 10.1016/j.ejca.2008.09.011
140. Ciriello G, Gatza ML, Beck AH, Wilkerson MD, Rhie SK, Pastore A, et al. Comprehensive molecular portraits of invasive lobular breast cancer. Cell (2015) 163:506–19. doi: 10.1016/j.cell.2015.09.033
141. Cancer Genome Atlas N. Comprehensive molecular portraits of human breast tumours. Nature (2012) 490:61–70. doi: 10.1038/nature11412
142. Valdes-Mora F, Lee HJ. Single-Cell Genomics and Epigenomics. Berlin; Heidelberg: Springer (2016).p. 257–301. doi: 10.1007/978-3-662-49118-8_10
143. Jaitin DA, Kenigsberg E, Keren-Shaul H, Elefant N, Paul F, Zaretsky I, et al. Massively parallel single-cell RNA-seq for marker-free decomposition of tissues into cell types. Science (2014) 343:776–9. doi: 10.1126/science.1247651
144. Macosko EZ, Basu A, Satija R, Nemesh J, Shekhar K, Goldman M, et al. Highly parallel genome-wide expression profiling of individual cells using nanoliter droplets. Cell (2015) 161:1202–14. doi: 10.1016/j.cell.2015.05.002
145. Klein AM, Mazutis L, Akartuna I, Tallapragada N, Veres A, Li V, et al. Droplet barcoding for single-cell transcriptomics applied to embryonic stem cells. Cell (2015) 161:1187–201. doi: 10.1016/j.cell.2015.04.044
146. Han X, Wang R, Zhou Y, Fei L, Sun H, Lai S, et al. Mapping the mouse cell atlas by microwell-seq. Cell (2018) 172:1091–107 e17. doi: 10.1016/j.cell.2018.02.001
147. Gierahn TM, Wadsworth MH II, Hughes TK, Bryson BD, Butler A, Satija R, et al. Seq-Well: portable, low-cost RNA sequencing of single cells at high throughput. Nat Methods (2017) 14:395–8. doi: 10.1038/nmeth.4179
148. Gao R, Kim C, Sei E, Foukakis T, Crosetto N, Chan LK, et al. Nanogrid single-nucleus RNA sequencing reveals phenotypic diversity in breast cancer. Nat Commun. (2017) 8:228. doi: 10.1038/s41467-017-00244-w
149. Picelli S, Bjorklund AK, Faridani OR, Sagasser S, Winberg G, Sandberg R. Smart-seq2 for sensitive full-length transcriptome profiling in single cells. Nat Methods (2013) 10:1096–8. doi: 10.1038/nmeth.2639
150. Patel AP, Tirosh I, Trombetta JJ, Shalek AK, Gillespie SM, Wakimoto H, et al. Single-cell RNA-seq highlights intratumoral heterogeneity in primary glioblastoma. Science (2014) 344:1396–401. doi: 10.1126/science.1254257
151. Tirosh I, Venteicher AS, Hebert C, Escalante LE, Patel AP, Yizhak K, et al. Single-cell RNA-seq supports a developmental hierarchy in human oligodendroglioma. Nature (2016) 539:309–13. doi: 10.1038/nature20123
152. Hou Y, Guo H, Cao C, Li X, Hu B, Zhu P, et al. Single-cell triple omics sequencing reveals genetic, epigenetic, and transcriptomic heterogeneity in hepatocellular carcinomas. Cell Res. (2016) 26:304–19. doi: 10.1038/cr.2016.23
153. Kim KT, Lee HW, Lee HO, Song HJ, da Jeong E, Shin S, et al. Application of single-cell RNA sequencing in optimizing a combinatorial therapeutic strategy in metastatic renal cell carcinoma. Genome Biol. (2016) 17:80. doi: 10.1186/s13059-016-0945-9
154. Kim KT, Lee HW, Lee HO, Kim SC, Seo YJ, Chung W, et al. Single-cell mRNA sequencing identifies subclonal heterogeneity in anti-cancer drug responses of lung adenocarcinoma cells. Genome Biol. (2015) 16L127. doi: 10.1186/s13059-015-0692-3
155. Giustacchini A, Thongjuea S, Barkas N, Woll PS, Povinelli BJ, Booth AG, et al. Single-cell transcriptomics uncovers distinct molecular signatures of stem cells in chronic myeloid leukemia. Nat Med. (2017) 23:692–702. doi: 10.1038/nm.4336
156. Kim C, Gao R, Sei E, Brandt R, Hartman J, Hatschek T, et al. Chemoresistance evolution in triple-negative breast cancer delineated by single-cell sequencing. Cell (2018) 173:879–93 e13. doi: 10.1016/j.cell.2018.03.041
157. Muller S, Kohanbash G, Liu SJ, Alvarado B, Carrera D, Bhaduri A, et al. Single-cell profiling of human gliomas reveals macrophage ontogeny as a basis for regional differences in macrophage activation in the tumor microenvironment. Genome Biol (2017) 18:234. doi: 10.1186/s13059-017-1362-4
158. Puram SV, Tirosh I, Parikh AS, Patel AP, Yizhak K, Gillespie S, et al. Single-cell transcriptomic analysis of primary and metastatic tumor ecosystems in head and neck cancer. Cell (2017) 171:1611–24 e24. doi: 10.1016/j.cell.2017.10.044
159. Li H, Courtois ET, Sengupta D, Tan Y, Chen KHJ, Goh JL, et al. Reference component analysis of single-cell transcriptomes elucidates cellular heterogeneity in human colorectal tumors. Nat Genet. (2017) 49:708–18. doi: 10.1038/ng.3818
160. Ramskold D, Luo S, Wang YC, Li R, Deng Q, Faridani OR, et al. Full-length mRNA-Seq from single-cell levels of RNA and individual circulating tumor cells. Nat Biotechnol. (2012) 30:777–82. doi: 10.1038/nbt.2282
161. Picelli S, Faridani OR, Bjorklund AK, Winberg G, Sagasser S, Sandberg R. Full-length RNA-seq from single cells using Smart-seq2. Nat Protoc. (2014) 9:171–81. doi: 10.1038/nprot.2014.006
162. Tang F, Barbacioru C, Nordman E, Li B, Xu N, Bashkirov VI, et al. RNA-Seq analysis to capture the transcriptome landscape of a single cell. Nat Protoc. (2010) 5:516–35. doi: 10.1038/nprot.2009.236
163. Julien S, Merino-Trigo A, Lacroix L, Pocard M, Goere D, Mariani P, et al. Characterization of a large panel of patient-derived tumor xenografts representing the clinical heterogeneity of human colorectal cancer. Clin Cancer Res. (2012) 18:5314–28. doi: 10.1158/1078-0432.CCR-12-0372
164. Kreso A, O'Brien CA, van Galen P, Gan OI, Notta F, Brown AM, et al. Variable clonal repopulation dynamics influence chemotherapy response in colorectal cancer. Science (2013) 339:543–8. doi: 10.1126/science.1227670
165. Zheng GX, Terry JM, Belgrader P, Ryvkin P, Bent ZW, Wilson R, et al. Massively parallel digital transcriptional profiling of single cells. Nat Commun. (2017) 8:14049. doi: 10.1038/ncomms14049
166. Baran-Gale J, Chandra T, Kirschner K. Experimental design for single-cell RNA sequencing. Brief Funct Genomics (2018) 17:233–9. doi: 10.1093/bfgp/elx035
167. Hashimshony T, Senderovich N, Avital G, Klochendler A, de Leeuw Y, Anavy L, et al. CEL-Seq2: sensitive highly-multiplexed single-cell RNA-Seq. Genome Biol. (2016) 17:77. doi: 10.1186/s13059-016-0938-8
168. Habib N, Avraham-Davidi I, Basu A, Burks T, Shekhar K, Hofree M, et al. Massively parallel single-nucleus RNA-seq with DroNc-seq. Nat Methods (2017) 14:955–8. doi: 10.1038/nmeth.4407
169. Cao J, Packer JS, Ramani V, Cusanovich DA, Huynh C, Daza R, et al. Comprehensive single-cell transcriptional profiling of a multicellular organism. Science (2017) 357:661–7. doi: 10.1126/science.aam8940
170. Rosenberg AB, Roco CM, Muscat RA, Kuchina A, Sample P, Yao Z, et al. Single-cell profiling of the developing mouse brain and spinal cord with split-pool barcoding. Science (2018) 360:176–82. doi: 10.1126/science.aam8999
171. Livesey FJ. Strategies for microarray analysis of limiting amounts of RNA. Brief Funct Genomic Proteomic (2003) 2:31–6. doi: 10.1093/bfgp/2.1.31
172. Kivioja T, Vaharautio A, Karlsson K, Bonke M, Enge M, Linnarsson S, et al. Counting absolute numbers of molecules using unique molecular identifiers. Nat Methods (2011) 9:72–4. doi: 10.1038/nmeth.1778
173. Shekhar K, Lapan SW, Whitney IE, Tran NM, Macosko EZ, Kowalczyk M, et al. Comprehensive classification of retinal bipolar neurons by single-cell transcriptomics. Cell (2016) 166:1308–23 e30. doi: 10.1016/j.cell.2016.07.054
174. Paul F, Arkin Y, Giladi A, Jaitin DA, Kenigsberg E, Keren-Shaul H, et al. Transcriptional heterogeneity and lineage commitment in myeloid progenitors. Cell (2015) 163:1663–77. doi: 10.1016/j.cell.2015.11.013
175. Soumillon M, Cacchiarelli D, Semrau S, van Oudenaarden A, Mikkelsen T. Characterization of directed differentiation by high-throughput single-cell RNA-Seq. bioRxiv [Preprint] (2014). doi: 10.1101/003236
176. Zappia L, Phipson B, Oshlack A. Exploring the single-cell RNA-seq analysis landscape with the scRNA-tools database. PLoS Comput Biol. (2018) 14:e1006245. doi: 10.1371/journal.pcbi.1006245
177. Nguyen A, Khoo WH, Moran I, Croucher PI, Phan TG. Single cell RNA sequencing of rare immune cell populations. Front Immunol. (2018) 9:1553. doi: 10.3389/fimmu.2018.01553
178. Schelker M, Feau S, Du J, Ranu N, Klipp E, MacBeath G, et al. Estimation of immune cell content in tumour tissue using single-cell RNA-seq data. Nat Commun. (2017) 8:2032. doi: 10.1038/s41467-017-02289-3
179. Onuchic V, Hartmaier RJ, Boone DN, Samuels ML, Patel RY, White WM, et al. Epigenomic Deconvolution of breast tumors reveals metabolic coupling between constituent cell types. Cell Rep. (2016) 17:2075–86. doi: 10.1016/j.celrep.2016.10.057
180. Brosseau JP, Lucier JF, Nwilati H, Thibault P, Garneau D, Gendron D, et al. Tumor microenvironment-associated modifications of alternative splicing. RNA (2014) 20:189–201. doi: 10.1261/rna.042168.113
181. Climente-Gonzalez H, Porta-Pardo E, Godzik A, Eyras E. The functional impact of alternative splicing in cancer. Cell Rep. (2017) 20:2215–26. doi: 10.1016/j.celrep.2017.08.012
182. Martinez NM, Lynch KW. Control of alternative splicing in immune responses: many regulators, many predictions, much still to learn. Immunol Rev. (2013) 253:216–36. doi: 10.1111/imr.12047
183. Oltean S, Bates DO. Hallmarks of alternative splicing in cancer. Oncogene (2014) 33:5311–8. doi: 10.1038/onc.2013.533
184. Schaub A, Glasmacher E. Splicing in immune cells-mechanistic insights and emerging topics. Int Immunol. (2017) 29:173–81. doi: 10.1093/intimm/dxx026
185. Sotillo E, Barrett DM, Black KL, Bagashev A, Oldridge D, Wu G, et al. Convergence of acquired mutations and alternative splicing of CD19 enables resistance to CART-19 immunotherapy. Cancer Discov. (2015) 5:1282–95. doi: 10.1158/2159-8290.CD-15-1020
186. Laver T, Harrison J, O'Neill PA, Moore K, Farbos A, Paszkiewicz K, et al. Assessing the performance of the Oxford Nanopore Technologies MinION. Biomol Detect Quantif. (2015) 3:1–8. doi: 10.1016/j.bdq.2015.02.001
187. McCarthy A. Third generation DNA sequencing: pacific biosciences' single molecule real time technology. Chem Biol. (2010) 17:675–6. doi: 10.1016/j.chembiol.2010.07.004
188. Reuter JA, Spacek DV, Snyder MP. High-throughput sequencing technologies. Mol Cell (2015) 58:586–97. doi: 10.1016/j.molcel.2015.05.004
189. Rhoads A, Au KF. PacBio sequencing and its applications. Genomics Proteomics Bioinformatics (2015) 13:278–89. doi: 10.1016/j.gpb.2015.08.002
190. Weirather JL, de Cesare M, Wang Y, Piazza P, Sebastiano V, Wang XJ, et al. Comprehensive comparison of Pacific biosciences and oxford nanopore technologies and their applications to transcriptome analysis. F1000Res. (2017) 6:100. doi: 10.12688/f1000research.10571.2
191. Lu H, Giordano F, Ning Z. Oxford nanopore MinION sequencing and genome assembly. Genomics Proteomics Bioinformatics (2016) 14:265–79. doi: 10.1016/j.gpb.2016.05.004
192. Byrne A, Beaudin AE, Olsen HE, Jain M, Cole C, Palmer T, et al. Nanopore long-read RNAseq reveals widespread transcriptional variation among the surface receptors of individual B cells. Nat Commun. (2017) 8:16027. doi: 10.1038/ncomms16027
193. Macaulay IC, Haerty W, Kumar P, Li YI, Hu TX, Teng MJ, et al. G&T-seq: parallel sequencing of single-cell genomes and transcriptomes. Nat Methods (2015) 12:519–22. doi: 10.1038/nmeth.3370
194. Trapnell C, Cacchiarelli D, Grimsby J, Pokharel P, Li S, Morse M, et al. The dynamics and regulators of cell fate decisions are revealed by pseudotemporal ordering of single cells. Nat Biotechnol. (2014) 32:381–6. doi: 10.1038/nbt.2859
195. Herring CA, Banerjee A, McKinley ET, Simmons AJ, Ping J, Roland JT, et al. Unsupervised trajectory analysis of single-cell RNA-Seq and imaging data reveals alternative tuft cell origins in the gut. Cell Syst. (2018) 6:37–51 e9. doi: 10.1016/j.cels.2017.10.012
196. Bendall SC, Davis KL, Amir el AD, Tadmor MD, Simonds EF, Chen TJ, et al. Single-cell trajectory detection uncovers progression and regulatory coordination in human B cell development. Cell (2014) 157:714–25. doi: 10.1016/j.cell.2014.04.005
197. Lummertz da Rocha E, Rowe RG, Lundin V, Malleshaiah M, Jha DK, Rambo CR, et al. Reconstruction of complex single-cell trajectories using CellRouter. Nat Commun. (2018) 9:892. doi: 10.1038/s41467-018-03214-y
198. Yuan GC, Cai L, Elowitz M, Enver T, Fan G, Guo G, et al. Challenges and emerging directions in single-cell analysis. Genome Biol. (2017) 18:84. doi: 10.1186/s13059-017-1218-y
199. Skylaki S, Hilsenbeck O, Schroeder T. Challenges in long-term imaging and quantification of single-cell dynamics. Nat Biotechnol. (2016) 34:1137–44. doi: 10.1038/nbt.3713
200. Lubeck E, Coskun AF, Zhiyentayev T, Ahmad M, Cai L. Single-cell in situ RNA profiling by sequential hybridization. Nat Methods (2014) 11:360–1. doi: 10.1038/nmeth.2892
201. Chen KH, Boettiger AN, Moffitt JR, Wang S, Zhuang X. RNA imaging. Spatially resolved, highly multiplexed RNA profiling in single cells. Science (2015) 348:aaa6090. doi: 10.1126/science.aaa6090
202. Lee JH, Daugharthy ER, Scheiman J, Kalhor R, Ferrante TC, Terry R, et al. Fluorescent in situ sequencing (FISSEQ) of RNA for gene expression profiling in intact cells and tissues. Nat Protoc. (2015) 10:442–58. doi: 10.1038/nprot.2014.191
Keywords: ScRNA-seq, tumor immunology, MDSCs, tumor heterogeneity, stroma, single-cell transcriptomics
Citation: Valdes-Mora F, Handler K, Law AMK, Salomon R, Oakes SR, Ormandy CJ and Gallego-Ortega D (2018) Single-Cell Transcriptomics in Cancer Immunobiology: The Future of Precision Oncology. Front. Immunol. 9:2582. doi: 10.3389/fimmu.2018.02582
Received: 05 June 2018; Accepted: 19 October 2018;
Published: 12 November 2018.
Edited by:
Shalin Naik, Walter and Eliza Hall Institute of Medical Research, AustraliaReviewed by:
Dmitri V. Krysko, Ghent University, BelgiumNicolas Jacquelot, Walter and Eliza Hall Institute of Medical Research, Australia
Peter Sims, Columbia University, United States
Copyright © 2018 Valdes-Mora, Handler, Law, Salomon, Oakes, Ormandy and Gallego-Ortega. This is an open-access article distributed under the terms of the Creative Commons Attribution License (CC BY). The use, distribution or reproduction in other forums is permitted, provided the original author(s) and the copyright owner(s) are credited and that the original publication in this journal is cited, in accordance with accepted academic practice. No use, distribution or reproduction is permitted which does not comply with these terms.
*Correspondence: Fatima Valdes-Mora, f.valdesmora@garvan.org.au
David Gallego-Ortega, d.gallego@garvan.org.au