 Kui Cui1
 Nataly P. Podolnikova
 Valentin P. Yakubenko
- 1Department of Biomedical Sciences, Center of Excellence for Inflammation, Infectious Disease and Immunity, Quillen College of Medicine, East Tennessee State University, Johnson City, TN, United States
- 2Center for Metabolic and Vascular Biology, School of Life Sciences, Arizona State University, Tempe, AZ, United States
Chronic inflammation is essential mechanism during the development of cardiovascular and metabolic diseases. The outcome of diseases depends on the balance between the migration/accumulation of pro-inflammatory (M1) and anti-inflammatory (M2) macrophages in damaged tissue. The mechanism of macrophage migration and subsequent accumulation is still not fully understood. Currently, the amoeboid adhesion-independent motility is considered essential for leukocyte migration in the three-dimensional environment. We challenge this hypothesis by studying the contribution of leukocyte adhesive receptors, integrins αMβ2, and αDβ2, to three-dimensional migration of M1-polarized, M2-polarized, and resident macrophages. Both integrins have a moderate expression on M2 macrophages, while αDβ2 is upregulated on M1 and αMβ2 demonstrates high expression on resident macrophages. The level of integrin expression determines its contribution to macrophage migration. Namely, intermediate expression supports macrophage migration, while a high integrin density inhibits it. Using in vitro three-dimensional migration and in vivo tracking of adoptively-transferred fluorescently-labeled macrophages during the resolution of inflammation, we found that strong adhesion of M1-activated macrophages translates to weak 3D migration, while moderate adhesion of M2-activated macrophages generates dynamic motility. Reduced migration of M1 macrophages depends on the high expression of αDβ2, since αD-deficiency decreased M1 macrophage adhesion and improved migration in fibrin matrix and peritoneal tissue. Similarly, the high expression of αMβ2 on resident macrophages prevents their amoeboid migration, which is markedly increased in αM-deficient macrophages. In contrast, αD- and αM-knockouts decrease the migration of M2 macrophages, demonstrating that moderate integrin expression supports cell motility. The results were confirmed in a diet-induced diabetes model. αD deficiency prevents the retention of inflammatory macrophages in adipose tissue and improves metabolic parameters, while αM deficiency does not affect macrophage accumulation. Summarizing, β2 integrin-mediated adhesion may inhibit amoeboid and mesenchymal macrophage migration or support mesenchymal migration in tissue, and, therefore, represents an important target to control inflammation.
Introduction
Monocyte/macrophage migration to, and accumulation within the site of inflammation are critical steps in the development of the inflammatory response. While acute inflammation is usually generated as a defensive mechanism, the development of chronic inflammation is an essential step in the initiation or progression of many devastating diseases including atherosclerosis, diabetes, obesity, arthritis and others (1–4). Macrophage accumulation at the damaged tissue is a hallmark of inflammation (5, 6). However, the particular subset of accumulated macrophages is critical for the further development or resolution of chronic inflammation. Classically activated (M1) macrophages produce a harsh pro-inflammatory response, while alternatively activated (M2) macrophages may have anti-inflammatory functions (7, 8). The balance between the accumulation of pro-inflammatory and anti-inflammatory macrophages regulates the fate of inflammation. So far, the mechanism of macrophage accumulation is not fully understood.
Macrophage accumulation at the site of inflammation depends upon monocyte recruitment, macrophage retention and emigration. Monocyte recruitment includes activation, diapedesis through the endothelial monolayer (2D migration) (9, 10), and migration through the extracellular matrix to the site of inflammation (3D migration). While the role of leukocyte adhesive receptors in 2D migration is well-established (9, 11), their contribution to macrophage migration through 3D extracellular matrix (ECM) is still unclear. Macrophages utilize two types of motility in a 3D environment—amoeboid and mesenchymal. Amoeboid migration is adhesion-independent movement that is based on flowing and squeezing. This migratory mode was shown to be dominant for neutrophils, dendritic cells and lymphocytes (12). Mesenchymal migration involves the classical adhesion-mediated mechanism that includes cell protrusion and adhesion of the leading edge, followed by detachment of the trailing edge and retraction of the contractile cell rear (13). It has been shown that cell-substratum adhesiveness regulates the fate of mesenchymal cell migration. Namely, an intermediate level of adhesiveness generates the optimal conditions for cell migration (14). Low adhesiveness does not support cell motility, while a very high level of adhesiveness thwarts cell locomotion because it inhibits cell detachment from the substrate (15, 16). The density of adhesive receptors on the cell surface is one of the most critical parameters of cell-substratum adhesiveness. Therefore, a high density of cell adhesion receptors that generate a high adhesiveness may lead to the retention of cells (15, 17).
Integrins are the most important cell adhesive receptors that are involved in monocyte/macrophage migration. Of particular note is the subfamily of β2 integrins that are exclusively expressed on leukocytes and consist of four members: αLβ2 (CD11a/CD18), αMβ2 (CD11b/CD18), αXβ2 (CD11c/CD18), and αDβ2 (CD11d/CD18) (18). Integrins αMβ2 and αDβ2 are the most interesting members with regard to cell migration, since αLβ2 has no ligands in ECM (19) and αXβ2 demonstrated a very low expression on macrophages (20). In contrast, αM and αD have marked macrophage expression and share many ECM ligands (21, 22).
Different subsets of macrophages have a diverse expression of integrins (23) and, most importantly, possess different migratory characteristics (24). We hypothesize that integrin expression regulates the distinct migratory properties of M1-polarized, M2-polarized, and resident macrophages. We realize that in vitro activated M1 and M2 macrophages do not fully represent the varieties of pro-inflammatory and anti-inflammatory macrophages in vivo; however, these cells are appropriate models that can help us to understand the migratory mechanisms of different macrophage subsets during inflammatory diseases.
In our previous project, we found that the pro-atherogenic role of integrin αDβ2 depends upon the upregulation of αD on pro-inflammatory M1 macrophages in vitro and on macrophages in atherosclerotic lesions, which apparently mediates macrophage retention (23). In agreement with this, αD-deficiency reduced the development of atherosclerosis and released the migration of M1 macrophages in vitro (23).
In this paper we further develop this project by analysing the role of β2 integrins on different subsets of macrophages and attempt to depict the mechanisms that stimulate cell migration/retention based on the analysis of integrin expression, cell adhesion, secretion of proteases, and mode of cell migration. We found a strong correlation between macrophage migration and expression of αMβ2 and αDβ2. A moderate expression of αMβ2 and αDβ2 on M2 macrophages supports cell movement, while the upregulation of αDβ2 on M1 macrophages and αM on resident macrophages prevents mesenchymal and/or amoeboid migration. These results were verified by using αM- and αD-deficient macrophages in 3D in vitro migration and by using an in vivo model for the resolution of peritoneal inflammation and diet-induced diabetes.
Therefore, the regulation of β2 integrin expression may help to shift the pro-/anti- inflammatory balance at the site of inflammation and reduced the pathophysiological outcome.
Materials and Methods
Reagents and Antibodies
Reagents were purchased from Sigma-Aldrich (St. Louis, MO, United States) and Thermo Fisher Scientific (Waltham, MA, United States). Rock inhibitor (Y27632) and aprotinin were from Sigma-Aldrich. Recombinant human and mouse IFNγ, IL-4, MCP-1, and FMLP were purchased from Invitrogen Corporation (Carlsbad, CA, United States). Anti-human αD mAb (clone 240I) was generously provided by Eli Lilly Corporation (Indianapolis, IN, United States). Polyclonal antibody against the αD I-domain was described previously (10). The antibody recognizes both human and mouse αD I-domains and has no cross-reactivity with recombinant human and mouse αM, αX, and αL I-domains. The antibody was isolated from rabbit serum by affinity chromatography using αDI-domain-Sepharose. Mouse PE-cy7 and APC- conjugated anti-αM mAb (clone M1/70) and F4/80 mAbs were from eBioscience (San Diego, CA, United States). The mAb 44a directed against the human αM integrin subunit was purified from the conditioned media of the hybridoma cell line obtained from American Type Culture Collection (ATCC, Manassas, VA, United States) using protein A agarose (GE Healthcare, Piscataway, NJ, United States).
Animals
Wild type (C57BL/6J, stock # 000664) and integrin αD-deficient (B6.129S7-Itgadtm1Bll/J, stock # 005258 and integrin αM-deficient (B6.129S4-Itgamtm1Myd/J, stock # 003991) mice were bought from Jackson Laboratory (Bar Harbor, ME). αD-deficient and αM-deficient mice have been backcrossed to C57BL/6 for at least ten generations. All procedures were performed according to animal protocols approved by East Tennessee State University IACUC.
Flow Cytometry Analysis
Flow cytometry analysis was performed to assess the expression of αD and αM on mouse peritoneal macrophages. Cells were harvested and pre-incubated with 4% normal goat serum for 30 min at 4°C, then 2 × 10⁶ cells were incubated with specific antibody for 30 min at 4°C. Non-conjugated antibodies required additional incubation with Alexa 488 or PE-cy7-donkey anti-mouse IgG (at a 1:1,000 dilution) for 30 min at 4°C. Finally, the cells were washed and analyzed using a Fortessa X-20 (Becton Dickinson).
Generation of Classically Activated (M1) and Alternatively Activated (M2) Mouse Macrophages
Peritoneal macrophages from 8 to 12 week old mice (WT and , n = 3 mice per group) were harvested by lavage of the peritoneal cavity with 5 ml of sterile PBS 3 days after intraperitoneal (IP) injection of 4% thioglycollate (TG; 0.5 ml). The cells were washed twice with PBS and resuspended in complete RPMI media. The cell suspension was transferred into 100 mm petri dishes and incubated for 2 h at 37°C in humidified air containing 5% CO2 atmosphere. Non-adherent cells were washed out with RPMI media, and the adherent macrophages were replenished with RPMI media. The macrophages were differentiated to M1 and M2 phenotypes by treatment with recombinant mouse interferon-γ (IFN-γ) (100 U/ml, Thermo Fisher) and interleukin 4 (IL-4) (2 nM, Thermo Fisher), respectively, for 4 days. Medium with IFN-γ and IL-4 were changed every 2 days or as required. The M1 phenotype macrophages from WT and were labeled with red fluorescent marker PKH26 and green fluorescent marker PKH67, respectively, according to the manufacturer's instructions (Sigma-Aldrich). The fluorescently-labeled cells were dissociated from the plates using 5 mM EDTA in PBS and used for the experiments thereafter.
Cell Adhesion Assay
The adhesion assay was performed as described previously (22) with modifications. Briefly, 96-well plates (Immulon 2HB, Cambridge, MA, United States) were coated with different concentrations of fibrinogen or Matrigel for 3 h at 37°C. The wells were post-coated with 0.5% polyvinyl alcohol for 1 h at 37°C. Mouse peritoneal macrophages or HEK 293 cells transfected with αMβ2, or αDβ2 integrins were labeled with 10 μM Calcein AM (Molecular Probes, Eugene, OR) for 30 min at 37°C and washed with DMEM and resuspended in the same medium at a concentration of 1 × 10⁶ cells/mL. Aliquots (50 μL) of the labeled cells were added to each well. For inhibition experiments, cells were mixed with antibodies and incubated for 15 min at 22°C before they were added to the coated wells. After 30 min of incubation at 37°C in a 5% CO2 humidified atmosphere, the non-adherent cells were removed by washing with HBSS. The fluorescence was measured in a Synergy H1 fluorescence plate reader (BioTek, Winooski, VT, United States), and the number of adherent cells was determined from a labeled control.
Migration of Macrophages in 3D Fibrin Gel and Matrigel
The migration assay was performed as described previously (25). WT and or WT and peritoneal macrophages activated to M1 or M2 phenotype as described above were labeled with PKH26 red fluorescent dye and PKH67 green fluorescent dye, respectively. Cell migration assay was performed for 48 h at 37°C in 5% CO2 in a sterile condition. An equal number of WT and macrophages was evaluated by cytospin of mixed cells before the experiment and at the starting point before migration. Labeled WT (1.5 × 10⁵) and (1.5 × 10⁵) activated macrophages were plated on the membranes of transwell inserts with a pore size of 8 μm and 6.5 mm in diameter (Costar, Corning, NY) precoated with fibrinogen (Fg). Fibrin gel (100 μl/sample) was made by 0.75 mg/ml Fg containing 1% FBS and 1% P/S and activated by 0.5 U/ml thrombin. Matrigel (50%) was diluted by RPMI-1640 supplemented with 1% FBS and 1% P/S. 30 nM of MCP-1 (or 100 nM FMLP) were added on the top of the gel to initiate the migration. Migrating cells were detected by Leica Confocal microscope (Leica-TCS SP8) and the results were analyzed and reconstructed using IMARIS 8.0 software.
Adoptive Transfer in the Model of Resolution of Peritoneal Inflammation
Adoptive transfer was performed as described previously (23). Briefly, fluorescently-labeled WT (red PKH26 dye) and or (green PKH67 dye) M1- or M2-activated macrophages were mixed in a 1:1 ratio and further injected intraperitoneally into wildtype mice at 4 days after thioglycollate (TG)-induced inflammation. 3 days later, peritoneal macrophages were harvested with 5 ml PBS supplemented with 5 mM EDTA. The percentages of red and green fluorescent macrophages in the peritoneal exudate were assessed by fluorescence microscopy, multi-color flow cytometer (Fortessa X-20) and imaging flow cytometry (ImageStream Mark II, Amnis).
The PKH26 and PKH67 dyes were switched in one experiment to verify the effect of dye on cell migration. We did not detect any difference between two dyes. The quantification of the data was analyzed by using Image Analysis Software (EVOS, Thermo Fisher).
Adoptive Transfer in the Model of Diet-Induced Diabetes
The approach is based on previously published method (26) with some modifications. Monocytes were isolated from the bone marrow progenitors of WT and αD-deficient mice using magnetic bead separation kit (Miltenyi Biotec, Gaithersburg, MD, United States). Monocytes were labeled with red, PKH26 (WT) or green, PKH67 () fluorescent dyes. Red (1.5 × 10⁶) and green (1.5 × 10⁶) cells were mixed together and injected in tail vein of wild type C57BL6 mice fed high fat diet (45% kcal/fat) for 8 weeks. After 3 days adipose tissue was isolated, digested as described previously (26) and analyzed using FACS (Fortessa X-20, BD, United States) and imaging flow cytometry (ImageStream Mark II, Amnis).
Glucose Tolerance and Insulin Sensitivity Tests
Wild type and mice fed a high fat diet for 16 weeks were fasted overnight in a new cage containing water but no food, (~16 h). The following morning mice were weighed, and an initial blood glucose level was measured using a glucometer and blood from the tail vein. Glucose (2 grams/kg body weight of 20% D-glucose) was administered IP and at 15, 30, 60, and 120 min post injection blood glucose was again measured.
For insulin sensitivity test, mice fed a high fat diet were fasted for 5 h, starting at 7 a.m. (lights on). After fasting, mice were weighed, and the initial level of blood glucose measured as described above. Insulin (0.75 mU/g) was injected I.P. and the level of blood glucose was evaluated at 15, 30, 45, and 60 min.
Quantitative RT-PCR
Cellular mRNA was extracted from macrophages using the Qiagen Oligotex mRNA Midi Kit. mRNA was reverse transcribed with the iScript cDNA Synthesis Kit (Bio-Rad Laboratories, Inc., Hercules, CA, United States) and real-time quantitative PCR was performed using SYBR Green Supermix (Bio-Rad) on an MyIQ2 two color real-time PCR detection system (Bio-Rad), with the thermal cycler conditions suggested by the manufacturer. The sequences of integrin primers are shown below: αD forward, 5′-GGAACCGAATCAAGGTCAAGTA-3′, and reverse, 5′-ATCCATTGAGAGAGCTGAGCTG-3′. αM forward, 5′-TCCGGTAGCATCAACAACAT-3′ and reverse, 5′-GGTGAAGTGAATCCGGAACT-3′. α4 forward, 5′-AAGGAAGCCAGCGTTCATATT-3′, and reverse, 5′-TCATCATTGCTTTTGCTGTTG-3′. α5 forward, 5′-CAAGGTGACAGGACTCAGCA-3′, and reverse, 5′-GGTCTCTGGATCCAACTCCA-3′. αX forward, 5′-CTGGATAGCCTTTCTTCTGCTG-3′, and reverse, 5′-GCACACTGTGTCCGAACTCA-3′. GAPDH or 5S rRNA were used as an internal control (Ambion/Life Technologies, Grand Island, NY, United States).
Statistical Analysis
Statistical analyses were performed using Student's t-test or Student's paired t-tests where indicated in the text using SigmaPlot 13. A value of p < 0.05 was considered significant.
Results
Strong Adhesion of Classically-Activated (M1) Macrophages Is Converted in Weak Migration in Contrast to Well-migrated, but Low-Adherent Alternatively-Activated (M2) Macrophages
To evaluate the adhesive and migratory properties of M1 and M2 macrophages, we stimulated thioglycollate-induced peritoneal macrophages with IFNγ (M1-activated) or IL-4 (M2-activated) and evaluated the adhesion of these cells to fibrinogen and their migration in 3D fibrin matrix. The adhesion assay revealed a much stronger attachment of M1 macrophages (28.68 ± 5.33%) when compared to M2 macrophages (9.12 ± 2.79%) (Figure 1A). Moreover, M1 and M2 adherent cells possess different morphologies. While M1 macrophages have a rounded, flat, pancake-like shape after adhesion assay, M2 macrophages were elongated, and less spread out (Figure 1B). The development of M1 and M2 phenotypes were verified by upregulation of iNOS and ArgI, respectively (Figure 2A).
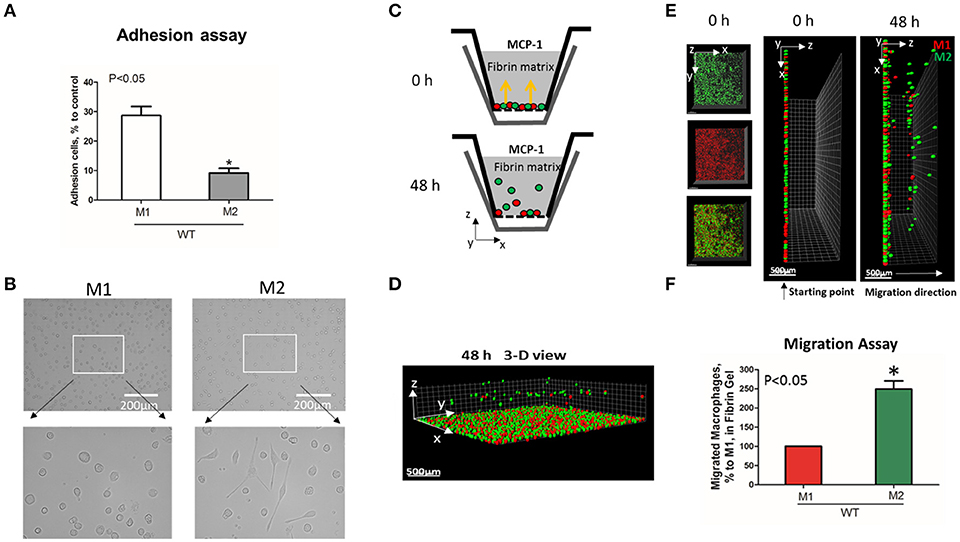
Figure 1. M1-activated macrophages demonstrate much stronger adhesive properties but weaker migration in comparison to M2-activated macrophages. (A) Adhesion assay of WT M1 and M2-activated macrophages to Fg. 96-well plate was coated with 4 μg/ml Fg for 3 h at 37°C. Fluorescently labeled M1 and M2 macrophages were added to the wells and cell adhesion was determined after 30 min in a fluorescence plate reader. Data are presented as mean ± SEM. *P < 0.05. (B) Morphologies of M1 (Left panel) and M2 (right panel) activated macrophages, scale bar = 200 μm. (C–F) 3-D migration assay in Fibrin matrix using M1 and M2 activated macrophages labeled with PKH26 (Red) and PKH67 (Green) fluorescent dyes, respectively. C. Sketch diagram of the migrating cells in Boyden transwell chamber. Before migration (upper panel) and after 48 h migration (lower panel). (D) 3-D view of the migrating cells in Fibrin matrix after 48 h. (E) Labeled Cells were mixed in equal amounts and verified by scanning samples with confocal microscope before the initiation of migration (E. left and middle panels). Migration of macrophages was stimulated by 30 nM MCP-1 added to the top of the gel. After 48 h, migrating cells were detected by a Leica Confocal microscope (E. right panel). (F) The results were analyzed by IMARIS 8.0 software and statistical analyses were performed using Student's paired t-tests (n = 4 per group). Scale bar = 500 μm. Data are presented as mean ± SEM. *P < 0.05.
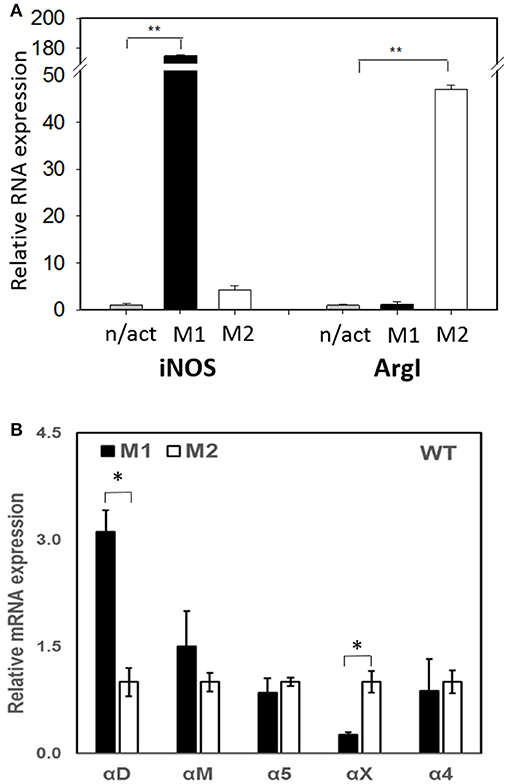
Figure 2. (A) The expression of M1 (iNOS) and M2 (Arg I) markers on IFN-γ (M1) and IL-4 (M2) stimulated macrophages using Real Time-PCR. Statistical analyses were performed using paired Student t-tests (n = 3 per group). Data are presented as mean ± SEM. **P < 0.01, compared to non-activated (n/act). (B) The expression of fibrin-binding integrins during M1 and M2 polarization. Open bars—non-activated; black bars M1-polarized, gray bars M2-polarized macrophages. Statistical analyses were performed using Student's paired t-tests (non-activated to activated) (n = 3 per group). Data are presented as mean ± SEM. *P < 0.05.
We tested how different adhesive properties affect macrophage cell migration (Figures 1C–F). Fluorescently labeled M1 (red, PKH26) and M2 (green, PKH67) macrophages were mixed in an equal number (Supplementary Figure 1A) and placed on a 3D fibrin gel where cell migration was stimulated via a MCP-1 gradient (Figures 1C,E). After 48 h, we detected a robust migration of M2 macrophages, which markedly exceeded the locomotion of M1 macrophages (Figures 1D–F). It has been shown previously that M1 and M2 macrophages demonstrate a similar chemotaxis to MCP-1 in 2D transwell assay (no ligand coated on membrane) (27). These data proved that the different migration of M1 and M2 macrophages in our 3D chemotaxis/haptokinesis assay does not regulated by different expression of CCR2 (chemotaxis), but by distinct adhesion-mediated migration (haptokinesis). To additionally verify it, the migration was repeated using a gradient of N-Formylmethionine-leucyl-phenylalanine (FMLP) and revealed similar results (Supplementary Figure 1B), therefore the adhesive receptors are potential cause of different migratory properties of M1 and M2.
The Levels of Integrin Expression Determine the Effects on Macrophage Migration
Recently, we demonstrated that integrin αD is upregulated on M1-polarized macrophages but does not change on M2-polarized macrophages (23). We evaluated the potential changes in the expression of other fibrin-binding macrophage adhesive receptors during M1 and M2 polarization (Figure 2A). The RT-PCR results demonstrated that αD is the only adhesive receptor that upregulates during M1 macrophage activation to compare with M2 subset (Figure 2B). We also detected the increased expression of integrin αX on M2 macrophages; however, the total expression of αX on macrophages is very low (20), which quashes its potential effect on macrophage migration. Therefore, the upregulation of integrin αD is the most significant modification that may affect the migratory properties of M1 and M2 macrophages.
Based on these data, further analysis was focused on integrin αD and related integrin αM, that possess similar ligand binding properties, but distinct surface expressions. The contributions of integrin αD and αM to M1 and M2 migration were evaluated using αD- and αM-deficient macrophages. αD deficiency reduced the adhesion of M1 macrophages to fibrinogen (Figure 3A), but significantly increased cell migration (Figures 3C, left panel; 3E). In contrast, integrin αM deficiency has very limited effect on adhesion, due to its moderate expression on M1 macrophages (23) (Figure 2B), and did not demonstrate a significant effect on cell locomotion (Figures 3C,E). Both integrins, αD and αM, have moderate expression on M2 macrophages (23) (Figure 2B). The adhesion of M2 macrophages depends on both integrins, which is demonstrated in the presence of antibodies and integrin-deficient cells (Figure 3B). In parallel assays, the reduced migration of αM- and αD-deficient macrophages verified that both integrins help to support the mesenchymal migration of M2 macrophages (Figures 3D,F).
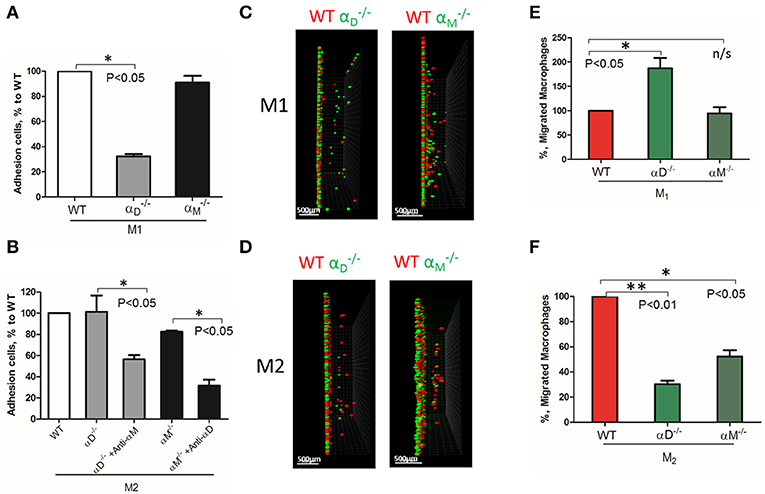
Figure 3. The level of integrin expression determines the effect on macrophage migration. (A,B) Adhesion assay to fibrinogen of WT, and macrophages activated to M1 (A) and M2 (B) phenotypes. Some samples in (B) were pre-incubated with anti-αM and anti-αD blocking antibodies before the adhesion assay. Data are presented as mean ± SEM. *P < 0.05. (C,D) Migration assay of αD- and αM-deficiency M1 (C) and M2 (D) macrophages in 3D fibrin matrix. After 48 h, migrating cells were detected by a Leica Confocal microscope and the results were analyzed by IMARIS 8.0 software, scale bar = 500 μm. (E,F) Statistical analyses were performed using Student's paired t-test (n = 4 per group). Data are presented as mean ± SEM. *P < 0.05, **P < 0.01.
The deficiency of αD or αM may also modify the expression of other fibrin-binding integrins that can affect cell migration. To test this possibility, we evaluated the expression of α4, α5, αX, and αM on , as well as αD on macrophages activated to M1 and M2 phenotypes using RT-PCR. We did not detect any marked changes, except for the reduced expression of α5 and αX on αD-deficient M1 macrophages (Supplementary Figure 2). Clearly, these changes cannot significantly modify migration.
αD-Mediated Adhesion Is Critical for the Retention of M1 Macrophages
Inflamed extracellular matrix contains different β2 ligands, including fibronectin, vitronectin, thrombospondin, fibrinogen and others. Moreover, we recently showed that oxidative stress during inflammation may form ECM protein modifications with carboxyethylpyrole, which is also a ligand for β2 integrins (25). To verify the role of αD-mediated adhesion on cell migration, we performed macrophage migration in Matrigel, the model of basement membrane matrix, which consists of laminin, collagen IV and proteoglycans. Notably, these proteins are not ligands for integrin αDβ2 or αMβ2. To confirm this, we tested the adhesion of αDβ2- and αMβ2-transfected HEK293 cells to a plate coated with Matrigel (Figure 4A). Both cell lines demonstrated strong adhesion to Matrigel, but this adhesion was independent of αD and αM, since anti-αD and anti-αM antibodies did not inhibit this binding. In contrast, the adhesion of αMβ2 and αDβ2-transfected cells to fibrinogen was significantly inhibited by these antibodies (21, 28) (Figure 4B). Apparently, the adhesion to Matrigel is mediated by integrins α1β1 and α2β1, which are receptors for laminin and collagen, and are expressed endogenously on HEK293 cells (29–31). To verify this hypothesis, we evaluated the adhesion of MOCK-transfected HEK293 cells to Matrigel and fibrinogen. These cells did not support the adhesion to fibrinogen, but demonstrated the same level of adhesion to Matrigel as αDβ2 and αMβ2 transfected cells (Figures 4A,B). Therefore, cells do not use αDβ2 for the adhesion to Matrigel. Accordingly, we detected a similar level of wild type and αD-deficient M1 macrophage migration through Matrigel, which is distinct to our data in αD-dependent fibrin matrix. Therefore, this result is in agreement with our hypothesis regarding the critical role of αD-mediated adhesion for macrophage retention during 3D migration (Figure 4C).
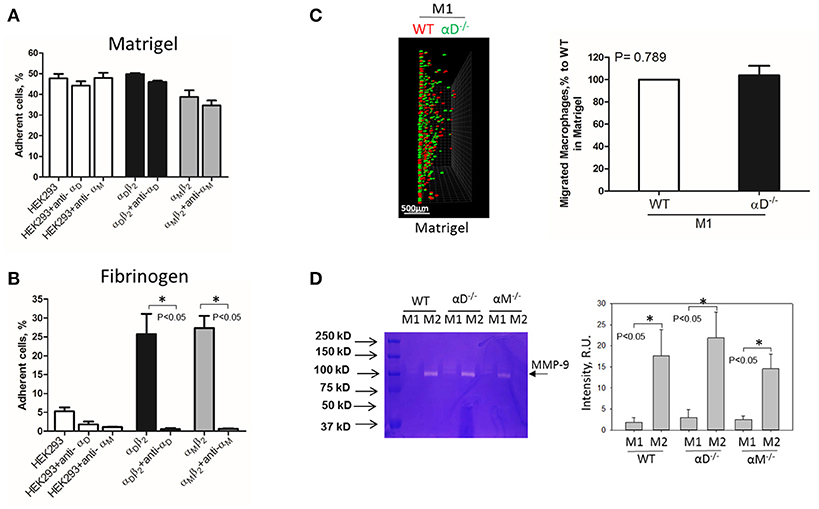
Figure 4. Matrigel does not support integrin αD-mediated adhesion and retention of M1 macrophages. (A,B) Adhesion of αDβ2- and αMβ2-transfected and mock-transfected HEK293 cells to Matrigel (A) and fibrinogen (B). The adhesion was performed as described above. Data are presented as mean ± SEM. *P < 0.05. (C) 3-D migration assay of WT and αD-deficient M1 macrophages in Matrigel. Migration was stimulated by 30 nM MCP-1 added to the top of the gel. After 48 h, migrating cells were detected by a Leica Confocal microscope (Leica-TCS SP8) (C, left panel). Scale bar = 500 μm. The results were analyzed by IMARIS 8.0 software. (C, right panel). (D) Evaluation of MMPs in culture media after macrophage adhesion. WT, and M1- and M2-activated macrophages were plated on fibrinogen. Media was collected after overnight incubation and analyzed by gelatin-zymography (D, right panel). The intensity of gelatin degradation was evaluated by Fuji software (D, left panel). Statistical analyses were performed using Student's paired t-tests (n = 4 per group). Data are presented as mean ± SEM. *P < 0.05.
However, one of the mechanisms that affects mesenchymal migration is the secretion of MMPs that degrade Matrigel. To test the potential effect of αM or αD deficiency on MMPs secretion, M1 and M2 macrophages were incubated in 48-well plates for 24 h and the media was tested using gelatin zymography as we described previously (32) (Figure 4D). First, we found a much stronger secretion of MMPs (specifically MMP-9) in M2 macrophages in comparison to M1 macrophages. Second, we did not detect any significant effect of αD- or αM-knockout on MMPs secretion, particularly in regard to M1-polarized macrophages.
Interestingly, the robust secretion of collagen-specific MMP-9 by M2 macrophages can be responsible for the strong migration of these cells in Matrigel. The migration of M1 and M2 macrophages was performed in separate gels to avoid the effect of M2-released MMP-9 on the migration of M1 macrophages (Figure 5). In contrast, similar secretion of MMPs in WT and αD-deficient M1 macrophages allowed us to compare these two cell types in one sample. Therefore, the similar migration of WT and αD macrophages in Matrigel was not regulated by a different level of MMPs secretion, but by the lack of αD-mediated adhesion.
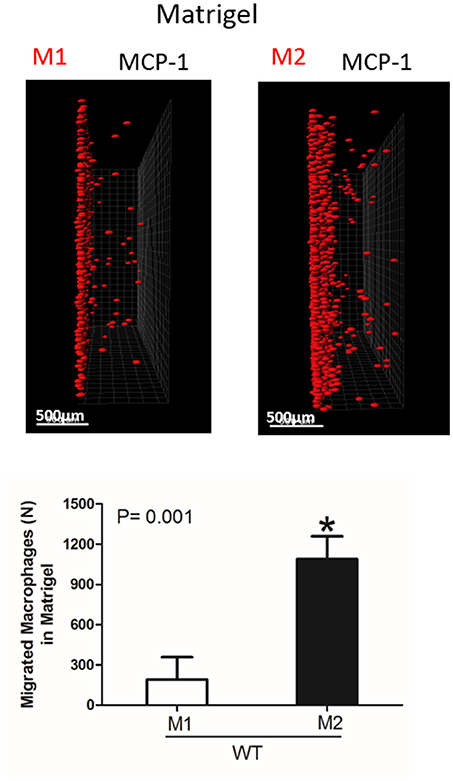
Figure 5. Migration of M1 and M2-activated macrophages in Matrigel. After 48 h, migrating cells were detected by a Leica Confocal microscope and the results were analyzed by IMARIS 8.0 software, scale bar= 500 μm. Statistical analyses were performed using Student's paired t-tests (n = 4 per group). Data are presented as mean ± SEM. *P < 0.05.
A High Expression of αM on Resident Macrophages Reduces Their Amoeboid Migration
To test the effect of high expression of other integrins on cell locomotion, we evaluated αM-dependent migration of resident macrophages. αM has a very high expression on peritoneal resident macrophages (Figure 6A). A comparable analysis of 3D migration in fibrin matrix between WT and αM-deficient resident peritoneal macrophages revealed a strong improvement in the migration of the subset (Figures 6B,C right panel). Notably, αD-deficiency, which has a very low expression on resident macrophages (Figure 6A), did not affect macrophage migration (Figures 6B,C left panel). These results demonstrated that αM at high density on the cell surface can also prevent migration. It has been shown that resident macrophages apply the amoeboid migratory mode (24). Accordingly, the migration of WT and in the presence of ROCK inhibitor, the inhibitor of amoeboid migration (33), resulted in a dramatic reduction in both the number of migrated cells and migratory distance (Figures 6B,C right panel). Therefore, macrophage adhesion-independent amoeboid migration can be reduced by integrin-mediated strong adhesion.
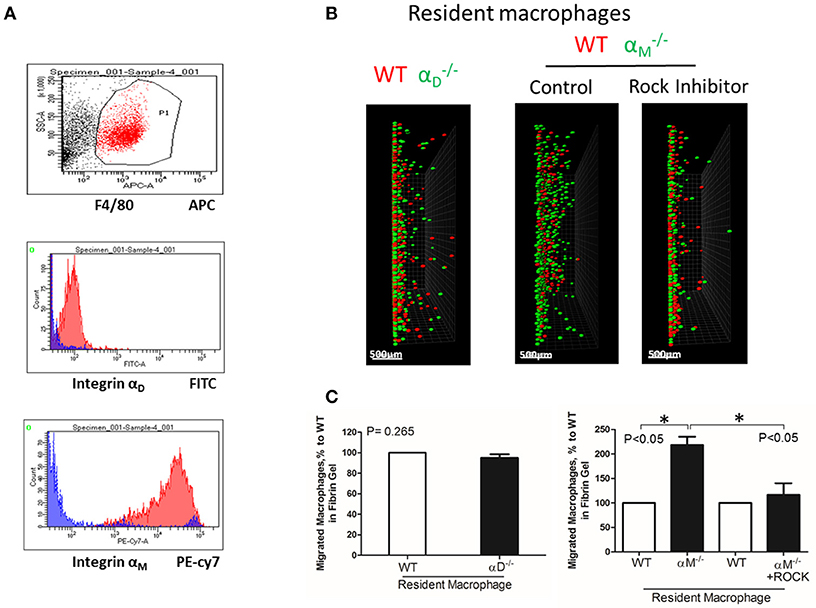
Figure 6. A high expression of αM on resident macrophages reduces their amoeboid migration. (A) The expression of integrin αD and αM on resident macrophages was detected with anti-αD and anti-αM antibodies, respectively, and tested by flow cytometry analysis. (B) Migration of peritoneal resident macrophages in 3-D fibrin matrix. Migrating resident macrophages from WT and mice are shown in the left panel. The middle and right panels represent the migrating resident macrophages from WT and mice with or without Rock inhibitor (Y27632). Migrating cells were detected by a Leica Confocal microscope (Leica-TCS SP8). Scale bar = 500 μm. (C) The results were analyzed by IMARIS 8.0 software. Statistical analyses were performed using Student's paired t-tests (n = 4 per group). Data are presented as mean ± SEM. *P < 0.05.
In Vivo Migration of M1, M2, and Resident Macrophages Confirmed the Results of the 3D Migration Assays
To verify our in vitro results, we performed in vivo migration using the model of resolution of peritoneal inflammation as we have done previously (23). After the development of thioglycollate-induced peritoneal inflammation, macrophages migrate to, and accumulate within, the peritoneal cavity. The resolution of inflammation is started after 96 h and is characterized by the intensive emigration of macrophages from the peritoneal cavity to the lymphatics (34). We injected adoptively transferred M1 and M2 macrophages to assess their migratory properties in the in vivo environment (Figure 7A). In vitro-activated M1 and M2 macrophages were labeled with PKH26 and PKH67 fluorescent dyes, respectively. The recipient mice were first injected with thioglycollate and then, 96 h later, with an equal number of fluorescently labeled M1 and M2 macrophages. After an additional 72 h, the cells from the peritoneal cavity were collected and the number of M1 and M2 adoptively transferred macrophages was evaluated. The cytospin of harvested samples demonstrated the preferential accumulation of M1 macrophages (red fluorescence) in the peritoneal cavity (Figure 7B and Supplementary Figure 3), which corresponds to our in vitro migration assays (Figures 1D–F). Our FACS data confirmed these results, since mostly M1 macrophages reside in the peritoneal cavity, while M2 macrophages emigrate during resolution (5.02 ± 0.31% vs. 2.57 ± 0.41%) (Figure 7C). The Amnis imaging flow cytometry verified the size and morphology of fluorescently labeled macrophages in the peritoneal cavity (Figure 7D).
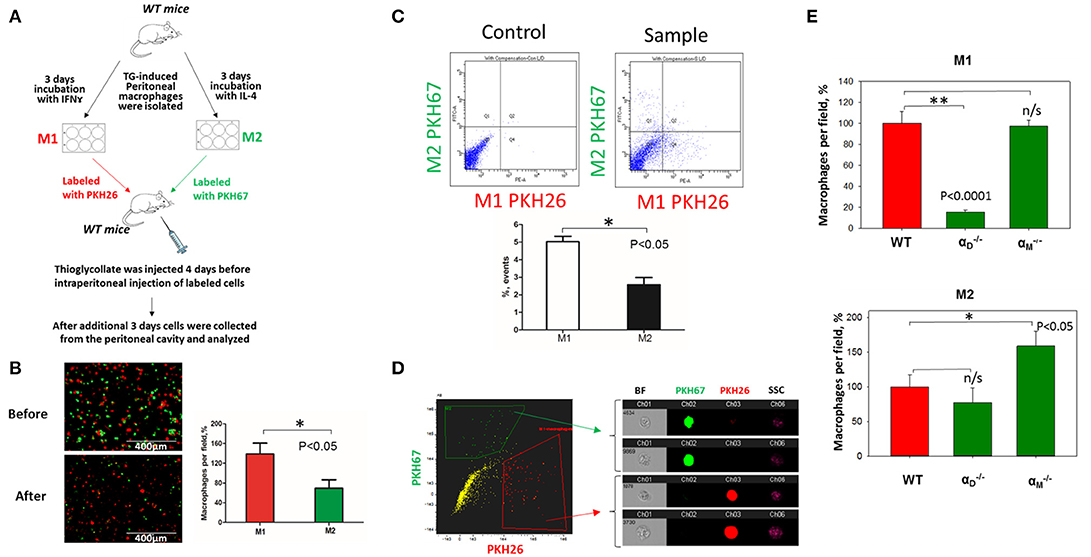
Figure 7. In vivo migration of M1 and M2 macrophages confirmed the results of the 3D migration assays. (A) The model of in vivo resolution of peritoneal inflammation. Peritoneal macrophages were isolated from WT mice at 3 days after injection of thioglycollate (TG) and placed on petri dish for 3 days incubation with 100 U/ml IFNγ or 2nM IL-4 to generate M1 and M2 activated macrophages, respectively. Collected M1 and M2 macrophages were labeled with PKH26 or PKH67 fluorescent dyes. Labeled M1 and M2 macrophages were mixed in a 1:1 ratio and further injected intraperitoneally into WT mice with 4 days predisposed TG-induced peritoneal inflammation. (B) The equal ratio of red and green macrophages before the injection was verified by sample cytospin preparation (B, upper panel). 3 days later, peritoneal macrophages were harvested, and the percentages of red and green fluorescent macrophages were assessed by cytospin (B, lower panel) and flow cytometry (C,D). The quantification of the data was analyzed by using Image Analysis Software (EVOS, Thermo Fisher) at least 4 fields of view per sample (n = 4) (B, right panel). (C) Flow cytometry. Live isolated cells were selected with live/dead kit and analyzed using 488 and 567 channels (Fortessa X-20). The results were analyzed with Diva software and statistical analysis was performed using Student's t-test. Data are presented as mean ± SEM. *P < 0.05. (D) Imaging flow cytometer. The population of single, alive cells was analyzed on red and green channels and individual cells were evaluated in green and red positive areas (ImageStream Mark II, Amnis). Channel 1- Brightfield (BF). Channel 2- 488 wavelength (PKH67). Channel 3−566 wavelength (PKH26), channel 6—side scattering (SSC). (E) M1- and M2-activated macrophages in the peritoneal cavity during the resolution of peritoneal inflammation. The quantification of the data was analyzed by using Image Analysis Software (EVOS, Thermo Fisher) 4–6 fields of view per sample (n = 4). Data are presented as mean ± SEM. *P < 0.05.
According to our in vitro results and previous data (23) we demonstrated that αD-deficiency on an M1 background stimulated the emigration of macrophages from the peritoneal cavity, while αM-knockout had no effect (Figure 7E). In contrast, we detected an increased accumulation of αM-deficient M2 macrophages in the cavity, which demonstrates the supportive role of αM in the migration of M2 macrophages and remained consistent with our in vitro results. Surprisingly, we did not detect the same effect for macrophages. The difference between the migrations of WT and M2 macrophages was not significant (Figure 7E, lower panel).
WT and resident macrophages were isolated and tested using the same resolution of inflammation assay. After 72 h, we detected predominantly wild type cells in the peritoneal cavity, while αM-deficient macrophages emigrated (Figure 8A). This result was verified by flow cytometry. The number of red-fluorescent WT cells isolated from the peritoneal cavity significantly exceeded the number of green-fluorescent cells (Q4 vs. Q1), (Figure 8B). Based on this result, we suggest that αM serves for the supporting resident macrophage accumulation in the tissue, and αM-deficiency increases the efflux of resident macrophages.
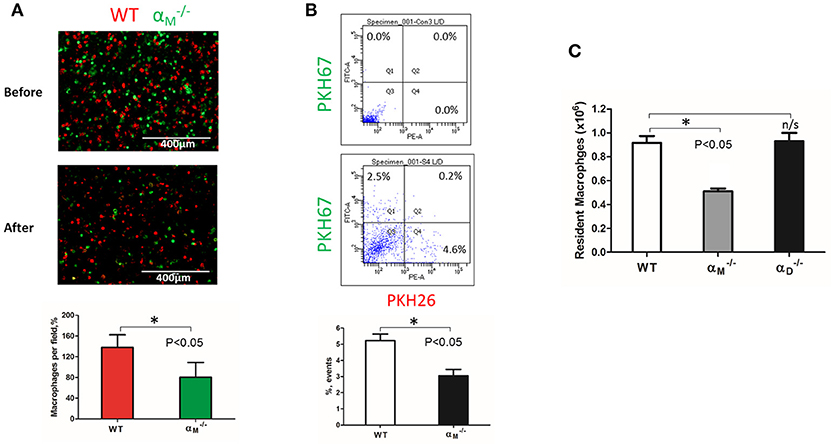
Figure 8. αM deficiency improve efflux of resident macrophages. (A) Fluorescently-labeled resident peritoneal macrophages isolated from WT and mice were mixed in equal numbers and confirmed by cytospin (A, upper panel). Labeled cells were injected introperitoneally into WT mice 4 days after TG-induced inflammation. After 3 days, the harvested peritoneal cells were cytospun (A, middle panel). The quantification of the data was analyzed using t-test at least 4 fields of view per sample (n = 4) by Image Analysis Software (EVOS, Thermo Fisher) (A, lower panel). Data are presented as mean ± SEM. *P < 0.05. (B) The harvested macrophages were also assessed by flow cytometry and the percentages of red (Q4) and green (Q1) fluorescent cells were assessed. Data are presented as mean ± SEM. *P < 0.05. (C) The amount of resident WT, and macrophages was evaluated by assessing the number and percentage of macrophages in non-inflamed peritoneal cavity of mice. Isolated peritoneal cells were counted and the number of WT, and resident macrophages were calculated based on the percentage of F4/80 positive population in flow cytometry analysis. Data are presented as mean ± SEM. *P < 0.05.
To confirm this conclusion, we evaluated the number of macrophages in the non-inflamed peritoneal cavity of wild type and mice. Isolated peritoneal cells were stained with F4/80 antibodies and analyzed by flow cytometry to detect the percentage of macrophages. We found that αM-deficiency resulted in a twofold reduction in the number of resident macrophages in the cavity (Figure 8C). In contrast, αD-deficiency on resident peritoneal macrophages did not affect macrophage number. These data are in agreement with our in vitro and in vivo migration assays.
αD Deficiency Reduces Macrophage Accumulation in Adipose Tissue and Improves Metabolic Parameters
To further confirm the contribution of αDβ2 to macrophage retention in the site of chronic inflammation, we used the model of diet-induced diabetes. The accumulation of pro-inflammatory (M1-like macrophages) in the inflamed adipose tissue is a hallmark of the inflammatory component of diabetes (26). It has been shown that αD is upregulated in the adipose tissue during diet-induced obesity (35), which concurs with the upregulation of αD on M1-activated macrophages in vitro and in atherosclerotic lesions (23). We also detected a strong expression of αDβ2 on adipose tissue macrophages of C57BL6 mice after 8 weeks of a high fat diet (45 kcal% fat) (Supplementary Figures 4A,B). To assess the role of αDβ2 and αMβ2 in macrophage migration during chronic inflammation, monocytes isolated from WT and (or ) mice were labeled with red (PKH26) or green (PKH67) dyes, respectively, mixed in equal number and injected intravenously into mice on a high fat diet (Supplementary Figure 4C). The accumulation of adoptively transferred WT and integrin-deficient macrophages in the adipose tissue of these mice was evaluated after 3 days. The isolated adipose tissue was digested and analyzed by multi-color FACS. We detected a 3-fold decrease in the number of αD-deficient macrophages (in comparison to WT) in the visceral adipose tissue (Figures 9A,B). The result was verified by Imaging flow cytometry that confirmed the presence of labeled cells in the digested adipose tissue (Figure 9C). More importantly, it also demonstrates the maturation of labeled macrophages, since migrated cells expressed macrophage receptor F4/80 (Figure 9C, Lower panels), while injected monocytes lack this expression (Figure 9C, Upper panel). Interestingly, the deficiency of integrin αM, which did not significantly upregulate on M1 macrophages (23) (Figure 2B) had no effect on macrophage accumulation in adipose tissue (Figure 9A, Lower panel). Our previous data demonstrate that αD deficiency does not affect monocyte recruitment from circulation during inflammation (23). Therefore, these results are in agreement with our in vitro and in vivo experiments and with recently published data that αM deficiency does not affect the accumulation of macrophages during diet-induced obesity (36, 37).
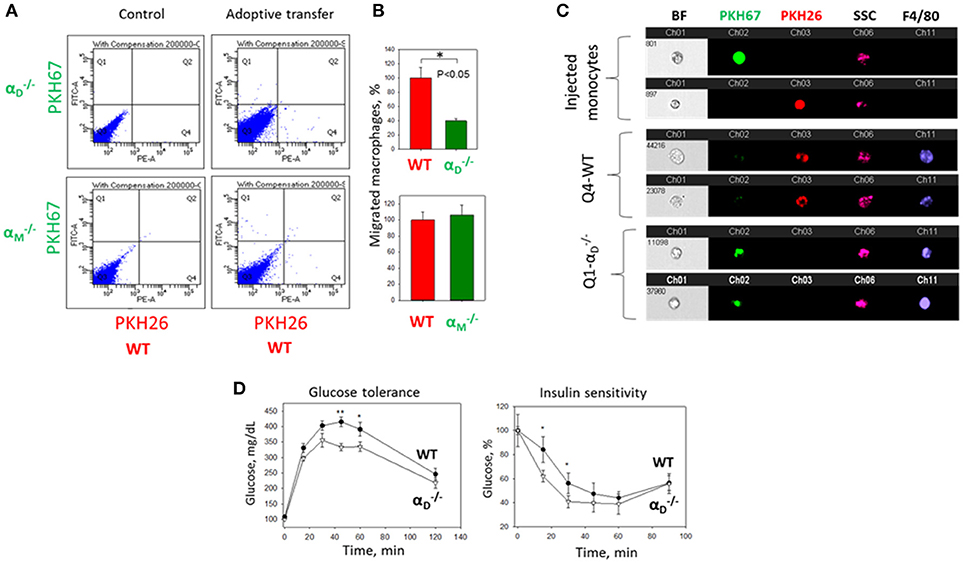
Figure 9. αD deficiency reduces accumulation of monocyte-derived macrophages in adipose tissue and improves metabolic parameters during diet-induced diabetes. (A) WT and (or ) monocytes were isolated from bone marrow, labeled with red (WT) or green () fluorescent dyes, respectively, mixed in an equal amount and injected into the tail vein of WT mice fed for 8 weeks with high fat diet (45% kcal/fat). After 3 days visceral adipose tissue was isolated, digested and analyzed using flow cytometry. (B) Statistical analyses were performed using Student's paired t-tests (n = 4 per group). Data are presented as mean ± SEM. *P < 0.05. (C) Imaging flow cytometry. Upper panel represents the injected monocytes, isolated from WT and (or ) mice, labeled with red and green fluorescent dyes, respectively. Middle (Q4) and lower(Q1) panels represent the labeled cells in digested adipose tissue. Channel 11- F4/80 represents macrophage staining. (D) WT mice (black circles) and αD-knockout mice (white triangles) were fed with high fat diet for 16 weeks and glucose intolerance (left panel) and insulin resistance (right panel) were evaluated. N = 6 for and n = 9 for WT per group. A statistical analysis was performed using Student's t-test. Data are presented as mean ± SEM. *P < 0.05; **P < 0.01, compared to group.
The assessment of metabolic parameters of αD-knockout and WT mice after 16 weeks on a high fat diet confirm the physiological significance of our results by showing that a reduced number of macrophages in the adipose tissue of improved glucose tolerance and insulin sensitivity (Figure 9D). On the other hand, the recently published data did not reveal a change in glucose tolerance test of αM-deficient mice in comparison to WT control after 20 weeks of high-fat diet, but detected decreased insulin sensitivity in skeletal muscle and liver (37).
Taken together, these results provide the link between integrin expression and potential pathophysiological functions. Apparently, the same integrin can support or inhibit 3D migration in tissue depending on the macrophage subset and the level of integrin expression on the cell surface.
Discussion
The accumulation of macrophages at the site of inflammation is a complex physiological process that is critical for the development and resolution of inflammation. Macrophage apoptosis, proliferation and chemokine stimulation are important components of this mechanism, but the adhesive receptors that regulate the macrophage accumulation via cell migration and cell retention are the critical factors that generate the final outcome.
During the last decade, the role of adhesive receptors, particularly integrins, in the three-dimensional migration of immune cells in tissue has been questioned due to a new mechanism, the amoeboid mode of migration, being suggested (12, 38). However, recent data demonstrate that some immune cells, particularly macrophages, utilize adhesion-mediated mesenchymal migration in 3D matrices (13, 39). It has been shown that the migratory mode of macrophages depends on the environment and density of matrix (33). Previously, based on 2D models, it was suggested that cell migration is regulated by cell-substratum adhesiveness, which depends on substrate concentration, adhesive receptor density and affinity (15). This theory postulates that an intermediate level of adhesiveness (or intermediate expression of the adhesive receptors) is optimal for cell migration, while very low adhesiveness does not support cell locomotion and very high adhesiveness inhibits migration due to the prevention of the detachment of adhered cells. However, this theory was not evaluated during 3D migration in the tissue, which has more complex regulatory mechanisms and much stronger physiological implications. In this project, we tested integrins αMβ2 and αDβ2 as physiologically relevant models for studying the role of adhesive receptors during the migration of different subsets of macrophages. We discussed resident peritoneal macrophages and two subsets of monocyte-derived activated macrophages—classically activated (called M1), which can be generated by IFNγ/LPS or TNFα stimulation; and alternatively activated, which are produced by stimulation with IL-4 and/or IL-13 (called M2a) (7). For simplicity, we are calling the latter group M2. We realize that M1 and M2 activated macrophages are simplified models; and macrophages in the atherosclerotic lesion and adipose tissue may represent “mixed phenotypes.” However, these two subsets characterize the most variable difference in macrophage functional properties, and therefore, are an appropriate model for analyzing β2 integrin expression and functions in different macrophage subsets.
Our experimental approach is based on several observations. First, αD and αM share similar ligands (21, 22); second, these two integrins form a complex with the same β2 subunit, thus leading to similar integrin-mediated outside-in signaling during the interaction with the ligand; and third, the expressions of αD and αM are distinct on M1-polarized, M2-polarized and resident macrophages. We demonstrated that αD is upregulated on M1 macrophages, while the expression of αM is moderate (Figure 2) and (23). In contrast to these observations, the resident macrophages express a low level of αD, but have a high density of αM (Figure 6). At the same time, the expressions of both αD and αM integrins on M2 macrophages are intermediate (Figure 2).
Using these three subsets of macrophages, we found that 1) M2 macrophages possess much stronger migratory ability within 3D matrix in comparison with M1. 2) Integrins αDβ2 and αMβ2 are important receptors that regulate cell migration. 3) Similar to the 2D migration, integrins can support mesenchymal 3D cell migration at the intermediate density and prevent mesenchymal and amoeboid cell migration at high levels of expression. 4) Even the adhesion-independent amoeboid mode can be negatively-regulated by a high expression of β2 integrins.
In this project, we show that strong adhesion via integrins is critical for cell retention that defines the different migratory properties of M1 and M2 macrophages. (Figures 3, 6). The analysis of αM, αX, αD, α5, and α4, integrins demonstrates that the upregulation of αD on M1 macrophages is a major change in integrin expression during M1 activation. Therefore, αDβ2-mediated adhesion is crucial for the prevention of M1 macrophage migration. In a parallel line of evidence, we found that the lack of αD-dependent substrate (exemplified in Matrigel) eliminates the effect of αD on cell migration in this matrix (Figure 4). Importantly, αD-deficiency does not significantly change the expression of other macrophage integrins and the levels of MMP expression, which rules out the possibility for an indirect effect of αD knockout on M1 macrophage migration.
Taken together, these results propose that the accumulation of M1 macrophages at the site of inflammation is mediated by strong adhesion which promotes cell retention and the progression of chronic inflammation. In agreement with that, αD-deficiency prevents the accumulation of adoptively transferred fluorescently-labeled macrophage accumulation in adipose tissue during diabetes. The reduced number of macrophages is associated with reduced inflammation and improved glucose tolerance and insulin sensitivity in αD-knockout mice. These data correspond to our previous results, that αD-deficiency reduced macrophage accumulation in atherosclerotic lesions and the development of atherosclerosis (23). Therefore, the upregulation of αD on pro-inflammatory macrophages during diabetes (35) or atherosclerosis (23) demonstrates a similar outcome, which is manifested in the macrophage retention at the site of inflammation and disease development. Interestingly, αM deficiency has pro-atherogenic effect on female and no effect on male mice (40). In agreement with this result, it has been recently shown that αM deficiency elevates glucose level and decreased insulin sensitivity after 16 weeks on a high fat diet. Taken together, these data confirm the opposite role of αDβ2 and αMβ2 on pro-inflammatory M1 macrophages.
In contrast, the stronger migratory properties of M2 macrophages indicate that these cells more easily leave the tissue toward the lymphatics. The increased phagocytic properties of M2 macrophages, coupled with their high migratory abilities, confirm the major function of anti-inflammatory macrophages—phagocytosis followed by efflux from the tissue. αD and αM support the motility of M2 macrophages, and therefore promote the emigration of M2 macrophages from the inflamed tissue. Interestingly, the role of αM in macrophage efflux during resolution was proposed previously (41).
The published data demonstrates that M2 macrophages may apply both locomotion modes, amoeboid and mesenchymal, which is supported by our observations regarding the αM and partially αD-mediated mesenchymal migration of M2 macrophages (Figure 3). In contrast, resident macrophages use preferentially amoeboid motility. Using ROCK inhibitor, we confirmed the preferential amoeboid migration of resident macrophages, but also demonstrated that amoeboid migration can be increased after the knockout of αM integrin, which has a high density on these cells (Figure 6). Therefore, these data propose an anchoring role for integrin αMβ2 for resident macrophages in tissue. This mechanism may be important for the normal homeostasis and mobilization the initial immune defense, which is mediated by resident macrophages. We showed that αM-deficiency reduced macrophage numbers in the non-inflamed peritoneal cavity (Figure 6). Therefore, the different immune pathologies associated with αM-deficiency can be at least partially related to the impaired resident macrophage number. Most importantly, since integrins can block (or reduce) amoeboid migration, it suggests the potential role of integrins in the regulation (particularly, inhibition) of 3D migration of other immune cells that use only amoeboid movement (for example neutrophils or dendritic cells).
In summary, our study demonstrates the important contribution of αDβ2 and αMβ2 to the locomotion of distinct macrophage subsets and proposes a β2-integrin dependent mechanism of macrophage retention in the tissue and efflux during the resolution of inflammation.
Author Contributions
KC designed and performed the experiments, analyzed the data and edited the manuscript. CA performed the experiments and analyzed the data. NP analyzed the data and edited the manuscript. VY designed the research, performed the experiments, analyzed the data, and wrote the manuscript.
Funding
These studies were supported by the National Institute of Diabetes and Digestive and Kidney Disease at the National Institute of Health grant DK102020 (VY) and American Heart Association 14GRNT20410074 (VY); and partially supported by the National Institute of Health grant C06RR0306551 for East Tennessee State University.
Conflict of Interest Statement
The authors declare that the research was conducted in the absence of any commercial or financial relationships that could be construed as a potential conflict of interest.
Acknowledgments
We thank Timothy Burke for the critical reading of the manuscript and helpful suggestions. We appreciate the technical support of Kenton Hall during the execution of Amnis Imaging Flow Cytometry experiments.
Supplementary Material
The Supplementary Material for this article can be found online at: https://www.frontiersin.org/articles/10.3389/fimmu.2018.02650/full#supplementary-material
Abbreviations
ECM, Extracellular matrix; EDTA, Ethylenediaminetetraacetic acid; FACS, Fluorescence-activated cell sorting; FMLP, N-Formylmethionine-leucyl-phenylalanine; IFNγ, interferon-γ; IL-4, interleukin 4; MCP-1, Monocyte chemoattractant protein-1; ROCK, Rho-associated protein kinase; TG, thioglycollate; WT, wide type; 2D, 2 dimensional; 3D, 3 dimensional.
References
1. Tobias P, Curtiss LK. Thematic review series: the immune system and atherogenesis. Paying the price for pathogen protection: toll receptors in atherogenesis. J Lipid Res. (2005) 46:404–11. doi: 10.1194/jlr.R400015-JLR200
2. Bouloumie A, Curat CA, Sengenes C, Lolmede K, Miranville A, Busse R. Role of macrophage tissue infiltration in metabolic diseases. Curr Opin Clin Nutr Metab Care (2005) 8:347–54. doi: 10.1097/01.mco.0000172571.41149.52
3. Alexandraki K, Piperi C, Kalofoutis C, Singh J, Alaveras A, Kalofoutis A. Inflammatory process in type 2 diabetes: the role of cytokines. Ann N Y Acad Sci. (2006) 1084:89–117. doi: 10.1196/annals.1372.039
4. Ouchi N, Kihara S, Funahashi T, Matsuzawa Y, Walsh K. Obesity, adiponectin and vascular inflammatory disease. Curr Opin Lipidol. (2003) 14:561–6. doi: 10.1097/00041433-200312000-00003
5. Eming SA, Wynn TA, Martin P. Inflammation and metabolism in tissue repair and regeneration. Science (2017) 356:1026–30. doi: 10.1126/science.aam7928
6. Subramanian S, Chait A. The effect of dietary cholesterol on macrophage accumulation in adipose tissue: implications for systemic inflammation and atherosclerosis. Curr Opin Lipidol. (2009) 20:39–44. doi: 10.1097/MOL.0b013e32831bef8b
7. Gordon S. Macrophage heterogeneity and tissue lipids. J Clin Invest. (2007) 117:89–93. doi: 10.1172/JCI30992
8. Gordon S. Alternative activation of macrophages. Nat Rev Immunol. (2003) 3:23–35. doi: 10.1038/nri978
9. Mestas J, Ley K. Monocyte-endothelial cell interactions in the development of atherosclerosis. Trends Cardiovasc Med. (2008) 18:228–32. doi: 10.1016/j.tcm.2008.11.004
10. McIntyre TM, Prescott SM, Weyrich AS, Zimmerman GA. Cell-cell interactions: leukocyte-endothelial interactions. Curr Opin Hematol. (2003) 10:150–8. doi: 10.1097/00062752-200303000-00009
11. Herter J, Zarbock A. Integrin regulation during leukocyte recruitment. J Immunol. (2013) 190:4451–7. doi: 10.4049/jimmunol.1203179
12. Lammermann T, Bader BL, Monkley SJ, Worbs T, Wedlich-Soldner R, Hirsch K, et al. Rapid leukocyte migration by integrin-independent flowing and squeezing. Nature (2008) 453:51–5. doi: 10.1038/nature06887
13. Bouissou A, Proag A, Bourg N, Pingris K, Cabriel C, Balor S, et al. Podosome force generation machinery: a local balance between protrusion at the core and traction at the ring. ACS Nano (2017) 11:4028–40. doi: 10.1021/acsnano.7b00622
14. DiMilla PA, Stone JA, Quinn JA, Albelda SM, Lauffenburger DA. Maximal migration of human smooth muscle cells on fibronectin and type IV collagen occurs at an intermediate attachment strength. J Cell Biol. (1993) 122:729–37. doi: 10.1083/jcb.122.3.729
15. Palecek SP, Loftus JC, Ginsberg MH, Lauffenburger DA, Horwitz AF. Integrin-ligand binding properties govern cell migration speed through cell-substratum adhesiveness. Nature (1997) 385:537–40. doi: 10.1038/385537a0
16. DiMilla PA, Barbee K, Lauffenburger DA. Mathematical model for the effects of adhesion and mechanics on cell migration speed. Biophys J. (1991) 60:15–37. doi: 10.1016/S0006-3495(91)82027-6
17. Yakubenko VP, Belevych N, Mishchuk D, Schurin A, Lam SC, Ugarova TP. The role of integrin alpha D beta2 (CD11d/CD18) in monocyte/macrophage migration. Exp Cell Res. (2008) 314:2569–78. doi: 10.1016/j.yexcr.2008.05.016
18. Clemetson KJ, Clemetson JM. Integrins and cardiovascular disease. Cell Mol Life Sci. (1998) 54:502–13. doi: 10.1007/s000180050179
19. Hogg N, Patzak I, Willenbrock F. The insider's guide to leukocyte integrin signalling and function. Nat Rev Immunol. (2011) 11:416–26. doi: 10.1038/nri2986
20. Wu H, Gower RM, Wang H, Perrard XY, Ma R, Bullard DC, et al. Functional role of CD11c+ monocytes in atherogenesis associated with hypercholesterolemia. Circulation (2009) 119:2708–17. doi: 10.1161/CIRCULATIONAHA.108.823740
21. Yakubenko VP, Yadav SP, Ugarova TP. Integrin αDβ2, an adhesion receptor up-regulated on macrophage foam cells, exhibits multiligand-binding properties. Blood (2006) 107:1643–50. doi: 10.1182/blood-2005-06-2509
22. Yakubenko VP, Lishko VK, Lam SCT, Ugarova TP. A molecular basis for integrin aMb2 in ligand binding promiscuity. J Biol Chem. (2002) 277:48635–42. doi: 10.1074/jbc.M208877200
23. Aziz MH, Cui K, Das M, Brown KE, Ardell CL, Febbraio M, et al. The upregulation of integrin αDβ2 (CD11d/CD18) on inflammatory macrophages promotes macrophage retention in vascular lesions and development of atherosclerosis. J Immunol. (2017) 198:4855–67. doi: 10.4049/jimmunol.1602175
24. Cougoule C, Van GE, Le C V, Lafouresse F, Dupre L, Mehraj V, et al. Blood leukocytes and macrophages of various phenotypes have distinct abilities to form podosomes and to migrate in 3D environments. Eur J Cell Biol. (2012) 91:938–49. doi: 10.1016/j.ejcb.2012.07.002
25. Yakubenko VP, Cui K, Ardell CL, Brown KE, West XZ, Gao D, et al. Oxidative modifications of extracellular matrix promote the second wave of inflammation via β2 integrins. Blood (2018) 132:78–88. doi: 10.1182/blood-2017-10-810176
26. Oh DY, Morinaga H, Talukdar S, Bae EJ, Olefsky JM. Increased macrophage migration into adipose tissue in obese mice. Diabetes (2012) 61:346–54. doi: 10.2337/db11-0860
27. Xuan W, Qu Q, Zheng B, Xiong S, Fan GH. The chemotaxis of M1 and M2 macrophages is regulated by different chemokines. J Leukoc Biol. (2015) 97:61–9. doi: 10.1189/jlb.1A0314-170R
28. Yakubenko VP, Solovjov DA, Zhang L, Yee VC, Plow EF, Ugarova TP. Identification of the binding site for fibrinogen recognition peptide g383-395 within the aM I-domain of integrin aMb2. J Biol Chem. (2001) 275:13995–4003. doi: 10.1074/jbc.M010174200
29. Elices MJ, Hemler ME. The human integrin VLA-2 is a collagen receptor on some cells and a collagen/laminin receptor on others. Proc Natl Acad Sci USA. (1989) 86:9906–10. doi: 10.1073/pnas.86.24.9906
30. Tawil NJ, Houde M, Blacher R, Esch F, Reichardt LF, Turner DC, et al. α1β1 integrin heterodimer functions as a dual laminin/collagen receptor in neural cells. Biochemistry (1990) 29:6540–4. doi: 10.1021/bi00479a028
31. Lishko VK, Yakubenko VP, Ugarova TP. The interplay between Integrins aMb2 and a5b1 during cell migration to fibronectin. Exp Cell Res. (2003) 283:116–26.
32. Yakubenko VP, Lobb RR, Plow EF, Ugarova TP. Differential induction of gelatinase B (MMP-9) and gelatinase A (MMP-2) in T-lymphocytes upon a4b1-mediated adhesion to VCAM-1 and the CS-1 peptide of fibronectin. Exp Cell Res. (2000) 260:73–84. doi: 10.1006/excr.2000.5002
33. Maridonneau-Parini I. Control of macrophage 3D migration: a therapeutic challenge to limit tissue infiltration. Immunol Rev. (2014) 262:216–31. doi: 10.1111/imr.12214
34. Bellingan GJ, Caldwell H, Howie SE, Dransfield I, Haslett C. In vivo fate of the inflammatory macrophage during the resolution of inflammation: inflammatory macrophages do not die locally, but emigrate to the draining lymph nodes. J Immunol. (1996) 157:2577–85.
35. Thomas AP, Dunn TN, Oort PJ, Grino M, Adams SH. Inflammatory phenotyping identifies CD11d as a gene markedly induced in white adipose tissue in obese rodents and women. J Nutr. (2011) 141:1172–80. doi: 10.3945/jn.110.127068
36. Robker RL, Collins RG, Beaudet AL, Mersmann HJ, Smith CW. Leukocyte migration in adipose tissue of mice null for ICAM-1 and Mac-1 adhesion receptors. Obes Res. (2004) 12:936–40. doi: 10.1038/oby.2004.114
37. Wolf D, Bukosza N, Engel D, Poggi M, Jehle F, Anto MN, et al. Inflammation, but not recruitment, of adipose tissue macrophages requires signalling through Mac-1 (CD11b/CD18) in diet-induced obesity (DIO). Thromb Haemost. (2017) 117:325–38. doi: 10.1160/TH16-07-0553
38. Renkawitz J, Schumann K, Weber M, Lammermann T, Pflicke H, Piel M, et al. Adaptive force transmission in amoeboid cell migration. Nat Cell Biol. (2009) 11:1438–43. doi: 10.1038/ncb1992
39. Wiesner C, Le-Cabec V, El AK, Maridonneau-Parini I, Linder S. Podosomes in space: macrophage migration and matrix degradation in 2D and 3D settings. Cell Adh Migr. (2014) 8:179–91. doi: 10.4161/cam.28116
40. Szpak D, Izem L, Verbovetskiy D, Soloviev DA, Yakubenko VP, Pluskota E. αMβ2 is antiatherogenic in female but not male mice. J Immunol. (2018) 200:2426–38. doi: 10.4049/jimmunol.1700313
Keywords: integrin αDβ2(CD11d/CD18), integrin αMβ2(CD11b/CD18), macrophages (M1/M2), migration, inflammation, adhesive receptors
Citation: Cui K, Ardell CL, Podolnikova NP and Yakubenko VP (2018) Distinct Migratory Properties of M1, M2, and Resident Macrophages Are Regulated by αDβ2 and αMβ2 Integrin-Mediated Adhesion. Front. Immunol. 9:2650. doi: 10.3389/fimmu.2018.02650
Received: 31 August 2018; Accepted: 26 October 2018;
Published: 15 November 2018.
Edited by:
Susanna Carola Fagerholm, University of Helsinki, FinlandReviewed by:
Hugo Caire Castro-Faria-Neto, Fundação Oswaldo Cruz (Fiocruz), BrazilDong Li, Jilin University, China
Copyright © 2018 Cui, Ardell, Podolnikova and Yakubenko. This is an open-access article distributed under the terms of the Creative Commons Attribution License (CC BY). The use, distribution or reproduction in other forums is permitted, provided the original author(s) and the copyright owner(s) are credited and that the original publication in this journal is cited, in accordance with accepted academic practice. No use, distribution or reproduction is permitted which does not comply with these terms.
*Correspondence: Valentin P. Yakubenko, yakubenko@etsu.edu