 Lixing Huang1†
 Ying Qiao2†
 Wei Xu3Linfeng Gong3Rongchao He1Weilu Qi1Qiancheng Gao1Hongyan Cai1
 Hans-Peter Grossart4,5*
 Qingpi Yan1*
- 1Fisheries College, Key Laboratory of Healthy Mariculture for the East China Sea, Ministry of Agriculture, Jimei University, Xiamen, China
- 2Fourth Institute of Oceanography, Ministry of Natural Resources, Beihai, China
- 3Third Institute of Oceanography, Ministry of Natural Resources, Xiamen, China
- 4Department of Experimental Limnology, Leibniz Institute of Freshwater Ecology and Inland Fisheries, Stechlin, Germany
- 5Institute of Biochemistry and Biology, Postdam University, Potsdam, Germany
Fish is considered as a supreme model for clarifying the evolution and regulatory mechanism of vertebrate immunity. However, the knowledge of distinct immune cell populations in fish is still limited, and further development of techniques advancing the identification of fish immune cell populations and their functions are required. Single cell RNA-seq (scRNA-seq) has provided a new approach for effective in-depth identification and characterization of cell subpopulations. Current approaches for scRNA-seq data analysis usually rely on comparison with a reference genome and hence are not suited for samples without any reference genome, which is currently very common in fish research. Here, we present an alternative, i.e. scRNA-seq data analysis with a full-length transcriptome as a reference, and evaluate this approach on samples from Epinephelus coioides-a teleost without any published genome. We show that it reconstructs well most of the present transcripts in the scRNA-seq data achieving a sensitivity equivalent to approaches relying on genome alignments of related species. Based on cell heterogeneity and known markers, we characterized four cell types: T cells, B cells, monocytes/macrophages (Mo/MΦ) and NCC (non-specific cytotoxic cells). Further analysis indicated the presence of two subsets of Mo/MΦ including M1 and M2 type, as well as four subsets in B cells, i.e. mature B cells, immature B cells, pre B cells and early-pre B cells. Our research will provide new clues for understanding biological characteristics, development and function of immune cell populations of teleost. Furthermore, our approach provides a reliable alternative for scRNA-seq data analysis in teleost for which no reference genome is currently available.
Introduction
Fish provides an important human source of food and nutrition, and aquaculture plays a vital and increasing role in meeting the current global food demand (1, 2). The increasing harm of fish infection throughout the entire production chain requires more in-depth research on the molecular mechanisms of fish immune defense against pathogens (3–6). Moreover, fish represent the evolutionary oldest group to possess both innate and adaptive immunity (7–9). Therefore, fish are considered to be excellent models for elucidating in detail regulation mechanisms and evolution of the vertebrate immune system. Consequently, today, teleost fish constitutes the most widely used animal model of ectothermic immunity in immunological research (10–12).
However, several difficulties have emerged in the process of applying research results of mammalian immunology to fish immunology in recent years (13). One of the biggest obstacles stems from the lack of cell markers and molecular components of the immune system (13). As a result, although numerous fish immunomodulatory genes homologous to previously known mammals have been discovered and cloned in the past four decades, our understanding on “in vitro” functions of bony fish leukocytes remained greatly limited for quite a long time (13). In recent years, however, some in vivo and in vitro functional responses of fish lymphocytes have been reported (14). Currently, the number of fish lymphocyte-specific markers continues to increase, continuously facilitating the characterization of lymphocyte subpopulations (14). In order to explore the functional immunity of lymphocyte reactions, and raise the standard of fish immunology research, it will be necessary to combine the accumulated knowledge on immune gene products with the increasing number of molecular and cellular markers (14). Yet, a comprehensive and rapid identification approach of specific cell markers is urgently needed.
Latest progress of scRNA-seq provides a cost-effective method for obtaining extensive sets of single-cell-level transcriptomic data of different species and tissues. These data enable to account for cell heterogeneity, cell subtype-specific expression patterns and temporal changes in gene expression. This renders the scRNA-seq a highly powerful tool for identifying specific cell populations as well as new cell markers (15). Theoretically, the scRNA-seq technology allows for comprehensive classification of virtually every cell type on the planet (15). Consequently, scRNA-seq seems to be the perfect technique greatly advancing identification of fish immune cell populations and their functions. For example, Niu et al. (16) reported on the first scRNA-seq analysis of Nile tilapia (Oreochromis niloticus), an economically farmed fish species rather than a model organism, which revealed different subsets of non-specific cytotoxic cells in fish for the first time (16).
Without any doubt, the strength of scRNA-seq is its ability to recognize known, but also new, previously non-characterized cell types. To better achieve this, high-throughput data analysis is required to characterize the multitude of cell types detected by scRNA-seq from heterogeneous tissue samples. Characterization takes place in two steps: 1) grouping similar cells into non-overlapping clusters, and 2) labeling clusters, i.e. identifying cell types in each cluster. Yet, the current methods of reconstructing transcripts from these data mainly depend on alignment with known reference genomes, which hinders application to samples with incomplete reference genomes. There are numerous kinds of economic fish, whereby the outbred species usually display a high genetic variability in immune responses, but most of their genomes haven’t been sequenced or published, which currently is the biggest obstacle to research on the immune system of economic fish when using scRNA-seq. Hence, developing an universal solution for scRNA-seq transcriptome reconstruction for fish without any reference genome would provide a big advancement to improve current aquaculture measures.
In the present study, we carried out scRNA-seq analysis of the entire spleen from Epinephelus coioides-a teleost whose genome has not yet been published. Before sampling, the E. coioides was infected by Pseudomonas plecoglossicida for 2 days at 18°C. This model system is interesting because it shows the most intense pathogen-host interaction during the “visceral white spot disease”, which, in recent years, has developed high incidences in southern China (17–22). In order to verify our results globally, we used two different strategies: i) aligning the reads with the full-length transcriptome of E. coioides which we sequenced for the first time, and ii) aligning the reads with the reference genome of a closely related species-Epinephelus lanceolatus (PRJNA625542). The combination of full-length transcriptome sequencing and scRNA-seq represents a new cell classification computation strategy, which enables complete reconstruction of most transcripts present in the scRNA-seq data without a priori whole genome sequencing of the respective fish species. Yet, its sensitivity is equivalent to the traditional approach relying on whole genome alignments. Four cell types were identified: T cells, B cells, monocytes/macrophages (Mo/MΦ) and NCC. Further analysis proved the existing of populations, differentiated cells, and intermediates. Our research provides in depth understanding of biological characteristics, development and function of immune cell populations of teleost.
Materials and Methods
Artificial Infection
We randomly divided healthy E. coioides weighing 45.0 ± 1.5 g into groups of 10 fish. Each fish received 103 CFU/g of the bacterial pathogen P. plecoglossicida via intraperitoneal injection, while sterile PBS was used as a negative control (23).
For scRNA-seq, after 48 h post-infection (hpi) with P. plecoglossicida, the spleen specimen from one E. coioides specimen was sampled (24). For full-length RNA-seq, spleen and intestines from three E. coioides were sampled at 0, 24, 48, 72 and 96 hpi.
Experiments involving animals were conducted in accordance with the “Guide for the Care and Use of Laboratory Animals” proposed by the National Institutes of Health. The protocol involved has been approved by the Animal Ethics Committee of Jimei University (JMULAC201159).
Full-Length RNA-Seq
The full-length RNA-seq was done by Gene Denovo (Guangzhou, China). According to the manufacturer’s guideline, RNA from each tissue was extracted individually with Trizol reagent (Invitrogen, CA, USA) and 5 μg of RNA from each tissue were pooled for one library. The first and second strand cDNA were synthesized from polyA mRNA with Oligo-dT primers according to the manufacturer’s guideline (Clontech SMARTER cDNA synthesis kit). The size fractionation and selection (<4 kb and >4 kb) was carried out on the BluePippin™ Size Selection System (Sage Science, Beverly, MA). The Pacific Biosciences DNA Template Prep Kit 2.0 was used for the SMRT bell library construction, thereafter the Pacific Bioscience Sequel System was used for the SMRT sequencing. The SMRTlink (version 5.1) software was used for the circular consensus sequence (CCS) generation from initial sequence data (25). CCS was then identified as non-full-length and full-length reads according to poly(A) tails as well as 3’ and 5’ adapters. The Iterative Clustering for Error Correction (ICE) method was carried out to identify clusters of transcripts on the basis of reiterative assignment as well as pairwise alignment of full-length reads. Cluster consensus reads with non-full-length reads were polished by using the Arrow software to obtain high-quality isoforms. Full-length transcripts were annotated by searching against the Nr, UniProtKB and KOG databases with BLASTx (26). Function classifying was carried out by GO annotation, KEGG orthology and pathway annotations (27). The open reading frame (ORF) was determined for each full-length cDNA sequence via ANGLE (28). CPC (29), PLEK (30), Pfam-scan (31), and CNCI (32) analyses were performed for prediction of the long non-coding RNAs (lncRNAs). SUPPA2 was used to predict alternative splicing (33). Hmmscan was carried out to predict transcriptional factors. All raw sequencing data is stored in the NCBI Sequence Read Archive (SRA) under the accession number: SRP321375.
scRNA-Seq
Library synthesis and scRNA-seq were done by Gene Denovo (Guangzhou, China). Lysis of blood cells in the spleen was performed with the Red Blood Cell Lysis Solution (Miltenyi Biotec, Germany). The remaining cells were diluted to a concentration of 1000 cells/μL (16). Barcode-labeling of these cells and subsequently mixed with reverse transcriptase into a Gel Beads-In-Emulsions (GEMs). The sequencing primers R1 and P5 arms were used for the cDNA library PCR amplification, and the two groups of cDNA libraries were pooled on the Illumina 10× Gemonics Chromium platform (10× GENOMICS). All raw sequencing data is stored in the NCBI Sequence Read Archive (SRA) under the accession number: SRP321375.
scRNA-Seq Data Processing
Cell-Ranger (v2.0) data filtering, quantification, identification and comparison yielded the gene expression matrix of each cell. Further analysis of cell filtration, standardization, classification of cell subgroups, analysis of differentially expressed genes of different cell subgroups, and selection of marker genes were performed using the Seurat software (34). The reads were then aligned to the full-length transcriptome of E. coioides and the reference genome of a closely related species-E. lanceolatus (PRJNA625542) on the 10× Genomics website.
Cell Ranger was then used for data quality analysis of the raw data and then compared to the full-length transcriptome of E. coioides and the genome of E. lanceolatus. In our Illumina paired-end sequencing, Read 1 used a 16 bp GemCode barcode to distinguish different cells, and also included a 10 bp UMI (Unique Molecular Identifier); Read 2 was a cDNA sequence fragment. The STAR alignment software (35) was used to align Read 2 with the references. The GTF annotation identified the alignment results as introns, exons and intergenic regions. If the transcriptome reads matched only one specific gene, they were considered to be UMI-mapped and used for UMI counting.
The UMI corresponding to each gene id of each barcode was deduplicated using Cell Ranger, and the number of unique UMIs obtained was used as the expression level of cell genes. The expected number of cells is marked as N. The barcodes were arranged according to the UMI count from largest to smallest, and the first N barcodes were kept. The number of UMI counts for the 99th percentile was recorded as m, the barcode was filtered for UMI count < 10% * m, and the obtained cells were valid cells.
The Seurat software (34) was used to normalize the expression level, which was then used for the Principal Component Analysis. The Seurat software clusters and groups the cells based on graph theory clustering algorithms. On the basis of the classification results of cell subgroups, the nonlinear tSNE clustering method was used for further visualization (36).
The likelihood-ratio test (37) was carried out to screen differentially expressed genes for a single cluster. Seurat’s bimod likelihood ratio statistical test was then carried out to analyze differences in gene expression level of different cell populations, and up-regulated genes of each population were picked out. Based on these steps, we analyzed the transcriptional regulation mode of a single cell subpopulation, and further screened the specific gene markers expressed by each subpopulation.
Genes that vary a lot are often highly informative for identifying cell subpopulations or ordering cells along a trajectory. For the pseudo-time analysis, we selected genes based on their variance, using the disp_table () and ordering _genes () programs to select those gene that mean expression >= 0.5 and dispersion empirical >= 1. The selected genes and their main functions were listed in Supplementary Table 1.
Results
Identifying the Full-Length Transcriptome of P. plecoglossicida Infected E. coioides
To present the possibility of scRNA-seq data analysis using the full-length transcriptome as a reference, and evaluate it for samples of the teleost E. coioides (whose genome has not yet been published), the full-length transcriptome of E. coioides was sequenced for the first time in the present study (Figure 1). To capture the diversity of transcript isoforms expressed during the P. plecoglossicida infection, we constructed the full-length RNA-seq library of spleen and intestine samples from 0 to 96 hpi (Figure 2A). According to the analysis process shown in Figure 2B, full-length transcripts of E. coioides were characterized.
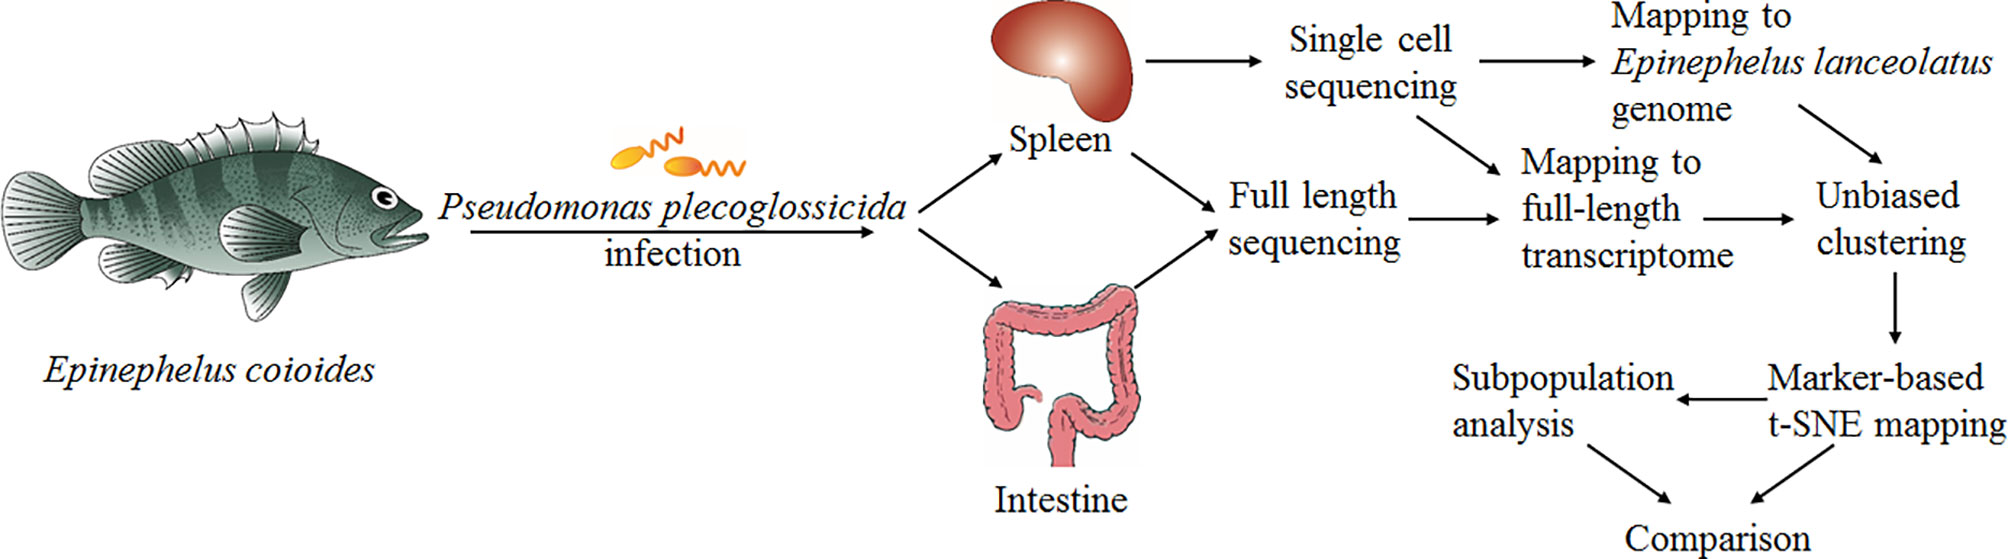
Figure 1 Overall work flow diagram of cell classification and single cell sequencing analysis.
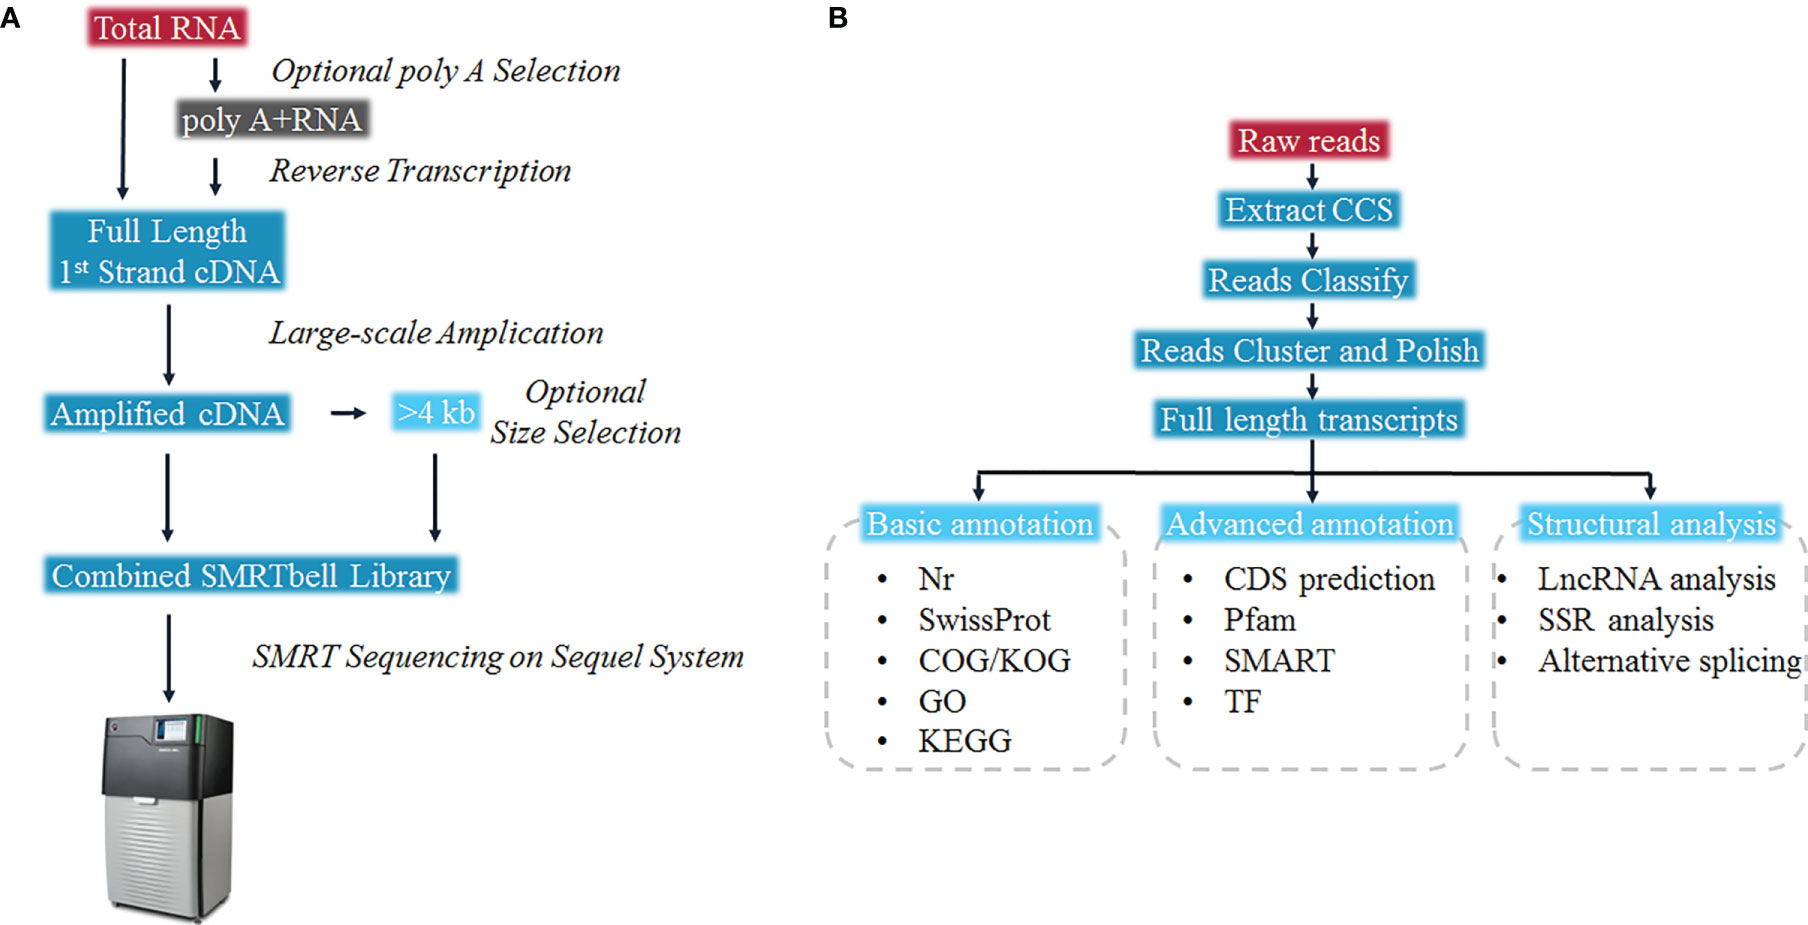
Figure 2 Overall work flow diagram of (A) Sequel full length transcriptome cDNA library construction, and (B) full-length transcriptome data analysis.
A total of 21,132,749 subreads with an average size of 1507 bp were obtained by filtering the Raw reads generated by sequencing (Figure 3A). A total of 1,075,793,700 circular consensus sequences (CCSs) were obtained after self-correction of all subreads (Figures 3B, C), which were then used to identify full-length non-chimeric reads. As a result, a total of 32,715 polished high-quality isoforms were identified (Figures 3D, E), and then redundancy of high-quality consistent sequences in each library was removed by Cd-hit-v4.6.7. Sequences with 99% similarity were combined to obtain the full-length transcriptome of each sample, with a total length of 72,588,100 bp (Figure 3F). The PacBio-SMRT technology used in this study improved our sequencing ability significantly and provided longer reads than the second-generation Illumina sequencing, which laid the foundation for current research on E. coioides full-length transcripts and subsequent single-cell sequencing.
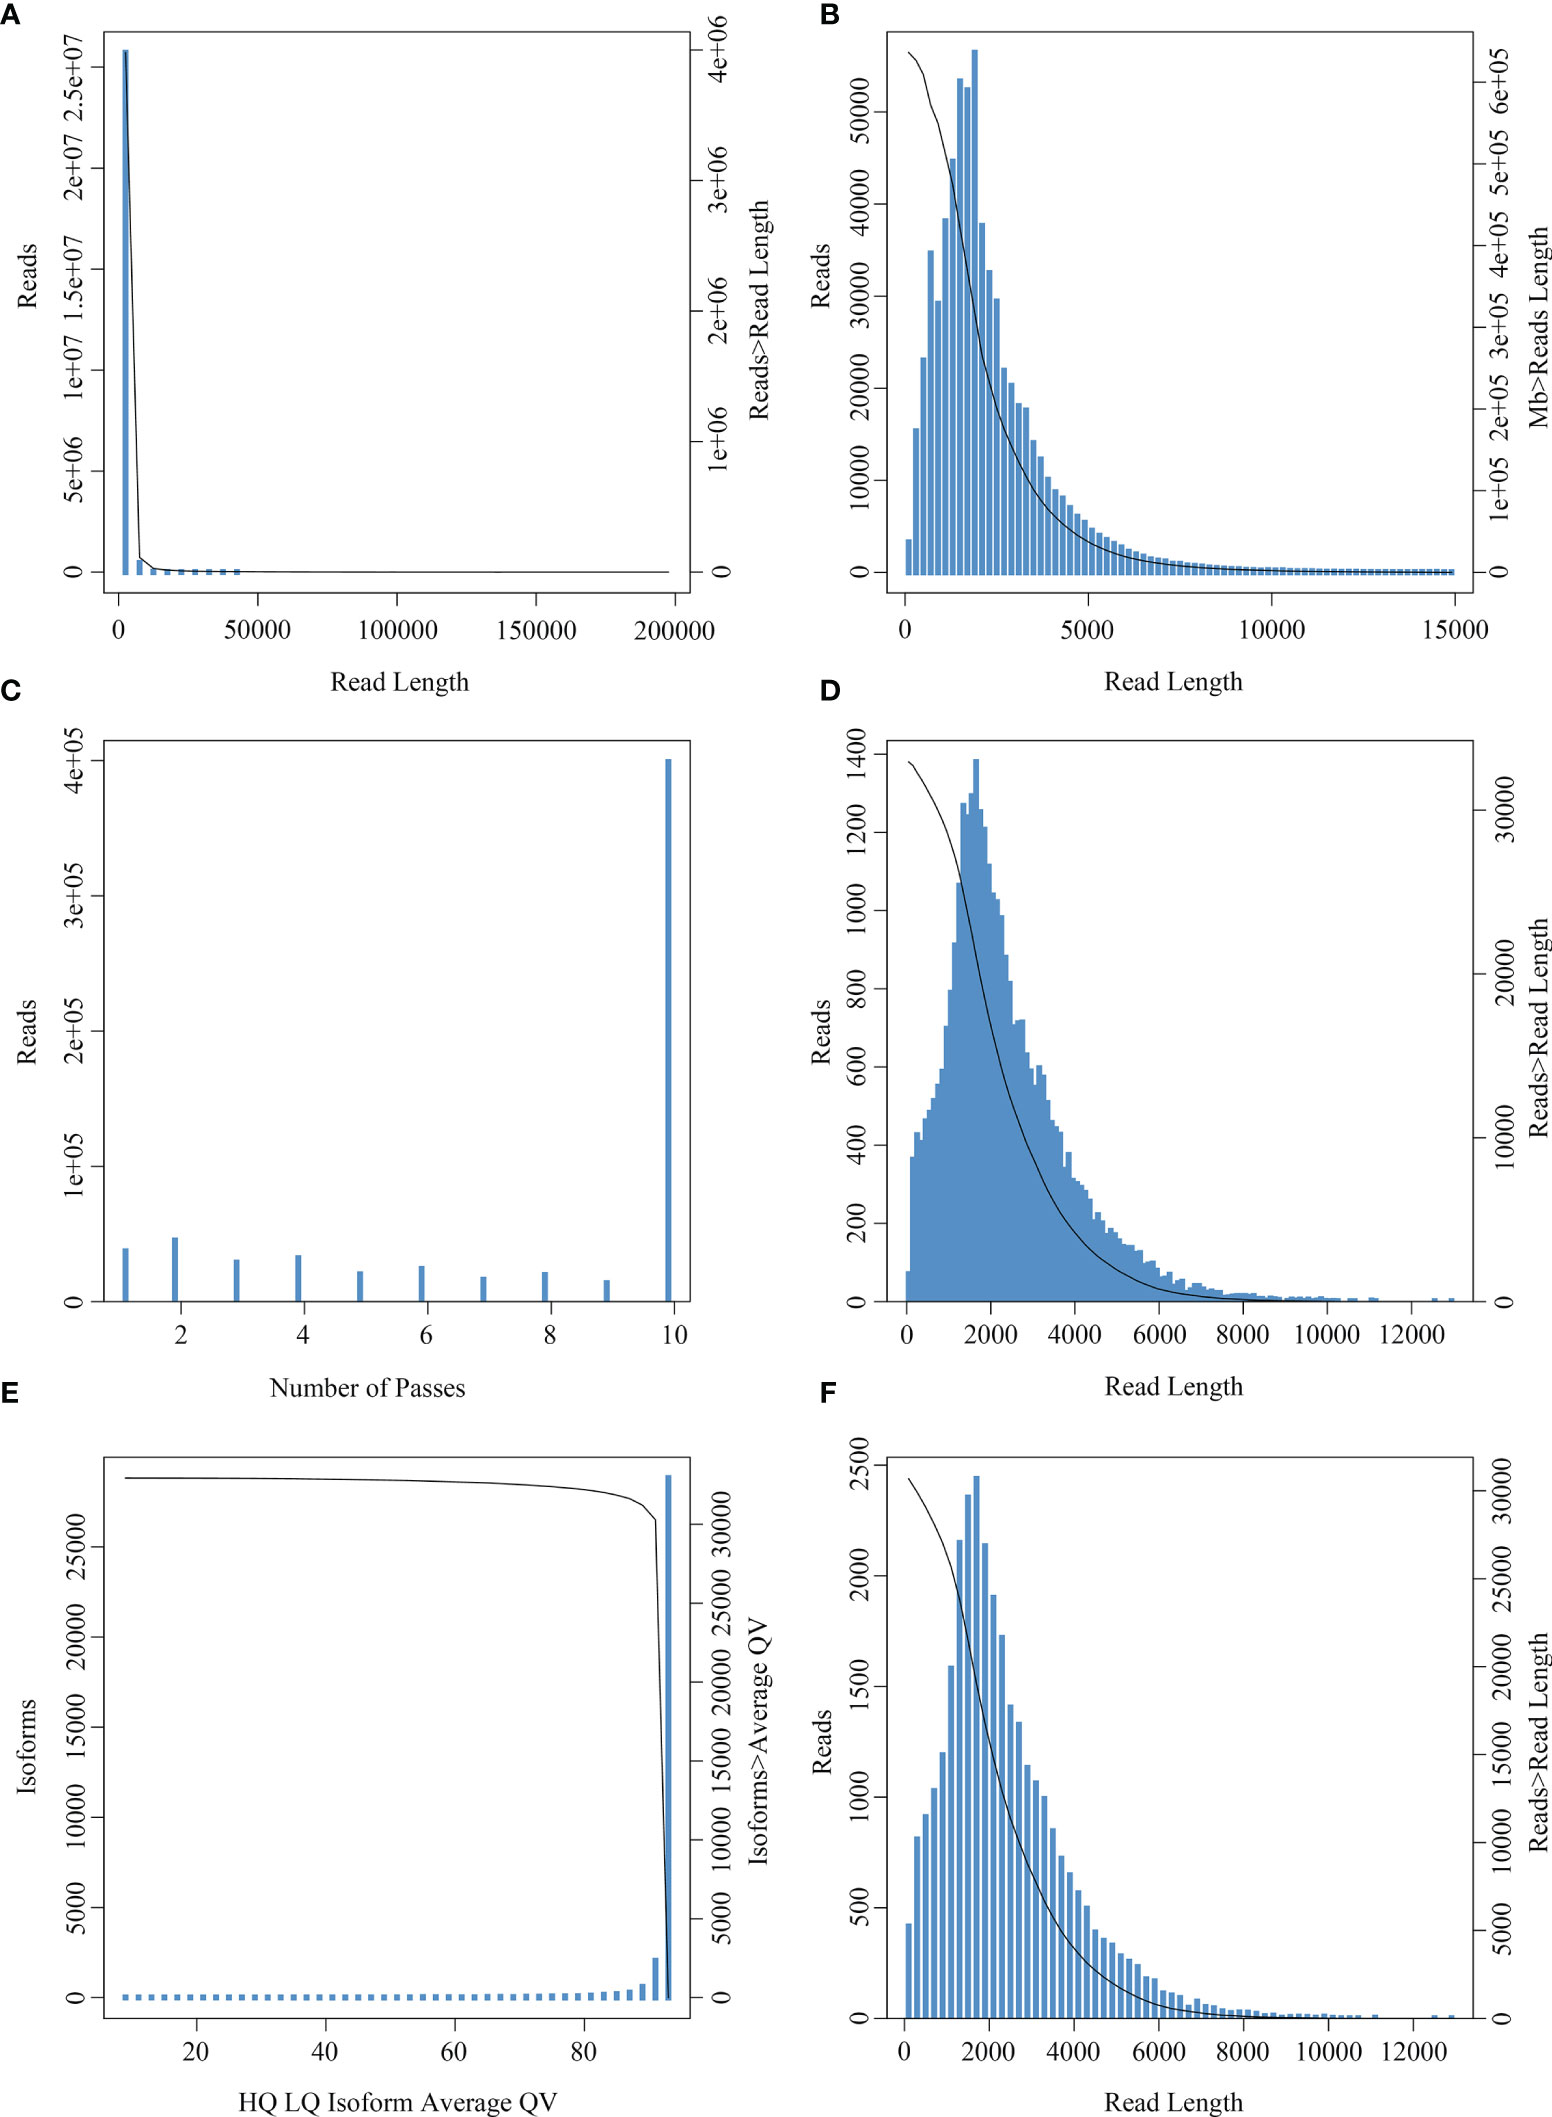
Figure 3 Read number and length distribution after full length transcriptomic sequencing. (A) Subread length distribution: the abscissa represents the length of subreads, and the ordinate is the number of subreads. (B) CCS length distribution: the x-axis represents the length of the reads, and the y-axis on the left represents the coordinates of the column graph, indicating the number of reads whose length is within a certain range (x-axis); the y-axis on the right is the coordinate of the graph, indicating the number of reads whose length is greater than a certain value (x-axis). (C) CCS passes distribution: the abscissa represents the number of full passes and the ordinate represents the number of CCS sequences with corresponding full passes. (D) Consistent sequence length distribution: the abscissa represents the length of the consistent sequence, the left ordinate represents the number of sequences with the length, and the right ordinate represents the number of sequences with the length greater than a certain value (x-axis). (E) Mean mass distribution map of consistency series: the abscissa represents the quality values of high- and low-quality sequences, and the ordinate represents the number of consistent sequences of the respective quality values. (F) Isoform length distribution: the x-axis represents the length of isoforms, and the y-axis on the left represents the coordinate of the column graph, representing the number of isoforms whose length is within a certain range (x-axis); the y-axis on the right is the coordinate of the graph, indicating the number of isoforms whose length is greater than a certain value (x-axis).
Full-Length Transcripts Annotations
All E. coioides full-length transcripts obtained above were aligned to KEGG, KOG, Nr and Swissprot. In total, 27,405 transcripts were successfully annotated and 3,334 transcripts failed. Among them, 16,268 transcripts were found in all databases. Specifically, 19,091, 20,721, 27,339 and 25,542 transcripts were annotated by KOG, KEGG, Nr and Swissprot, respectively (Figure 4A).
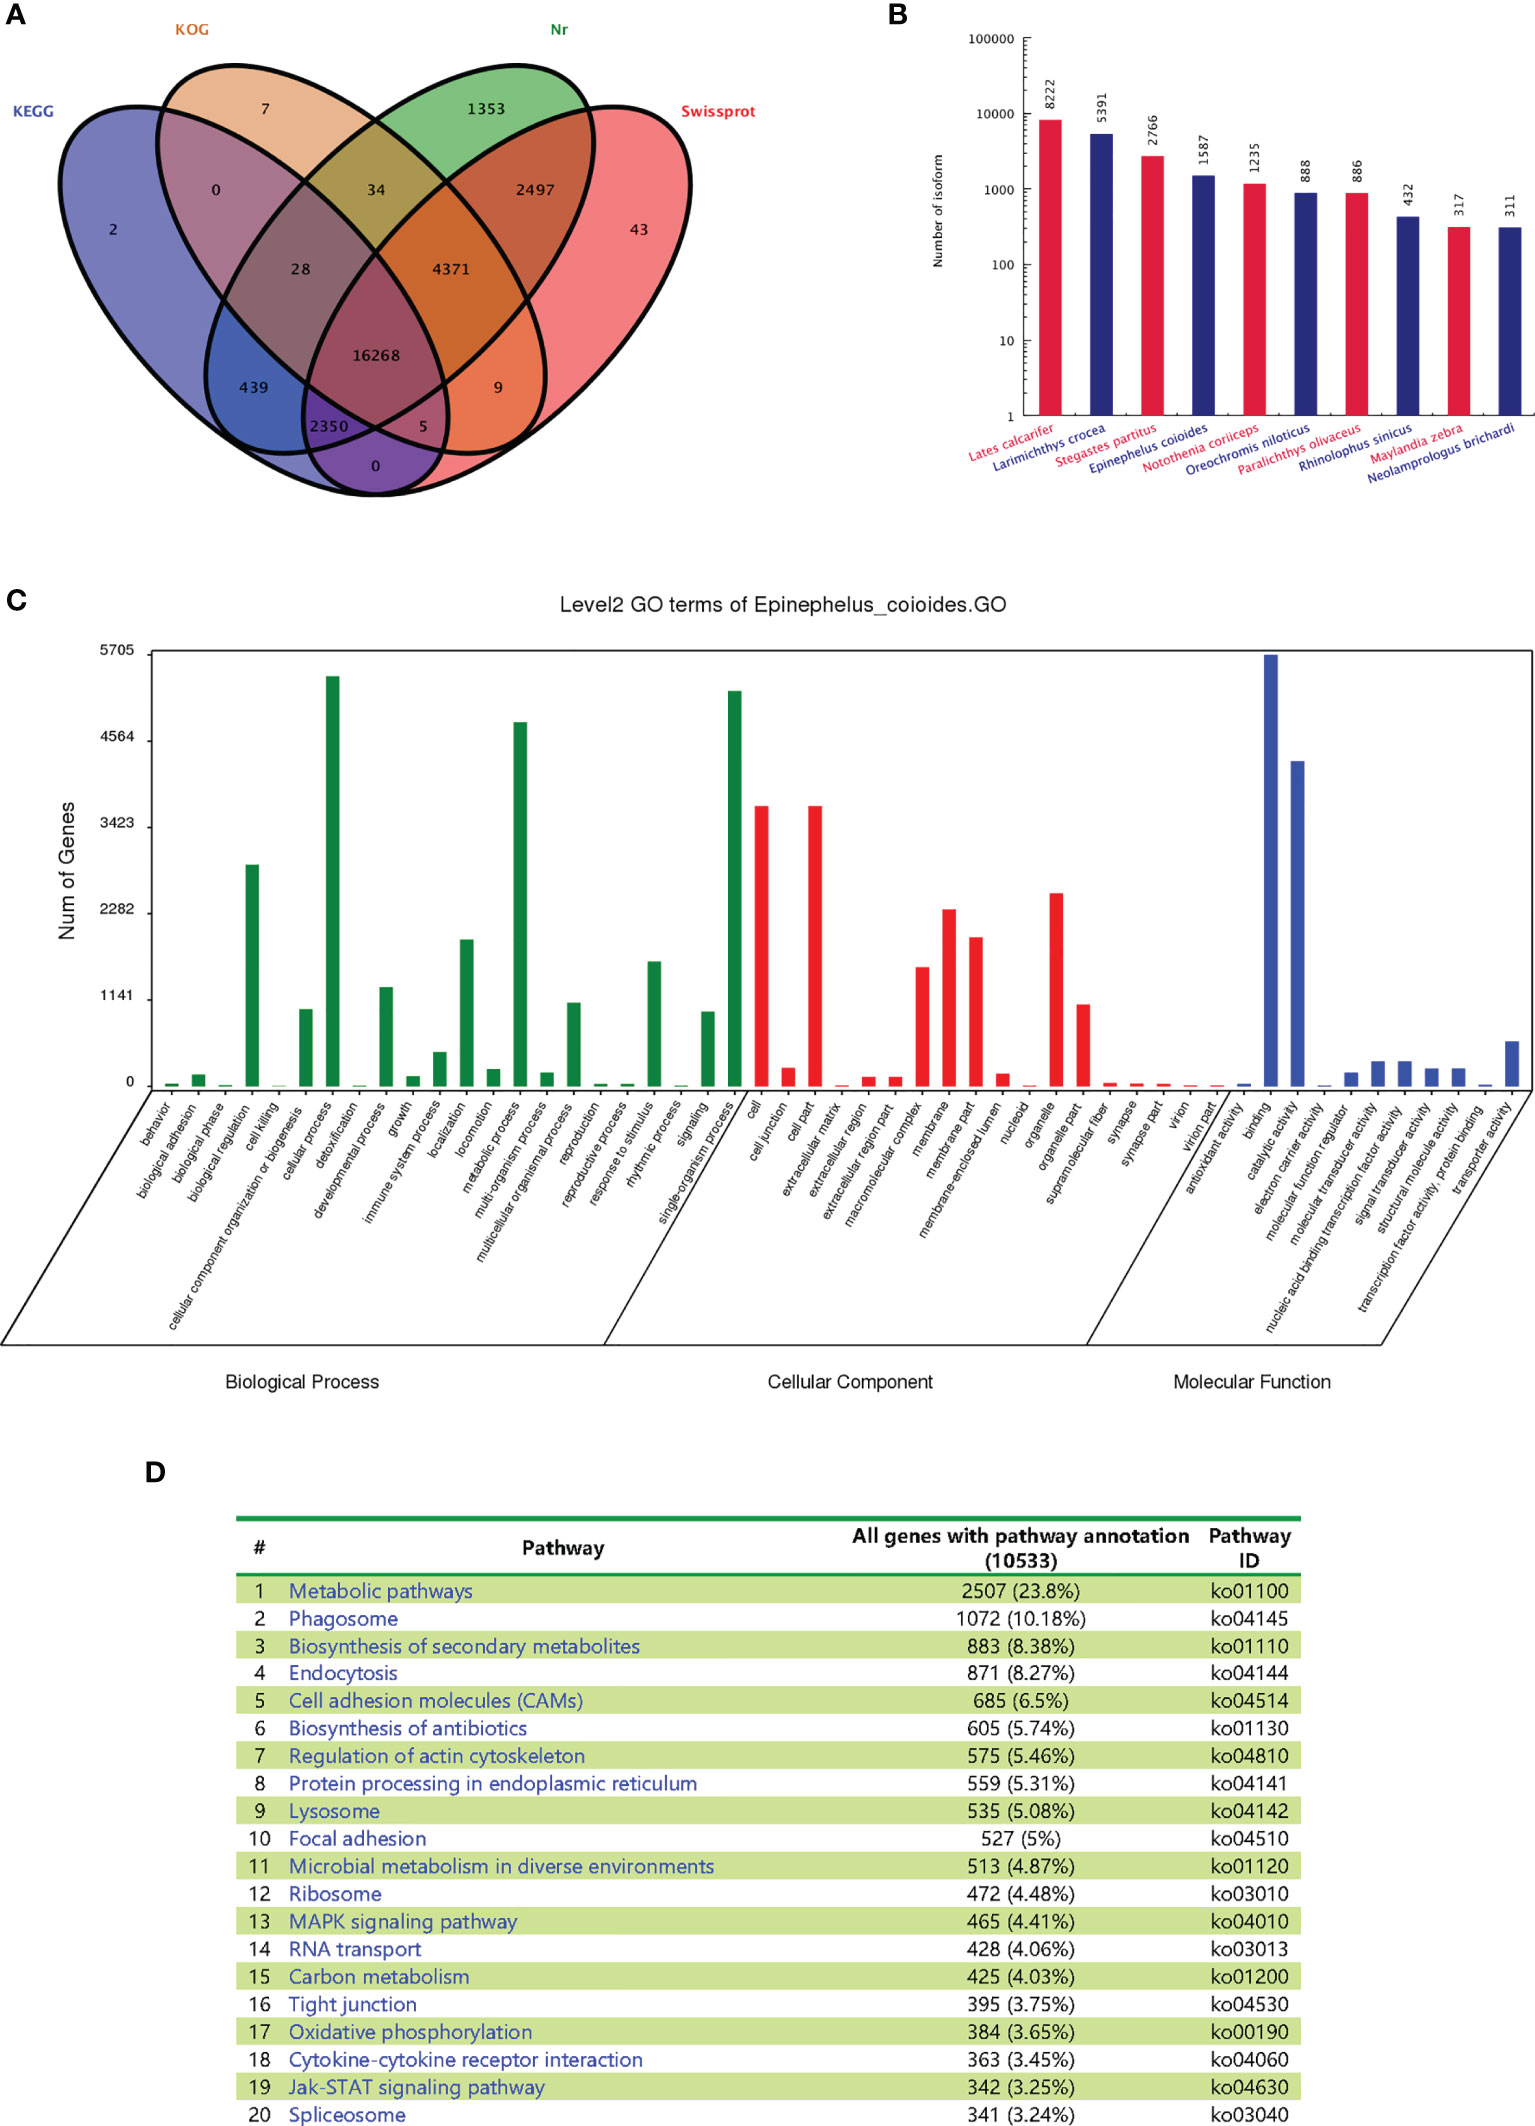
Figure 4 Functional annotations of the full-length transcripts with Nr, SwissProt, GO and KEGG. (A) Venn analysis of annotation results of four databases: Nr, Swiss Prot, KEGG and COG/KOG. (B) Statistical map of species distribution (only the top 10 species are shown): after comparing isoform sequences with the Nr database by BlastX, the sequence with the best (lowest E value) hit to the isoform in the Nr database was taken as the corresponding homologous sequence to determine homologous sequences of the species. The number of homologous sequences of each species was statistically compared. (C) Go function classification chart. (D) Distributions of the KEGG pathways.
After BLASTx was used to compare the isoform sequences with the Nr database, the sequence with the best alignment result (lowest E value) of each isoform in the Nr database was selected as the corresponding homologous sequence. This allowed us to determine the respective homologous sequence, and the number of homologous sequences of each fish species was counted. The largest number of homologous sequences is not from E. coioides (1587), but Lates calcarifer (8222), Larimichthys crocea (5391) and Stegastes partitus (2766) (Figure 4B). The statistics of the results are restricted by the sequence information included in the Nr database. If the target species of interest has little entries, then the alignment will result in lower numbers of homologous sequences. As no whole genome of E. coioides has been published, there are fewer protein sequences in the database, which leads to the relatively lower number of observed homologous sequences for E. coioides.
The main Gene Ontology (GO) annotations distribution was shown in Figure 4C. “Cellular process”, “metabolic process” and “single organism process” were the most abundant sub-categories of the identified biological processes. “Cell”, “cell part”, “organelle” and “membrane” were the most abundant sub-categories of cellular components. “Binding” and “catalytic activity” were the most abundant sub-categories of molecular functions. The major distribution of the KEGG annotations was enriched in “metabolic pathways”, “phagosome”, and “biosynthesis of secondary metabolites” (Figure 4D).
CDS (coding sequence) refers to a sequence encoding a protein product, which corresponds to the codon of a protein. BLASTx was used to align the isomers with NR, Swiss prot, KEGG and COG/KOG in order. The highest ranked protein in the alignment result was selected as the isoform coding region sequence. Translation into the amino acid sequence according to the standard codon table (38) allowed to derive the nucleotide sequence (5 ‘ to 3’) as well as the amino acid sequence of the isoform coding region. Finally, for isoforms which could not be aligned using the above protein libraries, their coding regions were predicted with ANGEL (https://github.com/PacificBiosciences/ANGEL) to generate the nucleic acid sequence (5 ‘ to 3’) as well as the amino acid sequence of the coding region. In total, 27,558 CDS were obtained in this study. The 3 ‘and 5’ UTR length distributions are given in Figures 5A, B.
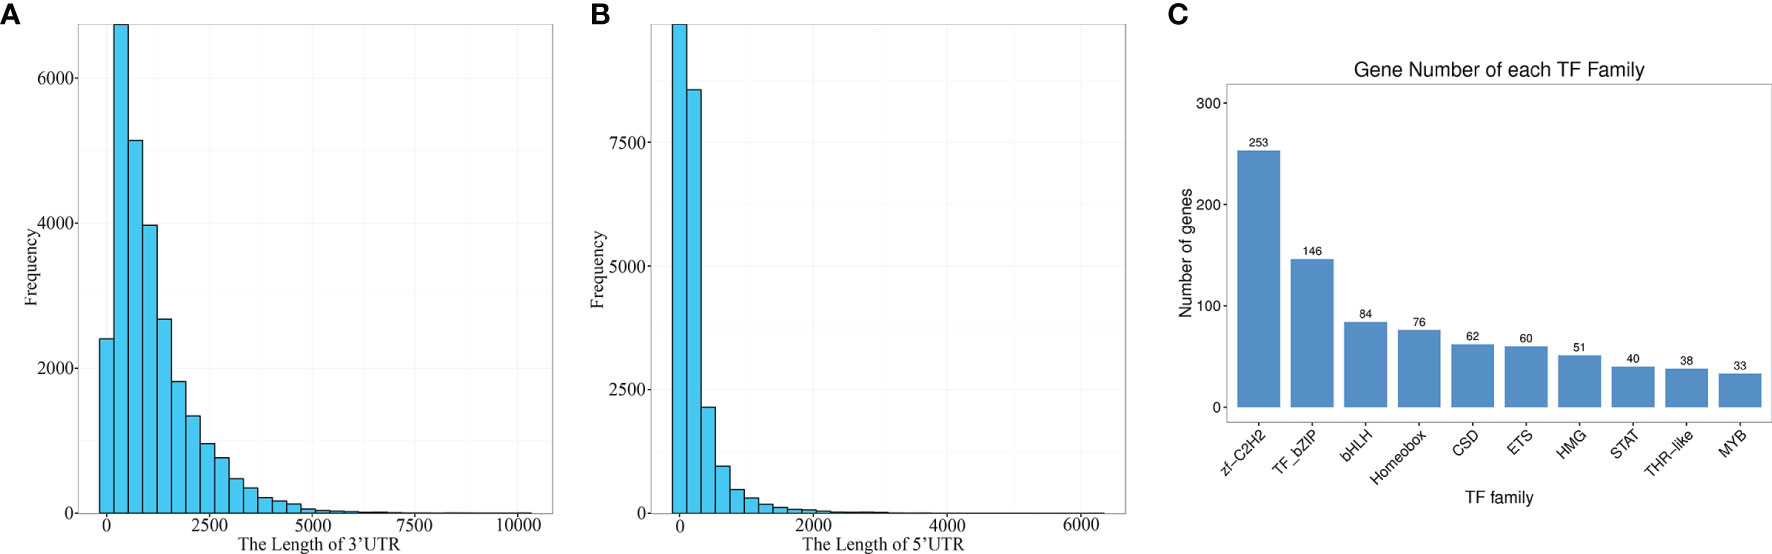
Figure 5 Prediction of the coding sequences and transcription factors. (A) The length of 3’ UTR. (B) The length of 5’ UTR. (C) TF family distribution (top 10).
The predicted CDS were then aligned with the Animal TFDB 2.0 database using hmmscan to identify transcription factors (TFs). A total of 1209 TFs were identified, which were categorized into 59 families, and the top ten were zf-C2H2, TF-bZIP, bHLH, Homeobox, CSD, ETS, HMG, STAT, THR-like and MYB (Figure 5C). These results provided a meaningful basis for the future research on TFs and gene expression regulation in E. coioides.
In addition, the lncRNAs and alternative splicing (AS) events were predicted. A total of 3,000 lncRNAs were identified based on the full-length transcripts failed to align to NR, Swiss prot, KEGG as well as COG/KOG using CNCI and CPC approaches (Supplementary Figure 1A). In total, 2,468 AS events were identified in the transcripts of E. coioides (Supplementary Figure 1B). In this study, the proportions of the main AS events were as follows: retained intron (42.59%), alternative 3’ splice site (21.23%), alternative 5’ splice site (24.55%), skipped exon (5.71%), alternative first exon (1.82%), alternative last exon (0.12%), and mutually exclusive exon (3.97%) (Supplementary Figure 1B).
Sequencing Saturation and Data Utilization Comparison With Different References
The scRNA-seq obtained 403,326,770 reads. Among them, 97.60% of the reads owned valid barcodes (Table 1). Q30 Bases in barcode, RNA read and UMI accounted for 95.40%, 91.20% and 95.10%. When full-length transcriptome and the E. lanceolatus genome were used as reference for data analysis, the sequencing saturation was slightly different, which can be related to the different gene information contained in these two references. In general, however, their sequencing saturations were very close, which proved that the gene information provided by the full-length transcriptome was enough to support the subsequent analysis.

Table 1 Sequencing saturation comparison between different references.
Data utilization comparison of using these two references was carried out (Table 2), which revealed that the number of cells detected did not differ much, while the amount of genes detected for each cell type was equal. The obvious difference lies in the reads mapped confidently to the genome and those mapped confidently to the transcriptome. The proportion of “reads mapped confidently to genome” was 84.4% when using E. lanceolatus genome as reference, and 51.4% when using the full-length transcriptome as reference. The proportion of “reads mapped confidently to transcriptome” was 68% with E. lanceolatus genome as reference, and 50% with full-length transcriptome as reference. These results indicate a higher utilization rate of data when using the genome of E. lanceolatus as the reference, yet, a substantial amount of reads can be confidentially mapped when using the full-length transcriptome as a reference.
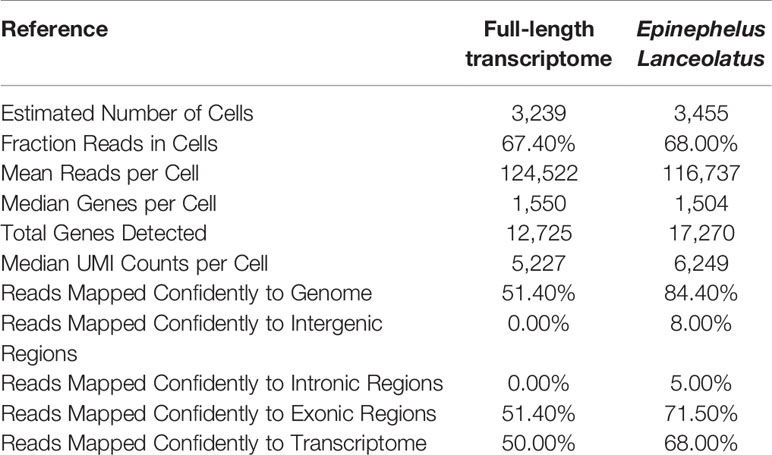
Table 2 Data utilization comparison between different references.
Cells Clustering Comparison With Different Rerences
To compare the quality of cells clustering based on the full-length transcriptome and E. lanceolatus genome, the unsupervised cluster detection algorithm (SEURAT) was applied to group cells based on the similarity of gene expression. With the full-length transcriptome as the reference, 7 cell clusters were identified (Figure 6A). With E. lanceolatus genome as the reference, 5 cell clusters were identified (Figure 6B). From the cell clustering results, the accuracy of cells clustering based on the full-length transcriptome was somewhat higher, but the difference was not particularly obvious. Moreover, 75% of the cells were divided into a subgroup, so it was not easy to evaluate which result was better based on the respective analysis. Therefore, we further mapped the cell clustering results based on the genome of E. lanceolatus back to the results based on the full-length transcriptome, to check for the consistency of both strategies. According to the mapping analysis (Supplementary Figure 2), the results of both cell clustering approaches were relatively consistent. Further, the highly expressed genes were identified (Figures 6C, D and Supplementary Table 1), which enabled us to screen the 5 genes with the highest expression level in each cluster and built a heat map. The obtained results show that each cluster had a clear separation boundary (Figures 6E, F), supporting the accuracy of cells clustering based on both references.
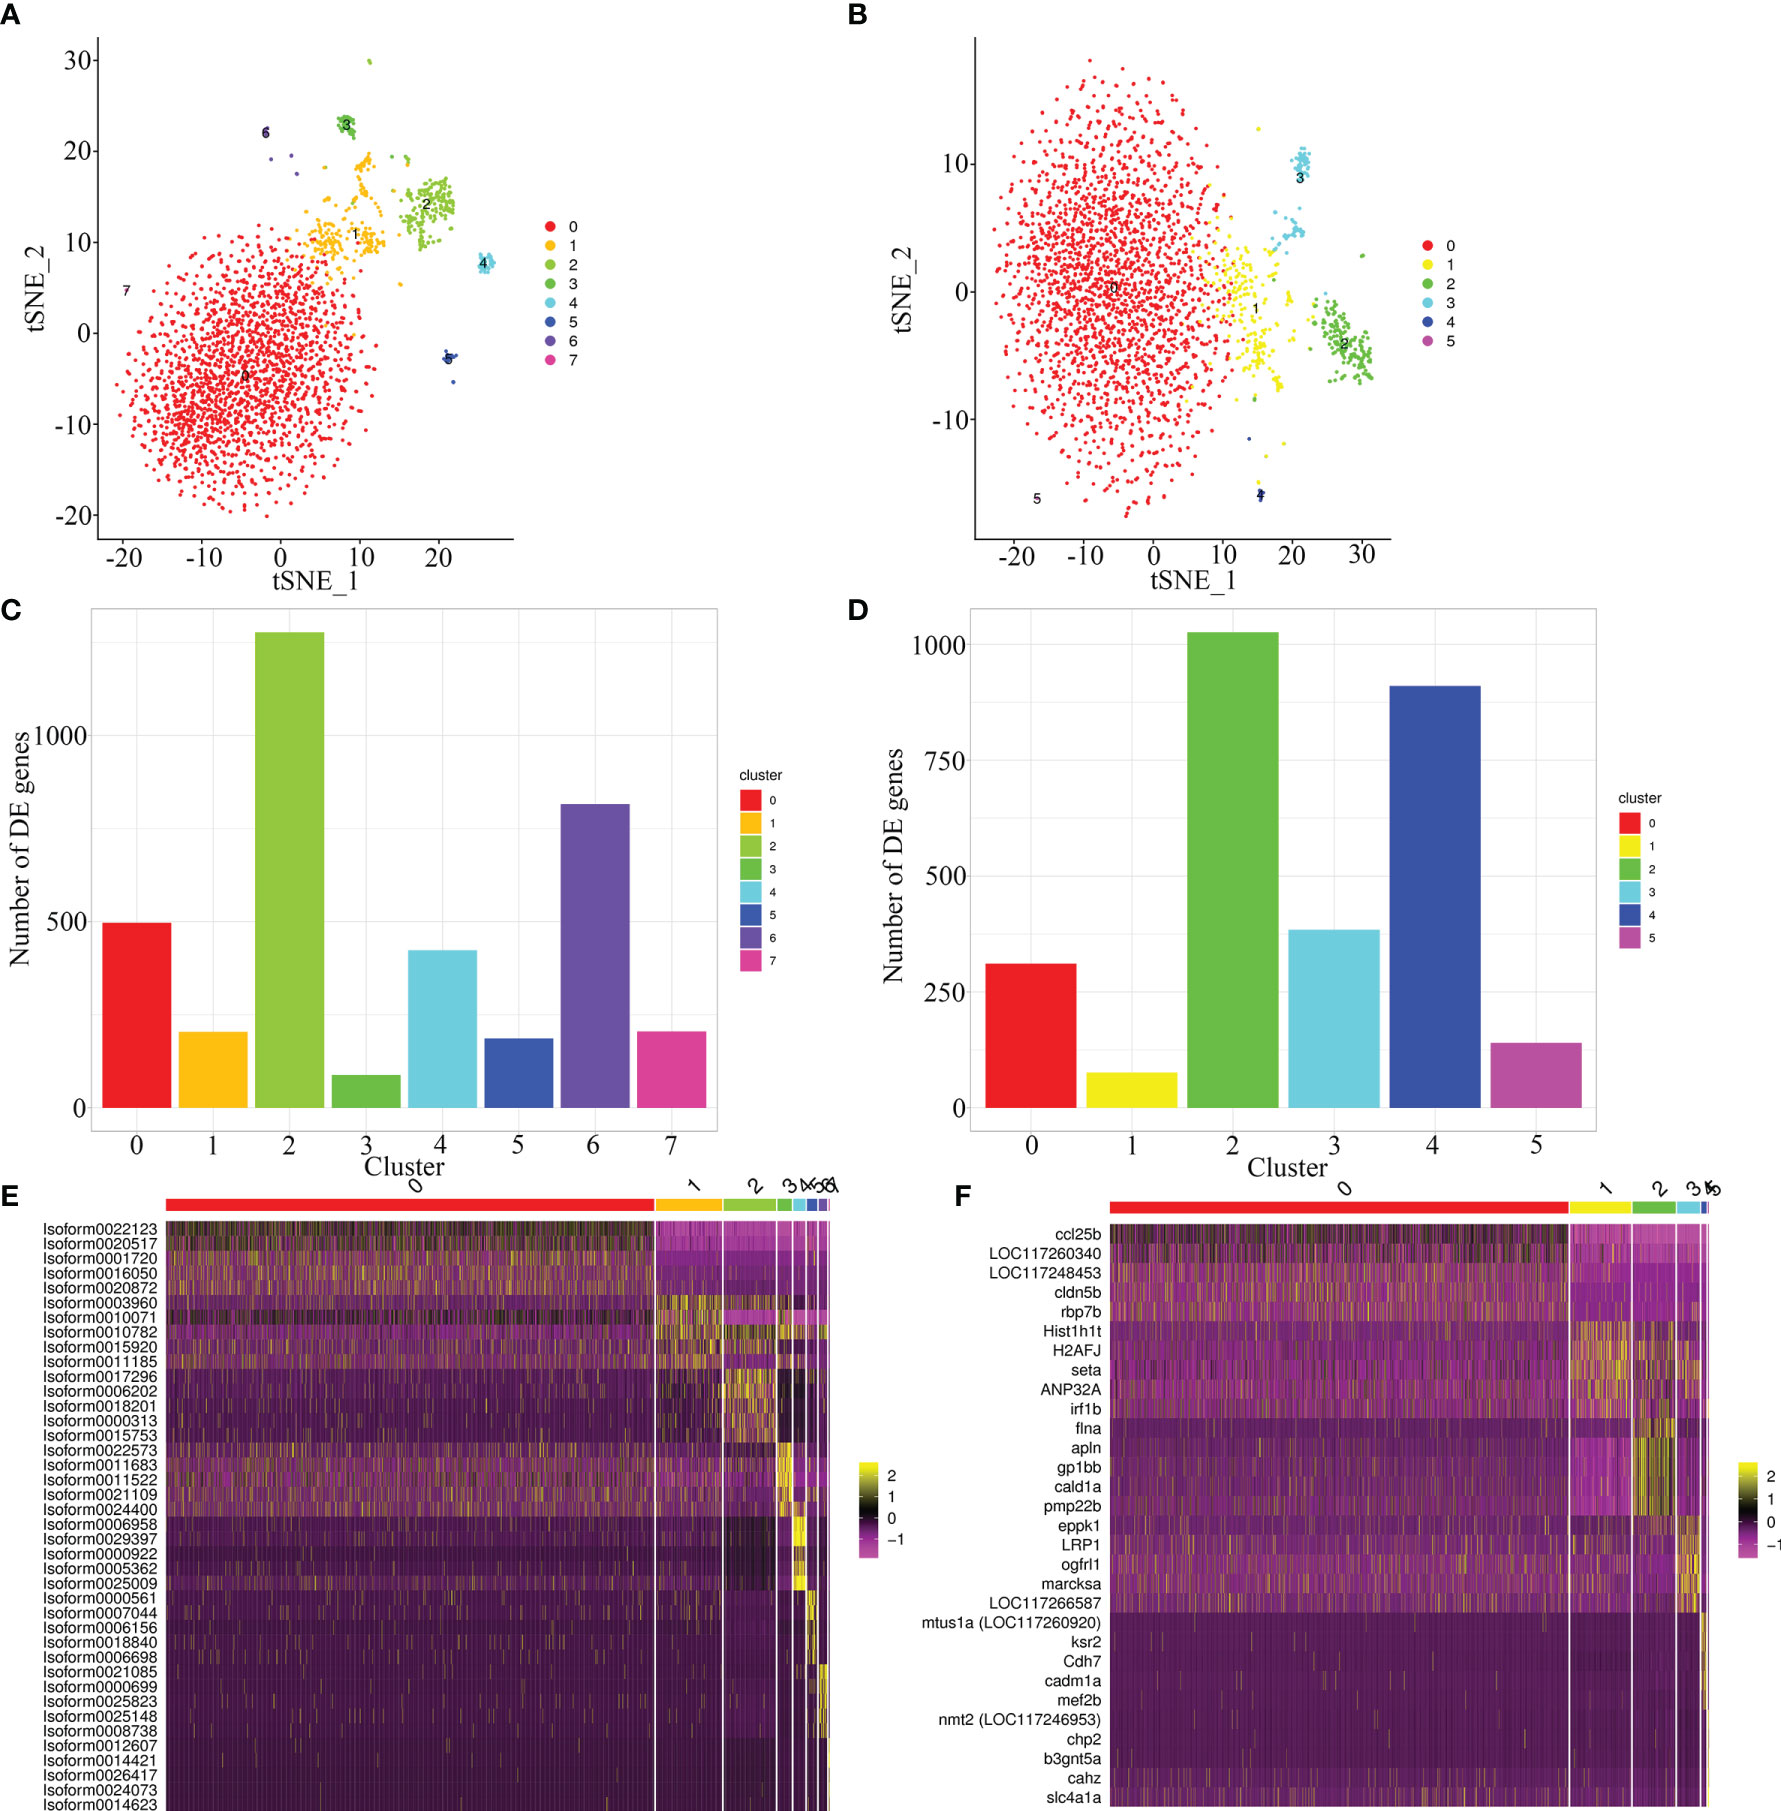
Figure 6 Cell sorting based on full-length transcriptome and E. lanceolatus genome. (A, B) The tSNE nonlinear clustering was used to visualize the classification results of E. coioides spleen cell populations based on full-length transcriptome (A) and the whole E. lanceolatus genome (B). (C, D) Statistical histogram of the number of up-regulated genes in each sub-cluster based on full-length transcriptome (C) and E. lanceolatus genome (D). (E, F) Heatmap of the top 5 up-regulated expression genes from each cluster as a marker gene based on full-length transcriptome (E) and E. lanceolatus genome (F). Each column in the figure represents a cell, and each row represents a gene. The expression levels of genes in different cells are indicated by different colors. The more yellow, the higher the expression level, and the more purple, the lower the expression level.
At the same time, we also used UMAP, the latest dimension reduction method of scRNA-seq, to proof for the results of cell clustering (Supplementary Figure 3). Our results revealed that the cell clustering based on the full-length transcriptome was indeed better: cell clustering was more concentrated (the cells were more aggregately distributed in the cell clusters), and the differentiation between cell clusters was more obvious. We speculated that even if the alignment rate of the E. lanceolatus genome was higher, there must be differences between the genome sequences of the E. lanceolatus and the E. coioides, which would inevitably lead to the inaccuracy of the alignment data and the inaccuracy of the clustering. However, genome alignment of the 10× scRNA-seq only uses the 96 bp sequence of the 3’ end of mRNA for alignment and clustering analysis, consequently the original discrimination is not pronounced. Therefore, when using the E. lanceolatus genome as a reference, it is likely that the mRNA sequences of different genes in the E. coioides were aligned to the same gene of the E. lanceolatus genome, which would reduce the difference between cells in a disguised form and result in an indistinguishable differentiation of cell groups. This problem doesn’t exist when using the full-length transcriptome as the reference for cell clustering analysis, because all sequences stem from E. coioides itself.
To characterize the clusters based on the full-length transcriptome and the E. lanceolatus genome, we analyzed the genes’ expression in the clusters and inferred their putative identities from known markers (Figures 7A–J). For the analysis based on the full-length transcriptome, the clusters 0 and 5 expressing CD22 (39), CD20 (40) and CMRF35 (41) belonged to the B cell population, the clusters 1 and 3 with the expressions of CD3 (42, 43), LCK (44) and ZAP70 (45) were clustered into the T cell population, the clusters 4 and 6 expressing csfr1 (46), marco (47) and CD33 (48) belonged to the Mo/MΦ population, cluster 2 with the expressions of epx (16), alox5 (16) and grn (16, 49) belonged to the NCC population, and the erythroid cell population (cluster 7) was confirmed by hba2, hbad1 and hbad2 (50). Taken together, our analysis based on the full-length transcriptome successfully divided all clusters into 5 cell populations: T cells, B cells, Mo/MΦ, NCC and erythroid cells (Figure 7K). The analysis based on the E. lanceolatus genome also successfully divided the clusters into the same 5 cell populations using the same cell markers (Figure 7L). Thus, there was no significant difference in the proportion of different cell types between both analysis strategies. It is worth noting that the proportion of red blood cells is extremely low, indicating that the lysis of blood cells was optimal in the process of sample preparation. To further verify our classification results based on the full-length transcriptome, we tested the top 5 up-regulated genes in the 5 cell populations as well as performed a pseudo-time analysis (Figures 7M, N). Genes from the 5 cell populations clustered well in the heat map (Figures 7M, N), and they were distinct from each other. Taken together, our results confirm the accuracy of the full-length transcriptome strategy in cell clustering and classification.
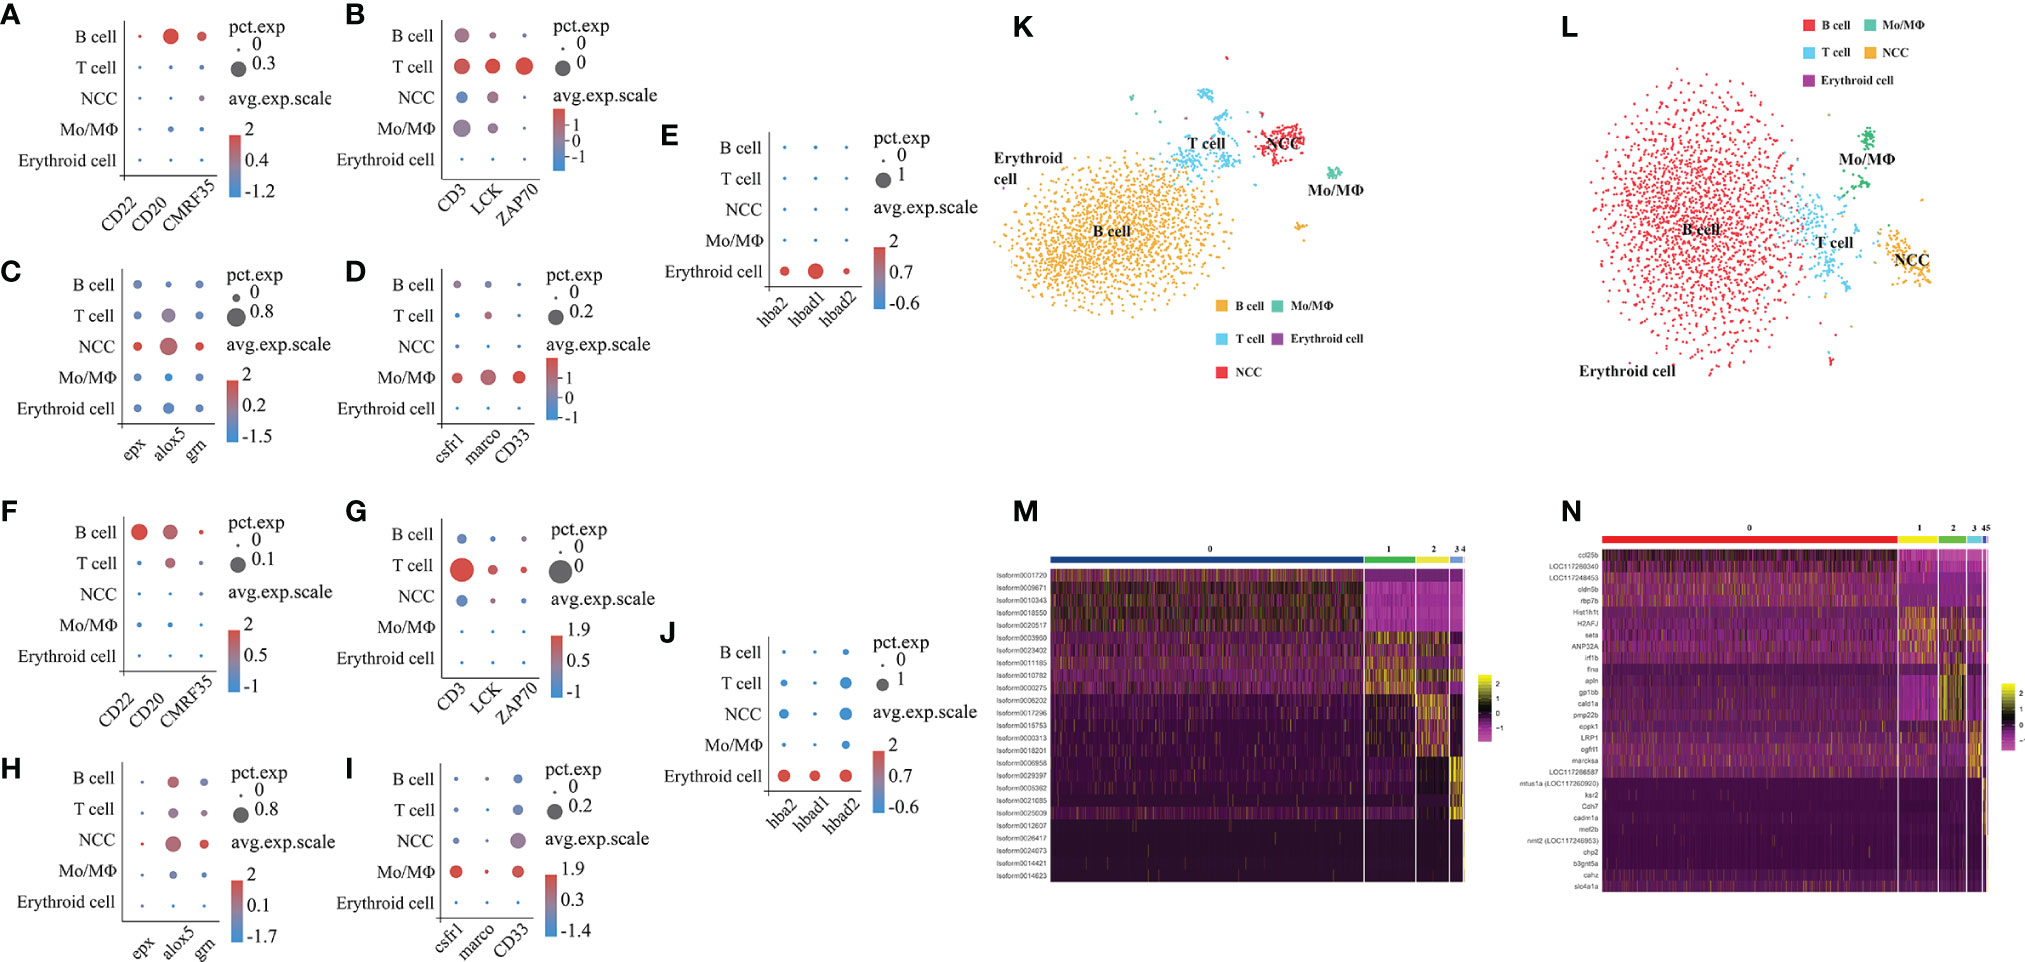
Figure 7 Categorization of cell types based on full-length transcriptome and the whole E. lanceolatus genome. Bubble plots of expression of the 5 marker cell types in all clusters based on full-length transcriptome (A–E) and E. lanceolatus genome (F–J). X-axis depicts the name of the marker gene and Y-axis the name of the cell subpopulation; the size of the bubble represents the ratio of the sum of the expression of the marker gene in a certain subgroup to the sum of its total expression (all cells); the color of the bubble represents the average expression abundance of the marker gene in the cell subgroup; the more red the bubble color, the higher the average expression of the marker gene in the respective subgroup. (K, L) Identification of 5 cell subpopulations based on marker molecules. The results based on full-length transcriptome and E. lanceolatus genome are displayed in (K, L), respectively. The 5 cell populations are represented by different colors (B cell: orange, T cell: blue, Mo/MΦ: green, NCC: red). (M, N) The heatmap of the top 5 up-regulated expression genes from each cell subpopulation as a marker gene based on the full-length transcriptome (M) and E. lanceolatus genome (N).
Cell Sub-Clustering and Identification Based on the Full-Length Transcriptome
In order to obtain a more detailed clustering and cell classification of Mo/MΦ (Figures 8A, B), we used the above mentioned approaches to analyze the Mo/MΦ population identified in Figure 7K. As a result, the Mo/MΦ population was further sub-divided into 2 clusters: 1) the cluster with the high expression level of IL-1b, IL-12, TNF-α, CD80, IRF5 and STAT1 belonged to the M1 type Mo/MΦ population, 2) the cluster with the high expression level of IL-10, TGF-b, CD209 and IRF4 belonged to the M2 type Mo/MΦ population (Figures 8A, B). Therefore, the 2 Mo/MΦ subgroups including M1 and M2 type Mo/MΦ are confirmed to exist in E. coioides spleen.
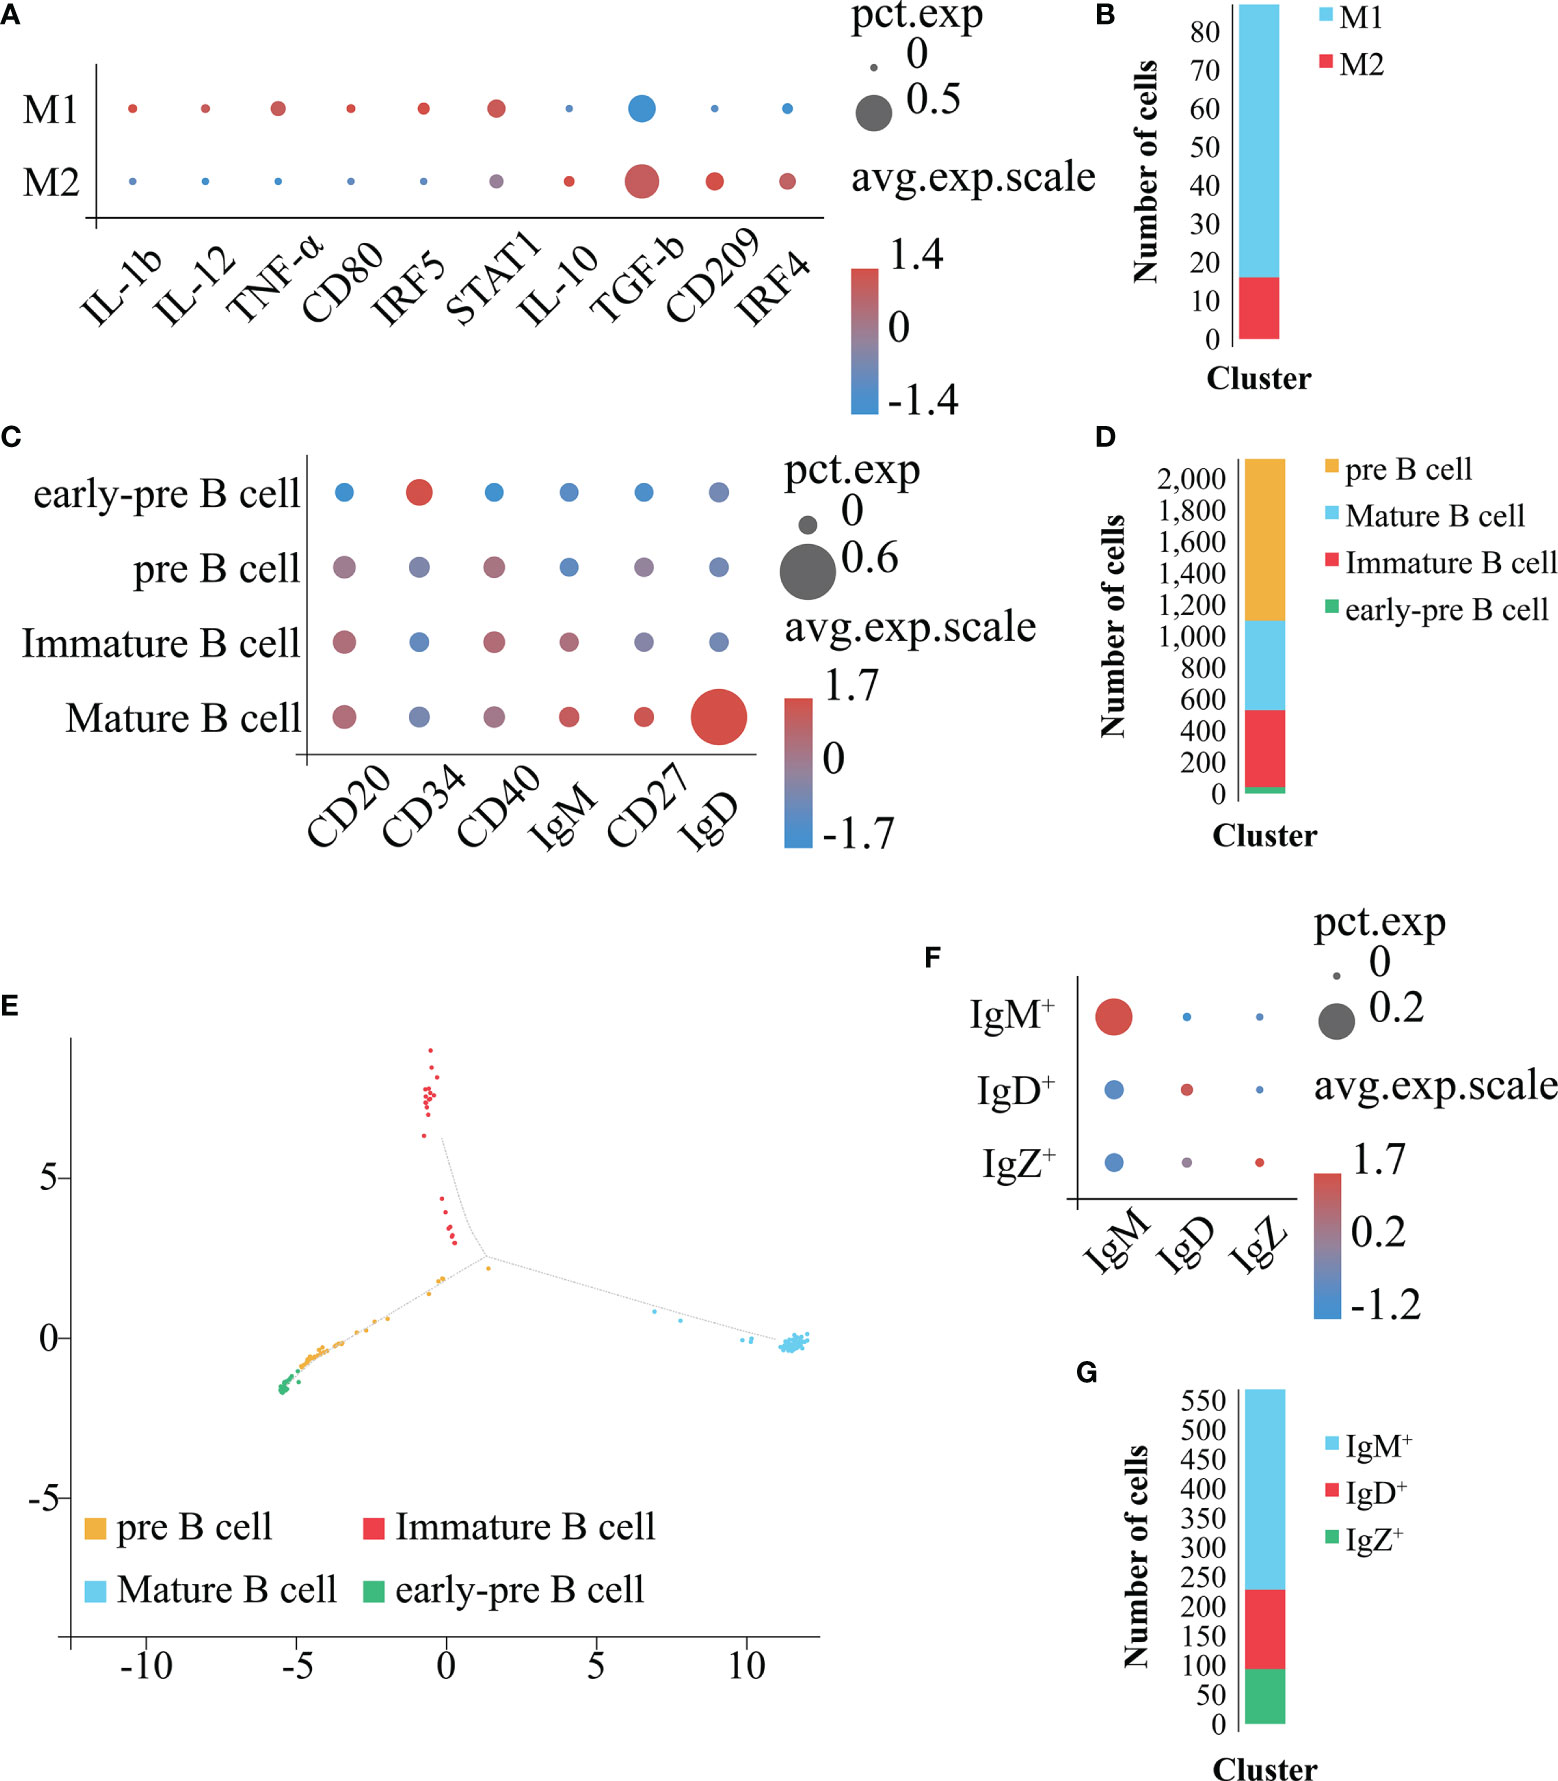
Figure 8 Identification of Mo/MΦ and B cell subpopulations. (A) Bubble plot refers to molecular expression marker in Mo/MΦ clusters. X-axis is the name of the marker gene and Y-axis the name of the Mo/MΦ subpopulation; the size of the bubble represents the ratio of the sum of the marker gene expression in a certain subpopulation to the sum of its expression in all Mo/MΦ cells; the color of the bubble represents the average expression abundance of the marker gene in the Mo/MΦ subpopulation; the more red the bubble, the higher the average expression level of the marker gene in the Mo/MΦ subpopulation. (B) Identification of the 2 Mo/MΦ subpopulations based on marker molecules. Cell subpopulations are represented by different colors (M1 type Mo/MΦ: blue, M2 type Mo/MΦ: red). (C) Bubble plot refers to molecular expression marker in all B cell clusters. X-axis is the name of the marker gene and Y-axis the name of the B cell subpopulation; the size of the bubble represents the ratio of the sum of the marker gene expression in a certain B cell subpopulation to the sum of its expression in all B cells; the color of the bubble represents the average expression abundance of the marker gene in the B cell subpopulations; the more red the bubble, the higher the average expression level of the marker gene in the B cell subpopulation. (D) Identification of 4 B cell subpopulations based on the identified marker genes. The 4 cell subpopulations are represented by different colors (Mature-B cell: blue, pre B cell: orange, Immature-B cell: red, early-pre B cell: green). (E) Pseudo-time analysis of B cell subpopulations. Each subpanel corresponds to previously identified subpopulations as shown in (D). (F) Bubble plot refers to molecular expression marker in mature B cell clusters. X-axis is the name of the marker gene and Y-axis the name of the mature B cell subpopulation; the size of the bubble represents the ratio of the sum of the marker gene expression in a certain mature B cell subpopulation to the sum of its expression in all mature B cells; the color of the bubble represents the average expression abundance of the marker gene in the mature B cell subpopulations; the more red the bubble, the higher the average expression level of the marker gene in the mature B cell subpopulation. (G) Identification of 3 mature B cell subpopulations based on the identified marker genes. The 3 cell subpopulations are represented by different colors (IgM+: blue, IgD+: red, IgZ+: green).
In order to obtain a more detailed clustering and cell classification of the B cells (Figures 8C–G), we used the above mentioned approaches to analyze the B cell population (Figure 7K). As a result, the B cell population was further sub-divided into 4 clusters: 1) the cluster with high expression level of CD34 (51) and hardly expression level of CD20 (40), CD40 (52, 53), IgM (54), CD27 (54) and IgD (55) were identified as early-pre B cell; 2) the cluster with expression of CD20 and CD40, together with hardly expression of CD34, IgM, CD27 and IgD were identified as pre B cell; 3) the cluster with expression of CD20, CD40 and IgM, together with hardly expression level of CD34, CD27 and IgD were identified as immature B cell; the cluster with the highest expression level of CD20, CD40, IgM, CD27 and IgD, together with hardly expression level of CD34 were identified as mature B cell, respectively (Figures 8C, D). To verify the reliability of the classification results, we carried out a pseudo-time analysis (Figure 8E). The obtained results display a beginning with the early-pre B cells, followed by the pre B cells, and a divergence into two fates, the immature B cells and mature B cells, respectively (Figure 8E). Therefore, the 4 B cell subsets including early-pre B cell, pre B cell, mature and immature B cell are confirmed to exist in E. coioides spleen. Further analysis on the mature B cells sub-classified them into 3 clusters: the IgM+, IgD+ and IgZ+ highly expressing IgM, IgD and IgZ, respectively (Figures 8F, G). Hence, IgM+, IgD+ and IgZ+ are confirmed to exist in E. coioides spleen. Due to the lack of the above-mentioned specific antibodies for predicting cell markers, it was not possible to further characterize and test for the function of these cells at this time.
Discussion
Although we have a deep understanding of fish immunology at the molecular level, in vitro and in vivo research on immune activity of teleost is still in its infancy. Due to the anatomical homology between vertebrates, there is an increasing interest in studying teleost physiology. At present, for specific fish leukocyte populations and subpopulations, the availability of cellular and determinant markers is very limited. This is a major and long-standing challenge faced by fish immunologists. In order to overcome this issue, many advanced technologies are applied to investigate functional immunity of teleost’s lymphocyte responses, including scRNA-seq. Yet, the existing scRNA-seq data analysis strategies rely heavily on a priori genome alignment, which constitutes the biggest obstacle for many economic fish for which no whole genome sequence is available. Hence, seeking for an alternative for reliable scRNA-seq transcriptome reconstruction for species without any reference genome is desirable.
In the present study, we proofed the power of scRNA-seq data analysis using the full-length transcriptome instead of a whole genome sequence as a reference by evaluating it for E. coioides-a teleost samples. We sequenced the full-length transcriptome of E. coioides for the first time, with a total length of 72,588,100 bp. In total, 27,405 transcripts were successfully annotated and 3,334 transcripts failed. Among them, 16,268 transcripts were found in all databases. Specifically, 19,091, 20,721, 27,339 and 25,542 transcripts were annotated by KOG, KEGG, Nr and Swissprot, respectively. The PacBio-SMRT technology used in this study improved our sequencing ability significantly and provided longer reads than the second-generation Illumina sequencing, which laid the foundation for current research on E. coioides full-length transcripts and subsequent single-cell sequencing.
Our approach enabled us to completely reconstructed most of the transcripts present in the scRNA-seq data set, whereby the sensitivity was equivalent to the approach using genome alignments of a closely related species. At the same time, the UMAP showed that cell clustering based on the full-length transcriptome performed better, i.e. cell clustering was more pronounced, and the differentiation between cell clusters was improved. Although the alignment rate to the E. lanceolatus genome was higher, there seem to be pronounced differences between the genome sequences of both E. coioides and its close relative E. lanceolatus. These would inevitably lead to the inaccuracy in sequence alignment and thus in clustering. Genome alignment of the 10× scRNA-seq, however, only uses the 96 bp sequence of the 3’ end of mRNA for alignment and clustering analysis, and the original discrimination is not high. Therefore, when using the E. lanceolatus genome as a reference, it is likely that the mRNA sequences of different genes in E. coioides align to the same gene of the E. lanceolatus genome. This would reduce the detected difference between cells in a disguised form, reducing the ability to differentiate between distinct cell types. This problem can be circumvented by using the full-length transcriptome as a reference for cell clustering as all sequences originate from E. coioides itself. Thus, our approach provides a reliable alternative for scRNA-seq data analysis in teleost without any reference whole genome.
We found that E. coioides samples comprised the complete library of B cells, T cells, NCC and Mo/MΦ, which is consistent with previous reports for zebrafish (56) and O. niloticus (16). Further analysis indicated the presence of two subsets of Mo/MΦ including M1 and M2 type, as well as four subsets in B cells, i.e. mature B cells, immature B cells, pre B cells and early-pre B cells.
Macrophages are key leukocytes for innate and adaptive immune responses (57). Macrophages are usually classified according to their polarization rather than their tissue location (58). The M1 type macrophages are typically activated and polarized by IFN-γ signaling. They produce the pro-inflammatory microenvironment by secreting inflammatory cytokines, and eliminate intracellular pathogens through the action of nitric oxide and reactive oxygen species (59, 60). Presence of M1 macrophages in the infected area indicates that macrophage polarization have occurred by sensing danger signals (61, 62). M1 macrophages are a common phenotype of phagocytes during a cell-mediated immune response (63). On the other hand, M2 macrophages have anti-inflammatory effects and play a central role in wound healing and tissue repair (64, 65). M2 macrophages can be activated by anti-inflammatory cytokines (IL-4 or IL-13) (66), and their main function is to produce extracellular matrix and polyamines to promote cell growth and division, as well as synthesis of proteins required for the healing process (67). The classical polarization of teleost macrophages after stimulation with LPS, IFN-γ + LPS, Trypanosoma borreli or zymosan parasites has been reported, while alternative polarization was observed after treatment with cAMP, prostaglandin E2 and IL-4/13 (68–75). In the present study, the clusters expressing csfr1 (46), marco (47) and CD33 (48) were identified as the Mo/MΦ population. csfr1 is the encoding gene of colony-stimulating factor 1 receptor, which is an important regulator of Mo/MΦ in many fish (46), and considered as a specific surface marker of fish Mo/MΦ. marco, the encoding gene of macrophage receptor with collagenous structure, plays important roles in phagocytic cell-mediated innate immune responses (47). marco plays key regulatory roles in the bacterial binding, clearance, as well as polarization processes of teleost Mo/MΦ (47). CD33 is a sialoadhesin molecule and a member of the immunoglobulin supergene family, which is considered to be an excellent Mo/MΦ marker (48). Furthermore, the Mo/MΦ population were sub-divided into M1 and M2 type Mo/MΦ with M1 specific markers (IL-1b, IL-12,TNF-α, CD80, IRF5 and STAT1) and M2 specific markers (IL-10, TGF-b, CD209 and IRF4) in the present study. M1 macrophages produce pro-inflammatory cytokines including IL-1b, IL-12, and TNF-α (76). Through these, the pro-inflammatory cascade is activated, which leads to the elimination of pathogens (77). Vital transcription factors involved in the classical macrophage polarization are IFN regulatory factor 5 (IRF5) and signal transducer and activator of transcription 1 (STAT1), which activate the expression of pro-inflammatory mediators such as IL-12 and TNF-α, and then enhance the biocidal function of macrophages (78). M2 macrophages produce IL-10 and transforming growth factor-b (TGF-b) and are associated with immune suppression and tissue remodeling (76). IFN regulatory factor 4 (IRF4) is one of the pivotal transcription factors involved in alternative polarization, whose activation leads to increased expression of CD209 (78). Hence, in the present study, we reasoned that the 2 Mo/MΦ subgroups including M1 and M2 type Mo/MΦ are confirmed to exist in E. coioides spleen.
B cells play a key role in the adaptive immune response of vertebrate humoral immunity. The development of mammalian B cells mainly occurs in the bone marrow (79). B cell development includes all the early stages of differentiation without antigen interaction, until maturity, antigen interaction, and finally antibody synthesis (80). B cells present different molecules at different stages of development/maturation and activation (81). Pro B cells arise after obligatory stimulation by the transcription factor PAX-5, which produces CD19. These CD34+ CD19+ CD10+ CD38+ cell surface expressing and TdT+ nuclear expressing cells lack pre B cell receptors or surface immunoglobulins, and characteristically initiate VDJ heavy chain rearrangement independent of any antigen exposure. Pro B cells were then differentiated into pre-B cells expressing CD34− CD19+ CD10+ CD38+ TdT− to obtain cytoplasm, and then surface mu heavy chains complexed with a transient surrogate immunoglobulin light chain. Immediately afterwards, a CD19+ CD10dim/− CD38dim/− immature B cell expresses surface IgM+ and physiologic light chain. Finally, CD19+ CD20+ B cells that co-express IgM and IgD heavy chains as well as lack the early differentiation markers CD34, CD10, CD38 or TdT will leave the bone marrow as transitional B cells and return to secondary lymphatic organs as fully mature B cells (82, 83).
Compared with mammals, the early B cell differentiation and diversification of antibody pools in birds do not occur in the bone marrow, but in a special gut related lymphoid tissue, the bursa of Fabricius (84). During embryonic development, B cell precursors migrate to the bursa primordium, where they proliferate and diversify the B cell receptor pool (85). Around hatch, these diverse B cells begin to migrate from the bursa of Fabricius to the peripheral lymphoid organs, but little is known about the regulation of the migration process (86). Masteller et al. proved that changes in cell surface glycosylation may be related to the colonization of the bursa of Fabricius (84). Pre-bursal and early B cells express the carbohydrate epitope sialyl Lewis(x) (CD15s), which is a carbohydrate moiety that participates in the adhesion of leukocytes to endothelial cells through selectin binding (84). In contrast, the B cells in the bursa of Fabricius were transformed into high-level expression of Lewis(x) (CD15) (87) after gene conversion. Interestingly, the loss of CD15 around ED15 is related to the time when developing B cells lose the ability to colonize the bursa of Fabricius (88). Around hatch, the surface glycosylation changed for the second time, and B cells down-regulated CD15 to low to moderate expression. Since peripheral B cells are also low in CD15, it seems likely that cells with low CD15 can leave the bursa (89, 90). Little is known about the expression of selectin E, P and O or other CD15/CD15s receptors in the bursa of Fabricius, but the reported time-limited expression patterns strongly indicate the contribution of the molecules to the bursal immigration and emigration.
B cells in fish are a kind of functional antibody-secreting cells, which are capable of producing specific antibodies to deal with certain invading foreign antigens and play an important role in adaptive immunity (91). Unlike mammals, there is no specific antibody that can accurately distinguish the development/differentiation state of teleost B cells, which hinders further research on the effect of its phagocytic function. However, detecting the expression levels of B-cell specific genes can provide a comparative method for studying the development of B-cells in teleost (92, 93). In the present study, the clusters expressing CD22 (39), CD20 (40) and CMRF35 (41) were identified as the B cell population. CD22 can not only provide co-stimulatory signals for the activation of IgM+ B cells, but also play an important regulatory role in the macropinocytosis-dependent pathway that teleost IgM+ B cells mainly rely on to internalize large particles (94, 95). CD20 is a universal B cell marker, which is expressed by most B cells from the late pre-B lymphocytes, and is closely related to immune regulation and pro-inflammatory activity (40). CMRF35 is a B cell surface protein as well as an immunoregulatory molecule, which has been observed involving in the mucosal immunity of teleost (96). Then, the B cell population was further sub-divided into 4 clusters: 1) the cluster with high expression level of CD34 (51) and hardly expression level of CD20 (40), CD40 (52, 53), IgM (54), CD27 (54) and IgD (55) were identified as early-pre B cell; 2) the cluster with high expression level of CD20 and CD40, together with hardly expression level of CD34, IgM, CD27 and IgD were identified as pre B cell; 3) the cluster with high expression level of CD20, CD40 and IgM, together with hardly expression level of CD34, CD27 and IgD were identified as immature B cell; the cluster with the highest expression level of CD20, CD40, IgM, CD27 and IgD, together with hardly expression level of CD34 were identified as mature B cell, respectively. The CD34 molecule is a highly glycosylated type I transmembrane glycoprotein that is selectively expressed on the surface of human and other mammalian pro B cells, and gradually weakens to disappear as the cells mature (51). More and more research results have shown that CD34 molecules play an important role in mediating cell adhesion (51). CD40 regulates the activation, germinal center formation, antigen presentation and antibody production in B cells (52, 53). CD27 is a TNF receptor that stimulates B cells and promotes their differentiation after being activated by the TNF ligand CD70, thereby promoting anti-infection immunity. IgM, IgD and IgZ (also named as IgT) are the only immunoglobulin classes identified in fish (97, 98). IgM is considered to be a ubiquitous vertebrate immunoglobulin, and is the first characterized teleost immunoglobulin (99, 100). IgZ is a unique teleost immunoglobulin analogous to mammalian IgA (101–103), and proved to be involved in mucosal immunity (104–107). Compared with IgM and IgT, teleost IgD functions are less investigated. However, in channel catfish (Ictalurus punctatus), IgD is considered to be a mediator of innate immunity (108). Two populations of B cells were originally described in rainbow trout: one subpopulation expresses both IgM and IgD, and the other subpopulation only expresses IgT (107). Recently a third subpopulation expressing only IgD was also identified in trout (109). Therefore, 4 B cell subsets including early-pre B cell, pre B cell, mature and immature B cell are confirmed to exist in E. coioides spleen in the present study. Further analysis on the mature B cells sub-classified them into 3 clusters: the IgM+, IgD+ and IgZ+ highly expressing IgM, IgD and IgZ, respectively. Hence, IgM+, IgD+ and IgZ+ are confirmed to exist in E. coioides spleen.
T cells are white blood cells that work with macrophages to fight infection. Two types of T cells are confirmed for mammals: helper T cells and killer T cells. The role of killer T cells is to destroy infected cells, while helper T cells coordinate their attacks. Generally speaking, T cell differentiation are as follows: naive T cells express low levels of CD62 and CCR7; effector T cells express high levels of CD62 but low levels of CCR7; effect memory T cells express high levels of CD62 and a certain level of CCR7; central memory T cells express high levels of CD62 and CCR7. In 1970s, the existence of the different T cell populations was confirmed in bony fishes for the first time (110, 111). Sea bass currently constitute the only marine organism with a specific anti-T cell marker (DLT15) (16). In the present study, the clusters with the expressions of CD3 (42, 43), LCK (44) and ZAP70 (45) were clustered into the T cell population. The TCR/CD3 complex of traditional T cells recognizes specific antigens that bind to MHC and initiates the T cell activation (42, 43). Tyrosine kinases such as Lck and ZAP70 participate in the downstream T cell activation signaling pathway after the CD3ϵ chain (44, 45) of the T cell receptor is engaged. Furthermore, T cells were sub-clustered into specific 3 subsets (data not shown). However, we failed to characterize these clusters based on known T cell markers such as CCR7 and CD62L. We suggest that further study collecting samples at different infection time points may improve this unsatisfactory situation.
Conclusion
In conclusion, we carried out scRNA-seq analysis of the entire spleen from E. coioides-a teleost whose genome has not yet been published, and analyzed the teleost’s cell composition. Our research will provide new insights to better understand the biological characteristics, development and function of immune cell populations of teleost. The usage of the full-length transcriptome as a reference, offers a reliable and improved alternative for scRNA-seq data analysis in teleost when no whole genome is available.
Data Availability Statement
The datasets presented in this study can be found in online repositories. The names of the repository/repositories and accession number(s) can be found in the article/Supplementary Material.
Ethics Statement
The animal study was reviewed and approved by The Animal Ethics Committee of Jimei University.
Author Contributions
QY, LH, and YQ conceived the experiments. All authors assisted in the collection and interpretation of data. LH, QY, and H-PG wrote the manuscript. All authors contributed to the article and approved the submitted version.
Funding
This work was supported by the Natural Science Foundation of Fujian Province (No. 2019J06020 and 2019J01695); the National Natural Science Foundation of China under contract No.41502319; the Innovation Driven Development Foundation of Guangxi (No. AD19245135 and AD19245161); the Doctoral Research Startup Fund of the Fourth Institute of Oceanography, Ministry of Natural Resources (No. 201803 and 201806); and the Fund of Hainan Provincial Key Laboratory of Tropical Maricultural Technologies (No. TMTOF202104).
Conflict of Interest
The authors declare that the research was conducted in the absence of any commercial or financial relationships that could be construed as a potential conflict of interest.
Publisher’s Note
All claims expressed in this article are solely those of the authors and do not necessarily represent those of their affiliated organizations, or those of the publisher, the editors and the reviewers. Any product that may be evaluated in this article, or claim that may be made by its manufacturer, is not guaranteed or endorsed by the publisher.
Supplementary Material
The Supplementary Material for this article can be found online at: https://www.frontiersin.org/articles/10.3389/fimmu.2021.737332/full#supplementary-material
Supplementary Figure 1 | Prediction of the lncRNA and alternative splicing events. (A) Venn diagram of lncRNA prediction results. (B) Statistic results of alternative splicing (AS) events. A3, alternative 3’ splice site; A5, alternative 5’ splice site; AF, alternative first exon; AL, alternative last exon; MX, mutually exclusive exon; RI, retained intron; SE, skipped exon.
Supplementary Figure 2 | Mapping results of cell clustering based on the whole genome of E. lanceolatus back to the results of the full-length transcriptome. The tSNE nonlinear clustering was used to visualize the results.
Supplementary Figure 3 | Visualization of the classification results of E. coioides spleen cell populations based on the full-length transcriptome (A) and E. lanceolatus whole genome (B) with UMAP.
Supplementary Table 1 | Ordering Genes.
Supplementary Table 2 | Detailed gene expression results of each cell population based on the E. lanceolatus genome.
References
1. Food and Agriculture Organization of the United Nations (FAO). The State of World Fisheries and Aquaculture. Rome, Italy: FAO (2016).
2. Zhong Y, Qi W, Xu W, Zhao L, Xiao B, Yan Q, F. Insights Into Mesophilic Virulence, Antibiotic Resistant and Human Pathogenicity: A Genomics Study on the Aeromonas Salmonicida SRW-OG1 Newly Isolated From the Asian Fish Epinephelus Coioides. Aquaculture (2021) 539:736630. doi: 10.1016/j.aquaculture.2021.736630
3. Sudhagar A, Kumar G, El-Matbouli M. Transcriptome Analysis Based on RNA-Seq in Understanding Pathogenic Mechanisms of Diseases and the Immune System of Fish: A Comprehensive Review. Int J Mol Sci (2018) 19(1):245. doi: 10.3390/ijms19010245
4. Huang L, Zuo Y, Qin Y, Zhao L, Lin M, Yan Q. The Zinc Nutritional Immunity of Epinephelus Coioides Contributes to the Importance of znuC During Pseudomonas Plecoglossicida Infection. Front Immunol (2021) 12:678699. doi: 10.3389/fimmu.2021.678699
5. He R, Zuo Y, Zhao L, Ma Y, Yan Q, Huang L. Copper Stress by Nutritional Immunity Activates the CusS-CusR Two-Component System That Contributes to Vibrio Alginolyticus Anti-Host Response But Affects Virulence-Related Properties. Aquaculture (2021) 532:736012. doi: 10.1016/j.aquaculture.2020.736012
6. Xin G, Wang F, Zhao L, Qin Y, Huang L, Yan Q. Integration of RNA-Seq and RNAi Provides a Novel Insight Into the Effect of pvdE Gene to the Pathogenic of Pseudomonas Plecoglossicida and on the Immune Responses of Orange-Spotted Grouper (Epinephelus Coioides). Aquaculture (2020) 529:735695. doi: 10.1016/j.aquaculture.2020.735695
7. Wang L, Liu Z, Zhao L, Huang L, Qin Y, Su Y, et al. Dual RNA-Seq Provides Novel Insight Into the Roles of dksA From Pseudomonas Plecoglossicida in Pathogen-Host Interactions With Large Yellow Croakers (Larimichthys Crocea). Zool Res (2020) 41(4):410. doi: 10.24272/j.issn.2095-8137.2020.048
8. Tang Y, Xin G, Zhao L, Huang L, Qin Y, Su Y, et al. Novel Insights Into Host-Pathogen Interactions of Large Yellow Croakers (Larimichthys Crocea) and Pathogenic Bacterium Pseudomonas Plecoglossicida Using Time-Resolved Dual RNA-Seq of Infected Spleens. Zool Res (2020) 41(3):314. doi: 10.24272/j.issn.2095-8137.2020.035
9. Huang L, Zhao L, Qi W, Xu X, Zhang J, Zhang J, et al. Temperature-Specific Expression of Cspa1 Contributes to Activation of sigX During Pathogenesis and Intracellular Survival in Pseudomonas Plecoglossicida. Aquaculture (2020) 518:734861. doi: 10.1016/j.aquaculture.2019.734861
10. Tang R, Zhao L, Xu X, Huang L, Qin Y, Su Y, et al. Dual RNA-Seq Uncovers the Function of an ABC Transporter Gene in the Host-Pathogen Interaction Between Epinephelus Coioides and Pseudomonas Plecoglossicida. Fish Shellfish Immunol (2019) 92:45–53. doi: 10.1016/j.fsi.2019.05.046
11. Luo G, Zhao L, Xu X, Qin Y, Huang L, Su Y, et al. Integrated Dual RNA-Seq and Dual iTRAQ of Infected Tissue Reveals the Functions of a Diguanylate Cyclase Gene of Pseudomonas Plecoglossicida in Host-Pathogen Interactions With Epinephelus Coioides. Fish Shellfish Immunol (2019) 95:481–90. doi: 10.1016/j.fsi.2019.11.008
12. Tang Y, Sun Y, Zhao L, Xu X, Huang L, Qin Y, et al. Mechanistic Insight Into the Roles of Pseudomonas Plecoglossicida clpV Gene in Host-Pathogen Interactions With Larimichthys Crocea by Dual RNA-Seq. Fish Shellfish Immunol (2019) 93:344–53. doi: 10.1016/j.fsi.2019.07.066
13. Randelli E, Buonocore F, Scapigliati G. Cell Markers and Determinants in Fish Immunology. Fish Shellfish Immunol (2008) 25(4):326–40. doi: 10.1016/j.fsi.2008.03.019
14. Scapigliati G. Functional Aspects of Fish Lymphocytes. Dev Comp Immunol (2013) 41(2):200–8. doi: 10.1016/j.dci.2013.05.012
15. Linnarsson S, Teichmann SA. Single-Cell Genomics: Coming of Age. Genome Biol (2016) 17:97. doi: 10.1186/s13059-016-0960-x
16. Niu J, Huang Y, Liu X, Zhang Z, Tang J, Wang B, et al. Single-Cell RNA-Seq Reveals Different Subsets of Non-Specific Cytotoxic Cells in Teleost. Genomics (2020) 112(6):5170–9. doi: 10.1016/j.ygeno.2020.09.031
17. Luo G, Sun Y, Huang L, Su Y, Zhao L, Qin Y, et al. Time-Resolved Dual RNA-Seq of Tissue Uncovers Pseudomonas Plecoglossicida Key Virulence Genes in Host-Pathogen Interaction With Epinephelus Coioides. Environ Microbiol (2020) 22(2):677–93. doi: 10.1111/1462-2920.14884
18. Tang R, Luo G, Zhao L, Huang L, Xu X, Qin Y, et al. The Effect of a LysR-Type Transcriptional Regulator Gene of Pseudomonas Plecoglossicida on the Immune Responses of Epinephelus Coioides. Fish Shellfish Immunol (2019) 89:420–7. doi: 10.1016/j.fsi.2019.03.051
19. Sun Y, Zhuang Z, Wang X, Huang H, Fu Q, Yan Q. Dual RNA-Seq Reveals the Effect of the flgM Gene of Pseudomonas Plecoglossicida on the Immune Response of Epinephelus Coioides. Fish Shellfish Immunol (2019) 87:515–23. doi: 10.1016/j.fsi.2019.01.041
20. Huang L, Zuo Y, Jiang Q, Su Y, Qin Y, Xu X, et al. A Metabolomic Investigation Into the Temperature-Dependent Virulence of Pseudomonas Plecoglossicida From Large Yellow Croaker (Pseudosciaena Crocea). J Fish Dis (2019) 42(3):431–46. doi: 10.1111/jfd.12957
21. Li C, Wang S, Ren Q, He T, Chen X. An Outbreak of Visceral White Nodules Disease Caused by Pseudomonas Plecoglossicida at a Water Temperature of 12°C in Cultured Large Yellow Croaker (Larimichthys Crocea) in China. J Fish Dis (2020) 43(11):1353–61. doi: 10.1111/jfd.13206
22. Li K, Li W, Chen X, Luo T, Mu Y, Chen X. Molecular and Functional Identification of a β-Defensin Homolog in Large Yellow Croaker (Larimichthys Crocea). J Fish Dis (2021) 44(4):391–400. doi: 10.1111/jfd.13324
23. Luo G, Xu X, Zhao L, Qin Y, Huang L, Su Y, et al. clpV Is a Key Virulence Gene During In Vivo Pseudomonas Plecoglossicida Infection. J Fish Dis (2019) 42(7):991–1000. doi: 10.1111/jfd.13001
24. Sun Y, Nie P, Zhao L, Huang L, Qin Y, Xu X, et al. Dual RNA-Seq Unveils the Role of the Pseudomonas Plecoglossicida fliA Gene in Pathogen-Host Interaction With Larimichthys Crocea. Microorganisms (2019) 7(10):443. doi: 10.3390/microorganisms7100443
25. Gordon SP, Tseng E, Salamov A, Zhang J, Meng X, Zhao Z, et al. Widespread Polycistronic Transcripts in Fungi Revealed by Single-Molecule mRNA Sequencing. PloS One (2015) 10:e0132628. doi: 10.1371/journal.pone.0132628
26. McGinnis S, Madden TL. BLAST: At the Core of a Powerful and Diverse Set of Sequence Analysis Tools. Nucleic Acids Res (2004) 32:W20–5. doi: 10.1093/nar/gkh435
27. Moriya Y, Itoh M, Okuda S, Yoshizawa AC, Kanehisa M. KAAS: An Automatic Genome Annotation and Pathway Reconstruction Server. Nucleic Acids Res (2007) 35:W182–5. doi: 10.1093/nar/gkm321
28. Shimizu K, Adachi J, Muraoka Y. ANGLE: A Sequencing Errors Resistant Program for Predicting Protein Coding Regions in Unfinished cDNA. J Bioinform Comput Biol (2006) 4:649–64. doi: 10.1142/S0219720006002260
29. Kong L, Zhang Y, Ye ZQ, Liu XQ, Zhao SQ, Wei L, et al. CPC: Assess the Protein-Coding Potential of Transcripts Using Sequence Features and Support Vector Machine. Nucleic Acids Res (2007) 35:W345–9. doi: 10.1093/nar/gkm391
30. Li AM, Zhang JY, Zhou ZY. PLEK: A Tool for Predicting Long Non-Coding RNAs and Messenger RNAs Based on an Improved K-Mer Scheme. BMC Bioinf (2014) 15(1):311. doi: 10.1186/1471-2105-15-S8-S1
31. Finn RD, Coggill P, Eberhardt RY, Eddy SR, Mistry J, Mitchell AL, et al. The Pfam Protein Families Database: Towards a More Sustainable Future. Nucleic Acids Res (2016) 44:D279–85. doi: 10.1093/nar/gkv1344
32. Sun L, Luo H, Bu D, Zhao G, Yu K, Zhang C, et al. Utilizing Sequence Intrinsic Composition to Classify Protein-Coding and Long Non-Coding Transcripts. Nucleic Acids Res (2013) 41(17):e166. doi: 10.1093/nar/gkt646
33. Trincado JL, Entizne JC, Hysenaj G, Singh B, Skalic M, Elliott DJ, et al. SUPPA2: Fast, Accurate, and Uncertainty-Aware Differential Splicing Analysis Across Multiple Conditions. Genome Biol (2018) 19:40. doi: 10.1186/s13059-018-1417-1
34. Satija R, Farrell JA, Gennert D, Schier AF, Regev A. Spatial Reconstruction of Single-Cell Gene Expression Data, Nat. Biotechnol (2015) 33:495–502. doi: 10.1038/nbt.3192
35. Dobin A, Davis CA, Schlesinger F, Drenkow J, Zaleski C, Jha S, et al. STAR: Ultrafast Universal RNA-Seq Aligner. Bioinformatics (2013) 29:15–21. doi: 10.1093/bioinformatics/bts635
36. McDavid A, Finak G, Chattopadyay PK, Dominguez M, Lamoreaux L, Ma SS, et al. Data Exploration, Quality Control and Testing in Single-Cell qPCR-Based Gene Expression Experiments. Bioinformatics (2012) 29:461–7. doi: 10.1093/bioinformatics/bts714
37. Fonville JM, Carter CL, Pizarro L, Steven RT, Palmer AD, Griffiths RL, et al. Hyperspectral Visualization of Mass Spectrometry Imaging Data, Anal. Chem (2013) 85:1415–23. doi: 10.1021/ac302330a
38. Berleant D, White M, Pierce E, Tudoreanu E, Boeszoermenyi A, Shtridelman Y, et al. The Genetic Code–More Than Just a Table. Cell Biochem Biophys (2009) 55(2):107–16. doi: 10.1007/s12013-009-9060-9
39. Clark EA, Giltiay NV. CD22: A Regulator of Innate and Adaptive B Cell Responses and Autoimmunity. Front Immunol (2018) 9:2235. doi: 10.3389/fimmu.2018.02235
40. Pavlasova G, Mraz M. The Regulation and Function of CD20: An “Enigma” of B-Cell Biology and Targeted Therapy. Haematologica (2020) 105(6):1494–506. doi: 10.3324/haematol.2019.243543
41. Clark GJ, Rao M, Ju X, Hart DN. Novel Human CD4+ T Lymphocyte Subpopulations Defined by CD300a/c Molecule Expression. J Leukoc Biol (2007) 82(5):1126–35. doi: 10.1189/jlb.0107035
42. Pahl JHW, Cerwenka A, Ni J. Memory-Like NK Cells: Remembering a Previous Activation by Cytokines and NK Cell Receptors. Front Immunol (2018) 9:2796. doi: 10.3389/fimmu.2018.02796
43. Lu J, Teh C, Kishore U, Reid KB. Collectins and Ficolins: Sugar Pattern Recognition Molecules of the Mammalian Innate Immune System. Biochim Biophys Acta (2002) 1572(2-3):387–400. doi: 10.1016/S0304-4165(02)00320-3
44. Leclercq G, Haegel H, Schneider A, Giusti AM, Marrer-Berger E, Boetsch C, et al. Src/lck Inhibitor Dasatinib Reversibly Switches Off Cytokine Release and T Cell Cytotoxicity Following Stimulation With T Cell Bispecific Antibodies. J Immunother Cancer (2021) 9(7):e002582. doi: 10.1136/jitc-2021-002582
45. Forster M, Moran T, Beaven A, Voorhees T. Novel ZAP-70-Related Immunodeficiency Presenting With Epstein-Barr Virus Lymphoproliferative Disorder and Hemophagocytic Lymphohistiocytosis. Case Rep Immunol (2021) 2021:6587323. doi: 10.1155/2021/6587323
46. Chen Q, Lu XJ, Chen J. Identification and Functional Characterization of the CSF1R Gene From Grass Carp Ctenopharyngodon Idellus and Its Use as a Marker of Monocytes/Macrophages. Fish Shellfish Immunol (2015) 45(2):386–98. doi: 10.1016/j.fsi.2015.04.029
47. Zhang L, Nie L, Cai SY, Chen J, Chen J. Role of a Macrophage Receptor With Collagenous Structure (MARCO) in Regulating Monocyte/Macrophage Functions in Ayu, Plecoglossus Altivelis. Fish Shellfish Immunol (2018) 74:141–51. doi: 10.1016/j.fsi.2017.12.059
48. Junker U, Kalfoglou CS, Moon JJ, Beck MK, Kaneshima H, Böhnlein E. Inhibition of Human Immunodeficiency Virus Type 1 Replication in Myelomonocytic Cells Derived From Retroviral Vector-Transduced Peripheral Blood Progenitor Cells. Hum Gene Ther (1998) 9(3):333–40. doi: 10.1089/hum.1998.9.3-333
49. Zhang H, Serrero G. Inhibition of Tumorigenicity of the Teratoma PC Cell Line by Transfection With Antisense cDNA for PC Cell-Derived Growth Factor (PCDGF, Epithelin/Granulin Precursor). Proc Natl Acad Sci USA. (1998) 95(24):14202–7. doi: 10.1073/pnas.95.24.14202
50. Hariharan P, Colah R, Ghosh K, Nadkarni A. Differential Role of Kruppel Like Factor 1 (KLF1) Gene in Red Blood Cell Disorders. Genomics (2019) 111(6):1771–6. doi: 10.1016/j.ygeno.2018.11.032
51. Nutt SL, Hodgkin PD, Tarlinton DM, Corcoran LM. The Generation of Antibody-Secreting Plasma Cells. Nat Rev Immunol (2015) 15(3):160–71. doi: 10.1038/nri3795
52. van Hooren L, Vaccaro A, Ramachandran M, Vazaios K, Libard S, van de Walle T, et al. Agonistic CD40 Therapy Induces Tertiary Lymphoid Structures But Impairs Responses to Checkpoint Blockade in Glioma. Nat Commun (2021) 12(1):4127. doi: 10.1038/s41467-021-24347-7
53. Saellstrom S, Sadeghi A, Eriksson E, Segall T, Dimopoulou M, Korsgren O, et al. Adenoviral CD40 Ligand Immunotherapy in 32 Canine Malignant Melanomas-Long-Term Follow Up. Front Vet Sci (2021) 8:695222. doi: 10.3389/fvets.2021.695222
54. Ciocca M, Zaffina S, Fernandez Salinas A, Bocci C, Palomba P, Conti MG, et al. Evolution of Human Memory B Cells From Childhood to Old Age. Front Immunol (2021) 12:690534. doi: 10.3389/fimmu.2021.690534
55. Simon D, Balogh P, Erdő-Bonyár S, Böröcz K, Minier T, Czirják L, et al. Increased Frequency of Activated Switched Memory B Cells and Its Association With the Presence of Pulmonary Fibrosis in Diffuse Cutaneous Systemic Sclerosis Patients. Front Immunol (2021) 12:686483. doi: 10.3389/fimmu.2021.686483
56. Carmona SJ, Teichmann SA, Ferreira L, Macaulay IC, Stubbington MJ, Cvejic A, et al. Single-Cell Transcriptome Analysis of Fish Immune Cells Provides Insight Into the Evolution of Vertebrate Immune Cell Types. Genome Res (2017) 27(3):451–61. doi: 10.1101/gr.207704.116
57. Plowden J, Renshaw-Hoelscher M, Engleman C, Katz J, Sambhara S. Innate Immunity in Aging: Impact on Macrophage Function. Aging Cell (2004) 3:161–7. doi: 10.1111/j.1474-9728.2004.00102.x
58. Malik MS, Bjørgen H, Nyman IB, Wessel Ø, Koppang EO, Dahle MK, et al. PRV-1 Infected Macrophages in Melanized Focal Changes in White Muscle of Atlantic Salmon (Salmo Salar) Correlates With a Pro-Inflammatory Environment. Front Immunol (2021) 12:664624. doi: 10.3389/fimmu.2021.664624
59. Gordon S. The Macrophage: Past, Present and Future. Eur J Immunol (2007) 37:S9–S17. doi: 10.1002/eji.200737638
60. Gordon S, Taylor PR. Monocyte and Macrophage Heterogeneity. Nat Rev Immunol (2005) 5:953–64. doi: 10.1038/nri1733
61. Kanwal Z, Wiegertjes GF, Veneman WJ, Meijer AH, Spaink HP. Comparative Studies of Toll-Like Receptor Signalling Using Zebrafish. Dev Comp Immunol (2014) 46:35–52. doi: 10.1016/j.dci.2014.02.003
62. Aoki T, Hikima J-i, Hwang SD, Jung TS. Innate Immunity of Finfish: Primordial Conservation and Function of Viral Rna Sensors in Teleosts. Fish Shellfish Immunol (2013) 35:1689–702. doi: 10.1016/j.fsi.2013.02.005
63. Gordon S. Alternative Activation of Macrophages. Nat Rev Immunol (2003) 3:23–35. doi: 10.1038/nri978
64. Martinez FO, Helming L, Gordon S. Alternative Activation of Macrophages: An Immunologic Functional Perspective. Annu Rev Immunol (2009) 27:451–83. doi: 10.1146/annurev.immunol.021908.132532
65. Mills CD, Ley K. M1 and M2 Macrophages: The Chicken and the Egg of Immunity. J Innate Immun (2014) 6:716–26. doi: 10.1159/000364945
66. Martinez FO, Gordon S. The M1 and M2 Paradigm of Macrophage Activation: Time for Reassessment. F1000prime Rep (2014) 6:13. doi: 10.12703/P6-13
67. Wiegertjes GF, Wentzel AS, Spaink HP, Elks PM, Fink IR. Polarization of Immune Responses in Fish: The ‘Macrophages First’point of View. Mol Immunol (2016) 69:146–56. doi: 10.1016/j.molimm.2015.09.026
68. Hodgkinson JW, Fibke C, Belosevic M. Recombinant IL-4/13A and IL-4/13B Induce Arginase Activity and Down-Regulate Nitric Oxide Response of Primary Goldfish (Carassius Auratus L.) Macrophages. Dev Comp Immunol (2017) 67:377–84. doi: 10.1016/j.dci.2016.08.014
69. Fink IR, Elks PM, Wentzel AS, Spaink HP, Wiegertjes GF. Polarization of Immune Responses in Fish: The ‘Macrophages First’ Point of View. Mol Immunol (2015) 69:146–56. doi: 10.1016/j.molimm.2015.09.026
70. Mao K, Chen W, Mu Y, Ao J, Chen X. Identification of Two IL-4/13 Homologues in Large Yellow Croaker (Larimichthys Crocea) Revealed Their Similar Roles in Inducing Alternative Activation of Monocytes/Macrophages. Fish Shellfish Immunol (2018) 80:180–90. doi: 10.1016/j.fsi.2018.06.002
71. Montero J, Gómez-Abellán V, Arizcun M, Mulero V, Sepulcre MP. Prostaglandin E2 Promotes M2 Polarization of Macrophages via a cAMP/CREB Signaling Pathway and Deactivates Granulocytes in Teleost Fish. Fish Shellfish Immunol (2016) 55:632–41. doi: 10.1016/j.fsi.2016.06.044
72. Wentzel AS, Janssen JJE, de Boer VCJ, van Veen WG, Forlenza M, Wiegertjes GF. Fish Macrophages Show Distinct Metabolic Signatures Upon Polarization. Front Immunol (2020) 11:1–10. doi: 10.3389/fimmu.2020.00152
73. Wentzel AS, Petit J, van Veen WG, Fink IR, Scheer MH, Piazzon MC, et al. Transcriptome Sequencing Supports a Conservation of Macrophage Polarization in Fish. Sci Rep (2020) 10:1–15. doi: 10.1038/s41598-020-70248-y
74. Maciuszek M, Rydz L, ´Switakowska I, Verburg-van Kemenade BML, Chadzi´ nska M. E Ects of Stress and Cortisol on the Polarization of Carp Macrophages. Fish Shellfish Immunol (2019) 94:27–37. doi: 10.1016/j.fsi.2019.08.064
75. Maciuszek M, Klak K, Rydz L, Verburg-van Kemenade BML, Chadzinska M. Cortisol Metabolism in Carp Macrophages: A Role for Macrophage-Derived Cortisol in M1/M2 Polarization. Int J Mol Sci (2020) 21(23):8954. doi: 10.3390/ijms21238954
76. Mantovani A, Sica A, Sozzani S, Allavena P, Vecchi A, Locati M. The Chemokine System in Diverse Forms of Macrophage Activation and Polarization. Trends Immunol (2004) 25:677–86. doi: 10.1016/j.it.2004.09.015
77. Biswas SK, Chittezhath M, Shalova IN, Lim JY. Macrophage Polarization and Plasticity in Health and Disease. Immunol Res (2012) 53:11–24. doi: 10.1007/s12026-012-8291-9
78. Lawrence T, Natoli G. Transcriptional Regulation of Macrophage Polarization: Enabling Diversity With Identity. Nat Rev Immunol (2011) 11:750–61. doi: 10.1038/nri3088
79. Bagwell CB, Hill BL, Wood BL, Wallace PK, Alrazzak M, Kelliher AS, et al. Human B-Cell and Progenitor Stages as Determined by Probability State Modeling of Multidimensional Cytometry Data. Cytom B Clin Cytom (2015) 88(4):214–26. doi: 10.1002/cyto.b.21243
80. Krause D, Scadden D, Preffer F. The Hematopoietic Stem Cell Niche- Home for Friend and Foe? Cytom B Clin Cytom (2013) 84:78–20. doi: 10.1002/cyto.b.21066
81. Campo E, Jaffe E, Harris N. Normal Lymphoid Organs and Tissues. In: Jaffe E, Harris N, Vardiman J, Campo E, Arber D, editors. Hematopathology. Philadelphia, PA: Saunders/Elsevier (2011). p. 97–139.
82. Sanz E, Munoz A, Monserrat J, Van-Den-Rym A, Escoll P, Ranz I, et al. Ordering Human CD34+CD10–CD19+ Pre/Pro-B-Cell and CD19– Common Lymphoid Progenitor Stages in Two Pro-B-Cell Development Pathways. Proc Natl Acad Sci USA (2010) 107:5925–30. doi: 10.1073/pnas.0907942107
83. Warnaz K, Schlesier M. Flow Cytometric Phenotyping of Common Variable Immunodeficiency. Cytom B Clin Cytom (2008) 74B:261–71. doi: 10.1002/cyto.b.20432
84. Nagy N, Busalt F, Halasy V, Kohn M, Schmieder S, Fejszak N, et al. In and Out of the Bursa—The Role of CXCR4 in Chicken B Cell Development. Front Immunol (2020) 11:1468. doi: 10.3389/fimmu.2020.01468
85. Ratcliffe MJ. The Ontogeny and Cloning of B Cells in the Bursa of Fabricius. Immunol Today (1985) 6:223–27. doi: 10.1016/0167-5699(85)90039-8
86. Le Douarin NM, Houssaint E, Jotereau FV, Belo M. Origin of Hemopoietic Stem Cells in Embryonic Bursa of Fabricius and Bone Marrow Studied Through Interspecific Chimeras. Proc Natl Acad Sci USA (1975) 72:2701–5. doi: 10.1073/pnas.72.7.2701
87. Masteller EL, Lee KP, Carlson LM, Thompson CB. Expression of Sialyl Lewis(X) and Lewis(X) Defines Distinct Stages of Chicken B Cell Maturation. J Immunol (1995) 155:5550–6.
88. Palojoki E, Jalkanen S, Toivanen P. Sialyl lewisX Carbohydrate Is Expressed Differentially During Avian Lymphoid Cell Development. Eur J Immunol (1995) 25:2544–50. doi: 10.1002/eji.1830250921
89. Masteller EL, Larsen RD, Carlson LM, Pickel JM, Nickoloff B, Lowe J, et al. Chicken B Cells Undergo Discrete Developmental Changes in Surface Carbohydrate Structure That Appear to Play a Role in Directing Lymphocyte Migration During Embryogenesis. Development (1995) 121:1657–67. doi: 10.1242/dev.121.6.1657
90. Beck TC, Gomes AC, Cyster JG, Pereira JP. CXCR4 and a Cell-Extrinsic Mechanism Control Immature B Lymphocyte Egress From Bone Marrow. J Exp Med (2014) 211:2567–81. doi: 10.1084/jem.20140457
91. Parra D, Takizawa F, Sunyer JO. Evolution of B Cell Immunity. Annu Rev Anim Biosci (2013) 1:65–97. doi: 10.1146/annurev-animal-031412-103651
92. Northrup DL, Allman D. Transcriptional Regulation of Early B Cell Development. Immunol Res (2008) 42:106–17. doi: 10.1007/s12026-008-8043-z
93. Wu L, Qin Z, Liu H, Lin L, Ye J, Li J. Recent Advances on Phagocytic B Cells in Teleost Fish. Front Immunol (2020) 11:824. doi: 10.3389/fimmu.2020.00824
94. Li Y, Sun L, Li J. Internalization of Large Particles by Turbot (Scophthalmus Maximus) IgM(+) B Cells Mainly Depends on Macropinocytosis. Dev Comp Immunol (2018) 82:31–8. doi: 10.1016/j.dci.2017.12.028
95. Li Y, Sun L, Li J. Macropinocytosis-Dependent Endocytosis of Japanese Flounder IgM(+) B Cells and Its Regulation by CD22. Fish Shellfish Immunol (2019) 84:138–47. doi: 10.1016/j.fsi.2018.09.068
96. Tadiso TM, Sharma A, Hordvik I. Analysis of Polymeric Immunoglobulin Receptor- and CD300-Like Molecules From Atlantic Salmon. Mol Immunol (2011) 49(3):462–73. doi: 10.1016/j.molimm.2011.09.013
97. Fillatreau S, Six A, Magadan S, Castro R, Sunyer JO, Boudinot P. The Astonishing Diversity of Ig Classes and B Cell Repertoires in Teleost Fish. Front Immunol (2013) 4:28. doi: 10.3389/fimmu.2013.00028
98. Hordvik I. Immunoglobulin Isotypes in Atlantic Salmon, Salmo Salar. Biomolecules (2015) 5:166–77. doi: 10.3390/biom5010166
99. Bengten E, Clem LW, Miller NW, Warr GW, Wilson M. Channel Catfish Immunoglobulins: Repertoire and Expression. Dev Comp Immunol (2006) 30:77–92. doi: 10.1016/j.dci.2005.06.016
100. Mashoof S, Criscitiello MF. Fish Immunoglobulins. Biol (Basel) (2016) 5(4):45. doi: 10.3390/biology5040045
101. Danilova N, Bussmann J, Jekosch K, Steiner LA. The Immunoglobulin Heavy-Chain Locus in Zebrafish: Identification and Expression of a Previously Unknown Isotype, Immunoglobulin Z. Nat Immunol (2005) 6(3):295–302. doi: 10.1038/ni1166
102. Hansen JD, Landis E, Phillips RB. Discovery of a Unique Ig Heavy-Chain Isotype (IgT) in Rainbow Trout: Implications for a Distinctive B Cell Developmental Pathway in Teleost Fish. PNAS (2005) 102:6919–24. doi: 10.1073/pnas.0500027102
103. Tadiso TM, Lie KK, Hordvik I. Molecular Cloning of IgT From Atlantic Salmon, and Analysis of the Relative Expression of Tau, Mu, and Delta in Different Tissues. Vet Immunol Immunopathol (2011) 139:17–26. doi: 10.1016/j.vetimm.2010.07.024
104. Sunyer JO. Fishing for Mammalian Paradigms in the Teleost Immune System. Nat Immunol (2013) 14:320–6. doi: 10.1038/ni.2549
105. Xu Z, Parra D, Gómez D, Salinas I, Zhang YA, von Gersdorff Jørgensen L, et al. Teleost Skin, an Ancient Mucosal Surface That Elicits Gut-Like Immune Responses. Proc Natl Acad Sci USA (2013) 110:13097–102. doi: 10.1073/pnas.1304319110
106. Xu Z, Takizawa F, Parra D, Gómez D, von Gersdorff Jørgensen L, LaPatra SE, et al. Mucosal Immunoglobulins at Respiratory Surfaces Mark an Ancient Association That Predates the Emergence of Tetrapods. Nat Commun (2016) 7:10728. doi: 10.1038/ncomms10728
107. Zhang YA, Salinas I, Li J, Parra D, Bjork S, Xu Z, et al. IgT, A Primitive Immunoglobulin Class Specialized in Mucosal Immunity. Nat Immunol (2010) 11:827–35. doi: 10.1038/ni.1913
108. Edholm ES, Bengtén E, Stafford JL, Sahoo M, Taylor EB, Miller NW, et al. Identification of Two IgD + B Cell Populations in Channel Catfish, Ictalurus Punctatus. J Immunol (2010) 185:4082–94. doi: 10.4049/jimmunol.1000631
109. Castro R, Bromage E, Abós B, Pignatelli J, González Granja A, Luque A, et al. CCR7 Is Mainly Expressed in Teleost Gills, Where It Defines an IgD + IgM- B Lymphocyte Subset. J Immunol (2014) 192:1257–66. doi: 10.4049/jimmunol.1302471
110. Stolen S, Makela O. Carrier Preimmunisation in the Antihapten Response of a Marine Fish. Nature (1975) 254:718e9. doi: 10.1038/254718a0
Keywords: scRNA-seq, full-length transcriptome, immune cell population, teleost, infection
Citation: Huang L, Qiao Y, Xu W, Gong L, He R, Qi W, Gao Q, Cai H, Grossart H-P and Yan Q (2021) Full-Length Transcriptome: A Reliable Alternative for Single-Cell RNA-Seq Analysis in the Spleen of Teleost Without Reference Genome. Front. Immunol. 12:737332. doi: 10.3389/fimmu.2021.737332
Received: 06 July 2021; Accepted: 10 September 2021;
Published: 27 September 2021.
Edited by:
Jia Cai, Guangdong Ocean University, ChinaReviewed by:
Xinhua Chen, Fujian Agriculture and Forestry University, ChinaTianjun Xu, Shanghai Ocean University, China
Copyright © 2021 Huang, Qiao, Xu, Gong, He, Qi, Gao, Cai, Grossart and Yan. This is an open-access article distributed under the terms of the Creative Commons Attribution License (CC BY). The use, distribution or reproduction in other forums is permitted, provided the original author(s) and the copyright owner(s) are credited and that the original publication in this journal is cited, in accordance with accepted academic practice. No use, distribution or reproduction is permitted which does not comply with these terms.
*Correspondence: Qingpi Yan, yanqp@jmu.edu.cn; Hans-Peter Grossart, hgrossart@igb-berlin.de
†These authors share first authorship