Net Heterotrophy in the Amazon Continental Shelf Changes Rapidly to a Sink of CO2 in the Outer Amazon Plume
 Nathalie Lefèvre1*
  Manuel Flores Montes2
  Felipe L. Gaspar2
  Carlos Rocha3 Shan Jiang3
  Moacyr C. De Araújo2,4
  J. Severino Pino Ibánhez2
- 1LOCEAN, IRD, Sorbonne Universités, UPMC, Paris, France
- 2Department of Oceanography, Federal University of Pernambuco, Recife, Brazil
- 3Biogeochemistry Research Group, Geography Department, School of Natural Sciences, Trinity College Dublin, Dublin, Ireland
- 4Brazilian Research Network on Global Climate Change (Rede Clima), São José dos Campos, Brazil
The Amazon continental shelf and adjacent oceanic area were sampled for inorganic and organic carbon parameters in order to improve data coverage and understanding of carbon cycling dynamics within this important region. Seasonal coverage of the Amazon plume on the French Guiana continental shelf further north, was provided by CO2 monitoring using a merchant ship sailing from France to French Guiana (2006–2016). Salinity ranged from 1 to 36 (transects in April 2013, and May 2014). At salinity below 10, strong outgassing was observed with fugacity of CO2 (fCO2) over 2,000 μatm. This region displayed net heterotrophy, fueled by organic matter with terrestrial origin, as shown by δ13C and δ15N values of suspended particles. A δ13C cross shelf average of −31% was measured during May 2014, contrasting with oceanic values in excess of −20%. The reactivity of this terrestrial material resulted in the local production of dissolved inorganic and organic carbon as well as fluorescent humic compounds. Further offshore, the dilution of freshwater by ocean waters created a sink for CO2, enhanced by biological activity. The strongest CO2 drawdowns, associated with high chlorophyll a concentrations, were observed on the French Guiana continental shelf in the outer Amazon plume, with fCO2 values below 150 μatm. Here, a CO2 sink was present almost throughout the year, with a seasonal maximum of −9.2 mmol CO2 m−2d−1 observed in June 2015. However, both the CO2 and salinity distributions could vary significantly within a few days, confirming the presence of many eddies in this region. The Amazon continental shelf hence behaved as a transition zone between an inshore source of CO2 to the atmosphere and an offshore sink. Some marine phytoplankton production was detected but occurred mainly close to the French Guiana shelf. A mean net CO2 outgassing of 44 ± 43.6 mmol m−2d−1 was estimated for the area. Quantifying the CO2 flux for the entire Amazon shelf area led to a revised annual estimate of the net ocean carbon export of 2.86 1012 mol C from the region.
Introduction
The Amazon River is a strong source of CO2 to the atmosphere with values of the fugacity of CO2 (fCO2) of the order of 4,000 μatm (Richey et al., 2002; Mayorga et al., 2005). It has the strongest freshwater discharge of the world, ranging from a maximum in May–June of ~250,000 m3/s to a minimum of ~80,000 m3/s in October–November, preventing saline water intrusion through the river mouth (Geyer and Kineke, 1995). Due to its large discharge, the Amazon significantly alters the physical and biogeochemical properties of the tropical Atlantic. From January–February to May, the Amazon plume flows mainly northwestward toward the Caribbean Sea (e.g., Muller-Karger et al., 1988; Hellweger and Gordon, 2002). Starting in May, the retroflection of the North Brazil Current (NBC) transports about 70% of the Amazon plume eastward in the North Equatorial Counter-Current (NECC) while the remaining 30% flows toward the Caribbean (Lentz, 1995). As a consequence of its large freshwater and sediment supply, the Amazon delivers considerable amounts of carbon, nitrogen, and phosphorus to the ocean (Smoak, 2010). The resulting elevated nutrient concentrations lead to strong biological activity with chlorophyll a concentrations higher than 25 mg m−3 observed in the river-ocean transition zone and a mean shelf primary production rate of 2.61 g C m−2 d−1 (Smith and Demaster, 1996). The Amazon plume can be traced from ocean-color satellite imagery and exhibits high chlorophyll a concentrations that are entrained in the surface ocean circulation over a large distance (Hu et al., 2004). As the Amazon plume moves offshore, surface waters become depleted in nitrogen while significant amounts of phosphate and silicic acid still remain, which suggests that nitrogen is the nutrient limiting factor for phytoplankton growth in the region (DeMaster and Pope, 1996). Nitrogen fixation by diazotrophs further enhances primary production far from the Amazon mouth (Subramaniam et al., 2008; Yeung et al., 2012). The biological activity causes a CO2 drawdown and hence the Amazon plume behaves as a sink for CO2 (Ternon et al., 2000; Körtzinger, 2003; Cooley and Yager, 2006; Cooley et al., 2007; Lefèvre et al., 2010; Ibánhez et al., 2015). Using a model, Coles et al. (2013) show that the freshwater supplied by the Amazon can affect the sea surface salinity as far as 20°W. The salinity measured by satellite also allows to observe the spreading of the Amazon plume (Korosov et al., 2015). Because of the rather sluggish exchange with the atmosphere, CO2 drawdown driven by the Amazon plume productivity has been observed as far as 25°W (Lefèvre et al., 1998). This CO2 drawdown persists over a long distance, and has a significant impact on the carbon budget of the tropical Atlantic (Ibánhez et al., 2016).
A strong CO2 source in the Amazon River and upper estuary turning into a CO2 sink in the ocean is typical of rivers with large discharge into the ocean (Chen et al., 2012). The carbon properties of the river itself and of the Amazon plume in the ocean have been documented. However, very little carbon data are available on the Amazon continental shelf (Ward et al., 2015). Globally, continental shelves are a sink of CO2, but locally, in low latitude regions, they behave as CO2 source (Chen and Borges, 2009) as indeed, outgassing of CO2 in the tropics is driven by high temperature and the vicinity of the oligotrophic, CO2-supersaturated ocean. However, atmospheric CO2 exchange in the Amazon shelf is poorly constrained/unknown: in their study of the biogeochemical fluxes on the continental Amazon shelf, DeMaster and Aller (2001) present a carbon budget in which the atmospheric exchange is left with a question mark. More recently, Smoak (2010) has updated the carbon budget on the Amazon continental shelf and noted the importance of atmospheric exchange and the lack of an estimate for this component of the carbon budget. As a result, he calculated the export of carbon from the shelf to the ocean assuming no exchange with the atmosphere, stating that a source of CO2 to the atmosphere on the shelf would lead to a smaller export of carbon from the shelf to the ocean, while a sink of atmospheric CO2 on the shelf would increase the estimate of carbon export to the ocean.
Here, we present new carbon data collected on the Amazon shelf. We examine the carbon cycle from the continental shelf to the open ocean and the underlying processes driving the surface fCO2 and air-sea CO2 flux distribution. The isotopic composition of particulate organic matter is used to characterize its origin on the continental shelf. Using carbon data collected on the continental shelves of the Maranhão, the Amazon, and French Guiana, we follow the dispersal of the Amazon plume and the transformation of carbon along its way. Estimating the atmospheric exchange of CO2 on the Amazon continental shelf allows us to provide the missing term of the carbon budget of Smoak (2010) and to re-estimate the net export of carbon from the shelf to the ocean in this important region.
Materials and Methods
Sampling
The Amazon continental shelf is defined from the southern limit of the Amazon River plume (west of 47°W) northward to the French Guiana border (~4°N) and seaward to the shelf break, which starts at the 100 m isobath (Smoak, 2010). A transect perpendicular to the coast and slightly south of the Amazon mouth was sampled in April 2013 and in May 2014. Because of the transect's location, the samples include water from the Amazon River and the Caxiuana and Tocantins Rivers (also called Pará River). The transect in May 2014 consisted of 9 stations with CTD casts, sampling for dissolved inorganic nitrogen (DIN), phosphate, dissolved organic carbon (DOC), suspended particulate matter (SPM), fluorescent dissolved organic matter (FDOM, i.e., the DOM fraction with fluorescence properties), and one surface sample for dissolved inorganic carbon (TCO2) and total alkalinity (TA). In April 2013, the stations were sampled for surface TCO2 and TA only. During the oceanic cruises of Camadas Finas 3 (9 October–1 November 2012) and Camadas Finas 5 (21–30 September 2014), the Amazon continental shelf and plume region were sampled. Surface TCO2 and TA were analyzed on stations for both cruises. During the Camadas Finas 5 cruise, 16 CTD casts were realized and water samples were collected for analysis of DOC, SPM, dissolved oxygen (O2), DIN, phosphate, silicate, and FDOM.
Another cross-shelf transect was sampled off the coast of Maranhão centered at about 2°S, 44°W, up to the 50 m isobath in April, August, and October 2013 and March, May, July, and September 2014. Analyses for surface TCO2 and TA were realized as well as DOC and FDOM for some of the transects (Lefèvre et al., 2017).
Further north of the Amazon mouth, the merchant ship MN Colibri recorded fCO2 underway, in the ocean and in the atmosphere, during its voyages from France and French Guiana and sampled the continental shelf of French Guiana near 5°N. Only the cruises with CO2 data available on the continental shelf are listed (Table 1). Voyages 1–16 are included in Ibánhez et al. (2015) whereas voyages 17–30 are new data.
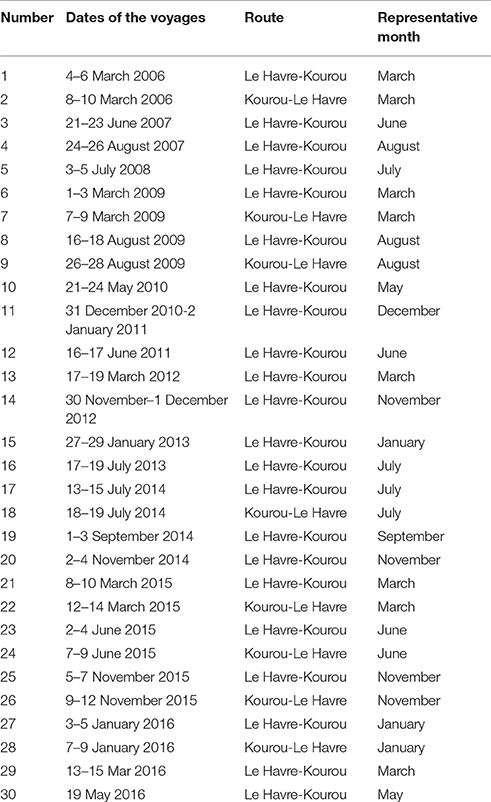
Table 1. Voyages of the MN Colibri with fCO2 measured on the continental shelf of French Guiana.
All the cruises used here are shown in Figure 1 (5°S–10°N, 55°W–35°W).
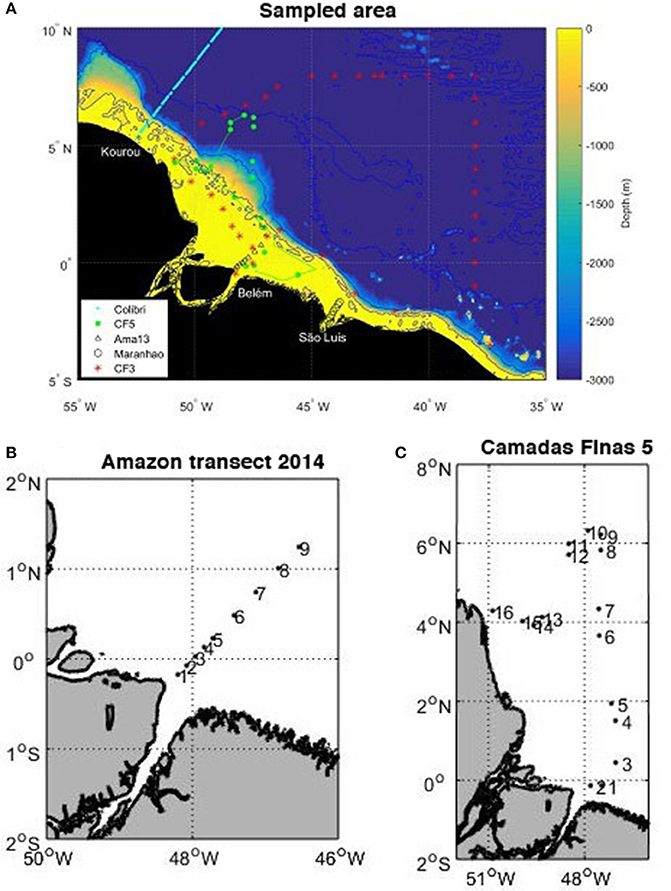
Figure 1. (A) Map of the cruises superimposed on the bathymetry: voyages of the MN Colibri (cyan), Camadas Finas 3 (red stars), Camadas Finas 5 (magenta with dots corresponding to the stations), Amazon transect (black triangles), transect of the Maranhense gulf (black circles), and positions of temperature and salinity samples (green dots). The bathymetry is generated with ETOPO2 2-min gridded global relief data, National Geophysical Data Center, 2006. 2-min Gridded Global Relief Data (ETOPO2) v2. National Geophysical Data Center, NOAA. doi:10.7289/V5J1012Q. (B) Position of the nine stations sampled on the transect in May 2014. (C) Position of the 16 stations sampled during the Camadas Finas 5 cruise.
Chemical Analyses
Surface seawater samples for TCO2 and TA were poisoned with a saturated HgCl2 solution and measured using a closed-cell potentiometric titration following the method of Edmond (1970). Equivalent points were determined using a non-linear regression method (DOE, 1994). Certified Reference Materials (CRMs) provided by Prof. A. Dickson (Scripps Institution of Oceanography, San Diego, USA) were used for calibration. The accuracy is estimated at ±3 μmol kg−1 for TA and ±5.3 μmol kg−1 for TCO2. All the samples were analyzed at LOCEAN in Paris.
Samples for nutrient, DOC, and FDOM determination were filtered on-site with GF/F filters (Whatman, 0.7 μm average pore size) and placed in acid-washed, amber glass containers. The material retained in the GF/F filters was used as an approximation of the SPM after filtering enough water to near saturate the filters with the material retained. The uncertainty on SPM was ±0.001 g. Additionally, plastic containers were used during the Camadas Finas 5 for nutrient (including silicate) determinations. Samples were protected from light inside a cooler box until arrival at the laboratory. There, samples were kept frozen (−20°C) until analysis. Phosphate (), ammonium (), and silicate (Si(OH)4) concentrations were determined by standard colorimetric methods (Grasshoff et al., 1983). Determination of nitrate () plus nitrite () followed the method described by Garcia-Robledo et al. (2014). DIN is defined as the sum of , and . The precision was better than 0.3% for the nutrients. The accuracy of [Si(OH)4] was 2%. Dissolved oxygen was determined following the modified Winkler method (Strickland and Parsons, 1972). DOC was determined with a Vario TOC Cube elemental analyzer after acidification (2M HCl) to remove dissolved inorganic carbon. The precision of DOC was 3.6% and the quantification limit 40 μM.
In order to provide further insights into the composition of DOM, fluorescent fractions in DOM (FDOM) were assessed. Three-dimensional emission-excitation matrix (EEM) fluorescence of the FDOM was measured on a Cary Varian Eclipse fluorescence spectrophotometer. Samples were first conditioned in a temperature-controlled bath at 20°C to avoid changes to spectral intensities caused by temperature differences. Absorbance scans of the samples were used to correct the EEM spectra and thus avoid inner filter effects (Kothawala et al., 2013). The fluorescence intensity was normalized to the integrated area of Milli-Q water Raman peak and reported in Raman units (r.u.). Parallel factor (PARAFAC) analysis of the dataset was performed with the DOMFluor Toolbox for MATLAB (Stedmon and Bro, 2008). PARAFAC analysis explained 98% of the data and identified four FDOM components: components 1, 2, and 3 exhibited fluorescence peaks in the region of humic-like fluorophores and component 4 was characterized as a protein-like fluorophore (Supplementary Figure 1). Similar FDOM components were previously identified in the region. FDOM components 1 (C1) and 2 (C2) are characterized by excitation/emission maximum wavelengths (Exmax/Emmax) of <250(320)/430 and 260(350)/456 nm, respectively. The uncertainty for FDOM was <1%. Both FDOM components were identified in the Maranhense shelf by Lefèvre et al. (2017) [C2: <250(325)/410 and C1: <250(360)/474 nm in their study] and were strongly associated to riverine inputs to the coast. Cao et al. (2016) also identified the presence of C2 in the Amazon plume region [C1: <250(345)/460 nm in their study]. They correspond to peaks C (320–360/420–480 nm) and A (230–260/380–460 nm) in the Coble nomenclature (Coble, 1996), associated to terrestrial and humic/fulvic-like FDOM, respectively (hereby termed terrestrial humic-like C1 and fulvic humic-like C2 components). FDOM component C3 [<250(290)/380 nm] corresponds to peak M (290–310/370–420 nm; Coble, 1996). In the Amazon plume, Cao et al. (2016) identified the presence of this component [<250(305)/397 nm], associated to marine humic-like FDOM, freshly produced by microbial activity (hereby termed marine humic-like C3). FDOM component C4 (270/302 nm) presents similar spectra to pure tyrosine amino acid (275/310 nm; Kowalczuk et al., 2003; hereby termed protein-like), also identified in the Maranhense shelf (275/302 nm; Lefèvre et al., 2017). Protein-like FDOM in marine waters has been previously associated to their amino acid content (Yamashita and Tanoue, 2003).
GF/F filters used during the transect in the Amazon shelf in 2014 and the Camadas Finas 5 campaign were analyzed for organic C and total N content and their isotopic composition. Analyses were performed in a Carlo Erba (CHN-1110) elemental analyzer coupled to a Finnigan Delta Plus mass spectrometer. Filters were first subject to HCl fumes in a desiccator for 6 h to remove inorganic C. The isotopic composition is expressed using the δ13C and δ15N notation in % and referenced to the Pee Dee Belemnite standard (O'Leary, 1988) for δ13C and atmospheric N2 for δ15N. The precisions were ±0.1% for δ13C and ±0.2% for δ15N.
Atmospheric and oceanic fCO2 were measured underway by an autonomous system, similar to the one described by Pierrot et al. (2009), installed on board the MN Colibri sailing between France and French Guiana as described by Lefèvre et al. (2010). Three CO2 standards with concentrations of 250, 360, and 500 ppm were used for calibration. The ship is also equipped with a Seabird thermosalinograph SBE 21 recording sea surface temperature (SST) and salinity (SSS) underway at a depth of 5 m. A similar equipment was also installed onboard the NHo. Cruzeiro do Sul during the Camadas Finas 5 oceanographic campaign. Table 2 provides a summary list of the parameters measured during the different cruises.
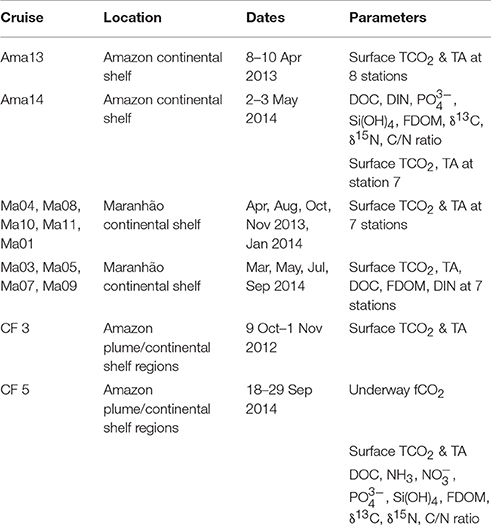
Table 2. List of cruises and parameters measured during the cruises.
Calculations
From two carbon parameters, the other two can be calculated. Using the CO2SYS program (Lewis and Wallace, 1998; Pierrot et al., 2006) and the dissociation constants of Mehrbach et al. (1973) refit by Dickson and Millero (1987), pH on the total scale and fCO2 were calculated from TA, TCO2, in situ temperature, and salinity data.
When only underway fCO2 is available, we use the alkalinity-salinity relationship developed for the region by Lefèvre et al. (2010) to calculate the other two carbon parameters (pH and TCO2).
Sea-air fluxes of CO2 were calculated using the gas exchange coefficient (k) of Sweeney et al. (2007) and the CO2 solubility (KW) of Weiss (1974):
where fCO2sw and fCO2atm are the fCO2 in seawater and in atmosphere, respectively. A positive flux indicates a source of CO2 to the atmosphere.
To determine fCO2atm, we use the monthly molar fraction of CO2 (xCO2atm) recorded at the atmospheric station of the NOAA/ESRL Global Monitoring Division (http://www.esrl.noaa.gov/gmd/ccgg/iadv/) located at Farol de Mãe Luiza lighthouse, Brazil (5.7952°S, 35.1853°W). The fCO2atm was then calculated from xCO2 with the atmospheric pressure and SST available at the NCEP/NCAR (National Centers for Environmental Prediction/National Center for Atmospheric Research) reanalysis project (Kalnay et al., 1996). For the Colibri cruises, when atmospheric CO2 is missing, we use the atmospheric station at Ragged Point Barbados (13.17°N, 59.43°W) where xCO2atm measurements are available for a longer period of time. The monthly wind speed available from the NCEP/NCAR database was converted to an altitude of 10 m to calculate the CO2 flux. The accuracy on the wind speed is assumed at 1 m s−1 for the tropical region. Because of the coarse resolution of NCEP winds (2.5 degrees), the wind speed on the continental shelf is calculated as an average between the wind speed in the open ocean and the wind speed on the coast, i.e., the wind speed at each end of the continental shelf.
Satellite Data
Chlorophyll a concentrations obtained from MODIS Aqua at 4 × 4 km resolution are used to determine the biological activity in the region. The monthly chlorophyll a data are co-located at the stations sampled during the cruises and with underway fCO2 to estimate the biological activity (photosynthesis).
Results
Variability along the Transect on the Amazon Continental Shelf
Along the Amazon transect, the surface salinity varies from 1 to 33 in April 2013 and May 2014 and the surface temperature is always higher than 27.8°C. In April 2013 surface TCO2 and TA values are strongly correlated with salinity. As previously observed by Bonou et al. (2016) the alkalinity-salinity relationship of Lefèvre et al. (2010), determined for the western tropical Atlantic region, is still valid at low salinity (Figure 2a). Therefore, we use the equation of Lefèvre et al. (2010) given by:
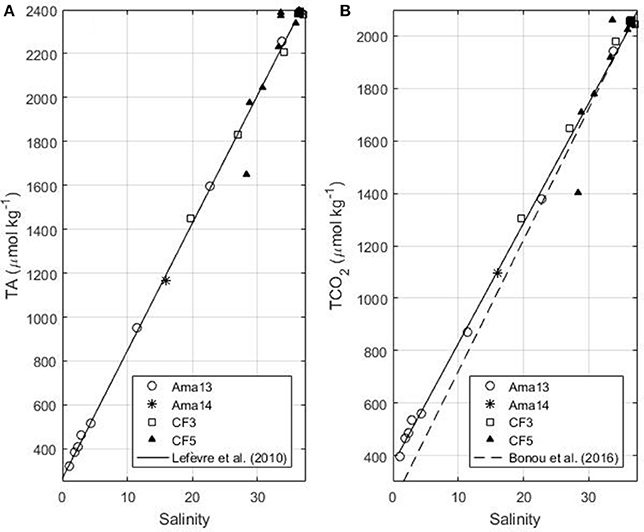
Figure 2. (A) TA as a function of salinity in the Amazon continental shelf (isobaths<100 m) for the Amazon transects of April 2013 and May 2014 and the Camadas Finas 3 (October 2012) and 5 (September 2014) cruises. The black line corresponds to the fit using the April 2013 data (Equation 2 in the text, the relationship determined by Lefèvre et al., 2010). (B) TCO2 as a function of salinity for the same cruises (Equation 3 in the text). The dash line represents the Equation determined by Bonou et al. (2016).
The error on predicted alkalinity is 11.6 μmol kg−1. The relationship between TCO2 and salinity obtained on the 2013 transect is:
The error on predicted TCO2 is 27.1 μmol kg−1. This relationship is in good agreement with the May 2014 observation on the same transect, and the TCO2 of the Camadas Finas cruises 3 and 5 measured on the Amazon continental shelf in boreal autumn (Figure 2b). Equation (3) gives better results for the continental shelf than the one determined by Bonou et al. (2016) that tends to underestimate TCO2, at very low salinities. The linear relationships of TA and TCO2 with salinity show that the mixing between river and ocean waters is dominant.
The surface distribution of the parameters measured along the salinity gradient is shown on Figure 3. The higher temperatures and lower salinities are characteristic of Amazon water spreading seaward. Higher concentrations of DIN are observed at low salinity and rapidly decrease seaward. DOC, POC, and phosphate have a more complex distribution with peak concentrations observed close to the shore as well as in the middle of the transect (47–46.5°W) at intermediate salinity (~15). The amount of particulate matter in suspension (>0.7 μm) is very high close to the shore, but decreases rapidly seaward to values <5 mg L−1.
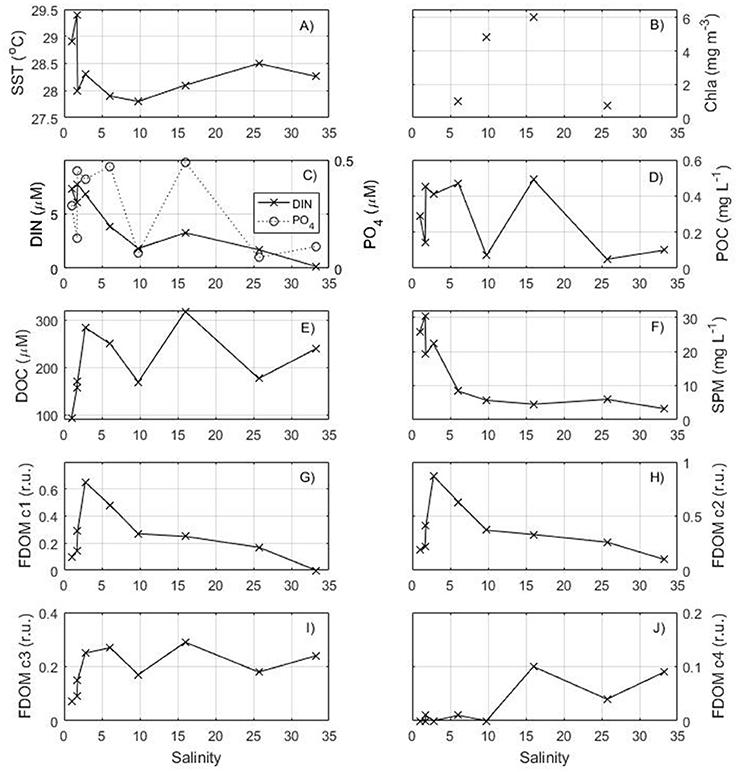
Figure 3. Distribution of surface (A) temperature, (B) chlorophyll a from MODIS, (C) DIN and phosphate, (D) POC, (E) DOC, (F) Suspended Particulate Matter, (G) C1 component of FDOM, (H) C2 component of FDOM, (I) C3 component of FDOM, (J) C4 component of FDOM as a function of salinity for the transect in May 2014.
The fulvic humic-like and the terrestrial humic-like FDOM components have similar variations to DOC with a strong increase in the salinity range 0–5 followed by a decrease seaward. The marine humic-like FDOM C3 and the protein-like FDOM C4 components have higher concentrations near 47–46.5°W close to the DOC and phosphate maxima found at salinity ~15.
Variability along the Camadas Finas Cruise
During the Camadas Finas 5 cruise (Figure 1C), in September, the ship started sampling on the Amazon continental shelf (stations 1–4), sailed mostly in oceanic waters (isobaths >100 m) and ended on the French Guiana shelf (stations 14–16). Along the track, the temperature in the surface layer varied from about 27–29°C. The salinity shows values above 36 and a decrease from station 10 with values below 34 before arrival in shelf waters, near 6°N, with the lowest salinities measured on the French Guiana shelf (Figure 4). TA and TCO2 have a similar distribution to salinity with a strong correlation (r2 = 0.90 and 0.87, respectively). The first stations of the cruise (stations 1–4) sample the Amazon continental shelf but no Amazon water is encountered there, as the salinity remains above 36, similar to that measured in oceanic waters. Salinities significantly lower than that characteristic of oceanic waters are found from station 11 onwards (salinity of 28 at station 16), located within the NBC retroflection and the Amazon shelf to the north of the river mouth (Figure 1). These brackish water stations are characterized by a sudden increase in concentrations of silicate, dissolved oxygen, and the three humic-like FDOM components. Furthermore, and consistent with Cao et al. (2016), fulvic-like FDOM component C2 showed an ubiquitous presence in the region, while terrestrial humic-like FDOM component C1 and marine humic-like component C3 were mostly absent with depth (data not shown). Together with the surface samples from the Amazon transect with salinity >6, the terrestrial humic-like and the fulvic humic-like FDOM component from stations 11–16 show a highly significant negative correlation with salinity (FDOM C1: r2 = 0.74, FDOM C2: r2 = 0.83, n = 11) further suggesting their terrestrial origin and near conservative distribution in the region. Marine humic-like FDOM C3 also show a negative correlation with salinity in these surface samples, although with lower significance (r2 = 0.49, n = 11). The protein-like FDOM C4 is fairly constant along the track of the cruise (0.05 ± 0.01 r.u.).
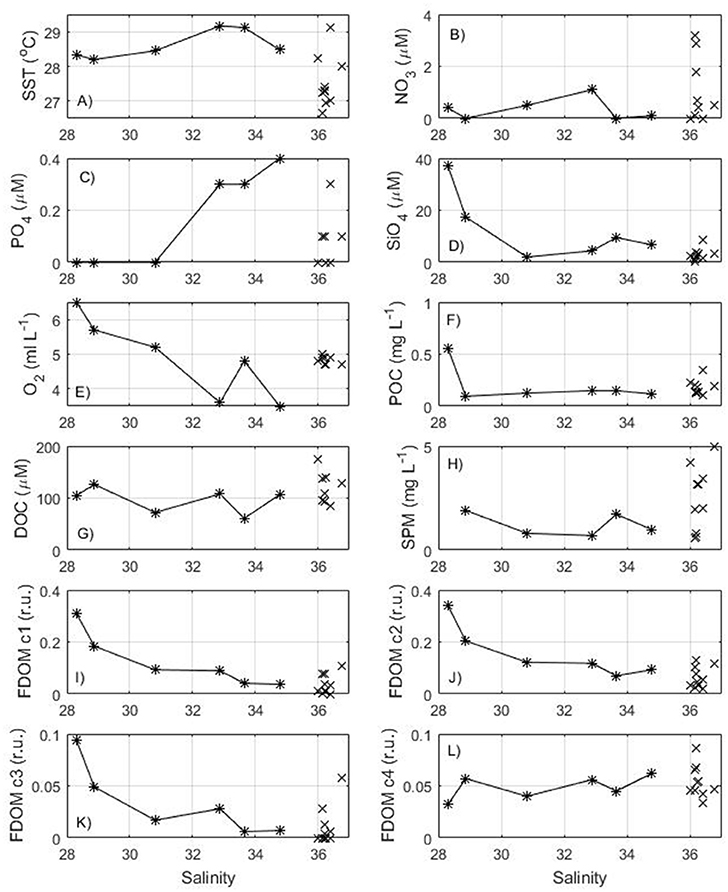
Figure 4. Distribution of surface (A) temperature, (B) nitrate, (C) phosphate, (D) silicate, (E) dissolved oxygen, (F) POC, (G) DOC, (H) Suspended Particulate Matter, (I) C1 component of FDOM, (J) C2 component of FDOM, (K) C3 component of FDOM, (L) C4 component of FDOM as a function of salinity for the Camadas Finas 5 cruise in September 2014. Oceanic stations (1–10) are indicated with a cross and stations of the Amazon plume (11–16) with a star.
Underway fCO2 tends to decrease with increasing chlorophyll a (Figures 5A,B). The highest chlorophyll a concentrations are observed at the end of the cruise in the French Guiana continental shelf with a maximum reaching 14 mg m−3 corresponding to the last station of the cruise (station 16). These high concentrations are associated with the lowest fCO2 and salinity values (Figure 5C). When arriving at the shelf, fCO2 decreases from 420 to 193 μatm and the salinity from 36 to 24. South of 3.5°N, the chlorophyll a remains very low, the salinity is above 36 and fCO2 exhibits oceanic values around 420 μatm. A slight decrease of fCO2 is observed around 5–6°N (Figure 5A), which corresponds to a decrease of salinity with values lower than 34 (Figure 5C). In this area, the chlorophyll a concentration remains low (<1 mg m−3) but the SST is above 29°C. The low salinity and high SST measured here are typical values observed in the inter-tropical convergence zone (ITCZ). The precipitation can explain the slight decrease of fCO2 associated with the salinity decrease.
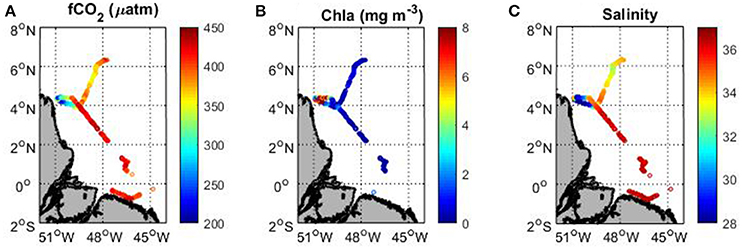
Figure 5. Map of (A) underway fCO2, (B) MODIS chlorophyll a and (C) sea surface salinity along the track of the Camadas Finas 5 cruise in September 2014.
Variability of fCO2 and the Sea-Air CO2 Flux
For April 2013, May 2014 and September 2014 fCO2 is calculated from TA and TCO2. In May 2014, TA and TCO2 are measured at S = 16 only. The comparison between the fCO2 calculated from TA and TCO2 and fCO2 calculated from SST and SSS using the empirical relationships gives an error of 80 μatm. All fCO2 values, calculated from TCO2 and TA, are plotted as a function of salinity (Figure 6A). The fCO2 calculated at 28°C using the TA and TCO2 relationships (equations 2 and 3) is also shown (dashed line) and represents the mixing between Amazon and oceanic waters. The CO2 flux is calculated at each data point and the error bar on the flux is obtained by propagating the error on fCO2, calculated from TCO2 and TA, and the error on the wind speed (Figure 6B). Along the Amazon transect, both the fCO2 and the CO2 flux exhibit very high values at low salinity followed by a decrease with increasing salinity (Figures 6A,B). At salinity around 10, the fCO2 becomes lower than the atmospheric fCO2-value, the flux is negative and a sink of CO2 is observed. The calculation of fCO2 from TA and TCO2 is done with the CO2SYS that neglects the contribution of organic species in the expression of alkalinity. However, in riverine and coastal waters, the amount of DOC is significantly higher than in oceanic waters so that organic alkalinity can contribute significantly to total alkalinity (Cai et al., 1998; Kim and Lee, 2009; Hunt et al., 2011; Kuliński et al., 2014). Therefore, neglecting the organic alkalinity underestimate fCO2 when it is calculated using TA (e.g., Kuliński et al., 2014). It is difficult to estimate the organic alkalinity. There is no simple relationship with DOC as the contribution to alkalinity will depend on the characteristics of the organic matter. The maximum value of DOC measured along the Amazon transect is 300 μmol kg−1. For similar values of DOC, Kuliński et al. (2014) found organic alkalinity values around 30 μmol kg−1. Assuming a similar value of organic alkalinity, the fCO2 calculated in the 10–25 salinity zone in April 2013 would still be below the atmospheric value. For the low salinity zone (S < 10), the large error on fCO2 would further increase the source of CO2.
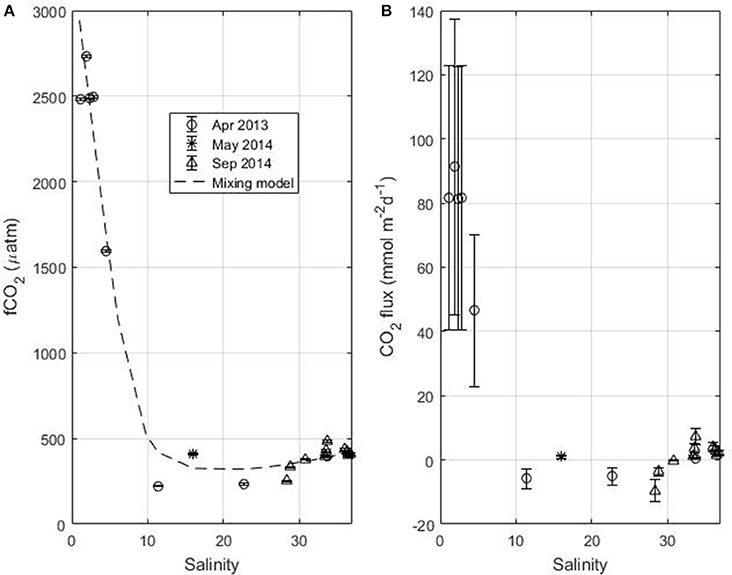
Figure 6. (A) fCO2 and (B) flux of CO2 as a function of salinity along the Amazon transect in April 2013 and May 2014 and during Camadas Finas 5 in September 2014. The dash line in (A) represents fCO2 calculated from the TA-SSS (Equation 2) and TCO2-SSS (Equation 3) relationships at a temperature of 28°C.
When the water reaches oceanic salinity values (>34), a source of CO2 is observed with fCO2 values typical of the tropical Atlantic. The strongest CO2 flux is observed around 1°N, 49°W near the Amazon river mouth and corresponds to fCO2-values around 3,000 μatm, typical of the Amazon River. At this location, the salinity is close to zero.
South of the Amazon continental shelf, the Maranhense continental shelf is dominated by oceanic waters. No influence of the Amazon plume is observed because of the NBC, a strong alongshore current flowing northwestward from about 5°S and transporting the Amazon waters north of the river mouth situated at the equator. This is consistent with the observations of Lentz and Limeburner (1995) in that the Amazon plume does not extend southeastward beyond the mouth of the Para/Tocantins River. In addition, the river system of the Maranhão has a low discharge. As a consequence, the salinity is quite high on the Maranhense continental shelf with values varying between 33.31 in May and 36.88 in November. The fCO2-values are above 430 μatm. A source of CO2 is observed throughout the year ranging from 0.55 mmol m−2d−1 in May to 2.96 mmol m−2d−1 in September.
North of the Amazon river mouth, the NBC transports Amazon waters toward the Caribbean and also toward the eastern Atlantic from July to December during the period of the NBC retroflection. The CO2 flux calculated for each voyage of the Colibri highlights the high variability on the French Guiana continental shelf (Figure 7). The strongest CO2 sink is observed during the period of high discharge of the Amazon River in May–June. Most of the expeditions exhibit CO2 sinks on the shelf. A CO2 source is observed for all cruises in January. Most of the expeditions in March also show a source of CO2. During these cruises, mean salinities along the tracks of the Colibri remain higher than 34.
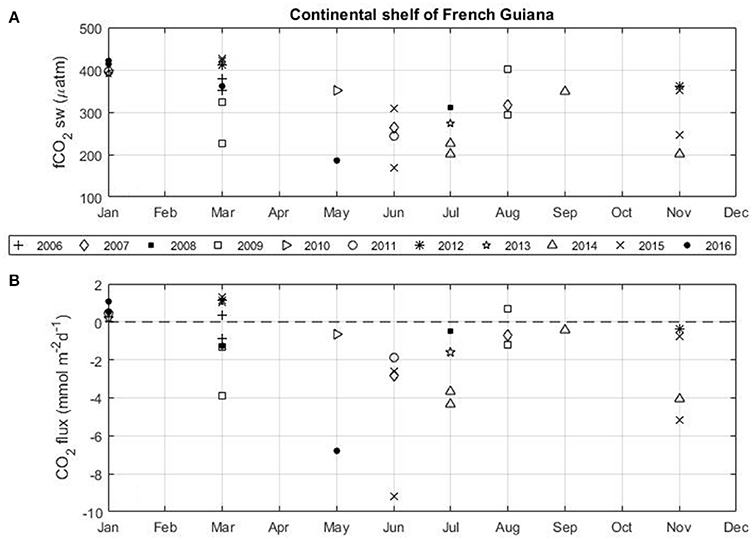
Figure 7. Monthly distribution of (A) the seawater fCO2 and (B) the flux of CO2 in the French Guiana continental shelf using the Colibri cruises (2006–2016).
Discussion
Net Heterotrophic Trend on the Amazon Shelf
The Amazon continental shelf is a transition zone between an inshore source of CO2 to the atmosphere and an offshore sink. Due to the strong discharge of the Amazon, the lowest salinity (S = 1.08) is observed on the Amazon continental shelf (48.29°W, 0.27°S) near Belém in April 2013. A sample collected near this location (48.25°W, 0.46°S) during the Camadas Finas 3 cruise in October, when the Amazon discharge is at its lowest, gives a salinity of 19.70. In May 2014, the strong discharge is associated with a significant amount of SPM that decreases rapidly seaward and exhibits a non-conservative distribution (Figure 3f).
The nutrients and DOM in the sampled surface waters along the Amazon transect showed a clear non-conservative distribution. At salinities from 0 to <6, abrupt increases in DOC and the three humic-like FDOM components are observed, associated with values of SPM higher than 10 mg L−1(Figures 3e–i). This distribution is in contrast with the conservative mixing of DOC and the three humic components of FDOM observed by Cao et al. (2016) for the Amazon River plume. Instead, our distribution, with low values increasing to reach a maximum near a salinity of 6, follows the distribution of barium observed by Boyle (1976) in the Amazon plume in June 1974 as well as that found in the Zaire and Mississipi plumes (Edmond et al., 1978). In each instance, a conservative mixing line between the maximum value of barium at low salinity and the oceanic region is observed. The terrestrial and fulvic humic-like FDOM components C1 and C2 also exhibit a highly significant linear correlation with salinity from their maximum value toward offshore (r = −0.94 and −0.92, respectively). This behavior is explained by desorption of barium from the suspended sediments during mixing of the freshwater plume with the ocean due to the increase of the ionic strength. Smith and Demaster (1996) delimited three zones when sampling transects across the continental shelf: the turbid zone with SPM > 10 mg L−1, the intermediate regime with SPM < 10 mg L−1 and S < 32 and the offshore area with high salinity (>32). The desorption occurs in the turbid region. Although DOC and the C1 and C2 components have the same distribution at low salinity (0–6), the DOC concentration shows a second maximum at S = 16 (station 7) coinciding with the production of marine humic-like FDOM C3, protein-like FDOM C4 and a quite high chlorophyll a concentration of 6 mg m−3 (Figure 3). The production of protein-like FDOM has been related to primary production (e.g., Chari et al., 2013) and therefore suggests increased phytoplanktonic production at station 7. However, the high concentration of DOC (>300 μM) implies that phytoplankton production is not the only source of DOC. In the case of the terrestrial and fulvic humic-like FDOM components C1 and C2, the deviations from linearity after their maximum concentration suggest that other processes rather than simple dilution act in this area. Specifically, they seem to be consumed at intermediary salinities (~10) as suggested from their lower concentration compared to the dilution line. Although consumption of humic-like FDOM components has been reported in some specific circumstances such as, fertilizer pollution of coastal aquifers (Ibánhez and Rocha, 2014), these components are assumed refractory and can be produced from organic matter processing in aquatic ecosystems (e.g., Parlanti et al., 2000). This suggests that active humic-like FDOM production from organic matter at the turbid zone acts together with desorption in explaining their maximum concentration in this zone and its deviation from linear mixing behavior at higher salinities.
The stable isotopes of carbon (δ13C) and nitrogen (δ15N) and the C/N ratio of SPM measured during the transect of May 2014 and the CF5 cruise can provide information about the sources of organic matter. Considering all the stations together, δ13C varies from −31 to −18%, δ15N from −2.1 to 8.8% and C/N ratio from 7 to 26 (Figure 8).
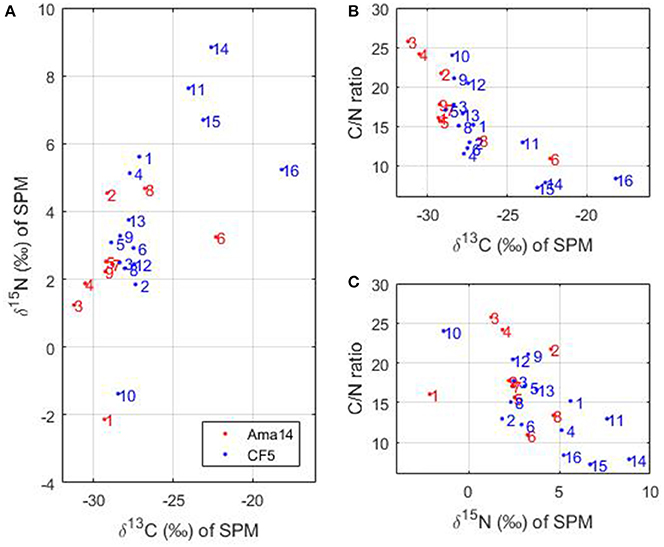
Figure 8. (A) δ15N as a function of δ13C, (B) C/N ratio as a function of δ13C and (C) C/N ratio as a function of δ15N measured during the transect in May 2014 (in red) and the Camadas Finas cruise (in blue). The numbers correspond to the stations of the cruises.
In the Amazon River, δ13C ranges between −24.5 and −30.1% and is predominantly of terrestrial origin (Cai et al., 1988). In addition, aquatic phytoplankton organisms have δ13C-values that differ from terrestrial plants and variations occur between marine and freshwater phytoplankton (Khan et al., 2015). Marine phytoplankton have δ13C-values ranging from −24 to −18% whereas freshwater phytoplankton δ13C-values are more negative (−30 to −25%) due to higher dissolved CO2 concentrations compared to HCO in rivers (Cloern et al., 2002; Khan et al., 2015). Most of our stations have δ13C-values lower than −25% (Figure 8A), which suggests terrestrial or freshwater phytoplankton origin. However, the C/N ratio of marine or freshwater phytoplankton oscillates around 6 (e.g., Cloern et al., 2002) compared to terrigenous material with C/N >9 (e.g., Barros et al., 2010) and only a few stations (14–16, Figures 8B,C) exhibit such low values. This strongly supports the premise that particulate organic matter of terrestrial origin dominates most of the stations. Stations 14–16 are located in the French Guiana continental shelf and are subject to strong biological activity (Figure 5B) of marine origin mainly. The δ15N-values of marine phytoplankton are usually around 8% (Cloern et al., 2002) or higher (e.g., 10%, Barros et al., 2010). Station 6 of the May 2014 transect has a higher δ13C than the other stations of the transect (Figures 8A,B) and therefore suggests some marine influences. This station is also characterized by an increase of chlorophyll a (Figure 3b), DOC (Figure 3e), marine humic-like C3 component of FDOM (Figure 3i), and protein-like C4 component of FDOM (Figure 3j), which suggests that relatively higher marine phytoplankton production occurs there. In addition, a strong anti-correlation between TCO2 and dissolved oxygen is observed on the shelf, at the limit between the Amazon continental shelf and the French Guiana shelf (~4°N), with low TCO2 (1,400 μmol kg−1) associated with high oxygen values (>6.4 ml L−1) over a salinity range 28–31. The strong carbon uptake and oxygen production associated to high chlorophyll a concentration (Figure 5B), is also consistent with the presence of active photosynthesis. This suggests that autotrophy is the dominant process in this region whereas heterotrophy dominates in the Amazon continental shelf, fueled by terrestrial material.
Air-Sea CO2 Flux and Implication for the Carbon Budget on the Amazon Continental Shelf
From south to north of the Amazon mouth, the sea-air CO2 flux of the continental shelf exhibits a very different pattern. A source of CO2 is observed throughout the year south of the Amazon mouth, near 2°S, on the Maranhense continental shelf. It is partially explained by the low river discharge and the strong alongshore NBC flowing northward, preventing any influence of Amazon waters. Furthermore, the enrichment in terrestrial humic-like FDOM observed there suggests that terrestrial export of organic matter could fuel the CO2 oversaturation, which is higher than that observed in oceanic waters of the western tropical Atlantic (Lefèvre et al., 2017). In the Amazon continental shelf, close to the mouth, salinities near 1 are associated with fCO2 about 2,000–3,000 μatm, which corresponds to fCO2 values typically encountered in the Amazon River (e.g., Richey et al., 2002). The mixing with oceanic waters of high alkalinity decreases fCO2 and in agreement with previous studies (e.g., Körtzinger, 2010), from a salinity value of about 10, the surface water becomes undersaturated in CO2 as shown on Figure 6. In addition to a dilution effect, the decrease of the turbidity and the supply of nutrients to the ocean lead to CO2 uptake by photosynthesis. The sampling of the Amazon transects shows that the continental shelf is a complex zone where the mixing between the Amazon River, strong source of CO2, and the oceanic waters takes place. The strong CO2 outgassing dominating the Amazon River is reversed by the dilution process but also by the biological activity as observed at station 6 on the transect in May 2014. This explains the CO2 sink that is observed. The sink could be smaller depending on the contribution of organic matter to total alkalinity. Overall, the outgassing dominates the Amazon continental shelf. Along the transect (April 2013, May 2014), the mean CO2 flux is always positive and the standard deviation is very high due to the strong variability of the flux passing from a strong source to a sink of CO2 (Table 3).
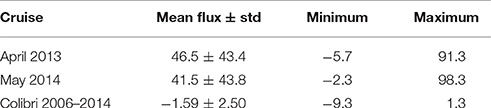
Table 3. Mean CO2 flux with its standard deviation (std), minimum, and maximum values (in mmol m−2d−1) on the Amazon continental shelf and on the French Guiana continental shelf (30 Colibri cruises).
During the northward propagation of Amazon waters by the NBC, biological activity further develops and a sink of CO2 is observed almost throughout the entire year on the French Guiana continental shelf. The mean CO2 flux calculated for each Colibri voyage shows a strong correlation with the surface salinity:
On the continental shelf of French Guiana, a source of CO2 is observed when the salinity is higher than 34. The salinity and the fCO2 (as well as the CO2 flux) exhibit a high spatio-temporal variability caused by the ocean circulation. The oscillating nature of the NBC is superimposed on the seasonal variability of the Amazon discharge and of the NBC retroflection. For a given month (e.g., March, June, November) and even within a few days, the magnitude of the CO2 flux can vary greatly (Figure 9). This is consistent with the propagation of the Amazon plume through mesoscale eddies (e.g., Fratantoni and Glickson, 2001; Ffield, 2005) or freshwater lenses of Amazon waters that are transported by the surface currents. For example, in March 2009 when there is no NBC retroflection, fCO2 is below 300 μatm near 5.5°N (Figure 9A) when the salinity is under 30 (Figure 9B) but 4 days later fCO2 as well as salinity decrease further on a wider scale. The same feature is observed in August 2009 (Figures 9C,D), during the period of the NBC retroflection. During 16–18 August 2009, the lowest salinity (around 20) is observed at 6–7°N. A few days later (26–28 Aug 2009), at the same location, the salinity is higher than 28.
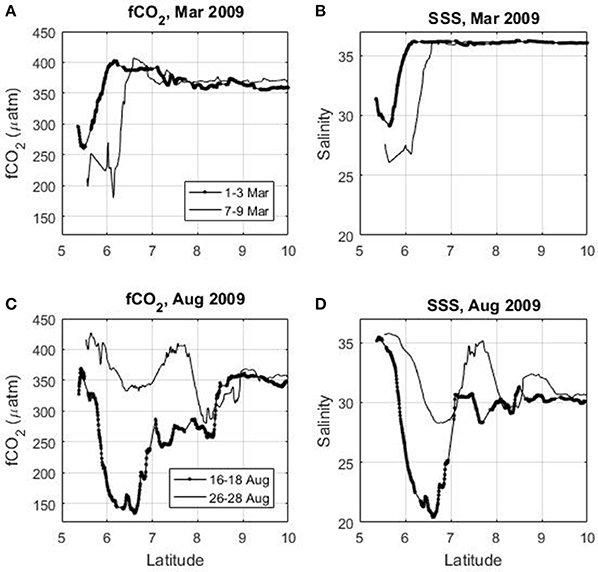
Figure 9. Latitudinal distribution of (A) surface fCO2, (B) salinity in March 2009, (C) fCO2, and (D) salinity in August 2009 using the Colibri cruises.
The propagation of the Amazon plume through a succession of mesoscale eddies and filaments is not observed only during the periods of NBC retroflection occurrence on the French Guiana shelf. Even in March, when there is no retroflection of the NBC, the salinity and fCO2 distributions can vary significantly within a few days. This pattern is also observed during the Camadas Finas 5 cruise in September 2014 when the ship arrives near the French Guiana shelf from 6°N to the shelf break. A decrease of fCO2 (Figure 5A) is associated with a decrease of salinity (Figure 5C). This highlights the strong correlation between fCO2, the CO2 flux and the surface salinity in this region.
On the French Guiana shelf, surface fCO2 as low as 150 μatm are measured during the voyages of the MN Colibri (Figure 9). Using the empirical relationships of TA and TCO2 as a function of salinity (equations 2 and 3) and a temperature of 28°C, fCO2 resulting from the mixing between the Amazon River and ocean waters can be calculated. The observed fCO2 is well below what the mixing model would predict at the lowest salinity observed during the cruises (Figure 10A). The corresponding drawdown of TCO2 can reach 120 μmol kg−1 near the salinity 20–24 (Figure 10B).
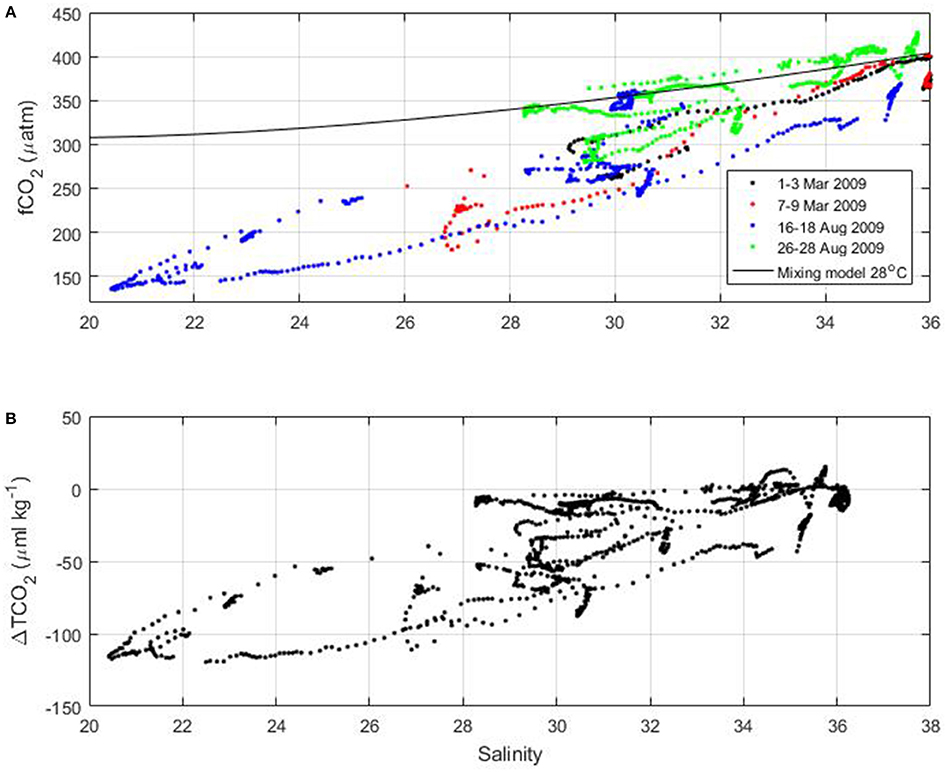
Figure 10. (A) Surface fCO2 of the MN Colibri cruises as a function of salinity. The mixing model at 28°C is indicated by the black line. (B) Difference of TCO2 between the TCO2 values calculated from fCO2 and the mixing model as a function of salinity.
The strong outgassing of the Amazon River and the strong CO2 sink occurring in the ocean due to the mixing of riverine waters with the oceanic waters are known features. However, the lack of air-sea CO2 flux measurements has prevented the closure of the carbon budget on the Amazon shelf (DeMaster and Aller, 2001; Smoak, 2010). Smoak (2010) calculates the total carbon exported to the ocean and the atmosphere by an input-export mass balance. The total input of carbon to the shelf is supplied by the river and by advection of offshore water. Subtracting the removal of carbon by sediments and the lateral sediment export out of the shelf, he calculates a total carbon exported to the ocean and atmosphere of 1,185 mol m−2y−1. After removing the advection of carbon from offshore (1,143 mol m−2y−1) and assuming no atmospheric exchange, he calculates a net ocean carbon export of 42 mol m−2y−1. Our results show that the Amazon shelf is outgassing CO2 to the atmosphere, which means that the net carbon export to the ocean is smaller than the estimate of Smoak (2010) based on no atmospheric exchange. Using a mean estimate of CO2 outgassing of 44 mmol m−2d−1 (Table 3), i.e., 16 mol m−2y−1, the net carbon export from the shelf to the ocean becomes 26 mol m−2yr−1. Using a shelf area of 11 1010 m2, this gives an annual net export of carbon from the shelf to the ocean of 2.86 1012 mol C.
Conclusions
The Amazon continental shelf is a transition zone where the Amazon River mixes with oceanic waters. The Amazon River is a source of CO2 with water fCO2 about one order of magnitude greater than oceanic fCO2. Although the Amazon River and the tropical Atlantic are CO2 sources, the mixing between these two water masses leads to transient, localized, CO2 undersaturation caused by dilution and biological activity. On the Amazon transect sampled in April 2013 and May 2014, the salinity varied between 1 and 33.7 and the mean CO2 flux was 44 ± 43.6 mmol m−2d−1. Particulate organic matter of terrestrial origin dominates the surface waters as evidenced by its δ13C and δ15N signature as well as its C/N ratio even if some marine phytoplankton activity could be detected in the transect of May 2014. The strong alongshore NBC transports Amazon waters northwards and a sink of CO2 is observed almost throughout the year on the French Guiana continental shelf where strong biological activity develops. The local oceanic circulation is characterized by high mesoscale activity and the fCO2, hence the CO2 flux, exhibits a strong spatio-temporal variability. Within a few days the French Guiana shelf can therefore turn from a sink to being a source of CO2. This outgassing of CO2 is usually observed when salinity increases above 34. The seasonal variations of the CO2 flux in the French Guiana shelf have been determined by CO2 monitoring using a merchant ship. For the first time, carbon measurements have been realized in the Amazon continental shelf, providing an updated annual estimate of the carbon exported to the ocean of 2.86 1012 mol C from the shelf. Further sampling of the shelf would improve this estimate as well as our understanding of the processes taking place in this region such as, the degradation/ reactivity of organic matter transported by the largest river in the world.
Author Contributions
NL conceived the idea, contributed to inorganic carbon data and wrote the manuscript with the participation of JI. MF, FG, and JI contributed to data analyses and fieldwork. CR and SJ conducted the FDOM and organic carbon analyses. MD organized the Camadas Finas cruises. All authors reviewed the manuscript.
Funding
We acknowledge support from the AIRD-FAPEMA BIOAMAZON project, the INCT AmbTropic-Brazilian National Institute of Science and Technology for Tropical Marine Environments, CNPq/FAPESB (grants 565054/2010-4 and 8936/2011) and the CARECOS APQ-0074-1.08/11 project. The France-French Guiana VOS line has been funded and maintained by the European Integrated Projects CARBOOCEAN (contract 511176-2), CARBOCHANGE (grant agreement 264879), AtlantOS (grant agreement 633211) and the Institut de Recherche pour le Développement (IRD). Camadas Finas 3 and 5 cruises were funded by the Brazilian Ministry of Science, Technology and Innovation (MCTI), grants 01/2011 and 01/2013.
Conflict of Interest Statement
The authors declare that the research was conducted in the absence of any commercial or financial relationships that could be construed as a potential conflict of interest.
Acknowledgments
Seawater samples were analyzed for DIC and TA by the SNAPO-CO2 at LOCEAN in Paris. We are grateful to Keyla Travassos for her help with the analyses of nutrients and to Plínio Barbosa Camargo for conducting the analyses of isotopes. Sea surface salinity data derived from thermosalinograph instruments installed onboard the MN Colibri were collected, validated, archived, and made freely available by the French Sea Surface Salinity Observation Service (http://www.legos.obs-mip.fr/observations/sss/). Chlorophyll a concentrations from MODIS Aqua 4 km were downloaded from the Giovanni online data system, developed and maintained by the NASA Goddard Earth Sciences (GES) Data and Information Services Center (DISC). We thank the scientific and crew members of the NHo. Cruzeiro do Sul—H38 (DHN/Brazilian Navy) for their dedication during oceanographic cruises Camadas Finas 3 and 5. M.A. acknowledges the support of the Brazilian Research Network on Global Climate Change—Rede CLIMA.
Supplementary Material
The Supplementary Material for this article can be found online at: https://www.frontiersin.org/article/10.3389/fmars.2017.00278/full#supplementary-material
Supplementary Figure 1. Spectra of excitation and emission for the 4 components of the FDOM.
References
Barros, G. V., Martinelli, L. A., Novais, T. M., Ometto, J. P. H. B., and Zuppi, G. M. (2010). Stable isotopes of bulk organic matter to trace carbon and nitrogen dynamics in an estuarine ecosystem in Babitonga Bay (Santa Catarina, Brazil). Sci. Total Environ. 408, 2226–2232. doi: 10.1016/j.scitotenv.2010.01.060
Bonou, F. K., Noriega, C., Lefèvre, N., and Araujo, M. (2016). Distribution of CO2 parameters in the Western Tropical Atlantic Ocean. Dyn. Atmos. Oceans 73, 47–60. doi: 10.1016/j.dynatmoce.2015.12.001
Boyle, E. A. (1976). The Marine Geochemistry of Trace Metals. Ph.D. thesis, Cambridge, MA: Massachusetts Institute of Technology and Woods Hole Oceanographic Institution.
Cai, D.-L., Tan, F. C., and Edmond, J. M. (1988). Sources and transport of particulate organic carbon in the Amazon River and estuary. Estuar. Coast. Shelf Sci. 26, 1–14. doi: 10.1016/0272-7714(88)90008-X
Cai, W.-J., Wang, Y. C., and Hodson, R. E. (1998). Acid-base properties of dissolved organic matter in the estuarine waters of Georgia, USA. Geochim. Cosmochim. Acta 62, 473–483. doi: 10.1016/S0016-7037(97)00363-3
Cao, F., Medeiros, P. M., and Miller, W. L. (2016). Optical characterization of dissolved organic matter in the Amazon River plume and the adjacent ocean: examining the relative role of mixing, photochemistry, and microbial alterations. Mar. Chem. 186, 178–188. doi: 10.1016/j.marchem.2016.09.007
Chari, N. V. H. K., Keerthi, S., Sarma, N. S., Pandi, S. R., Chiranjeevulu, G., Kiran, R., et al. (2013). Fluorescence and absorption characteristics of dissolved organic matter excreted by phytoplankton species of western Bay of Bengal under axenic laboratory condition. J. Exp. Mar. Biol. Ecol. 445, 148–155. doi: 10.1016/j.jembe.2013.03.015
Chen, C.-T. A., and Borges, A. V. (2009). Reconciling opposing views on carbon cycling in the coastal ocean: continental shelves as sinks ans near-shore ecosystems as sources of atmospheric CO2. Deep Sea Res. II 56, 578–590. doi: 10.1016/j.dsr2.2009.01.001
Chen, C.-T. A., Huang, T.-H., Fu, Y.-H., Bai, Y., and He, X. (2012). Strong sources of CO2 in upper estuaries become sinks of CO2 in large river plumes. Curr. Opin. Environ. Sustain. 4, 179–185. doi: 10.1016/j.cosust.2012.02.003
Cloern, J. E., Canuel, E. A., and Harris, D. (2002). Stable carbon and nitrogen isotope composition of aquatic and terrestrial plants of the San Francisco bay estuarine system. Limnol. Oceanogr. 47, 713–729. doi: 10.4319/lo.2002.47.3.0713
Coble, P. G. (1996). Characterization of marine and terrestrial DOM in seawater using excitation-emission matrix spectroscopy. Mar. Chem. 51, 325–346. doi: 10.1016/0304-4203(95)00062-3
Coles, V. J., Brooks, M. T., Hopkins, J., Stukel, M. R., Yager, P. L., and Hood, R. R. (2013). The pathways and properties of the Amazon River Plume in the tropical North Atlantic Ocean. J. Geophys. Res. 118, 6894–6913. doi: 10.1002/2013JC008981
Cooley, S. R., Coles, V. J., Subramaniam, A., and Yager, P. L. (2007). Seasonal variations in the Amazon plume-related atmospheric carbon sink. Global Biogeochem. Cycles 21, 1–15. doi: 10.1029/2006GB002831
Cooley, S. R., and Yager, P. L. (2006). Physical and biological contributions to the western tropical North Atlantic Ocean carbon sink formed by the Amazon River plume. J. Geophys. Res. 111. doi: 10.1029/2005JC002954
DeMaster, D. J., and Aller, R. C. (2001). “Biogeochemical processes on the Amazon shelf: changes in dissolved and particulate fluxes during river/ocean mixing,” in The Biogeochemistry of the Amazon Basin, eds M. E. McClain, R. L. Victoria, and J. E. Richey (New York, NY: Oxford university press), 328–370.
DeMaster, D. J., and Pope, R. (1996). Nutrient dynamics in Amazon shelf waters: result from AMASSEDS. Cont. Shelf Res. 16, 263–289. doi: 10.1016/0278-4343(95)00008-O
Dickson, A. G., and Millero, F. J. (1987). A comparison of the equilibrium constants for the dissociation of carbonic acid in seawater media. Deep Sea Res. 34, 1733–1743. doi: 10.1016/0198-0149(87)90021-5
DOE (1994). “ORNL/CDIAC-74,” in Handbook of Methods for the Analysis of the Various Parameters of the Carbon Dioxide System in Sea Water, eds A. G. Dickson and C. Goyet (Oak Ridge, TN), 1–187.
Edmond, J. M. (1970). High precision determination of titration alkalinity and total carbon dioxide content of seawater by potentiometric titration. Deep Sea Res. 17, 737–750.
Edmond, J. M., Boyle, E. D., Drummond, D., Grant, B., and Misick, T. (1978). Desorption of barium in the plume of the Zaire (Congo) river. Netherlands J. Sea Res. 12, 324–328.
Ffield, A. (2005). North Brazil current rings viewed by TRMM microwave imager SST and the influence of the Amazon plume. Deep Sea Res. I 52, 137–160. doi: 10.1016/j.dsr.2004.05.013
Fratantoni, D. M., and Glickson, D. A. (2001). North Brazil Current ring generation and evolution observed with SeaWiFS. J. Phys. Oceanogr. 32, 1058–1074. doi: 10.1175/1520-0485(2002)032<1058:NBCRGA>2.0.CO;2
Garcia-Robledo, E., Corzo, A., and Papaspyrou, S. (2014). A fast and direct spectrophotometric method for the sequential determination of nitrate and nitrite at low concentrations in small volumes. Mar. Chem. 162, 30–36. doi: 10.1016/j.marchem.2014.03.002
Geyer, W. R., and Kineke, G. C. (1995). Observations of currents and water properties in the Amazon frontal zone. J. Geophys. Res. 100, 2321–2339. doi: 10.1029/94JC02657
Grasshoff, K., Ehrhardt, M., and Kremling, K. (eds.) (1983). Methods of Seawater Analysis. Weinheim: Verlag Chemie.
Hellweger, F. L., and Gordon, A. L. (2002). Tracing Amazon river water into the Caribbean Sea. J. Mar. Res. 60, 537–549. doi: 10.1357/002224002762324202
Hu, C., Montgomery, E. T., Schmitt, R. W., and Muller-Karger, F. E. (2004). The dispersal of the Amazon and Orinoco River water in the tropical Atlantic and Caribbean Sea: observation from space and S-PALACE floats. Deep Sea Res. II 51, 1151–1171. doi: 10.1016/S0967-0645(04)00105-5
Hunt, C. W., Salisbury, J., and vandemark, D. (2011). Contribution of non-carbonate anions to total alkalinity and overestimation of pCO2 in New England and New Brunswick rivers. Biogeosciences 8, 3069–3076. doi: 10.5194/bg-8-3069-2011
Ibánhez, J. S. P., Araujo, M., and Lefèvre, N. (2016). The overlooked tropical oceanic CO2 sink. Geophys. Res. Lett. 43, 3804–3812. doi: 10.1002/2016GL068020
Ibánhez, J. S. P., Diverrès, D., Araujo, M., and Lefèvre, N. (2015). Seasonal and interannual variability of sea-air CO2 fluxes in the tropical Atlantic affected by the Amazon River plume. Global Biogeochem. Cycles 29, 1640–1655. doi: 10.1002/2015GB005110
Ibánhez, J. S. P., and Rocha, C. (2014). Effects of recirculation of seawater enriched in inorganic nitrogen on dissolved organic carbon processing in sandy seepage face sediments. Mar. Chem. 166, 48–58. doi: 10.1016/j.marchem.2014.09.012
Kalnay, E., Kanamitsu, M., Kistler, R., Collins, W., Deaven, D., Gandin, L., et al. (1996). The NCEP/NCAR 40-year reanalysis project. Bull. Am. Meteorol. Soc. 77, 437–471. doi: 10.1175/1520-0477(1996)077<0437:TNYRP>2.0.CO;2
Khan, N. S., Vane, C. H., and Horton, B. P. (2015). “Stable carbon isotope and C/N geochemistry of coastal wetland sediments as a sea-level indicator,” in Handbook of Sea-Level Research, eds I. Shennan, A. J. Long, and B. P. Horton (Chichester: Jonh Wiley & Sons, Ltd.1), 295–311.
Kim, H.-C., and Lee, K. (2009). Significant contribution of dissolved organic matter to seawater alkalinity. Geophys. Res. Lett. 36, 1–5. doi: 10.1029/2009GL040271
Korosov, A., Counillon, F., and Johannessen, J. A. (2015). Monitoring the spreading of the Amazon freshwater plume by MODIS, SMOS, Aquarius and TOPAZ. J. Geophys. Res. 120, 268–283. doi: 10.1002/2014JC010155
Körtzinger, A. (2003). A significant sink of CO2 in the tropical Atlantic Ocean associated with the Amazon River plume. Geophys. Res. Lett. 30, 2287. doi: 10.1029/2003GL018841
Körtzinger, A. (2010). “The outer Amazon plume: an atmospheric CO2 sink,” in Carbon and Nutrient Fluxes in Continental Margins: A Global Synthesis, eds K. K. Liu, L. Atkinson, R. Qui-ones, and L. T. McManus (New York, NY: Springer), 450–453.
Kothawala, D. N., Murphy, K. R., Stedmon, C. A., Weyhenmeyer, G. A., and Tranvik, L. J. (2013). Inner filter correction of dissolved organic matter fluorescence. Limnol. Oceanogr. Methods 11, 616–630. doi: 10.4319/lom.2013.11.616
Kowalczuk, P., Cooper, W. J., Whitehead, R. F., Durako, M. J., and Sheldon, W. (2003). Characterization of CDOM in an organic-rich river and surrounding coastal ocean in the South Atlantic Bight. Aquat. Sci. 65, 384–401. doi: 10.1007/s00027-003-0678-1
Kuliński, K., Schneider, B., Hammer, K., Machulik, U., and Schulz-Bull, D. (2014). The influence of dissolved organic matter on the acid-base system of the Baltic Sea. J. Mar. Syst. 132, 106–115. doi: 10.1016/j.jmarsys.2014.01.011
Lefèvre, N., Dias, F. J. S., Torres, A. R. Jr., Noriega, C., Araujo, M., Castro, A. C. L., et al. (2017). A source of CO2 to the atmosphere throughout the year in the Maranhense continental shelf (2°30′S, Brazil). Cont. Shelf Res. 141, 38–50. doi: 10.1016/j.csr.2017.05.004
Lefèvre, N., Diverrès, D., and Gallois, F. (2010). Origin of CO2 undersaturation in the western tropical Atlantic. Tellus B 62, 595–607. doi: 10.1111/j.1600-0889.2010.00475.x
Lefèvre, N., Moore, G., Aiken, J., Watson, A., Cooper, D., and Ling, R. (1998). Variability of pCO2 in the tropical Atlantic in 1995. J. Geophys. Res. 103, 5623–5634. doi: 10.1029/97JC02303
Lentz, S. J. (1995). Seasonal variations in the horizontal structure of the Amazon Plume inferred from historical hydrographic data. J. Geophys. Res. 100, 2391–2400. doi: 10.1029/94JC01847
Lentz, S. J., and Limeburner, R. (1995). The Amazon River Plume during AMASSEDS: spatial characteristics and salinity variability. J. Geophys. Res. 100, 2355–2375. doi: 10.1029/94JC01411
Lewis, E., and Wallace, D. (1998). Program Developed for CO2 System Calculations. Oak Ridge National Laboratory Environmental Sciences Division.
Mayorga, E., Aufdenkampe, A. K., Masiello, C. A., Krusche, A. V., Hedges, J. I., Quay, P. D., et al. (2005). Young organic matter as a source of carbon dioxide outgassing from Amazonian rivers. Nature 436, 538–541. doi: 10.1038/nature03880
Mehrbach, C., Culberson, C. H., Hawley, J. E., and Pytkowicz, R. M. (1973). Measurement of the apparent dissociation constants of carbonic acid in seawater at atmospheric pressure. Limnol. Oceanogr. 18, 897–907. doi: 10.4319/lo.1973.18.6.0897
Muller-Karger, F. E., McClain, C. R., and Richardson, P. L. (1988). The dispersal of Amazon's water. Nature 333, 56–59. doi: 10.1038/333056a0
O'Leary, M. H. (1988). Carbon isotopes in photosynthesis. Bioscience 38, 328–336. doi: 10.2307/1310735
Parlanti, E., Wörtz, K., Geoffroy, L., and Lamotte, M. (2000). Dissolved organic matter fluorescence spectroscopy as a tool to estimate biological activity in a costal zone submitted to anthropogenic inputs. Org. Geochem. 31, 1765–1781. doi: 10.1016/S0146-6380(00)00124-8
Pierrot, D., Lewis, E., and Wallace, D. W. R. (2006). MS Excel Program Developed for CO2 System Calculations, O.R.N.L. Oak Ridge, TN: Carbon Dioxide Information Analysis Center; U.S. Department of Energy.
Pierrot, D., Neill, C., Sullivan, K., Castle, R., Wanninkhof, R., Lüger, H., et al. (2009). Recommendations for autonomous underway pCO2 measuring systems and data-reduction routines. Deep Sea Res. 56, 512–522. doi: 10.1016/j.dsr2.2008.12.005
Richey, J. E., Melack, J. M., Aufdenkampe, A. K., Ballester, V. M., and Hess, L. L. (2002). Outgassing from Amazonian rivers and wetlands as a large tropical source of atmospheric CO2. Nature 416, 617–620. doi: 10.1038/416617a
Smith, J. R., and Demaster, D. J. (1996). Phytoplankton biomass and productivity in the Amazon River plume: correlation with seasonal river discharge. Cont. Shelf Res. 16, 291–319. doi: 10.1016/0278-4343(95)00007-N
Smoak, J. M. (2010). “The Amazon shelf,” in Carbon and Nutrient Fluxes in Continental Margins: a Global Synthesis, eds K. K. Liu, L. Atkinson, R. Qui-ones, and L. T. McManus (New York, NY: Springer), 443–449.
Stedmon, C. A., and Bro, R. (2008). Characterizing dissolved organic matter fluorescence with parallel factor analysis: a tutorial. Limnol. Oceanogr. Methods 6, 572–579. doi: 10.4319/lom.2008.6.572
Strickland, J. D. H., and Parsons, T. R. A. (1972). A practical handbook of sea water analysis. Bull. Fish. Res. 167, 1–311.
Subramaniam, A., Yager, P. L., Carpenter, E. J., Mahaffey, C., Björkman, K., Cooley, S., et al. (2008). Amazon River enhances diazotrophy and carbon sequestration in the tropical North Atlantic Ocean. Proc. Natl. Acad. Sci. U.S.A. 105, 10460–10465. doi: 10.1073/pnas.0710279105
Sweeney, C., Gloor, E., Jacobson, A. R., Key, R. M., McKinley, G., Sarmiento, J. L., et al. (2007). Constraining global air-sea gas exchange for CO2 with recent bomb 14C measurements. Global Biogeochem. Cycles 21, 1–187. doi: 10.1029/2006GB002784
Ternon, J. F., Oudot, C., Dessier, A., and Diverrès, D. (2000). A seasonal tropical sink for atmospheric CO2 in the Atlantic ocean: the role of the Amazon River discharge. Mar. Chem. 68, 183–201. doi: 10.1016/S0304-4203(99)00077-8
Ward, N. D., Krusche, A. V., Sawakuchi, H. O., Brito, D. C., Cunha, A. C., Moura, J. M. S., et al. (2015). The compositional evolution of dissolved and particulate organic matter along the lower Amazon River-Óbidos to the ocean. Mar. Chem. 177, 244–256. doi: 10.1016/j.marchem.2015.06.013
Weiss, R. F. (1974). CO2 in water and seawater: the solubility of a non-ideal gas. Mar. Chem. 2, 203–215. doi: 10.1016/0304-4203(74)90015-2
Yamashita, Y., and Tanoue, E. (2003). Chemical characterization of protein-like fluorophores in DOM in relation to aromatic amino acids. Mar. Chem. 82, 255–271. doi: 10.1016/S0304-4203(03)00073-2
Keywords: Amazon plume, fugacity of CO2, carbon cycle, Amazon continental shelf, French Guiana shelf, stable isotopes, FDOM
Citation: Lefèvre N, Flores Montes M, Gaspar FL, Rocha C, Jiang S, De Araújo MC and Ibánhez JSP (2017) Net Heterotrophy in the Amazon Continental Shelf Changes Rapidly to a Sink of CO2 in the Outer Amazon Plume. Front. Mar. Sci. 4:278. doi: 10.3389/fmars.2017.00278
Received: 17 March 2017; Accepted: 14 August 2017;
Published: 07 September 2017.
Edited by:
Ajit Subramaniam, LDEO, Columbia University, United StatesReviewed by:
Arne Koertzinger, GEOMAR Helmholtz Centre for Ocean Research Kiel (HZ), GermanyJoseph Salisbury, University of Gadarif, South Sudan
Taro Takahashi, Columbia University, United States
Copyright © 2017 Lefèvre, Flores Montes, Gaspar, Rocha, Jiang, De Araújo and Ibánhez. This is an open-access article distributed under the terms of the Creative Commons Attribution License (CC BY). The use, distribution or reproduction in other forums is permitted, provided the original author(s) or licensor are credited and that the original publication in this journal is cited, in accordance with accepted academic practice. No use, distribution or reproduction is permitted which does not comply with these terms.
*Correspondence: Nathalie Lefèvre, Nathalie.lefevre@locean-ipsl.upmc.fr