The Origin and Role of Organic Matrix in Coral Calcification: Insights From Comparing Coral Skeleton and Abiogenic Aragonite
 Thomas M. DeCarlo
 Haojia Ren
 Gabriela A. Farfan
- 1Oceans Institute and Oceans Graduate School, University of Western Australia, Crawley, WA, Australia
- 2ARC Centre of Excellence for Coral Reef Studies, University of Western Australia, Crawley, WA, Australia
- 3Department of Geosciences, National Taiwan University, Taipei, Taiwan
- 4Woods Hole Oceanographic Institution Joint Program in Oceanography and Applied Ocean Science and Engineering, Massachusetts Institute of Technology, Woods Hole, MA, United States
Understanding the mechanisms of coral calcification is critical for accurately projecting coral reef futures under ocean acidification and warming. Recent suggestions that calcification is primarily controlled by organic molecules and the biological activity of the coral polyp imply that ocean acidification may not affect skeletal accretion. The basis for these suggestions relies heavily on correlating the presence of organic matter with the orientation and disorder of aragonite crystals in the skeleton, carrying the assumption that organic matter observed in the skeleton was produced by the polyp to control calcification. Here we use Raman spectroscopy to test whether there are differences in organic matter content between coral skeleton and abiogenic aragonites precipitated from seawater, both before and after thermal annealing (heating). We measured the background fluxorescence and intensity of C-H bonding signals in the Raman spectra, which are commonly attributed to coral polyp-derived skeletal organic matrix (SOM) and have been used to map its distribution. Surprisingly, we found no differences in either fluorescence or C-H bonding between abiogenic aragonite and coral skeleton. Annealing reduced the molecular disorder in coral skeleton, potentially due to removal of organic matter, but the same effect was also observed in the abiogenic aragonites. The presence of organic molecules in the abiogenic aragonites is further supported by measurements of N content and δ15N. Together, our data suggest that some of what has been interpreted in previous studies as polyp-derived SOM may actually be seawater-sourced organic matter or some other signal not unique to biogenic aragonite. Finally, we create a high-resolution Raman map of a Pocillopora skeleton to demonstrate how patterns of fluorescence and elevated calcifying fluid aragonite saturation state (ΩAr) along centers of calcification are consistent with both biological and physico-chemical controls. Our aim is to advance discussion on biological mediation of calcification and the implications for coral resilience in a high-CO2 world.
Introduction
That organic molecules are involved in coral calcification has been recognized for nearly half of a century. Barnes (1970) proposed the existence of “a supersaturated solution of calcium carbonate suitably buffered with organic molecules and inorganic ions to favor the precipitation of aragonite” in an isolated, micro-scale space located between the living polyp and the skeleton. Since Barnes' hypothesis, vigorous debate has proceeded with different groups arguing for the relative importance of the organic and inorganic aspects of calcification, without a clear consensus (reviewed in Tambutté et al., 2011; Falini et al., 2015).
Understanding the mechanisms of coral calcification has received growing attention since the recognition that invasion of anthropogenic CO2 into the ocean is driving acidification via declines in pH and the saturation state of aragonite (ΩAr) in seawater (Caldeira and Wickett, 2003). The observed sensitivities of coral calcification rates to seawater ΩAr in laboratory experiments support the notion that the accretion of coral skeleton is, at least in part, a physicochemical process in which crystal growth rates depend on ΩAr (Gattuso et al., 1998; Langdon et al., 2003; Langdon and Atkinson, 2005; Chan and Connolly, 2013). Elevated ΩAr at the site of calcification may be “biologically mediated” (or “additive mediated” following Tambutté et al., 2011) via pH up-regulation, Ca2+ pumping, and the use of the carbonic anhydrase enzyme to catalyze the hydrolysis of CO2 to bicarbonate and then carbonate (McConnaughey and Whelan, 1997; Al-Horani et al., 2003; McCulloch et al., 2012; DeCarlo et al., 2018). Yet arguments have persisted for an entirely “biologically controlled” process (or “organic matrix template” model in Tambutté et al., 2011), based largely on observations of the skeletal organic matrix (SOM), even leading to recent suggestions that ocean acidification may be of less concern for coral calcification (Mass et al., 2013; Drake et al., 2017; Von Euw et al., 2017).
At least three lines of evidence support the role of the SOM in coral calcification. First, organic matter coats aragonite crystals in the skeleton (Clode and Marshall, 2002), and elevated organic matter content is closely associated with the relatively disordered centers of calcification (COCs; also called “rapid accretion deposits” or RADs) (Benzerara et al., 2011; Falini et al., 2013; Von Euw et al., 2017). Second, organic molecules extracted from the skeleton have been attributed to certain roles in crystal growth (Constantz and Weiner, 1988; Weiner and Addadi, 1991; Allemand et al., 1998; Goldberg, 2001; Cuif et al., 2008; Reggi et al., 2014; Takeuchi et al., 2016), with some proteins even capable of inducing spontaneous aragonite precipitation from seawater (Mass et al., 2013). Finally, the unit cell of biogenic aragonite contracts after annealing (i.e., heating and allowing to cool), presumably due to the removal of the SOM from the lattice (Pokroy et al., 2004; Reggi et al., 2014; Zolotoyabko, 2017). Together, there is compelling evidence that organic molecules are present within coral skeletons and that they are related, in some way, to the nucleation of aragonite crystals. However, it is often implicitly assumed that the organic molecules found in skeletons originate solely from the coral polyp and that they play an active, rather than passive, role in calcification. Conversely, Benzerara et al. (2011) proposed that organic molecules could be inertly trapped in the skeleton during rapid crystal nucleation (see also “bio-inorganic” calcification model in Tambutté et al., 2011), but this hypothesis has yet to be tested.
Directly assessing the role of organic molecules during coral skeleton accretion is difficult because the site of calcification is microns or less in size and inaccessible due to its location beneath the polyp (Tambutté et al., 2011). It is for this reason that studies of the organic matrix have relied heavily on characterizing its composition and location within the skeleton (in which it composes less than 0.1% by mass), rather than by direct observations during crystal growth (Allemand et al., 2004; Reggi et al., 2014; Wang et al., 2015). Techniques for observing and mapping the distribution of the SOM include scanning electron microscopy (Clode and Marshall, 2002), helium ion microscopy (Von Euw et al., 2017), transmission electron microscopy (Benzerara et al., 2011; Falini et al., 2013), and fluorescence as detected by a Raman spectrometer (Jolivet et al., 2008; Nehrke et al., 2011; Wall and Nehrke, 2012; Von Euw et al., 2017). Of these, Raman spectroscopy is advantageous in that it can potentially identify certain organic bonds, and the same spectra provide information regarding the chemical composition of the aragonite crystals (Bischoff et al., 1985; Nehrke et al., 2011; Wall and Nehrke, 2012; DeCarlo et al., 2017; Von Euw et al., 2017).
Here, we use fluorescence and C-H bonding signals in Raman spectroscopy to characterize organic content in coral skeleton and abiogenic (i.e., synthetic) aragonites precipitated from seawater, before and after thermal annealing. Figure 1 illustrates our hypotheses, which were designed to test implicit assumptions regarding SOM that persist in the literature: (1) If the organic molecules found in coral skeletons are derived solely from the polyp and corals precipitate their skeletons from seawater (Gagnon et al., 2012), then aragonite crystals precipitated from filtered seawater in the absence of a coral should not contain organics and therefore should neither fluoresce nor have C-H bonding peaks (Figure 1); and (2) if organic molecules are responsible for the disorder in coral aragonite crystals, then annealing should cause a reduction in the molecular disorder (i.e., an increase in crystallinity) coupled with a decrease of organic matter content in the skeleton, but not in abiogenic aragonites (Figure 1). These hypotheses assume that organic matter is associated with the aragonite crystals during their precipitation, rather than contamination. To help address these questions, we also measure N content and δ15N as an independent means of assessing possible sources of organic matter in the abiogenic aragonites. It is important to recognize that this study is not a test of whether a polyp-derived SOM exists or its particular role in calcification. Rather, with specific tests (hypotheses 1–2 above) on abiogenic and annealed samples, we can begin to address some of the common assumptions regarding the SOM, and ultimately advance our understanding of the origin of organic molecules in coral skeleton and their potential functions during calcification.
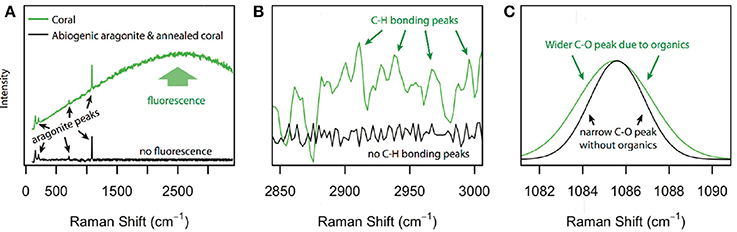
Figure 1. Expected signatures of organic molecules present in coral skeleton relative to abiogenic aragonite and annealed coral. (A) Raman spectra of coral skeleton are anticipated to fluoresce in the 2,400–2,700 cm−1 region (Nehrke et al., 2011; Wall and Nehrke, 2012), whereas abiogenic aragonite and annealed coral should not. (B) C-H bonding peaks in the 2,850–3,000 cm−1 region are expected in coral skeleton (Perrin and Smith, 2007; Von Euw et al., 2017), but not in abiogenic aragonite or annealed coral. (C) The ν1 peak at ~1,085 cm−1 (representing symmetric C-O stretching) should be wider in coral skeleton than abiogenic aragonite or annealed coral due to disorder caused by organic molecules (Von Euw et al., 2017).
Methods
Samples Analyzed With Raman Spectroscopy
Raman spectroscopy was used to analyze abiogenic aragonites precipitated from 0.2-μm filtered Vineyard Sound (Massachusetts, USA) seawater (described in DeCarlo et al., 2015; Holcomb et al., 2016) and the JCp-1 Porites coral skeleton (Okai et al., 2002), both before and after thermal annealing. Briefly, the abiogenic aragonites were precipitated by addition of NaHCO3 and Na2CO3 solutions to seawater, combined with air/CO2 bubbling, which together increases ΩAr and induces crystal nucleation. Following precipitation, the aragonites were rinsed with ethanol and then 18 M ohm deionized water, stored in glass vials that were washed with deionized water, and always handled with latex gloves. Subsamples of the same abiogenic samples have previously been analyzed with Raman spectroscopy using an infrared (785 nm) laser (DeCarlo et al., 2015, 2017), which reduces or eliminates fluorescence from organic molecules.
Raman 532 nm Measurements
In this study, all samples (abiogenic aragonites and JCp-1 coral) were re-analyzed in the visible spectrum with a green (532 nm) laser to quantify the fluorescence signal from organics. Although there is potential for photo-bleaching due to prior exposure to the 785 nm laser, our photo-bleaching test (described below) showed that the 1 s exposures used do not alter the organic signals by more than a few percent, and both abiogenic and coral samples were treated in the same way (785 nm analyses first, followed by 532 nm analyses). Measurements were made with a WITec Alpha 300RA+ Raman spectrometer with a CCD detector at −60°C, a 20x objective with a 0.5 numerical aperture, and using 1 s acquisitions. A 600 mm−1 grating was used, allowing us to capture the Raman shift between 100 and 3,400 cm−1. The instrument wavenumber is routinely calibrated by analysis of a silicon chip. Powders of each sample were spread onto a glass slide, and topography maps were made with the TrueSurface module. Raman measurements followed each topography map to ensure the optics remained in focus on the sample surfaces. For each sample, 100 Raman spectra were collected in a 10 by 10 grid with 30 μm between spots (300 by 300 μm area).
Photo-Bleaching Experiment
To test whether observed fluorescence was caused by organic molecules, as opposed to fluorescence from the crystals themselves or artifacts of the instrument, we also photo-bleached (with the 532 nm laser) one abiogenic aragonite sample for 3 h while collecting spectra every 1 s (Shea and Morris, 2002; Golcuk et al., 2006; Onogi and Hamaguchi, 2009).
Annealing Experiment
We concentrated our study on JCp-1 and the abiogenic samples that were repeatedly analyzed in DeCarlo et al. (2017): samples f02, f03, f06, g07, g13, and h09, which span a range of fluid ΩAr from 10 to 30. We then annealed a subset of JCp-1 and the abiogenic samples f03 and f06 following the procedure of Pokroy et al. (2004). The samples were heated in an oven at 140°C for 16 h and then allowed to cool to room temperature before Raman analyses.
Raman 785 nm Measurements
In addition to the measurements described above with the 532 nm laser, the annealed samples were also analyzed before and after heating with the same Raman instrument but with a 785 nm laser and 1,200 mm−1 grating as described in DeCarlo et al. (2017). These measurements with the 785 nm laser were conducted to evaluate any changes in crystal disorder due to the annealing process. We used repeated analyses of a silicon chip (primary peak at 520.5 cm−1) with the 785 nm laser to calibrate our measurements.
Pocillopora Skeletal Mapping
Analyses of JCp-1 are useful in that they can be readily reproduced by other researchers because JCp-1 powder has been distributed to laboratories around the world (Hathorne et al., 2013). However, since JCp-1 is homogenized (Okai et al., 2002), it is impossible to map the spatial distribution of organics within the skeleton. Therefore, we also used Raman spectroscopy to analyze the skeleton within the tissue layer of a Pocillopora damicornis coral. The colony was collected live on 31 May 2017 from a back reef environment of Ningaloo Reef in Western Australia (23.155°S 113.752°E). The tissue layer was removed with a water jet, the skeleton was embedded in epoxy (EPOTEK 301), and a petrographic thin section was prepared. Using reflected light, we identified a region of the skeleton within 2 mm of the growing tip with clear COCs. Two Raman maps of the same 1 mm by 0.2 mm area were created using the automated stage of the WITec instrument. The first was made with the 785 nm laser at 1 μm resolution using 0.3 s integrations. We used the 785 nm data to calculate the ΩAr at each 1 μm spot based on the calibration between ν1 peak width and ΩAr reported in DeCarlo et al. (2017). This calibration is based on the strong relationship observed between the fluid ΩAr of the abiogenic aragonite experiments and the aragonite lattice disorder as represented by the ν1 peak width. Next, we switched to the 532 nm laser and mapped the same area at 2 μm resolution using 0.1 s integrations to visualize the distribution of organic matter signals (fluorescence and C-H bonding). To compare these data collected with 0.1 s integrations to the analyses described above with 1 s integrations, we removed the baseline intensity (determined by “dark” spectra with the laser off) of the 0.1 s data and then multiplied the spectra by a factor of 10. We removed all spectra with evidence of epoxy contamination, based on the presence of peaks in the 1,200–2,000 cm−1 region of the spectrum that are not attributable to aragonite but are common in thin section mounting epoxies (Dieing et al., 2011; Jolivet et al., 2013). Note that we never detected any non-aragonite peaks in analyses of the powder samples.
Data Treatment of Raman Spectra
Two main approaches to characterize organics from Raman spectra have been used in the literature: quantifying the background fluorescence in the 2,400–2,700 cm−1 region (Nehrke et al., 2011; Wall and Nehrke, 2012; Beierlein et al., 2015) and anomalies in the 2,850–3,000 cm−1 region attributed to C-H bonds (Lin-Vien et al., 1991; Perrin and Smith, 2007; Jolivet et al., 2008; Nehrke et al., 2011; Von Euw et al., 2017). Here, we evaluated the organic matter content in a variety of ways based on the data in these two regions of the spectra. First, we calculated the mean intensity between 2,400 and 2,700 cm−1, a technique previously used as a measure of SOM content in mollusks and corals (Nehrke et al., 2011; Wall and Nehrke, 2012). It is important to recognize that this fluorescence is not a Raman scattering mode, but rather a resonant effect (measured in CCD counts) that has been attributed to organic molecules (Nehrke et al., 2011; Von Euw et al., 2017). The background fluorescence intensity can, however, vary depending on the focus and orientation of the sample. In an attempt to account for this, we also normalized the fluorescence signal to the maximum intensity measured in the Raman ν1 peak between 1,080 and 1,100 cm−1 (following e.g., Jolivet et al., 2008; Thompson et al., 2015), which represents the symmetric C-O stretching in CaCO3. Next, we quantified the C-H bonding signal as the mean intensity in the 2,850–3,000 cm−1 region after subtracting the background signal (i.e., the mean intensity of the 2,830–2,850 cm−1 and the 3,000–3,020 cm−1 regions), which is analogous to integrating the area under the C-H bonding peaks (Von Euw et al., 2017). Additionally, we calculated the relative standard deviation (RSD) in the 2,850–3,000 cm−1 region (i.e., the standard deviation divided by the mean) because the presence of C-H bonds should increase the relative variance within this part of the spectrum (Jolivet et al., 2008; Von Euw et al., 2017). We used linear regressions to test for significant relationships between the organic content metrics and the known fluid ΩAr.
We also calculated the ν1 wavenumber (i.e., position) and full width at half maximum (FWHM) to gain insights into crystallographic changes due to annealing. The FWHM represents the distribution of C-O bond lengths, and thus depends on the disorder within the crystal lattice (Bischoff et al., 1985). Peak wavenumber reflects the average C-O bond length, which could change if the aragonite unit cell contracts or expands (Bischoff et al., 1985; Urmos et al., 1991). Although both wavenumber and FWHM could be influenced by Mg content, the relatively small concentrations of Mg in aragonite, compared to high-Mg calcite, make the role of Mg minor or negligible (Bischoff et al., 1985; Pauly et al., 2015; DeCarlo et al., 2017). We used two-sample t-tests to investigate whether ν1 wavenumber and FWHM significantly changed after the annealing procedure.
N Content and δ15N
We measured N content and δ15N in a subset of the abiogenic samples to independently evaluate the presence of organics and their possible sources. These analyses require >20 mg of aragonite powder, which exceeds the amount of material remaining for most of the abiogenic samples after previous measurements (DeCarlo et al., 2015; Holcomb et al., 2016). Therefore, we chose to mix three abiogenic samples (f02, f03, and f06) that had enough material remaining and that precipitated across the full range of ΩAr. This mixing was done to achieve an approximate mean N content across the abiogenic aragonites, although it precludes analysis of the dependence of N content or δ15N on ΩAr. This mixture was then split into three subsamples, one each for analyses of different N fractions. Loosely bound (inorganic) nitrate and nitrite were measured by directly dissolving the aragonite powder without oxidation. Total N (including inorganic and organic forms) was measured by dissolving the aragonite powder and then oxidizing with purified potassium persulfate. Finally, the mineral-bound N fraction (including inorganic and organic forms) was measured by first cleaning the aragonite powder with 13% concentrated bleach (NaOCl), dissolving, and then oxidizing it also with purified potassium persulfate. For each fraction, the N content was analyzed by nitrate reduction to nitric oxide using vanadium (III) followed by chemiluminescence detection. The δ15N of the samples was determined using the denitrifier method in conjunction with gas chromatography and isotope ratio mass spectrometry at the Department of Geosciences, Princeton University (Sigman et al., 2001).
Assuming all the N exists in four fractions (loosely-bound vs. mineral-bound, and inorganic vs. organic; Wang et al., 2015; Ren et al., 2017), we can use our measurements to estimate the concentration of the loosely-bound organic fraction as the difference between the total N and the sum of the loosely-bound inorganic fraction and the mineral-bound inorganic/organic fraction. Additionally, we can estimate by mass balance the loosely-bound organic fraction δ15N:
where fi and Ri are the mass proportion and isotope ratio (15N/14N), respectively, of fraction i, and fraction 1 is the total inorganic/organic content. If fraction 4 is the loosely-bound organic fraction (the only fraction not measured), then Equation (1) can be rearranged to
where fractions 2 and 3 are the loosely-bound inorganic and the mineral-bound inorganic/organic, respectively.
Results
All aragonite samples fluoresced under the 532 nm laser (Figure 2). The coral samples (JCp-1) fluoresced similar to or less than abiogenic samples, contradicting the expectation that the abiogenic aragonites would not contain organic matter and therefore that only coral skeleton would fluoresce (Figure 1A). Inspection of the spectral region with peaks characteristic of organic molecules showed no obvious differences among samples in either the nominal C-H region between 2,850 and 3,000 cm−1 or the broader 2,700–3,300 cm−1 region (Figure 3), again opposing the expectation that C-H bonds would only be present in the coral skeleton (Figure 1B).
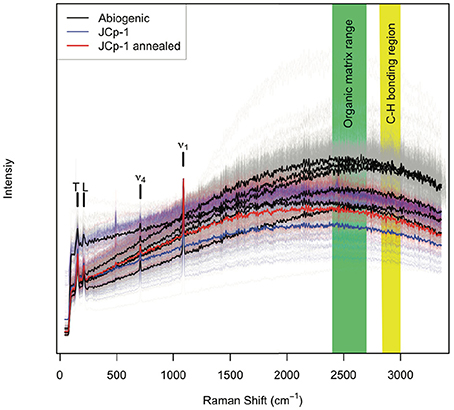
Figure 2. Fluorescence in coral skeleton and abiogenic aragonite. Raman intensity (normalized to the ν1 peak maximum) over the spectral range 100–3,400 cm−1 for abiogenic samples (individual spectra in gray, experiment means in black), JCp-1 skeleton before annealing (blue), and JCp-1 skeleton after annealing (red). The green and yellow bars indicate the regions used to assess organic molecules based on total fluorescence (green), and C-H bonding peaks (yellow). The mineral (aragonite) peaks are labeled: translation (T), libration (L), ν4 and ν1.
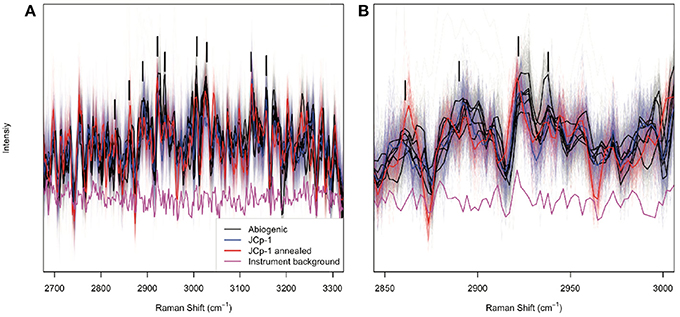
Figure 3. Raman peaks indicative of organic functional groups. Abiogenic aragonites are plotted in black, JCp-1 before annealing in blue, and JCp-1 after annealing in red, over the spectral ranges (A) 2,700–3,300 cm−1 and (B) 2,850–3,000 cm−1. The magenta line shows the instrument background as determined by measuring the glass slide adjacent to aragonite samples. Thin lines represent individual spectra, and thick lines represent sample means. Potential organic bonding peaks are indicated by black vertical bars following Perrin and Smith (2007). The data have been detrended and divided by the mean intensity over each spectral range to facilitate visualizing spectra from all samples together.
Our results of photo-bleaching sample g07 suggest that the fluorescence of the abiogenic samples was like due to organic molecules that are removed by exposure to a laser in the visible spectrum (Onogi and Hamaguchi, 2009). Fluorescence and C-H bonding anomalies both decreased rapidly, with little evidence of organics remaining after 104 s of photo-bleaching (Figure 4). This is consistent previous studies that removed organic molecules from bone tissues by photo-bleaching with green lasers (Shea and Morris, 2002; Golcuk et al., 2006).
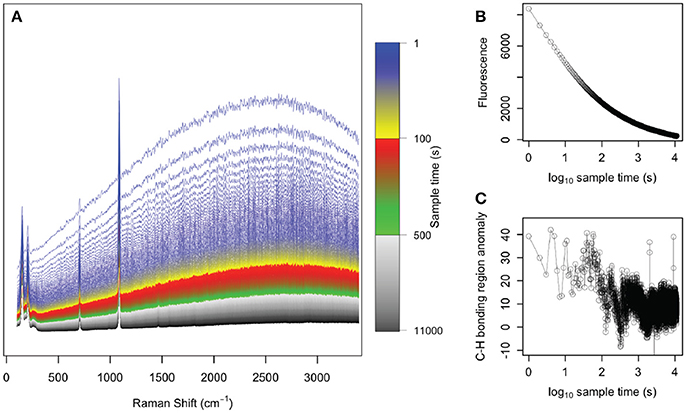
Figure 4. Photo-bleaching abiogenic sample g07. (A) Raman spectra collected every 1 s for 1.1 × 10⁴ s, with colors indicating the various spectra collected over time. The initial spectra (blue) showed strong fluorescence whereas by the end of the experiment (black), the spectra were nearly flat and fluorescence was absent. The (B) fluorescence in the 2,400–2,700 cm−1 region and (C) C-H bonding anomaly in the 2,850–3,000 cm−1 region are plotted over time, clearly demonstrating the removal of these organic signals under exposure to the green laser.
Quantification of organic content metrics likewise showed little, if any, differences among samples. We plotted these metrics against fluid ΩAr in order to (1) visualize any differences among samples, and (2) assess whether organic matter content correlates with ΩAr, which could indicate that more organic molecules are trapped in faster growing crystals (Perrin and Smith, 2007; Li and Estroff, 2009; Benzerara et al., 2011). There was a general tendency of increasing fluorescence with ΩAr in abiogenic samples (Figure 5A), but the large variance within samples precludes any definitive interpretations and the pattern was not significant [r2 = 0.56, n = 7, p = 0.053, F(1, 5) = 6.397]. After normalizing to ν1 intensity (Figure 5B), the general tendency of increasing fluorescence with increasing ΩAr remained, but the relationship was still not significant [r2 = 0.24, n = 7, p = 0.086, F(1, 5) = 1.564]. Anomalies in the C-H bonding region (mean intensity after background subtraction) also increased with ΩAr (Figure 5C), but again the relationship was not significant [r2 = 0.54, n = 7, p = 0.058, F(1, 5) = 5.981]. The RSD in the C-H bonding region showed little pattern with ΩAr [r2 = 0.04, n = 7, p = 0.67, F(1, 5) = 0.209; Figure 5D].
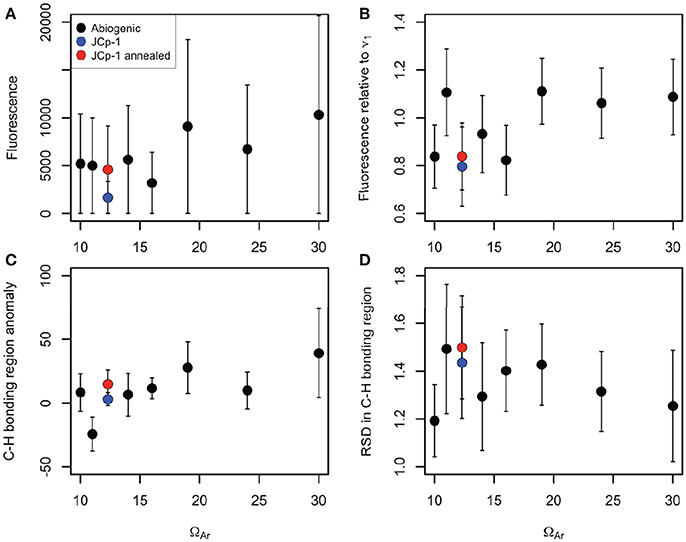
Figure 5. Various Raman organic matter metrics plotted against fluid ΩAr for abiogenic aragonites (black), JCp-1 before annealing (blue), and JCp-1 after annealing (red). (A) Total fluorescence (mean intensity in 2,400–2,700 cm−1 region). (B) Fluorescence divided by the maximum intensity of the ν1 peak. (C) Total C-H bonding anomalies (mean intensity in the 2,850–3,000 cm−1 region minus the mean intensity in the 2,830–2,850 cm−1 and 3,000–3,020 cm−1 regions). (D) Relative standard deviation in the C-H bonding region (standard deviation divided by the mean intensity over 2,850–3,000 cm−1). Points represent means and error bars indicate standard deviations of the 100 spectra collected for each sample. All metrics are in arbitrary units based on Raman intensity.
Critically, the JCp-1 coral samples, both before and after annealing, fell within the range of abiogenic samples for all the organic metrics. Indeed, based on the data presented here combined with previous analyses of the ν1 peak characteristics (DeCarlo et al., 2017), we cannot find any way to distinguish the Raman spectrum of the JCp-1 Porites coral from that of an abiogenic aragonite precipitated from seawater with a similar ΩAr (JCp-1 derived ΩAr is 12.3 based on DeCarlo et al., 2017).
Annealing JCp-1 changed the ν1 peak characteristics (Figure 6; Table 1). The ν1 FWHM significantly decreased, and wavenumber significantly increased, after annealing (two-sample t-tests, n = 100, p < 0.01 for both wavenumber and FWHM). Similar changes were observed for the abiogenic aragonites after annealing (Table 1; two-sample t-tests, n = 100, p < 0.01 in all cases). While the decreased FWHM in annealed coral was expected, any changes in abiogenic aragonite FWHM after annealing were not (Figure 1C).
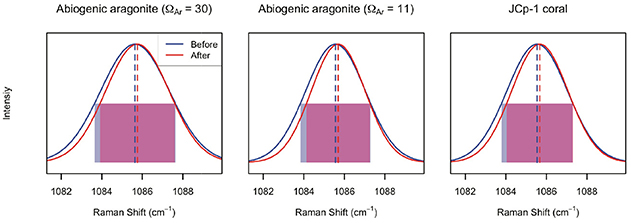
Figure 6. Effects of annealing on ν1 peak parameters of abiogenic aragonites and coral skeleton. In each panel, the blue and red lines indicate the average of 100 spectra collected before and after annealing, respectively. The dashed lines indicate peak wavenumber, and the translucent rectangles indicate the FWHM (blue and red for before and after annealing, respectively, and purple where there is overlap). For all three samples, annealing increased the peak wavenumber (red dashed lines are to the right of the blue ones) and decreased the peak width (red rectangles are narrower than the blue ones).
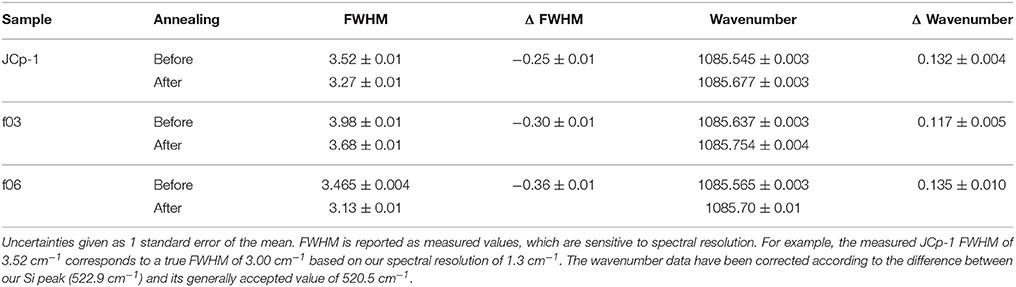
Table 1. Changes in ν1 peak properties (units of cm−1) due to thermal annealing.
N Content and δ15N
The N content and δ15N results from the mixture of abiogenic samples f02, f03, and f06 are displayed in Table 2. The highest N content (12.01 μmol g−1) was measured in the total inorganic + organic fraction. We estimated by mass balance the loosely-bound organic fraction and its δ15N as 9.0 μmol g−1 and 5.56%0, respectively (Table 2).
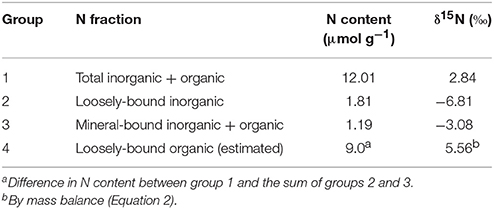
Table 2. N content and δ15N of various N fractions of the mixture of abiogenic samples f02, f03, and f06.
High-Resolution Mapping of Pocillipora Skeleton
In our analysis of the Pocillipora skeleton, several previously described features of the skeleton are apparent. The COCs are visible as optically dark regions along the center of the skeletal spine, with optically light fibers radiating outwards from the COCs (Cohen and McConnaughey, 2003). Raman ν1 FWHM is greater in the COCs than the surrounding fibers, and the COCs are generally characterized by elevated fluorescence and C-H bonding peaks (Figure 7). Fluorescence increases from typically <1,000 intensity units in the fibers to as much as 3,000 intensity units in the COCs. C-H peak anomalies are typically <30 in the fibers and <100 in the COCs, with a few values reaching ~150. The fluorescence values, and most of the C-H bonding anomalies, are within the range of our analyses of JCp-1 and abiogenic aragonites (Figure 5). Note that in Figures 7C,D we have removed all spectra with evidence of contamination from the mounting epoxy, which is known to produce anomalous C-H bonding signals (Dieing et al., 2011). While checking for epoxy contamination is now standard practice in Raman analyses of CaCO3 fish otoliths (Jolivet et al., 2013), it has not always been done in Raman studies of coral skeletons, making it difficult to determine whether C-H bonding signals arise entirely from the skeleton or partly from epoxy contamination. This may be one reason why previously reported C-H bonding signals (e.g., Von Euw et al., 2017) appear clearer than our analyses of powder samples (Figure 3), which were never exposed to epoxy and showed no signs of such contamination in the Raman spectra.
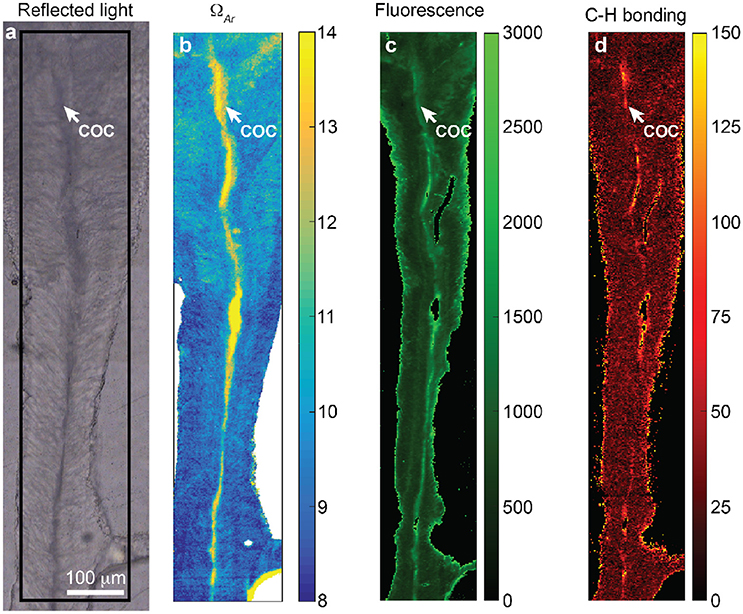
Figure 7. High-resolution Raman mapping of a Pocillopora skeleton. (A) Reflected light image showing the COCs and radiating fibers as dark and light regions, respectively. The black box indicates the region in (C,D) for Raman mapping. (B) 1-μm resolution Raman map (using 785 nm laser) showing ν1 peak width, which has been translated to ΩAr based on the calibration of DeCarlo et al. (2017). The COCs are clearly associated with relatively high ΩAr. (C,D) 2-μm resolution Raman maps (using 532 nm laser) of fluorescence (C) and C-H bonding peak anomalies (D). In (B) we removed spectra that represent only epoxy (i.e., those without a detectable ν1 peak). In (C,D) we removed spectra partially contaminated by epoxy and retained only those which represent analyses of strictly skeleton.
Discussion
Organic Matter in Abiogenic and Coral Samples
The organic matter in coral skeleton is typically considered to be a SOM that is produced by the coral polyp and that plays an active role in crystal nucleation and growth (Von Euw et al., 2017). If this is true, it thus follows that abiogenic aragonite should not contain organics, assuming there is no sample contamination. However, our results demonstrate that background fluorescence and C-H bonding peaks in Raman spectra are persistent features of aragonite precipitated from seawater, whether the aragonite was precipitated by a coral polyp or abiogenically in a beaker (Figures 2, 3). Despite calculating multiple metrics of organic matter content, we could find no measureable differences between the spectra of coral skeleton and those of abiogenic aragonite precipitated from seawater (Figure 5). Since coral calcification reflects seawater chemical signals and is presumed to proceed from a seawater-sourced fluid (Gagnon et al., 2012), the Raman spectra of coral skeletons do not necessarily indicate the presence of a polyp-derived SOM because the fluorescence and C-H bonding peaks could result instead from seawater organic matter trapped during crystal growth. These aspects of the abiogenic spectra are most likely caused by organic molecules since organic N was detected (Table 2) and because fluorescence and C-H bonds are removed with photo-bleaching (Figure 4), similar to previous Raman studies that removed organic molecules from bone by photo-bleaching (Shea and Morris, 2002; Golcuk et al., 2006).
One possibility to explain the similar fluorescence and C-H bonding between abiogenic aragonite and coral skeleton is that organic matter from seawater is trapped in growing aragonite crystals (Benzerara et al., 2011). Tendencies toward higher organic indices with increasing ΩAr (Figures 5A–C, r2 between 0.24 and 0.56) may suggest this organic trapping mechanism increases under more rapid crystal growth as has been observed previously for calcite (Li and Estroff, 2009), but this interpretation remains inconclusive due to the lack of statistically significant correlations between the metrics and ΩAr (0.05 < p < 0.10).
Another possible explanation is that polyp-derived SOM is concentrated in a small fraction of the skeleton such that our Raman analyses of bulk skeleton powders (JCp-1) did not detect substantial differences from abiogenic aragonites. The laser in our Raman system has a spot size of ~1 μm, meaning that our measurements represent discrete points spread across the powdered samples. For instance, if polyp-derived SOM is only present in COCs, it is possible that a relatively minor percentage of our laser spots were placed on COCs in the JCp-1 powder, or that the proportion of skeleton with polyp-derived SOM is small enough that it does not substantially affect the organic matter metrics that are averaged over the bulk skeleton (Figure 5).
Our measurements of N content and δ15N provide some constraints on the source of organics in the abiogenic samples. Most (~75%) of the N appears to be in a loosely bound organic form with a δ15N of 5.6%0 (Table 2). Although we did not measure the nitrogen isotopic composition of the Vineyard Sound seawater from which the aragonites precipitated, 5.6%0 is within the range (albeit on the high end) of dissolved organic nitrogen (DON) δ15N in the Atlantic Ocean (~3–6%0) (Knapp et al., 2011). Thus, our results may indicate that DON is either adsorbed or weakly trapped by aragonite crystals precipitating from seawater, as previously hypothesized (Benzerara et al., 2011). We also detected a substantial N fraction (1.19 μmol g−1) tightly bound to the mineral phase, at least half of that typically found in coral skeletons (Wang et al., 2015), although we cannot distinguish whether this N is organic or inorganic. While these results should be replicated to more thoroughly characterize N incorporation mechanisms in abiogenic aragonites, they support our conclusion that organic molecules cause the fluorescence and C-H bonds in the Raman spectra of these aragonites.
Insights From Annealing Experiments
Results obtained from annealed samples provide further insight into the organics in our aragonite samples. Pokroy et al. (2004) clearly showed with X-ray diffraction (XRD) that biogenic calcium carbonates contain lattice distortions relative to “geological” samples, and that these lattice distortions mostly disappear (i.e., the unit cell shrinks) after even mild heating (140°C for 16 h). Similar results have been achieved on a variety of biogenic calcium carbonates (Pokroy et al., 2006a,b, 2009; Stolarski et al., 2007; Zolotoyabko et al., 2007; Reggi et al., 2014; Zolotoyabko, 2017), including corals, and have been attributed to the degradation of intra-crystalline SOM by heating. While Raman spectroscopy cannot be used to quantify the unit cell parameters with the precision of XRD, we expect the unit cell changes to manifest in the Raman ν1 peak as (1) a decrease in FWHM due to decreased disorder, and (2) an increase in wavenumber due to the shorter bond lengths, and thus higher frequency vibrations, in the contracted unit cell. Indeed, this is exactly what we observed after annealing JCp-1, entirely consistent with the results of Pokroy et al. (2004) and subsequent studies (reviewed in Zolotoyabko, 2017).
However, our results cast doubt on the interpretation that the lattice changes induced by annealing result from the removal of polyp-derived SOM. First, we found no significant differences in the Raman-based organic matter metrics of JCp-1 before and after annealing (Figure 5). This was surprising because the N content data suggested that most of the N was loosely bound, thus potentially indicating that the fluorescence and C-H bonding signals come primarily from the mineral-bound organic fraction. The second line of evidence that polyp-derived organics did not cause the lattice changes is that the same effects (decreased FWHM and increased wavenumber) were observed in abiogenic aragonites (Table 1; Figure 6). One explanation is that the lattice changes were induced by subtle loss of organic matter (Dauphin et al., 2006), below the level of change that we could detect. However, if this is the case, then the lattice strains are not specific to organic matter produced by the coral and could be the result of removing seawater-sourced organic matter from the crystals. Another possibility is that no organic matter was removed or that lattice strains are unrelated to organic matter, which is consistent with the lack of any changes in the lattices of chemically bleached (i.e., treated with NaOCl) biogenic aragonites (Pokroy et al., 2006a; Nehrke et al., 2011). It is important to recognize that the changes in lattice parameters could result directly from the annealing process. Indeed, annealing (commonly defined as “heating and allowing to cool slowly, in order to remove internal stress”) is well known to increase crystallinity independent of organic matter (Choi et al., 1999; Nasdala et al., 2001; Nguyen et al., 2009).
Summary and High-Resolution Raman Mapping
Together, our Raman analyses of abiogenic aragonite and coral skeleton before and after annealing highlight the difficulty of identifying the source of organic matter found in coral skeleton and its role in the calcification process. Abiogenic aragonites precipitated from seawater should be used as controls when investigating organic molecules in coral skeletons. The results of our study suggest that the presence of organic matter in aragonite is not sufficient evidence for identifying coral polyp-derived SOM. This is not to say that coral polyps do not produce a SOM, but rather that it is not yet clear how to identify and quantify it. Indeed, the findings of proteins capable of inducing aragonite precipitation from seawater make a compelling case that polyps actively modulate crystal nucleation (Drake et al., 2013; Mass et al., 2013). The outstanding question, however, is what role the SOM plays throughout the entire skeleton-building process. Arguments that skeletal accretion is entirely biologically controlled, independent of calcifying fluid pH or ΩAr (Von Euw et al., 2017), cannot be reconciled with the abundant evidence that calcification is sensitive to seawater carbonate chemistry (Langdon et al., 2003; Langdon and Atkinson, 2005; Cohen et al., 2009; Chan and Connolly, 2013; Comeau et al., 2013, 2017; Drenkard et al., 2013; Venn et al., 2013) or with geochemical evidence that coral skeletons are precipitated from a seawater-like solution (McConnaughey, 1989; Adkins et al., 2003; Cohen and McConnaughey, 2003; Gaetani and Cohen, 2006; Gagnon et al., 2007, 2012; Trotter et al., 2011; McCulloch et al., 2012, 2017; D'Olivo and McCulloch, 2017). Yet, that SOM may be involved as a template for initial crystal nucleation in COCs, as a buffer of calcifying fluid pH, or as a means to control the size and orientation of crystals, is consistent with the available evidence and with the original hypothesis of Barnes (1970). This explanation allows for an active role of SOM in part of the skeleton (the COCs), while physicochemical aspects (e.g., ΩAr) are still important for the bulk of skeletal accretion.
Using Raman maps of the Pocillopora thin section shown in Figure 7, we highlight how different explanations of coral calcification have arisen from some of the same observations. With similar Raman maps, Von Euw et al. (2017) argued for a completely biologically controlled mechanism, in which SOM in the COCs produced an amorphous calcium carbonate (ACC) precursor with greater FWHM. It is important to note that the evidence for ACC is tenuous because ACC has ν1 FWHM of >20 cm−1 (Wang et al., 2012), which would imply an increase in FWHM orders of magnitude more than the ~10% changes observed by both us and Von Euw et al. (2017). Furthermore, observations with high-resolution transmission electron microscopy (HRTEM) show that COCs are composed of ~100 nm grains oriented as mesocrystals with no clear sign of ACC (Benzerara et al., 2011), similar to abiogenic aragonites grown without organic additives (Zhou et al., 2009). More recent data from photoemission electron spectroscopy (PEEM) provide stronger evidence that ACC is present in coral skeleton (Mass et al., 2017), but it is still unknown whether any ACC formation is related to organic molecules. To illustrate an alternative explanation from the same data in Figure 7, the fluorescence and ν1 FWHM patterns can be described by physicochemical mechanisms without the need for an active SOM. The greater FWHM in the COCs compared to fibers can be explained by COC precipitation from higher ΩAr (DeCarlo et al., 2017), consistent with nanoscale observations of crystal size and alignment (Holcomb et al., 2009; van de Locht et al., 2013). Elevated ΩAr is achieved by transporting seawater to the calcifying space and up-regulating pH and/or [Ca2+] (Gagnon et al., 2012; McCulloch et al., 2012; DeCarlo et al., 2018). Once precipitation is initiated, the COCs may trap a relatively large amount of organic matter from seawater either because they grow quickly or because the relatively small grains that compose them have high surface areas (Li and Estroff, 2009; Benzerara et al., 2011; van de Locht et al., 2013). The fibers then grow under lower ΩAr and have less surface area (Holcomb et al., 2009; van de Locht et al., 2013), potentially trapping less organic matter.
The previous discussion is intended to demonstrate that interpreting data to fit within one particular mechanism (i.e., entirely biological or physicochemical control) is unlikely to advance our understanding of coral calcification and its sensitivity to ocean acidification. High ΩAr is spatially linked in the skeleton with high SOM content, but it is not yet clear which one causes the other, or if they are mechanistically linked at all. Compelling evidence exists for an important role of SOM in crystal nucleation (e.g., Mass et al., 2013) and its distribution in the skeleton is clearly not random (Figure 7), but skeletal geochemistry and the observed sensitivities of corals to acidified seawater (Chan and Connolly, 2013) cannot be ignored or dismissed. Whether corals exert some influence over calcification is not often questioned, and indeed most studies agree that corals actively mediate the skeleton-building process (Barnes, 1970; Cohen and McConnaughey, 2003; Tambutté et al., 2011; McCulloch et al., 2012; Von Euw et al., 2017). Rather, we need to focus on questions such as what are the limits of this mediation, what are the metabolic costs, and what environmental factors (e.g., eutrophication, warming, acidification) will modulate it.
Author Contributions
TD conceived the idea, designed the study, performed the analyses, and wrote the manuscript. HR conducted nitrogen measurements. HR and GF aided interpreting and editing the final manuscript.
Funding
This study was supported by an ARC Laureate Fellowship (FL120100049) awarded to Professor Malcolm McCulloch and the ARC Centre of Excellence for Coral Reef Studies (CE140100020).
Conflict of Interest Statement
The authors declare that the research was conducted in the absence of any commercial or financial relationships that could be construed as a potential conflict of interest.
Acknowledgments
We thank Claire Ross, Thomas Becker, Frank Nemeth, and Xingchen T. Wang for field and laboratory assistance. Facilities of the Sigman laboratory in the Department of Geosciences, Princeton University, NJ, USA made possible the nitrogen analyses. The authors acknowledge the facilities, and the scientific and technical assistance of the Australian Microscopy and Microanalysis Research Facility at the Centre for Microscopy, Characterisation and Analysis, The University of Western Australia, a facility funded by the University, the Western Australian State and Commonwealth Governments.
References
Adkins, J. F., Boyle, E. A., Curry, W. B., and Lutringer, A. (2003). Stable isotopes in deep-sea corals and a new mechanism for “vital effects.” Geochim. Cosmochim. Acta 67, 1129–1143. doi: 10.1016/S0016-7037(02)01203-6
Al-Horani, F. A., Al-Moghrabi, S. M., and De Beer, D. (2003). The mechanism of calcification and its relation to photosynthesis and respiration in the scleractinian coral Galaxea fascicularis. Mar. Biol. 142, 419–426. doi: 10.1007/s00227-002-0981-8
Allemand, D., Ferrier-Pagès, C., Furla, P., Houlbrèque, F., Puverel, S., Reynaud, S., et al. (2004). Biomineralisation in reef-building corals: from molecular mechanisms to environmental control. Comptes Rendus Palevol 3, 453–467. doi: 10.1016/j.crpv.2004.07.011
Allemand, D., Tambutté, É., Girard, J., and Jaubert, J. (1998). Organic matrix synthesis in the scleractinian coral Stylophora pistillata: role in biomineralization and potential target of the organotin tributyltin. J. Exp. Biol. 201, 2001–2009.
Barnes, D. J. (1970). Coral skeletons: an explanation of their growth and structure. Science 170, 1305–1308. doi: 10.1126/science.170.3964.1305
Beierlein, L., Nehrke, G., and Brey, T. (2015). Confocal Raman microscopy in sclerochronology: a powerful tool to visualize environmental information in recent and fossil biogenic archives. Geochem. Geophys. Geosyst. 16, 325–335. doi: 10.1002/2014GC005547
Benzerara, K., Menguy, N., Obst, M., Stolarski, J., Mazur, M., Tylisczak, T., et al. (2011). Study of the crystallographic architecture of corals at the nanoscale by scanning transmission X-ray microscopy and transmission electron microscopy. Ultramicroscopy 111, 1268–1275. doi: 10.1016/j.ultramic.2011.03.023
Bischoff, W. D., Sharma, S. K., and MacKenzie, F. T. (1985). Carbonate ion disorder in synthetic and biogenic magnesian calcites; a Raman spectral study. Am. Mineral. 70, 581–589.
Caldeira, K., and Wickett, M. E. (2003). Anthropogenic carbon and ocean pH. Nature 425:365. doi: 10.1038/425365a
Chan, N. C. S., and Connolly, S. R. (2013). Sensitivity of coral calcification to ocean acidification: a meta-analysis. Glob. Chang. Biol. 19, 282–290. doi: 10.1111/gcb.12011
Choi, W. K., Ng, V., Ng, S. P., Thio, H. H., Shen, Z. X., and Li, W. S. (1999). Raman characterization of germanium nanocrystals in amorphous silicon oxide films synthesized by rapid thermal annealing. J. Appl. Phys. 86:1398. doi: 10.1063/1.370901
Clode, P. L., and Marshall, A. T. (2002). Low temperature FESEM of the calcifying interface of a scleractinian coral. Tissue Cell 34, 187–198. doi: 10.1016/S0040-8166(02)00031-9
Cohen, A. L., and McConnaughey, T. A. (2003). Geochemical perspectives on coral mineralization. Rev. Miner. Geochem. 54, 151–187. doi: 10.2113/0540151
Cohen, A. L., McCorkle, D. C., de Putron, S., Gaetani, G. A., and Rose, K. A. (2009). Morphological and compositional changes in the skeletons of new coral recruits reared in acidified seawater: insights into the biomineralization response to ocean acidification. Geochem. Geophys. Geosyst. 10:Q07005. doi: 10.1029/2009GC002411
Comeau, S., Carpenter, R. C., and Edmunds, P. J. (2013). Coral reef calcifiers buffer their response to ocean acidification using both bicarbonate and carbonate. Proc. R. Soc. B. Biol. Sci. 280:20122374. doi: 10.1098/rspb.2012.2374
Comeau, S., Tambutté, E., Carpenter, R. C., Edmunds, P. J., Evensen, N. R., Allemand, D., et al. (2017). Coral calcifying fluid pH is modulated by seawater carbonate chemistry not solely seawater pH. Proc. R. Soc. Lond. B Biol. Sci. 284:20161669. doi: 10.1098/rspb.2016.1669
Constantz, B., and Weiner, S. (1988). Acidic macromolecules associated with the mineral phase of scleractinian coral skeletons. J. Exp. Zool. 248, 253–258. doi: 10.1002/jez.1402480302
Cuif, J. P., Dauphin, Y., Farre, B., Nehrke, G., Nouet, J., and Salome, M. (2008). Distribution of sulphated polysaccharides within calcareous biominerals suggests a widely shared two-step crystallization process for the microstructural growth units. Mineral. Mag. 72, 233–237. doi: 10.1180/minmag.2008.072.1.233
Dauphin, Y., Cuif, J.-P., and Massard, P. (2006). Persistent organic components in heated coral aragonitic skeletons–implications for palaeoenvironmental reconstructions. Chem. Geol. 231, 26–37. doi: 10.1016/j.chemgeo.2005.12.010
DeCarlo, T. M., Comeau, S., Cornwall, C. E., and McCulloch, M. T. (2018). Coral resistance to ocean acidification linked to increased calcium at the site of calcification. Proc. R. Soc. B 285:20180564. doi: 10.1098/rspb.2018.0564
DeCarlo, T. M., D'Olivo, J. P., Foster, T., Holcomb, M., Becker, T., and McCulloch, M. T. (2017). Coral calcifying fluid aragonite saturation states derived from Raman spectroscopy. Biogeosciences 14, 5253–5269. doi: 10.5194/bg-14-5253-2017
DeCarlo, T. M., Gaetani, G. A., Holcomb, M., and Cohen, A. L. (2015). Experimental determination of factors controlling U/Ca of aragonite precipitated from seawater: implications for interpreting coral skeleton. Geochim. Cosmochim. Acta 162, 151–165. doi: 10.1016/j.gca.2015.04.016
D'Olivo, J. P., and McCulloch, M. T. (2017). Response of coral calcification and calcifying fluid composition to thermally induced bleaching stress. Sci. Rep. 7:2207. doi: 10.1038/s41598-017-02306-x
Drake, J. L., Mass, T., Haramaty, L., Zelzion, E., Bhattacharya, D., and Falkowski, P. G. (2013). Proteomic analysis of skeletal organic matrix from the stony coral Stylophora pistillata. Proc. Natl. Acad. Sci. U.S.A. 110, 3788–3793. doi: 10.1073/pnas.1301419110
Drake, J. L., Schaller, M. F., Mass, T., Godfrey, L., Fu, A., Sherrell, R. M., et al. (2017). Molecular and geochemical perspectives on the influence of CO2 on calcification in coral cell cultures. Limnol. Oceanogr. 63, 107–121. doi: 10.1002/lno.10617
Drenkard, E. J., Cohen, A. L., McCorkle, D. C., de Putron, S. J., Starczak, V. R., and Zicht, A. E. (2013). Calcification by juvenile corals under heterotrophy and elevated CO2. Coral Reefs 32, 727–735. doi: 10.1007/s00338-013-1021-5
Falini, G., Fermani, S., and Goffredo, S. (2015). Coral biomineralization: a focus on intra-skeletal organic matrix and calcification. Semin. Cell Dev. Biol. 46, 17–26. doi: 10.1016/j.semcdb.2015.09.005
Falini, G., Reggi, M., Fermani, S., Sparla, F., Goffredo, S., Dubinsky, Z., et al. (2013). Control of aragonite deposition in colonial corals by intra-skeletal macromolecules. J. Struct. Biol. 183, 226–238. doi: 10.1016/j.jsb.2013.05.001
Gaetani, G. A., and Cohen, A. L. (2006). Element partitioning during precipitation of aragonite from seawater: a framework for understanding paleoproxies. Geochim. Cosmochim. Acta 70, 4617–4634. doi: 10.1016/j.gca.2006.07.008
Gagnon, A. C., Adkins, J. F., and Erez, J. (2012). Seawater transport during coral biomineralization. Earth Planet. Sci. Lett. 329, 150–161. doi: 10.1016/j.epsl.2012.03.005
Gagnon, A. C., Adkins, J. F., Fernandez, D. P., and Robinson, L. F. (2007). Sr/Ca and Mg/Ca vital effects correlated with skeletal architecture in a scleractinian deep-sea coral and the role of Rayleigh fractionation. Earth Planet. Sci. Lett. 261, 280–295. doi: 10.1016/j.epsl.2007.07.013
Gattuso, J.-P., Frankignoulle, M., Bourge, I., Romaine, S., and Buddemeier, R. W. (1998). Effect of calcium carbonate saturation of seawater on coral calcification. Glob. Planet. Change 18, 37–46. doi: 10.1016/S0921-8181(98)00035-6
Golcuk, K., Mandair, G. S., Callender, A. F., Sahar, N., Kohn, D. H., and Morris, M. D. (2006). Is photobleaching necessary for Raman imaging of bone tissue using a green laser? Biochim. Biophys. Acta Biomembr. 1758, 868–873. doi: 10.1016/j.bbamem.2006.02.022
Goldberg, W. M. (2001). Acid polysaccharides in the skeletal matrix and calicoblastic epithelium of the stony coral Mycetophyllia reesi. Tissue Cell 33, 376–387. doi: 10.1054/tice.2001.0191
Hathorne, E. C., Gagnon, A., Felis, T., Adkins, J., Asami, R., Boer, W., et al. (2013). Interlaboratory study for coral Sr/Ca and other element/Ca ratio measurements. Geochem. Geophys. Geosyst. 14, 3730–3750. doi: 10.1002/ggge.20230
Holcomb, M., Cohen, A. L., Gabitov, R. I., and Hutter, J. L. (2009). Compositional and morphological features of aragonite precipitated experimentally from seawater and biogenically by corals. Geochim. Cosmochim. Acta 73, 4166–4179. doi: 10.1016/j.gca.2009.04.015
Holcomb, M., DeCarlo, T. M., Gaetani, G. A., and McCulloch, M. (2016). Factors affecting B/Ca ratios in synthetic aragonite. Chem. Geol. 437, 67–76. doi: 10.1016/j.chemgeo.2016.05.007
Jolivet, A., Bardeau, J.-F., Fablet, R., Paulet, Y.-M., and De Pontual, H. (2008). Understanding otolith biomineralization processes: new insights into microscale spatial distribution of organic and mineral fractions from Raman microspectrometry. Anal. Bioanal. Chem. 392, 551–560. doi: 10.1007/s00216-008-2273-8
Jolivet, A., Fablet, R., Bardeau, J.-F., and de Pontual, H. (2013). Preparation techniques alter the mineral and organic fractions of fish otoliths: insights using Raman micro-spectrometry. Anal. Bioanal. Chem. 405, 4787–4798. doi: 10.1007/s00216-013-6893-2
Knapp, A. N., Sigman, D. M., Lipschultz, F., Kustka, A. B., and Capone, D. G. (2011). Interbasin isotopic correspondence between upper-ocean bulk DON and subsurface nitrate and its implications for marine nitrogen cycling. Global Biogeochem. Cycles 25:GB4004. doi: 10.1029/2010GB003878
Langdon, C., and Atkinson, M. J. (2005). Effect of elevated pCO2 on photosynthesis and calcification of corals and interactions with seasonal change in temperature/irradiance and nutrient enrichment. J. Geophys. Res. 110:C09SC07. doi: 10.1029/2004JC002576
Langdon, C., Broecker, W. S., Hammond, D. E., Glenn, E., Fitzsimmons, K., Nelson, S. G., et al. (2003). Effect of elevated CO 2 on the community metabolism of an experimental coral reef. Glob. Biogeochem. Cycles 17, 1–14. doi: 10.1029/2002GB001941
Li, H., and Estroff, L. A. (2009). Calcite growth in hydrogels: assessing the mechanism of polymer-network incorporation into single crystals. Adv. Mater. 21, 470–473. doi: 10.1002/adma.200801498
Lin-Vien, D., Colthup, N., Fateley, W., and Grasselli, J. (1991). The Handbook of Infrared and Raman Characteristic Frequencies of Organic Molecules. San Diego, CA: Academic Press.
Mass, T., Drake, J. L., Haramaty, L., Kim, J. D., Zelzion, E., Bhattacharya, D., et al. (2013). Cloning and characterization of four novel coral acid-rich proteins that precipitate carbonates in vitro. Curr. Biol. 23, 1126–1131. doi: 10.1016/j.cub.2013.05.007
Mass, T., Giuffre, A. J., Sun, C.-Y., Stifler, C. A., Frazier, M. J., Neder, M., et al. (2017). Amorphous calcium carbonate particles form coral skeletons. Proc. Natl. Acad. Sci. U.S.A. 114:201707890. doi: 10.1073/pnas.1707890114
McConnaughey, T. (1989). 13C and 18O isotopic disequilibrium in biological carbonates: I. Patterns. Geochim. Cosmochim. Acta 53, 151–162. doi: 10.1016/0016-7037(89)90282-2
McConnaughey, T. A., and Whelan, J. F. (1997). Calcification generates protons for nutrient and bicarbonate uptake. Earth Sci. Rev. 42, 95–117. doi: 10.1016/S0012-8252(96)00036-0
McCulloch, M. T., D'Olivo Cordero, J. P., Falter, J., Holcomb, M., and Trotter, J. A. (2017). Coral calcification in a changing world: the interactive dynamics of pH and DIC up-regulation. Nat. Commun. 8:15686. doi: 10.1038/ncomms15686
McCulloch, M. T., Falter, J., Trotter, J., and Montagna, P. (2012). Coral resilience to ocean acidification and global warming through pH up-regulation. Nat. Clim. Chang. 2, 623–627. doi: 10.1038/nclimate1473
Nasdala, L., Wenzel, M., Vavra, G., Irmer, G., Wenzel, T., and Kober, B. (2001). Metamictisation of natural zircon: accumulation versus thermal annealing of radioactivity-induced damage. Contr. Mineral. Petrol. 141, 125–144. doi: 10.1007/s004100000235
Nehrke, G., Nouet, J., and Treude, T. (2011). Confocal Raman microscope mapping as a tool to describe different mineral and organic phases at high spatial resolution within marine biogenic carbonates: case study on Nerita undata (Gastropoda, Neritopsina). Biogeosciences 8, 3761–3769. doi: 10.5194/bg-8-3761-2011
Nguyen, T. N., Nguyen, V. D., Jung, S., and Yi, J. (2009). Raman scattering analysis of the residual stress in metal-induced crystallized amorphous silicon thin films using nickel. Appl. Surf. Sci. 255, 8252–8256. doi: 10.1016/j.apsusc.2009.05.087
Okai, T., Suzuki, A., Kawahata, H., Terashima, S., and Imai, N. (2002). Preparation of a new geological survey of Japan geochemical reference material: coral JCp-1. Geostand. Newsl. 26, 95–99. doi: 10.1111/j.1751-908X.2002.tb00627.x
Onogi, C., and Hamaguchi, H. (2009). Photobleaching of the “Raman spectroscopic signature of life” and mitochondrial activity in rho– budding yeast cells. J. Phys. Chem. B 113, 10942–10945. doi: 10.1021/jp903478r
Pauly, M., Kamenos, N. A., Donohue, P., and LeDrew, E. (2015). Coralline algal Mg-O bond strength as a marine pCO2 proxy. Geology 43, 267–270. doi: 10.1130/G36386.1
Perrin, C., and Smith, D. C. (2007). Earliest steps of diagenesis in living scleractinian corals: evidence from ultrastructural pattern and Raman spectroscopy. J. Sediment. Res. 77, 495–507. doi: 10.2110/jsr.2007.051
Pokroy, B., Demensky, V., and Zolotoyabko, E. (2009). Nacre in mollusk shells as a multilayered structure with strain gradient. Adv. Funct. Mater. 19, 1054–1059. doi: 10.1002/adfm.200801201
Pokroy, B., Fitch, A. N., Lee, P. L., Quintana, J. P., Caspi, E. N., and Zolotoyabko, E. (2006a). Anisotropic lattice distortions in the mollusk-made aragonite: a widespread phenomenon. J. Struct. Biol. 153, 145–150. doi: 10.1016/j.jsb.2005.10.009
Pokroy, B., Fitch, A. N., Marin, F., Kapon, M., Adir, N., and Zolotoyabko, E. (2006b). Anisotropic lattice distortions in biogenic calcite induced by intra-crystalline organic molecules. J. Struct. Biol. 155, 96–103. doi: 10.1016/j.jsb.2006.03.008
Pokroy, B., Quintana, J. P., Caspi, E. N., Berner, A., and Zolotoyabko, E. (2004). Anisotropic lattice distortions in biogenic aragonite. Nat. Mater. 3, 900–902. doi: 10.1038/nmat1263
Reggi, M., Fermani, S., Landi, V., Sparla, F., Caroselli, E., Gizzi, F., et al. (2014). Biomineralization in Mediterranean corals: the role of the intraskeletal organic matrix. Cryst. Growth Des. 14, 4310–4320. doi: 10.1021/cg5003572
Ren, H., Chen, Y.-C., Wang, X. T., Wong, G. T. F., Cohen, A. L., DeCarlo, T. M., et al. (2017). 21st-century rise in anthropogenic nitrogen deposition on a remote coral reef. Science 356, 749–752. doi: 10.1126/science.aal3869
Shea, D. A., and Morris, M. D. (2002). Bone tissue fluorescence reduction for visible laser Raman spectroscopy. Appl. Spectrosc. 56, 182–186. doi: 10.1366/0003702021954647
Sigman, D. M., Casciotti, K. L., Andreani, M., Barford, C., Galanter, M., and Böhlke, J. K. (2001). A bacterial method for the nitrogen isotopic analysis of nitrate in seawater and freshwater. Anal. Chem. 73, 4145–4153. doi: 10.1021/ac010088e
Stolarski, J., Przeniosło, R., Mazur, M., and Brunelli, M. (2007). High-resolution synchrotron radiation studies on natural and thermally annealed scleractinian coral biominerals. J. Appl. Crystallogr. 40, 2–9. doi: 10.1107/S002188980604489X
Takeuchi, T., Yamada, L., Shinzato, C., Sawada, H., and Satoh, N. (2016). Stepwise evolution of coral biomineralization revealed with genome-wide proteomics and transcriptomics. PLoS ONE11:e0156424. doi: 10.1371/journal.pone.0156424
Tambutté, S., Holcomb, M., Ferrier-Pagès, C., Reynaud, S., Tambutté, É., Zoccola, D., et al. (2011). Coral biomineralization: from the gene to the environment. J. Exp. Mar. Biol. Ecol. 408, 58–78. doi: 10.1016/j.jembe.2011.07.026
Thompson, C. M., North, E. W., Kennedy, V. S., and White, S. N. (2015). Classifying bivalve larvae using shell pigments identified by Raman spectroscopy. Anal. Bioanal. Chem. 407, 3591–3604. doi: 10.1007/s00216-015-8575-8
Trotter, J., Montagna, P., McCulloch, M., Silenzi, S., Reynaud, S., Mortimer, G., et al. (2011). Quantifying the pH “vital effect” in the temperate zooxanthellate coral Cladocora caespitosa: validation of the boron seawater pH proxy. Earth Planet. Sci. Lett. 303, 163–173. doi: 10.1016/j.epsl.2011.01.030
Urmos, J., Sharma, S. K., and Mackenzie, F. T. (1991). Characterization of some biogenic carbonates with Raman spectroscopy. Am. Mineral. 76, 641–646.
van de Locht, R., Verch, A., Saunders, M., Dissard, D., Rixen, T., Moya, A., et al. (2013). Microstructural evolution and nanoscale crystallography in scleractinian coral spherulites. J. Struct. Biol. 183, 57–65. doi: 10.1016/j.jsb.2013.05.005
Venn, A. A., Tambutté, E., Holcomb, M., Laurent, J., Allemand, D., and Tambutté, S. (2013). Impact of seawater acidification on pH at the tissue-skeleton interface and calcification in reef corals. Proc. Natl. Acad. Sci. U.S.A. 110, 1634–1639. doi: 10.1073/pnas.1216153110
Von Euw, S., Zhang, Q., Manichev, V., Murali, N., Gross, J., Feldman, L. C., et al. (2017). Biological control of aragonite formation in stony corals. Science 356, 933–938. doi: 10.1126/science.aam6371
Wall, M., and Nehrke, G. (2012). Reconstructing skeletal fiber arrangement and growth mode in the coral Porites lutea (Cnidaria, Scleractinia): a confocal Raman microscopy study. Biogeosciences 9, 4885–4895. doi: 10.5194/bg-9-4885-2012
Wang, D., Hamm, L. M., Bodnar, R. J., and Dove, P. M. (2012). Raman spectroscopic characterization of the magnesium content in amorphous calcium carbonates. J. Raman Spectrosc. 43, 543–548. doi: 10.1002/jrs.3057
Wang, X. T., Sigman, D. M., Cohen, A. L., Sinclair, D. J., Sherrell, R. M., Weigand, M. A., et al. (2015). Isotopic composition of skeleton-bound organic nitrogen in reef-building symbiotic corals: a new method and proxy evaluation at Bermuda. Geochim. Cosmochim. Acta 148, 179–190. doi: 10.1016/j.gca.2014.09.017
Weiner, S., and Addadi, L. (1991). Acidic macromolecules of mineralized tissues: the controllers of crystal formation. Trends Biochem. Sci. 16, 252–256. doi: 10.1016/0968-0004(91)90098-G
Zhou, G.-T., Yao, Q.-Z., Ni, J., and Jin, G. (2009). Formation of aragonite mesocrystals and implication for biomineralization. Am. Mineral. 94, 293–302. doi: 10.2138/am.2009.2957
Zolotoyabko, E. (2017). Anisotropic lattice distortions in biogenic minerals originated from strong atomic interactions at organic/inorganic interfaces. Adv. Mater. Interfaces 4:1600189. doi: 10.1002/admi.201600189
Keywords: coral, calcification, organics, Raman spectroscopy, ocean acidification
Citation: DeCarlo TM, Ren H and Farfan GA (2018) The Origin and Role of Organic Matrix in Coral Calcification: Insights From Comparing Coral Skeleton and Abiogenic Aragonite. Front. Mar. Sci. 5:170. doi: 10.3389/fmars.2018.00170
Received: 26 September 2017; Accepted: 30 April 2018;
Published: 15 May 2018.
Edited by:
Jessica Carilli, University of Massachusetts Boston, United StatesReviewed by:
Alexander Gagnon, University of Washington, United StatesNick Kamenos, University of Glasgow, United Kingdom
Copyright © 2018 DeCarlo, Ren and Farfan. This is an open-access article distributed under the terms of the Creative Commons Attribution License (CC BY). The use, distribution or reproduction in other forums is permitted, provided the original author(s) and the copyright owner are credited and that the original publication in this journal is cited, in accordance with accepted academic practice. No use, distribution or reproduction is permitted which does not comply with these terms.
*Correspondence: Thomas M. DeCarlo, thomas.decarlo@uwa.edu.au