Mineralogy of Deep-Sea Coral Aragonites as a Function of Aragonite Saturation State
 Gabriela A. Farfan
 Erik E. Cordes
 Rhian G. Waller
 Thomas M. DeCarlo
 Colleen M. Hansel
- 1MIT-WHOI Joint Program in Oceanography/Applied Ocean Science & Engineering, Woods Hole Oceanographic Institution, Woods Hole, MA, United States
- 2Department of Marine Chemistry & Geochemistry, Woods Hole Oceanographic Institution, Woods Hole, MA, United States
- 3Department of Biology, Temple University, Philadelphia, PA, United States
- 4Darling Marine Center, The University of Maine, Walpole, ME, United States
- 5Oceans Institute, School of Earth Sciences, The University of Western Australia, Crawley, WA, Australia
- 6ARC Centre of Excellence for Coral Reef Studies, The University of Western Australia, Crawley, WA, Australia
In an ocean with rapidly changing chemistry, studies have assessed coral skeletal health under projected ocean acidification (OA) scenarios by characterizing morphological distortions in skeletal architecture and measuring bulk properties, such as net calcification and dissolution. Few studies offer more detailed information on skeletal mineralogy. Since aragonite crystallography will at least partially govern the material properties of coral skeletons, such as solubility and strength, it is important to understand how it is influenced by environmental stressors. Here, we take a mineralogical approach using micro X-ray diffraction (XRD) and whole pattern Rietveld refinement analysis to track crystallographic shifts in deep-sea coral Lophelia pertusa samples collected along a natural seawater aragonite saturation state gradient (Ωsw = 1.15–1.44) in the Gulf of Mexico. Our results reveal statistically significant linear relationships between rising Ωsw and increasing unit cell volume driven by an anisotropic lengthening along the b-axis. These structural changes are similarly observed in synthetic aragonites precipitated under various saturation states, indicating that these changes are inherent to the crystallography of aragonite. Increased crystallographic disorder via widening of the full width at half maximum of the main (111) XRD peaks trend with increased Ba substitutions for Ca, however, trace substitutions by Ba, Sr, and Mg do not trend with crystal lattice parameters in our samples. Instead, we observe a significant trend of increasing calcite content as a function of both decreasing unit cell parameters as well as decreasing Ωsw. This may make calcite incorporation an important factor to consider in coral crystallography, especially under varying aragonite saturation states (ΩAr). Finally, by defining crystallography-based linear relationships between ΩAr of synthetic aragonite analogs and lattice parameters, we predict internal calcifying fluid saturation state (Ωcf = 11.1–17.3 calculated from b-axis lengths; 15.2–25.2 calculated from unit cell volumes) for L. pertusa, which may allow this species to calcify despite the local seawater conditions. This study will ideally pave the way for future studies to utilize quantitative XRD in exploring the impact of physical and chemical stressors on biominerals.
Introduction
Increased fluxes of anthropogenic carbon dioxide into the atmosphere are rapidly absorbed into the world’s oceans and are predicted to lower the pH of the ocean by 0.3–0.5 units over the next century (Doney et al., 2009) in a process referred to as ocean acidification (OA). The oceanic carbonate system reacts to lower pH by decreasing carbonate ion (CO32-) concentrations in favor of bicarbonate ions (HCO3-). Carbonate ions are required building blocks for calcium carbonate (CaCO3) minerals, such as polymorphs aragonite and calcite, formed by biomineralizing organisms. At depth in the ocean, the concentration of carbonate ions can fall below levels that are thermodynamically viable to form calcium carbonate minerals. For aragonite, this depth at which the aragonite saturation state (ΩAr) falls below 1 and aragonite dissolution is favored is referred to as the aragonite saturation horizon (ASH). The ASH has already shoaled over past centuries by 80–150 m in the North Atlantic Ocean (Chung et al., 2003; Feely et al., 2004), 50-100 m in the North Pacific Ocean (Feely et al., 2008) and 100-200 m in the Indian Ocean (Sabine et al., 2002), and is projected to continue rising. In addition to a rising ASH, carbonate minerals also become more soluble under colder, higher pressure environments, making them even more vulnerable to dissolution in the deep ocean (Mucci, 1983; Acker et al., 1987). In recent years, deep-sea coral studies have established baselines for aragonite saturation states and pH values in environments where deep-sea corals exist, in order to specifically track future effects of OA on the health of deep-sea coral ecosystems (Thresher et al., 2011; Lunden et al., 2013; Georgian et al., 2016a).
Deep-sea corals that live near or below shoaling ASHs are expected to be the first biomineralizing organisms to experience negative net calcification of their skeletons due to decreasing calcification rates and dissolution of existing skeletal structures (Hofmann et al., 2010; Lunden et al., 2013). The preservation of deep-sea corals, and the deep-sea coral ecosystems that they form, is essential for the health of deep-sea ecology and biodiversity, as well as for the economically important fish and invertebrates that they sustain (Roberts et al., 2009).
Field and incubation studies of deep-sea corals under OA conditions reveal that corals can still calcify near or below the ASH with conflicting results about whether or not these coral ecosystems are at risk of death and extensive net dissolution with projected ASH shoaling (Rodolfo-Metalpa et al., 2015). Long-term variable aragonite saturation, pH and pCO2 incubation studies (∼6 months) also present conflicting results, but overall suggest that deep-sea corals are capable of acclimating to undersaturated/low pH conditions and continue to calcify, but at slower rates resulting in net dissolution of skeletons (Form and Riebesell, 2012; Maier et al., 2013; Hennige et al., 2015; Kurman et al., 2017). Field studies of deep-sea corals living near or below ASHs show no correlations between pH and skeletal densities or changes in mineral phases with depth (Thresher et al., 2011; Lunden et al., 2013). In contrast, shallow corals are known to form more porous and fragile skeletons with higher organic carbon contents in aragonite undersaturated conditions (Tambutté et al., 2015). Georgian et al. (2016a) suggest that this resilience by live deep-sea corals may be at least partially due to the dissolution of surrounding mounds of dead corals that may increase local saturation states, as evidenced by significantly higher total alkalinity values near coral mounds. Previous studies of sustained calcification under OA conditions proposed that corals may compensate for aragonite undersaturation and the high energy cost of calcification (∼30% of energy budget) (Allemand et al., 2011) by manipulating their internal calcifying fluid and raising the pH ∼0.3–0.6 units (McCulloch et al., 2012a; Allison et al., 2014) or by increasing heterotrophic feeding (Cohen and Holcomb, 2009; Drenkard et al., 2013; Schoepf et al., 2013; Georgian et al., 2016b). Apart from geochemical explanations for how coral calcification may compensate for aragonite undersaturated conditions, others have proposed that coral biomineralization may not be as susceptible to changes from OA as predicted by geochemical models. This argument is based primarily on the idea that coral aragonite is formed via an amorphous calcium carbonate (ACC) precursor phase (Mass et al., 2017; Von Euw et al., 2017) that is predominantly driven by proteins such as coral acid-rich proteins (CARPs) (Mass et al., 2013) or a skeletal organic matrix (Tambutté et al., 2011) that can precipitate aragonite regardless of surrounding seawater aragonite saturation states. Yet, the notion that calcification is entirely controlled by organic matrices regardless of seawater chemistry is not supported by observations that abiogenic aragonites precipitated from seawater contain similar amounts of organics as coral skeletons (DeCarlo et al., 2018), and it is inconsistent with many coral culturing experiments (Chan and Connolly, 2013).
Mineralogical approaches for understanding the effects of OA on coral skeletons are rare compared to studies of calcification rates and bulk skeletal properties, like density and mineral morphology. Juvenile shallow-water corals grown in aragonite undersaturated conditions exhibit morphological shifts to smaller, deformed skeletal architecture with blocky versus acicular crystallites (Cohen et al., 2009; Foster et al., 2016). Distinct abnormal mineralogical morphologies of shorter, cross-hatched crystallites are also observed in solitary micrabaciid scleractinian deep-sea corals accustomed to growing in undersaturated waters (Janiszewska et al., 2011). However, no X-ray crystallographic studies have been performed on possible crystallographic distortions that mirror skeletal morphology differences driven by aragonite undersaturated conditions. The most in-depth crystallographic studies on biogenic aragonites are comparisons of biogenic aragonite (mollusk, coral) to geologically-formed aragonite which observe distinct anisotropic lattice distortions (a- and c-axis extensions, b-axis shrinkage) via X-ray diffraction (XRD) in biogenic aragonite (Pokroy et al., 2007). Raman spectroscopy has also recently been used to monitor carbonate vibrational modes in aragonite as a way to observe shifts in the bonding environments of synthetic aragonite coral analogs under varying aragonite saturation (DeCarlo et al., 2017).
The material properties of minerals, such as solubility and strength, are directly linked to their crystal structure. Thus, in addition to other parameters typically recorded in coral ocean acidification studies, such as skeletal morphology and calcification rates, coral skeletal health will likely be dependent on aragonite crystallography. For instance, Hennige et al. (2015) recently observed that incubated deep-sea corals acclimatized to grow in increased pCO2 and temperature conditions, but displayed hidden changes in their crystal organization and aragonite bonding environments, which may weaken overall skeletal health, compromise long-term survival and increase reef solubility upon coral death. The goal of this study is to assess if there are detectable changes to the aragonite crystal structure of natural deep-sea corals as a function of surrounding seawater aragonite saturation state (Ωsw), pH, and other chemical variables, which would ultimately influence the integrity and health of the coral. To do so, we compare the crystal lattice parameters of Lophelia pertusa grown under a modest range of natural seawater aragonite saturation states (1.15–1.44 Ωsw) in the Gulf of Mexico, as well as a suite of other deep-sea coral species from various localities. Despite not having direct measurements of the internal calcifying fluid aragonite saturation states (Ωcf), we show that this crystallographic approach is useful in quantitatively assessing the effects of surrounding seawater environments on corals and may be applicable to other biomineralizing systems.
Materials and Methods
Samples
Natural Deep-Sea Corals
Lophelia pertusa colonies (n = 5) were collected from the Northern Gulf of Mexico by HOV Alvin in May 2014 and represent corals growing in a natural gradient of aragonite saturation (Ωsw = 1.15–1.44) described in detail by Lunden et al. (2013) and Georgian et al. (2016a) (Supplementary Figure S1). Samples were collected in “live,” “recently dead,” and “dead” states. An additional L. pertusa sample was collected in the Pacific Ocean from the Southern California Bight (SCB) between April and May 2015 (33°55′7.6794′′N; 119°28′18.84′′W) at ∼300 m depth in aragonite undersaturated waters (Ωsw = 0.81, pH = 7.66). In order to place the mineralogy of the L. pertusa samples in the context of worldwide deep-sea corals of different species and environments, solitary deep-sea coral samples were collected from Antarctic waters (Burdwood Bank, sample NBP08-05, and the Western Antarctic Peninsula Shelf samples NBP09-02 and LMG15-09) as well as a colonial coral from North-West Atlantic waters (Kükenthal Peak, sample KUK220-1). All samples used in this study are presented in Table 1.
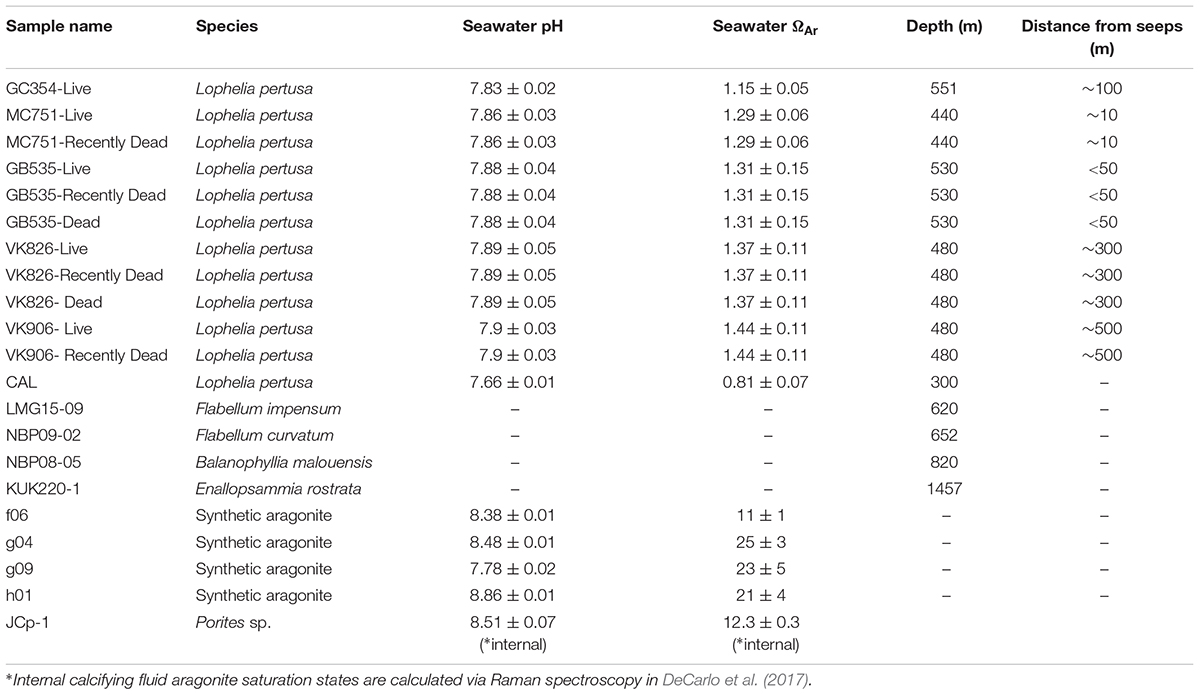
Table 1. Corals, synthetic aragonites, and aragonite reference samples analyzed in this study.
Synthetic Aragonites
A suite of synthetic aragonites (f06, g04, g09, and h01) precipitated from seawater at controlled aragonite saturation states and pH were used for comparison to the corals. These synthetic aragonites were precipitated from seawater at 25°C with carbonate chemistry modified by NaHCO3 and Na2CO3 solutions, which were added to the seawater during precipitation to maintain stable pH and [CO32-]. For detailed methods and previous Raman spectroscopy and trace metal analysis measurements of these samples, see DeCarlo et al. (2015) and Holcomb et al. (2016).
Coral Skeleton Sampling and Removal of Organics
In order to sample consistently across different coral polyps, genotypes and species, outermost tips (1–3 mm) of coral septa were sampled and gently powdered using an agate mortar and pestle. For the L. pertusa samples from the Gulf of Mexico, 1–2 mm of skeleton from the outer polyp areas were also sampled to compare to septa samples. Coral powders were bleached to remove any excess tissue or potential crystal scaffolding organic material using a procedure modified from Gaffey and Bronnimann (1993) and Politi et al. (2006): (1) Powdered coral samples (approximately 1-2 mg) were placed in 0.5 mL microcentrifuge tubes, (2) 20 μL of 5% free chlorine sodium hypochlorite (ACROS) was added, (3) Tubes were vortexed four times to ensure that all powder surfaces were exposed to the bleach. The powders sat in the bleach for a total of 45 min. (4) Powders were thoroughly rinsed six times to remove any bleach residues by adding 200 μL of MilliQ water, vortexing, allowing powder to settle, centrifuging, and carefully removing supernatant water. (5) Samples were air-dried before being run on X-ray instruments.
Instrumentation and Analysis
X-Ray Diffraction
Powder X-ray diffraction was conducted on a Rigaku D/MAX Rapid II micro X-ray diffractometer with a 2D imaging plate detector at the Hansel Lab, Woods Hole Oceanographic Institution using Mo Kα radiation (λ = 0.709300 Å). Samples were carefully aligned and run for 10 min with omega fixed at 0 and phi rotating at 1 degree per second. Four sample replicates were run for each sample.
All samples were gently re-ground in an agate mortar and pestle to achieve an even smaller powder grain size, to keep methods consistent between coral and non-coral samples, and to confirm that we were not inducing phase transformations by using a mortar and pestle. Our natural and synthetic aragonites showed the same results pre- and post- grinding. Powders were mounted on Kapton tips by MiTeGen by using a very thin layer of mineral oil on the tips. A subset of samples were also loaded into 0.8 mm Kapton capillaries and compared to results from Kapton tips to assure that results did not vary due to sample mounting methods.
X-ray diffraction image files were background corrected (manual setting = 5) and integrated into intensity versus 2θ patterns from 3.0 to 45.0 2θ degrees and 81.6337 to 430.00 β using 2DP software.
Full width at half maximum (FWHM) measurements were performed on the main (111) peak of the coral aragonite diffraction pattern using PDXL 2 Rigaku software by referencing Caspi et al. (2005) for aragonite and Swanson and Fuyat (1953) for calcite.
Rietveld Analysis and Statistics
The GSASII program (Toby and Von Dreele, 2013) was used to perform the quantitative full-pattern Rietveld refinement fitting method as described by Bish and Post (1993) from 8 to 44 2θ degrees using a Chebyshev polynomial background and aragonite (Antao and Hassan, 2009) and calcite (Markgaf and Reeder, 1985) model structures.
A synthetic aragonite reference was used for calibration and refinement of the numbers obtained in Rietveld analysis in response to the specific alignment of the XRD. All Rietveld results are shifted by: a-axis = -0.003375 Å, b-axis = -0.012724 Å, c-axis = -0.005675 Å, and volume = -0.7435 Å3, leading to corresponding results between the XRD instrument in the Hansel lab at the Woods Hole Oceanographic Institution and an equivalent instrument in the Department of Mineral Sciences, Smithsonian Institution. Since shifts were applied to all samples, the shifts did not affect the relative differences between samples. Errors in Rietveld refinements are represented as estimated standard deviations and exceed standard deviations between sample replicates.
Principal component analysis (PCA) was run on all variables for live septa samples from the Gulf of Mexico corals. PCA biplots revealed correlations between variables by noting which variable vectors exist close to 0 and 180° angles to each other. Based on the relationships identified in the PCA analysis, regression analyses were run on the crystal lattice parameters and calcite contents resulting from Rietveld analyses versus environmental growth conditions (seawater pH, aragonite saturation state, depth) and element trace-incorporations (Ba, Sr, and Mg). Trend lines were plotted for relationships which are statistically significant (p < 0.05). Unequal variance T-tests were run on crystallographic lattice parameters to determine any significant differences between populations based on locality (Gulf of Mexico versus other localities) and sampling area of the coral (septa versus outer polyp). One-way ANOVA tests were used to compare state of collection for L. Pertusa from the Gulf of Mexico (live, recently dead and dead). Levene’s tests were used to test homogeneity of variances and Kolmogorov–Smirnov tests were utilized to confirm normality of residuals.
Inductively-Coupled Mass Spectroscopy (ICP-MS)
Trace metal concentrations of a subset of natural L. pertusa samples were measured using an iCAP ICP-MS at the Woods Hole Oceanographic Institution. Samples were bleached and rinsed using methods in the “Coral sampling and removal of organics” section above. Dried samples were weighed and digested with concentrated trace metal grade nitric acid (J.T.Baker ULTREX® II Ultrapure Reagent) in trace metal-cleaned 15 mL Falcon centrifuge tubes and diluted using Milli-Q water for ICP-MS analysis. To account for matrix effects, trace element to Ca ratios for the corals in this study were calculated based on known ratios in the JCp-1 reference Porites sp. coral (Hathorne et al., 2013) that was also measured with ICP-MS alongside the samples in this study.
Environmental Scanning Electron Microscopy (ESEM)
We utilized a Hitachi TM3000 environmental table-top scanning electron microscope (SEM) at the Woods Hole Oceanographic Institution to assess the morphologies of the Gulf of Mexico L. pertusa corals over the range of aragonite saturation states measured in this study. Thin sections were cut parallel to the growth direction of the polyps and included regions of septa and outer polyps. All thin-sections were made by High Mesa Petrographics. Photographs were also taken of hand samples prior to sectioning.
Results
Structural Characterization via X-Ray Diffraction
X-ray diffraction (XRD) patterns (Figure 1) analyzed via Rietveld refinements confirm that all corals measured are composed of aragonite containing only minor traces of calcite [presence of visible main calcite (104) peaks highlighted with black arrows]. Unit cell parameters of live deep-sea corals determined by Rietveld refinements are plotted in order in Figure 2 as averages of four replicates per sample. Two-tailed T-tests on these samples demonstrate that there are no statistically significant differences in crystal lattice parameters between septa and outer polyp regions of the skeletons of L. pertusa samples from a natural Ωsw gradient in the Gulf of Mexico or between the septa of L. pertusa from the Gulf of Mexico versus septa of other deep-sea coral species and localities (Supplementary Table S1). One-way ANOVA of L. pertusa samples collected in live, recently dead, and dead states from the Gulf of Mexico reveal that unit cell volumes and c-axis lengths vary significantly between these three collection states (Supplementary Table S1). A- and b-axis lengths are not statistically distinct across the different collection states as indicated by a p > 0.05, or failure to pass Levene’s test of variance.
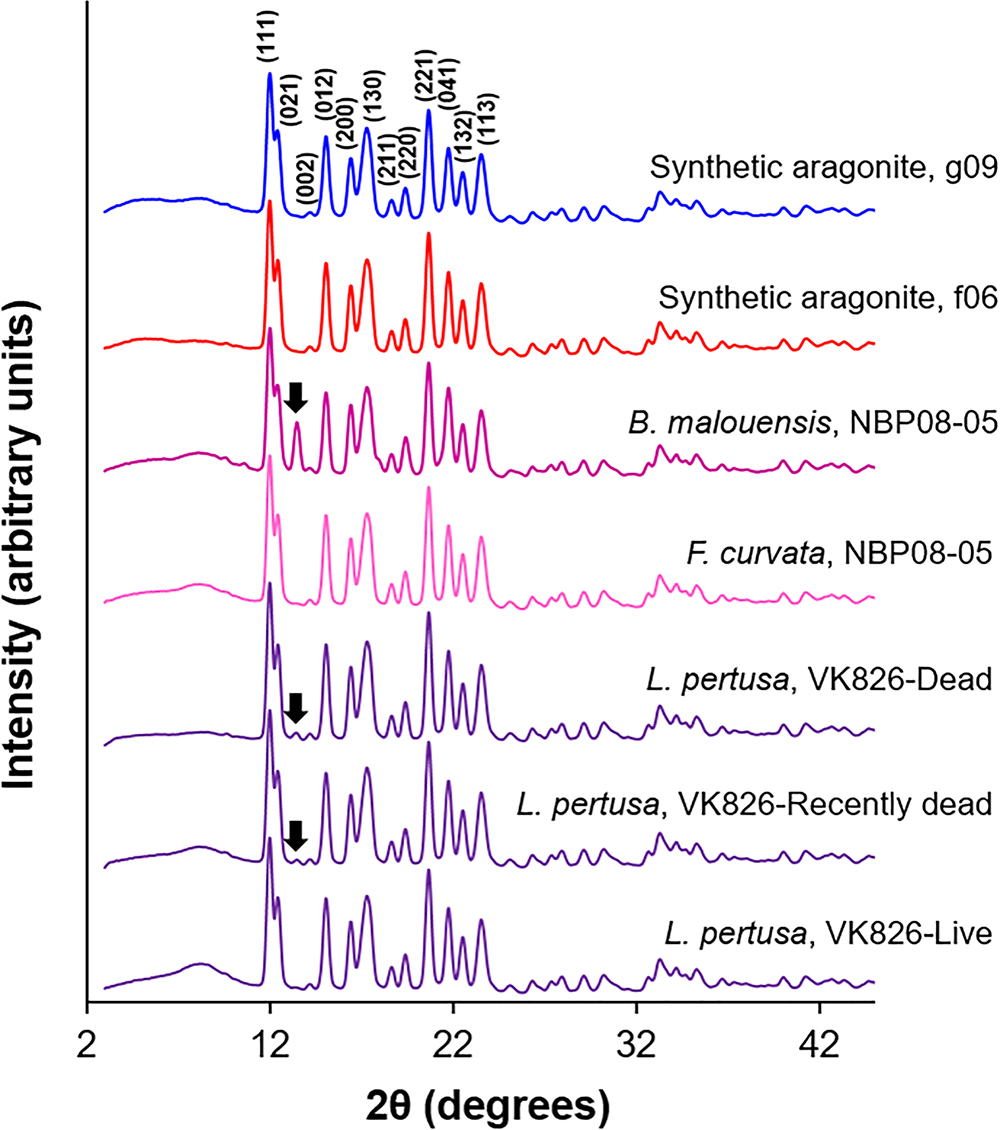
Figure 1. Representative XRD patterns of deep-sea corals and synthetic aragonites using Mo Kα radiation (λ = 0.709300 Å). Miller indices are labeled on the g09 synthetic aragonite pattern and all patterns are normalized to the (111) peak heights. Calcite contributions are highlighted with black arrows on certain samples.
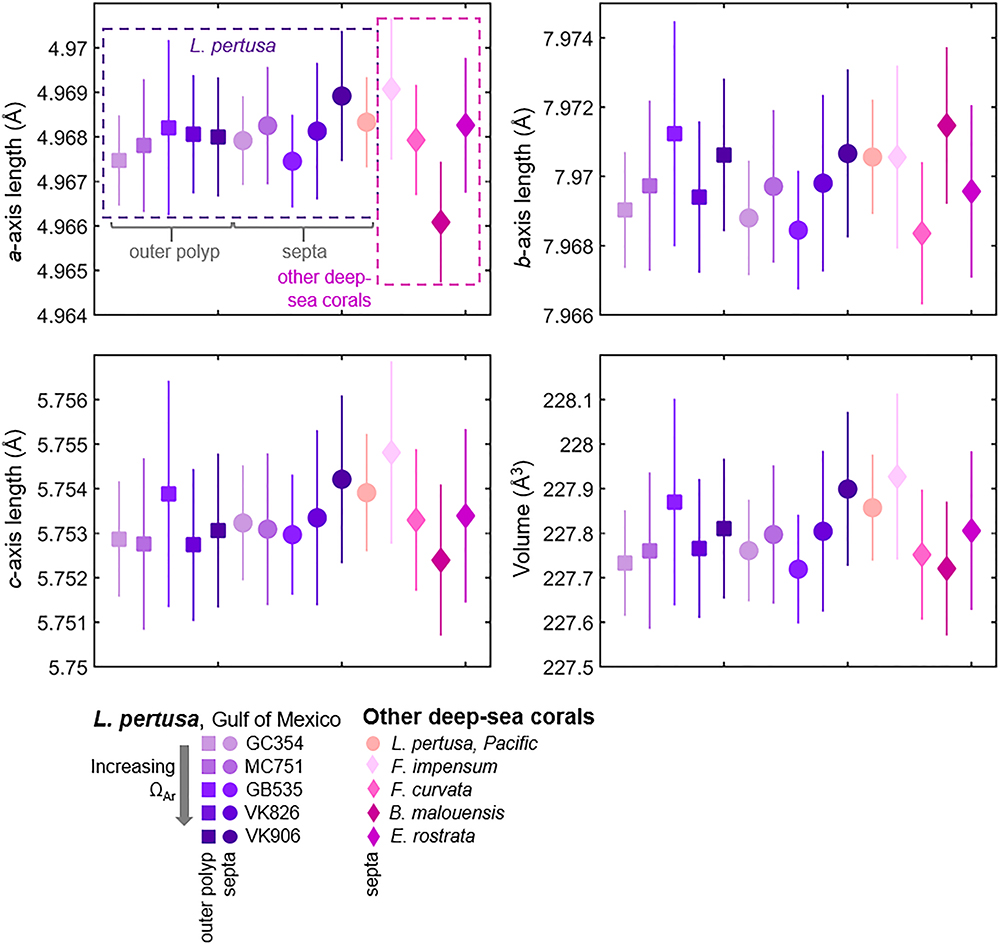
Figure 2. Crystallographic lattice parameters of Lophelia pertusa aragonites from the Gulf of Mexico, compared to other species and localities of deep-sea corals. Samples are taken from the area outside of the polyps (squares) and from septa (circles and diamonds). Each point is an average of four replicates. Error bars represent estimated standard deviations.
Since we are interested in learning how coral crystallography and mineralogy shift as a function of environmental parameters and a series of nested variables, here we use multivariate statistics to unravel the relative impact of the variables measured in this study. Focusing on the septa samples of live L. pertusa from the Gulf of Mexico, PCA of samples (violet circles) as they are influenced by all variables (solid vectors) are plotted as a biplot of principal component (PC) 1 versus PC2 (Figure 3). Together, these principal components account for 76.6% of the variability between samples. In this biplot, vectors that lie at close to 0 or 180 angles to each other represent variables that are correlated and perhaps linked. As expected, vectors for unit cell volume and individual unit cell axes (represented as blue lines) lie at narrow angles to one another, since they are intrinsically linked. The only environmental variable that plots close to these crystallographic parameters is the distance from hydrocarbon seeps where the coral colonies were collected from. The crystallographic parameter vectors lie almost perpendicular to the other environmental variables (Ωsw, pHsw and depth, represented as bold red lines) (Figure 3). Thus, we expect these environmental variables to have a minimal impact on coral aragonite crystallography. To confirm these relationships, we ran simple regressions of unit cell volume and some of these environmental variables (Figure 4A). Statistically significant relationships are plotted in black solid trend lines. While the PCA biplot does not show a clear relationship between unit cell volume and Ωsw or pHsw, we observe a weak, yet statistically significant, pattern of larger unit cell volume as a function of increasing Ωsw. As expected from the close PCA biplot relationship between lattice parameters and distance from hydrocarbon seeps, we do observe a stronger relationship of increasing unit cell volume with increasing distance from hydrocarbon seeps (Figure 4A).
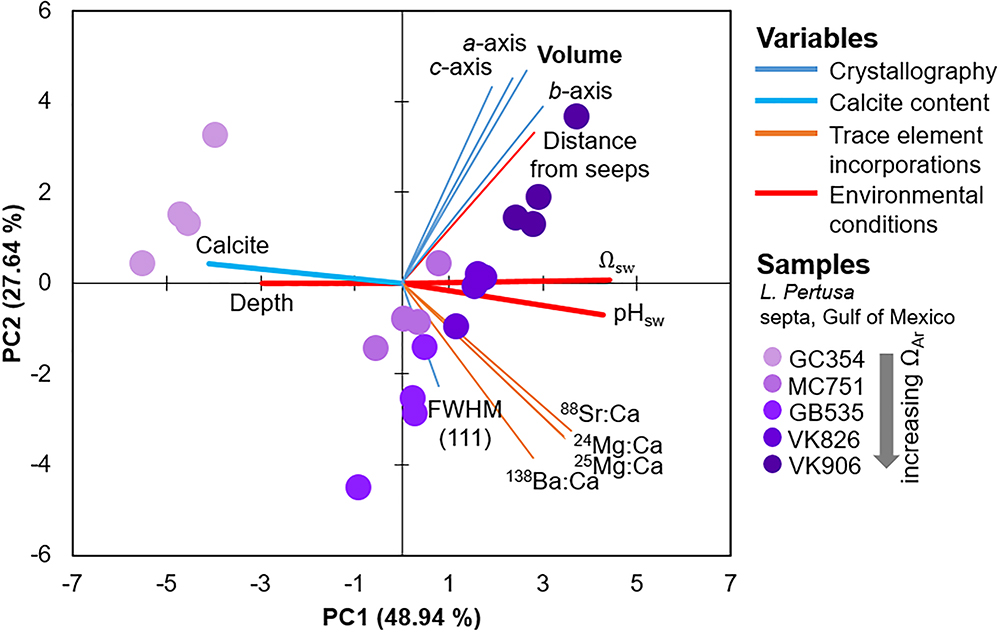
Figure 3. Principal component analysis (PCA) biplot of component 1 versus 2 which accounts for 75% of the variability between samples of L. pertusa septa from the Gulf of Mexico (purple circles). All of the variables measured in this study are expressed as vectors in solid lines.
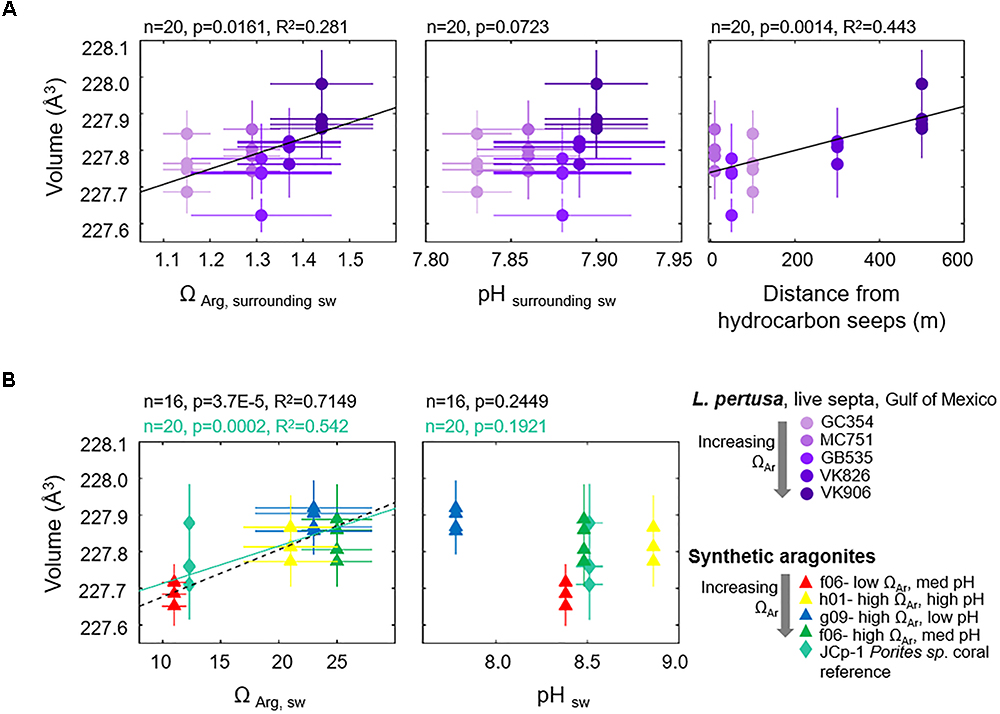
Figure 4. Unit cell volumes of aragonite as a function of environmental variables for (A) Gulf of Mexico L. pertusa live septa samples (violet circles) versus surrounding seawater chemistry at colony collection sites, and (B) synthetic aragonites precipitated from seawater versus seawater formation chemistry (triangles, black dashed trend line). A JCp-1 reference coral with known internal calcifying fluid chemistry is also added (mint-green diamonds, solid trend line) as a comparison to synthetic aragonites.
As a comparison to coral aragonites, we plot the relationships between unit cell volume and formation conditions for synthetic aragonites precipitated from seawater with discrete aragonite-supersaturation and pH conditions (Figure 4B, triangles). Unit cell volumes increase as a function of increasing Ωsw (black dashed line). We observe the same statistically significant pattern when we add a natural coral sample (JCp-1, mint-green diamonds) with a known internal calcifying fluid chemistry (mint-green solid line) (DeCarlo et al., 2017). No statistically significant pattern is observed for unit cell volume as a function of pH of formation. Trends for individual unit cell axes and the FWHM of XRD (111) peaks as a function of ΩAr and pH for both corals and synthetic aragonites are plotted in the Supplementary Figures S2, S3. Supplementary Table S2 in the Supplementary Materials lists values for p, R2, and trendline slopes and y-intercepts for all simple regressions run in this study. All error bars in our crystallography versus environmental parameters plots represent estimated standard deviations from our Rietveld refinement measurements. Due to the large standard deviations in some of our relationships, we have also run York regressions on some of the relationships to account for errors along both axes (York, 1968). York regression trendlines are listed in Supplementary Table S2 and demonstrate that the slopes of York regressions do not vary drastically from our simple regressions.
Calcite Contents in Deep Sea Corals
Calcite contents (phase percentages) determined by Rietveld refinements reveal that live coral septa and synthetic aragonites contain very low calcite contents (<1%), with the exception of Balanophyllia malouensis that has a large calcite peak (8.9% phase contribution) (Figure 1 and Supplementary Table S3). Within L. pertusa septa samples from the Gulf of Mexico, recently dead (yellow sideways triangles) and dead (red inverted triangles) samples stand out as having the highest phase fractions of calcite (∼1–3%) compared to samples collected in live states (green circles), especially as a function of increasing depth of collection (Figure 5). All other trends with calcite content are plotted in the Supplementary Figure S4A for all three collection states and in Supplementary Figure S4B for only live coral samples.
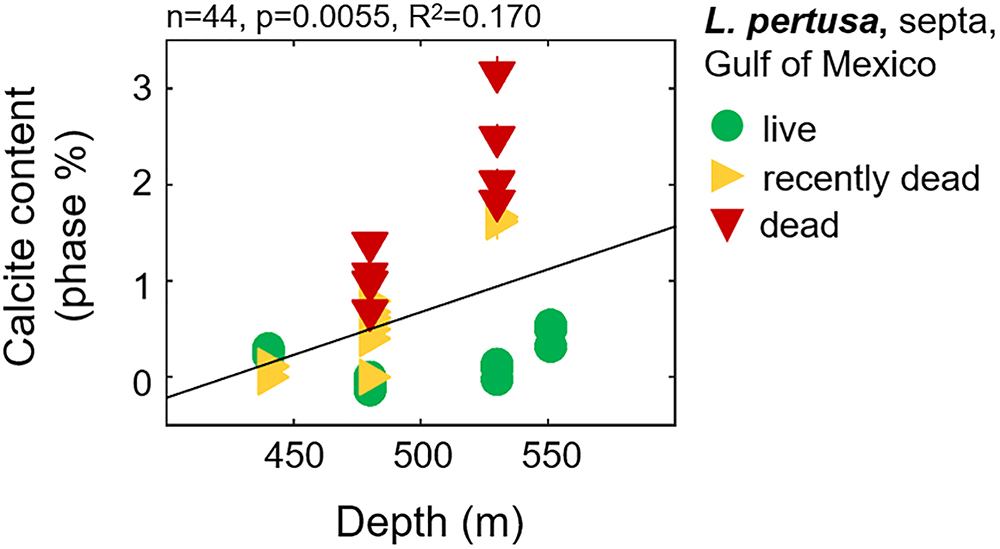
Figure 5. Calcite contents in Gulf of Mexico L. pertusa septa samples as a function of increasing water column depth, with corals collected at various states– live, recently dead, and dead.
Focusing on only the live Gulf of Mexico samples, based on the PCA biplot, we observe that the vector position for calcite contents (bold, light blue vectors) indicates that calcite contents are most likely related to depth, Ωsw, and pHsw (bold, red vectors) (Figure 3). These four variables appear to be driving most of the variability in PC1 and lie parallel to the difference between the GC354 coral growing at the lowest surrounding Ωsw and the other corals growing at higher surrounding Ωsw. Thus, we have plotted calcite content as a function of these environmental parameters (Figure 6A) and observe some moderate inverse trend lines from simple regressions (R2 = 0.415 for pHsw, R2 = 0.358 for Ωsw). Due to the nested nature of these many variables, we have also plotted how unit cell volume may be shifting as a function of increasing calcite content and observe a weak inverse correlation (Figure 6B). All simple regression equations, p-values and R2 values are listed in Supplementary Table S2. It is important to note that while we present regressions for calcite content as a function of individual variables, many of these environmental variables are inter-related and may have varying impacts on calcite content, as is graphically presented in the PCA biplot (Figure 3).
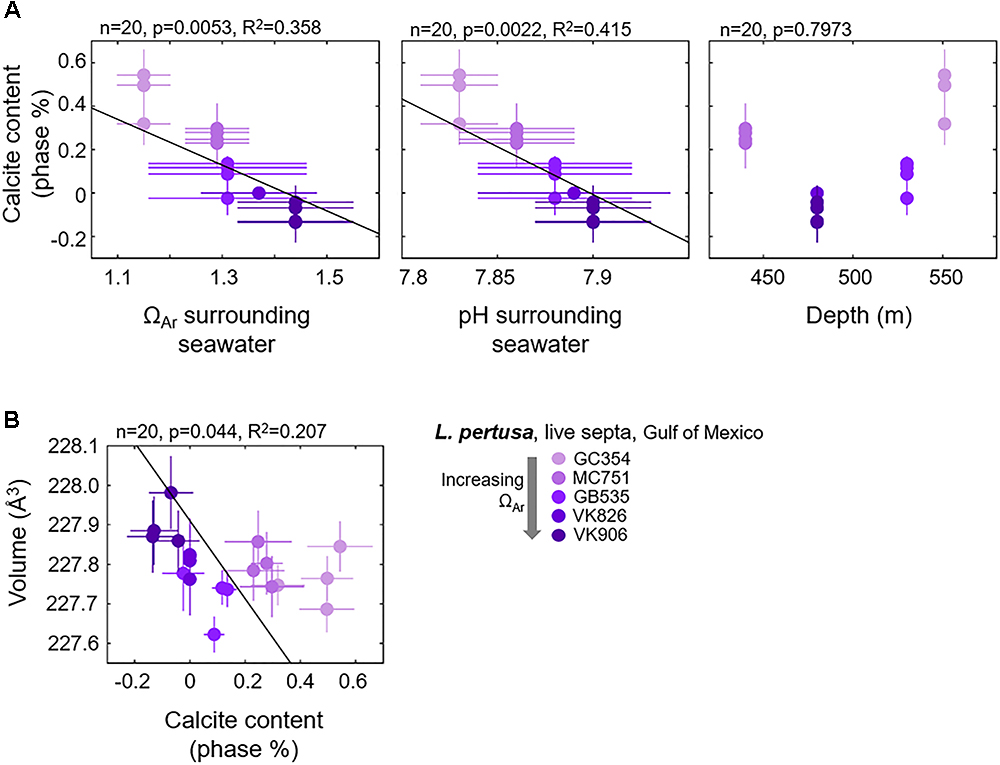
Figure 6. Gulf of Mexico L. pertusa live septa (A) calcite contents as a function of surrounding seawater chemistry and depth, and (B) shifts in unit cell volume as a function of increasing calcite contents.
Trace Metal Analysis Within Coral Skeletons
The only statistically significant relationship between trace element incorporation and crystallography is a widening of the FWHM (111) aragonite XRD peak as a function of increasing Ba content (Figure 7). This strong relationship (R2 = 0.853) is further observed by the parallel position of these variables in the PCA biplot (Figure 3). Simple regressions between trace element incorporations versus the many other variables measured in this study do not suggest any other statistically significant relationships (plotted in the Supplementary Figure S5).
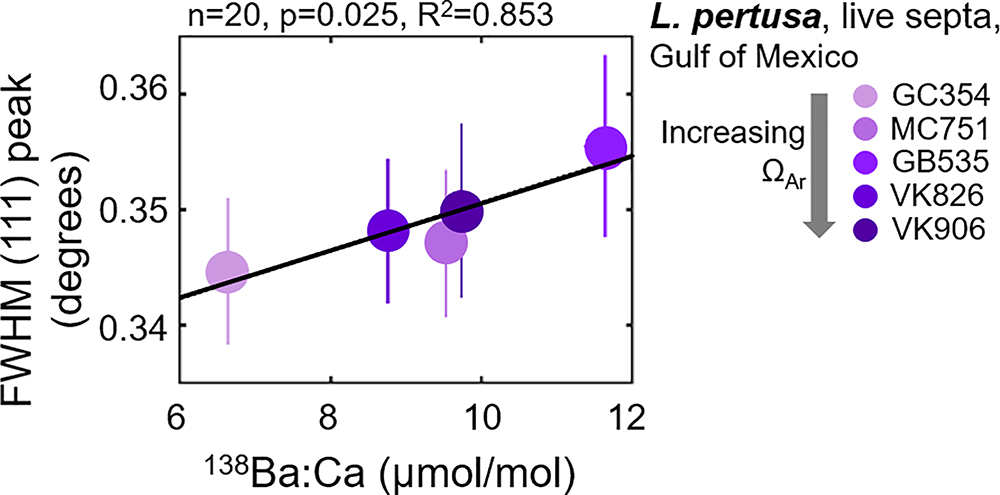
Figure 7. Full width at half maximum (FWHM) of the (111) aragonite XRD peak increasing as a 138Ba:Ca content increases in Gulf of Mexico L. pertusa live septa samples. 138Ba:Ca ratios are calculated based on known ratios in the JCp-1 reference coral (Hathorne et al., 2013).
Scanning Electron Microscopy of Coral Morphologies
Scanning electron microscope images of live Gulf of Mexico L. pertusa thin-sections under increasing aragonite saturation states, at magnifications increasing to 1000× magnification, reveal small morphological differences between the septa (Supplementary Figure S6) and outer skeletal (Supplementary Figure S7) regions in corals grown in lower saturation state conditions. Septa in higher-saturated state corals have thinner, more defined septa cross-sections, while samples grown in lower saturation states have wider septa with more etched edges with visible individual crystallites at high magnifications (Supplementary Figure S6). This is especially true in the septa of L. pertusa GC354 (Ωsw = 1.15), which displays etched features similar to corals from previous studies at 2500× magnification (Rodolfo-Metalpa et al., 2011; Hennige et al., 2015) (Supplementary Figure S8). Nevertheless, overall, the differences in skeletal morphology between L. pertusa samples under this relatively small range of saturation states are not substantial.
Discussion
Aragonite Crystallography From Corals of Different Species and Localities, Sampling Regions, and Collection States
Despite differences in skeletal architecture and different environmental conditions, we observe that the overall aragonite crystallography of deep-sea corals from different global localities does not differ significantly. This is supported by T-tests comparing various coral species, ranging from the solitary coral, Flabellum impensum, from Antarctica to the robust colonial coral, L. pertusa, from the Gulf of Mexico (Table 1 and Figure 2). Within our dataset of L. pertusa from the Gulf of Mexico, we also observe via T-tests that crystallography is not statistically distinct between septa and outer polyp regions of the skeleton (Figure 2). This is despite some visual evidence from SEM images that point to outer polyp regions exhibiting more evidence of dissolution (Supplementary Figure S7) and prior studies that observed how outer polyp regions with potentially less tissue-cover may be more susceptible to dissolution (Hennige et al., 2015). Since crystallography and chemistry are what govern the material properties of skeletal aragonite (solubility, strength), it is important to test whether shifts in morphology (such as signs of increased skeletal dissolution) may be reflected in coral crystallography. While this study observes similar crystallography across many coral species, there may still be nuanced shifts within a particular species growing under varying environmental conditions which could influence aragonite solubility and stability within that coral species.
One variable which appears to have a pronounced effect on mineralogy and crystallography the Gulf of Mexico L. pertusa samples is the state at which the sample was collected: live, recently dead, or dead. One-way ANOVAs reveal some statistically significant variability between these states, especially in terms of overall unit cell volume and c-axis lengths (Supplementary Tables S1, S3). This difference in volume and c-axis length for L. pertusa collected in different states may be due to increased phase fractions of calcite in recently dead and dead corals as highlighted with black arrows in Figure 1 and plotted in Figure 5 and Supplementary Figure S4A.
Comparing our crystallographic findings of deep-sea corals to previous studies, unit cell volumes of live deep-sea corals (227.719–227.927 Å3) fall slightly above the range of previous X-ray diffraction studies on mollusk (226.4277–227.774 Å3) and coral biogenic aragonites (227.488–227.603 Å3) (Pokroy et al., 2004, 2006, 2007; Stolarski et al., 2007; Roger et al., 2017) (Figure 2 and Supplementary Table S3). Average anisotropic axis elongations in corals from this study compared to geological aragonite (Pokroy et al., 2007) agree with elongation ratios from Pokroy et al. (2007) along the a- and c-axes (Δa/aPokroy = 0.000967, Δa/aThisstudy = 0.001086; Δc/cPokroy = 0.0019, Δc/cThisstudy = 0.00199), but not along the b-axis in which we observe elongations rather than a shortening as reported by Pokroy et al. (2007) (Δb/bPokroy = -0.00037, Δb/bThisstudy = 0.00025) (Figure 2). It is important to note that the magnitude of change along the b-axis is smallest in both our study and prior studies; these changes also approach the margin of error, which may explain the discrepancy between elongation versus shortening in our studies. While changes along the b-axis may be minor when comparing to geological aragonites, anisotropic elongations along the b-axis are most closely correlated with increasing aragonite saturation state of surrounding seawater in our live L. pertusa septa samples (R2 = 0.338, Supplementary Figure S2A), compared to other axes and overall volume (Figure 4A).
Aragonite Mineralogy and Crystallography as a Function of Seawater Aragonite Saturation State
In this study we explore the mineralogy and crystallography on a subset of L. pertusa samples collected along a natural gradient of aragonite saturation states in the Gulf of Mexico in order to determine whether there are hidden shifts which may impact skeletal dissolution and strength under unfavorable seawater chemistry conditions. Surveying how the many variables which we measured in this study relate to crystal lattice parameters via a PCA biplot, we would not expect any strong relationships between crystallography and most of the environmental or trace element variables measured (Figure 3). Despite this, the skeletons of live L. pertusa septa samples still exhibit minor (R2 = 0.281) crystallographic distortions toward larger unit cell volumes as a function of increasing aragonite saturation state (Figure 4A). Despite not having aragonite saturation state measurements inside of the coral calcifying fluid, our observations on how surrounding seawater conditions influence coral mineralogy mirror the relatively strong trends we observe in synthetic aragonites precipitated directly from seawater of known aragonite saturation states (black dashed trend line, R2 = 0.7149) as well as for an added reference coral with a known calcifying fluid ΩAr (ΩAr,cf = 12.3, DeCarlo et al., 2017) (mint-green solid trend line, R2 = 0.542) (Figure 4B). Thus, stronger or additional patterns may have been observed here if calcifying fluid aragonite saturation states had been available to compare with crystallographic lattice parameters. Interestingly, L. pertusa and synthetic aragonite samples do not show statistically significant unit cell volume shifts with varying pH (Figure 4).
In parallel with these crystallographic structural distortions, we also find some evidence of increased surface etching and roughness (more corrosion) for corals growing within waters with decreasing Ωsw (Supplementary Figure S1). While previous studies have observed marked distortions in coral skeletons and crystallite morphologies in shallow corals growing in undersaturated conditions (Cohen et al., 2009; Tambutté et al., 2015; Foster et al., 2016; Wu et al., 2017), overall skeleton morphology shifts in deep-sea corals are not as obvious. Instead, L. pertusa colonies express only minor outward morphological differences in undersaturated Ωsw conditions with hidden internal crystal morphology toward less ordered, smaller crystallites observable via electron backscatter diffraction (EBSD) (Hennige et al., 2015). Our SEM images suggest a similar lack of major outward morphological changes in L. pertusa. Despite these minor morphological changes, there are detectable changes to the aragonite crystal structure within these corals (Figure 4A); albeit not major structural modifications.
There are several explanations for the minor crystallographic shifts we observe in these Gulf of Mexico deep-sea corals. First, this is a natural and modest aragonite saturation state gradient (Ωsw = 1.15–1.44) compared to other incubation studies which have explored geochemical influences on coral mineralogy over a much wider saturation state gradient (ΩAr,sw = 0.22–4.5) (Cohen et al., 2009; Foster et al., 2016). Second, corals may play an active role in raising their internal calcifying fluid Ωcf via increased heterotrophic feeding (Drenkard et al., 2013; Georgian et al., 2016b) to compensate for low Ωsw in surrounding seawater. Third, recent models for biologically-controlled biomineralization mechanisms suggest that corals may be very resistant to surrounding seawater chemistry (Mass et al., 2017; Von Euw et al., 2017). Finally, deep-sea corals may have naturally more resistant skeletons compared to shallow corals since they have slower growth rates and are more accustomed to extreme conditions (i.e., McCulloch et al., 2012b). Our findings corroborate findings that deep-sea coral mineralogy is relatively resistant to naturally low seawater aragonite saturation states, with only minor crystallographic distortions observed. The structural changes that are observed in the L. pertusa skeletons are similar to those observed for abiotic aragonites synthesized under different aragonite saturation states.
Beyond shifts in crystallography with Ωsw, based on the PCA biplot and regressions, we observe a tighter relationship between crystallography and the distance from which coral colonies were collected with respect to nearby hydrocarbon seeps (Figure 4A, R2 = 0.443). While there is no immediate explanation for this, assuming that this relationship is no coincidence, this distance could be indirectly related to growth rate or other crystal growth parameters. For instance, distance away from hydrocarbon seeps could increase food availability and thus available energy for the coral to spend on calcification. This could lead to faster skeletal growth and crystal growth rates, thus influencing crystallography. Furthermore, there is a statistically significant relationship between increasing Ωsw with increased distance away from hydrocarbon seeps, indicating a slight unfavorable shift in carbonate chemistry surrounding the seeps (p = 0.0002, R2 = 0.538).
Overall, we observe very weak crystallographic patterns in L. pertusa towards larger unit cell volumes with increasing Ωsw, which mirrors the slight morphological shifts we observe in hand-specimens and SEM images.
Models of Substitutions for Ca Into Aragonite as a Function of Aragonite Saturation State
The minor shifts in crystallography we observe as a function of ΩAr may be explained by crystal growth parameters, such as growth rate. In this study, we use XRD to track shifts in overall crystallography by quantitatively measuring the aragonite unit cell parameters via Rietveld refinements. Previous studies have similarly interrogated the aragonite carbonate bonding environment via Raman spectroscopy measurements and proposed that aragonites grown in aragonite supersaturated conditions crystallize at faster rates and incorporate more impurities and/or crystal defects. This is observed by clear increases in crystallographic disorder via a widening of the FWHM for the ν1 symmetric stretching mode of the carbonate groups in aragonite with increasing ΩAr (DeCarlo et al., 2017). This common shift towards more disorder in crystallography and carbonate bonding environment as a function of ΩAr may indicate that crystallography and carbonate bonding environments are linked. For example, compared to geologically-formed aragonite (Figure 8A), an elongation along the c-axis, the most dominant trend with increasing ΩAr in synthetic and JCp-1 aragonites (Supplementary Figure S2B, R2 = 0.564), runs perpendicular to the trigonal planar carbonate groups and could be responsible for the static out-of-plane rotations which could cause an observed increase in disorder in the ν1 Raman mode (Figure 8B, not-to-scale). Anisotropic shifts along the b-axis, which run parallel to the carbonate groups in aragonite, may specifically influence bonding environments of the carbonate groups along that plane, such as T (translation, lattice mode) and ν4 (in-plane bending internal mode) Raman modes.
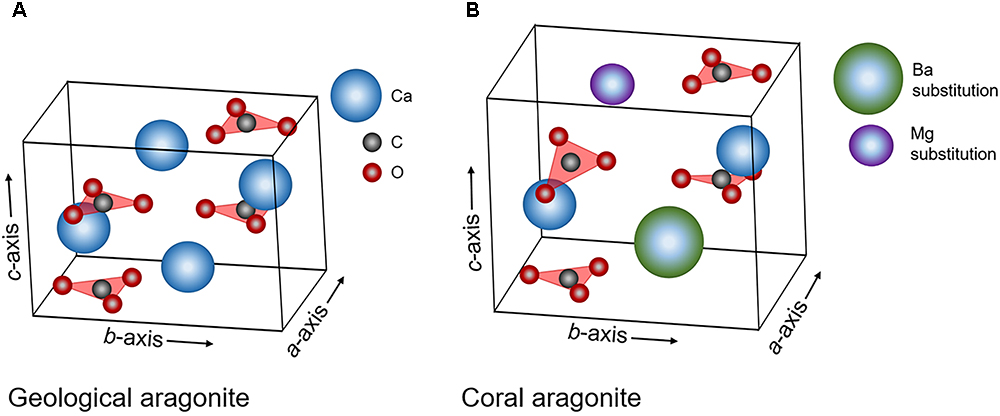
Figure 8. Schematic of the aragonite unit cell with labeled a-, b-, and c- axes and positions of trigonal planar carbonate groups and calcium ions. (A) Aragonite under normal conditions, (B) aragonite with longer axes lengths, larger overall volume, distorted symmetry (static out-of-plane rotations of the carbonate groups), and potential trace-incorporations by other elements for Ca. This figure is not to scale and length expansions, distortions and substitutions are exaggerated for effect.
In another model for crystallographic disorder in carbonates, Mg calcites have been shown to exhibit wider ν1 Raman mode FWHM due to out of plane rotations of the trigonal planar carbonate groups attributed to incorporations of over 10% Mg substitutions for Ca (Bischoff et al., 1985; Urmos et al., 1991). Since FWHM widening in aragonite as a function of ΩAr is much smaller compared to that in Mg calcites, it has been suggested that wider FWHM in aragonites could be due to either small crystallite sizes or much less-pronounced crystallographic disorder. Sharma and Urmos (1987) comment that while smaller crystallite sizes are commonly responsible for wider FWHM and shifts in Raman peak frequency, that the slightly higher frequencies observed for ν1 and ν4 modes in Porites coral aragonite display the opposite effect that small crystallites would have on a Raman spectrum. Thus it is most likely that aragonite FWHM Raman trends are also driven by crystallographic distortions due to element incorporations for Ca, or factors related to increased element incorporations and disorder.
Previous studies on speleothem (i.e., Fairchild and Treble, 2009) and synthetic (i.e., Gaetani and Cohen, 2006; Gabitov et al., 2008; DeCarlo et al., 2015) aragonites attribute trace-substitutions to be at least partially a function of faster crystallization at increased ΩAr. Faster coral skeletal calcification rates are also observed in increased ΩAr,sw (Gattuso et al., 1998; Chan and Connolly, 2013). Assuming that this skeletal extension translates into faster aragonite crystal growth rates, observed crystal distortions and disorder in coral aragonite may follow a similar model to that of synthetic aragonites and exhibit element-incorporation-induced crystallographic distortions at increased ΩAr. Interestingly though, our measurements of trace incorporations of Ba, Sr, and Mg do not trend significantly with aragonite saturation state of the surrounding seawater, or with unit cell lattice parameters (Supplementary Figure S5). We do, however, observe a strong relationship between increased overall crystallographic disorder via the widening of FWHMs of the main (111) XRD peak (Figure 1) as a function of increasing Ba incorporations (Figure 7, R2 = 0.853). The widening FWHM (111) peak does not trend with increasing aragonite saturation states (Figure 3). Thus, it is likely that the observed coral aragonite unit cell lattice parameter shifts as a function of aragonite saturation state (Figure 4) are not primarily driven by an increase of trace-substitutions for Ca. Unfortunately, we do not have measurements for crystal growth rates, but due to the similarities between deep-sea corals and synthetic aragonite shifting toward larger unit cell volumes with increasing ΩAr (Figure 4), it is likely that faster growth rates play a role in inducing increased crystalline disorder and larger unit cell volumes.
Calcite Contents in Deep-Sea Corals as a Function of Crystallography and Aragonite Saturation State
Since Ba, Sr, and Mg incorporations do not significantly trend with shifts in our aragonite unit cell lattice parameters or with surrounding seawater aragonite saturation states, another explanation for shifting unit cell parameters lies in the incorporation of minor calcite phases. Increased calcite content in live L. pertusa septa as measured via Rietveld refinements trend moderately with decreasing seawater aragonite saturation state (p = 0.0053, R2 = 0.358) and pH (p = 0.0022, R2 = 0.415) as suggested by the PCA biplot and confirmed by simple regressions (Figures 3, 6A). In particular, increased unit cell volumes exhibit a weak pattern with decreasing calcite content (Figure 6B). It is important to note that some of these calcite values calculated via Rietveld refinements report negative values for calcite, which clearly are not real and mean that there is no detectable calcite.
It is unclear if these incorporations of calcite are due to calcite formation upon aragonite precipitation or whether they are the results of secondary deposits associated with boring organisms. We suggest that these calcite phase contributions in the live septa samples are most likely intricately linked with aragonite precipitation because calcite contents trend somewhat with aragonite lattice parameters (Figure 6B), live septa regions of the corals represent the newest growth and are least likely to be affected by boring organisms, and we observe little to no evidence of boring up to 2500× magnification via SEM imaging (Supplementary Figures S6–S8). As for the much higher calcite fractions we observe in the recently dead and dead collection states of L. pertusa (Figure 5), we suggest that these higher calcite contributions with increased exposure to surrounding seawater, especially at depth, are most likely due to transformations of aragonite, the metastable polymorph of CaCO3, to calcite and possibly boring organisms.
Relationship Between Aragonite Saturation State in Seawater and the Internal Calcifying Fluid of Deep-Sea Corals
Previous studies have observed that healthy L. pertusa and other deep-sea corals growing in typical seawater saturated with respect to aragonite are known to raise their calcifying fluid pH (∼0.6–0.8 pH units) relative to surrounding seawater and maintain an elevated calcifying fluid aragonite saturation state (Ωcf ∼8.5–13) to promote aragonite precipitation (McCulloch et al., 2012b). Corals may further raise their Ωcf 5–10 fold for every 1 pH unit increase in calcifying fluid pH due to pH upregulation via Ca2+-ATPase pumping (Cohen and McConnaughey, 2003; Allemand et al., 2004; McCulloch et al., 2012b).
Assuming that coral biomineralization is dependent on internal calcifying fluid geochemistry, here we utilize crystallographic trends between the unit cell volumes (Figure 4B, black dashed line) and b-axis lengths (Figure 4B, black dashed lines) of synthetic aragonites versus their ΩAr of formation to approximate values for coral internal calcifying fluid aragonite saturation state (Ωcf) in septa and outside of polyp samples of live Gulf of Mexico L. pertusa (Ωsw = 1.15–1.44), as presented in Table 2. Our range of estimates for Ωcf = 11.1–17.3 based on b-axis length fall around previous δ11B-based estimates (Ωcf 8.5–13) for deep-sea corals (McCulloch et al., 2012b), whereas our estimates based on unit cell volume fall above this range (Ωcf 15.2–25.2) (Table 2). However, both of our calculated Ωcf estimates fall along the range for shallow water corals as previously calculated by Raman spectroscopy (Ωcf ∼10.8–13.7, DeCarlo et al., 2017) and δ11B estimates for Ωsw ∼ 4 (Ωcf ∼15–25, McCulloch et al., 2012a, 2017). Our estimates for the JCp-1 reference coral (Ωcf based on b-axis length ∼24.3, Ωcf based on volume ∼ 18.43, Table 2) are higher than Raman-spectroscopy-based estimates for JCp-1 (Ωcf = 12.3 ± 0.3, DeCarlo et al., 2017). Future studies will aim to create a more robust reference line of saturation state versus unit cell volume (as well as other axes lengths) with more references samples of synthetic aragonites precipitated at controlled saturation states and coral aragonites with known internal Ωcf based on 11B isotopes and Raman spectroscopy measurements. Our X-ray diffraction-based approach may eventually lend a new method, independent of isotope effect pH measurements, to complement previous δ11B isotope-based estimations for Ωcf in corals. This ability to raise and maintain their internal Ωcf relative to surrounding seawater, despite the relatively harsh low Ωcf conditions of the deep-sea, may allow deep-sea corals to survive lower pH conditions and a shoaling ASH.
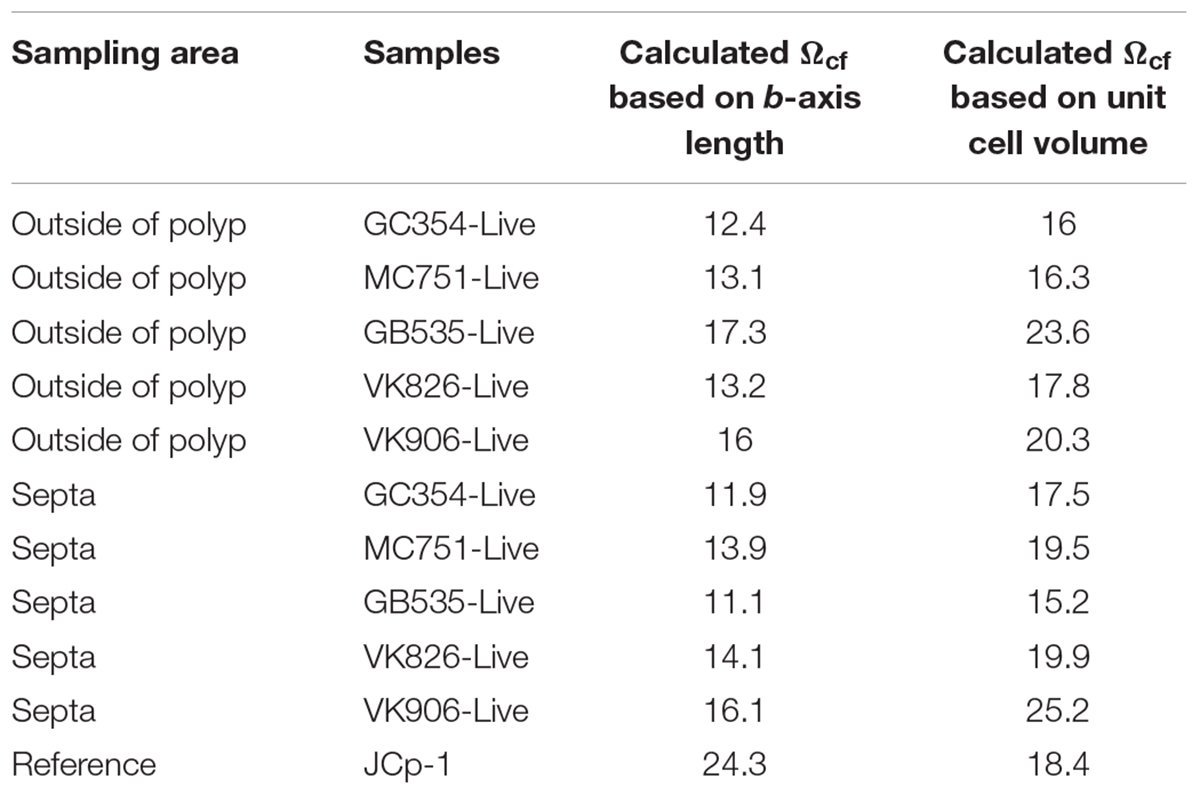
Table 2. Internal calcifying fluid aragonite saturation state (Ωcf) estimates in live L. pertusa samples from the Gulf of Mexico as calculated by the relationship between aragonite saturation states and b-axis lengths or unit cell volumes in synthetic aragonites.
Conclusion
Tracking mineralogical shifts as a function of Ωsw may help to predict how coral skeletal health (i.e., solubility and strength) will respond to a changing ocean. Overall, we observe that crystallography does not differ significantly across deep-sea corals of different species and from different global localities. Despite no clear trends across coral species, we observe weak, but distinct, crystallographic shifts of larger unit cell volumes as a function of increasing ΩAr of surrounding seawater in septa of live L. pertusa deep-sea corals from the Gulf of Mexico. These structural changes are also seen in synthetic aragonites precipitated under various saturation states, indicating that these changes are inherent to the crystallography of aragonite. We also observe increased crystallographic disorder manifested as widening FWHM of main (111) peaks which trend with increasing trace incorporations of Ba for Ca. However, trace-incorporations by Ba, Sr, and Mg do not significantly trend with crystal lattice parameters. Instead, we observe that the incorporation of calcite (up to 8% in some of our deep-sea corals) trends significantly with both Ωsw and crystal lattice parameters. We suggest that this calcite contribution may be related to the calcification process, rather than due to secondary deposits via boring organisms. Thus, despite living along a modest range of saturation states, structural differences are observed within the L. pertusa skeletons. Additional tests on the impact of these structural changes on the integrity of the skeleton, such as strength and dissolution behavior, should follow.
In this study we demonstrate that crystallography can be used to observe otherwise hidden shifts in skeletal mineralogy using XRD techniques. We further use crystallographic measurements to provide estimates for internal Ωcf for deep-sea corals to suggest that deep-sea corals calcify in exceedingly low Ωsw by maintaining elevated internal Ωcf. Future mineralogical studies should couple 11B isotope (e.g., Holcomb et al., 2014; McCulloch et al., 2014; Wu et al., 2017) and Raman spectroscopy (DeCarlo et al., 2017) estimates of Ωcf with X-ray diffraction-based crystallographic estimates shown in this study in order to better understand the nuances of how crystallography shifts as a function of internal aragonite saturation states. This may eventually lead to a crystallography-based independent model for predicting Ωcf which would complement other methods. Lastly, this study will ideally lay a foundation for future studies utilizing quantitative XRD to explore the impact of physical and chemical stressors on skeletal mineralogy, and subsequent coral health.
Author Contributions
GF and CMH conceived the idea and designed the study. GF performed the analyses, and wrote the manuscript with assistance from CH. EC and RW collected the deep-sea coral samples used in the study. TD precipitated the abiogenic aragonites and provided Raman-based crystallographic knowledge about them. EC, RW, and TD aided interpreting and editing the final manuscript.
Funding
Funding for this project was made possible by Mineralogical Society of America Edward H. Kraus Crystallographic Research Fund and the WHOI Ocean Ventures Fund. GF was supported by a National Science Foundation Graduate Research Fellowship grant no. 1122374 and a Ford Foundation Dissertation Fellowship. Sample collections from RW were funded under NSF grant nos. 1245766 and 1127582 and NOAA Ocean Exploration Deep Atlantic Stepping Stones. Collections from the Gulf of Mexico were supported by NSF BIO-OCE grant #1220478 to EC.
Conflict of Interest Statement
The authors declare that the research was conducted in the absence of any commercial or financial relationships that could be construed as a potential conflict of interest.
Acknowledgments
The authors would like to thank Alexis Weinnig and Carlos Gomez with their help in the initial processing of the L. pertusa samples from the Gulf of Mexico and Dr. Peter Etnoyer for the L. pertusa samples from the California margin. The authors would also like to thank Dr. Jeffrey Post from the Smithsonian Nation Museum of Natural History for training on Rietveld Refinement analysis, Gretchen Swarr for help with ICP-MS analyses at the Woods Hole Oceanographic Institution (WHOI), Dr. Andrew Solow and Dr. Natalie Cohen for consulting on the statistics at WHOI, and Katherine Sisson for helping to prepare coral powder samples at WHOI. The authors acknowledge Dr. Michael Holcomb for providing the synthetic aragonite samples, which were created in the laboratory of Dr. Glenn Gaetani, WHOI.
Supplementary Material
The Supplementary Material for this article can be found online at: https://www.frontiersin.org/articles/10.3389/fmars.2018.00473/full#supplementary-material
References
Acker, J. G., Byrne, R. H., Ben-Yaakov, S., Feely, R. A., and Betzer, P. R. (1987). The effect of pressure on aragonite dissolution rates in seawater. Geochim. Cosmochim. Acta 51, 2171–2175. doi: 10.1016/0016-7037(87)90266-3
Allemand, D., Ferrier-Pages, C., Furla, P., Houlbreque, F., Puverel, S., Reynaud, S., et al. (2004). Biomineralisation in reef-building corals: from molecular mechanisms to environmental control. C. R. Palevol. 3, 453–467. doi: 10.1016/j.crpv.2004.07.011
Allemand, D., Tambutté,É, Zoccola, D., and Tambutté, S. (2011). “Coral calcification, cells to reefs,” in Coral Reefs: An Ecosystem in Transition, eds Z. Dubinsky and N. Stambler (Berlin: Springer), 119–150. doi: 10.1007/978-94-007-0114-4
Allison, N., Cohen, I., Finch, A. A., Erez, J., and Tudhope, A. W. (2014). Corals concentrate dissolved inorganic carbon to facilitate calcification. Nat. Commun. 5:6741. doi: 10.1038/ncomms6741
Antao, S. M., and Hassan, I. (2009). The orthorhombic structure of CaCO3, SrCO3, PbCO3 and BaCO3: Linear structural trends. Can. Mineral. 47, 1245–1255. doi: 10.3749/canmin.47.5.1245
Bischoff, W. D., Sharma, S. K., and MacKenzie, F. T. (1985). Carbonate ion disorder in synthetic and biogenic magnesian calcites: a Raman spectral study. Am. Mineral. 70, 581–589.
Bish, D. L., and Post, J. E. (1993). Quantitative mineralogical analysis using the Rietveld full- pattern fitting method. Am. Mineral. 78, 932–940.
Caspi, E. N., Pokroy, B., Lee, P. L., Quintana, J. P., and Zolotoyabko, E. (2005). On the structure of aragonite. Acta Cryst. B 61, 129–132. doi: 10.1107/S0108768105005240
Chan, N., and Connolly, S. R. (2013). Sensitivity of coral calcification to ocean acidification: a meta-analysis. Glob. Change Biol. 19, 282–290. doi: 10.1111/gcb.12011
Chung, S. N., Lee, K., Feely, R. A., Sabine, C. L., Millero, F. J., Wanninkhof, R., et al. (2003). Calcium carbonate budget in the Atlantic Ocean based on water column inorganic carbon chemistry. Glob. Biogeochem. Cycles 17:1093. doi: 10.1029/2002GB002001
Cohen, A., and Holcomb, M. (2009). Why corals care about ocean acidification: uncovering the mechanism. Oceanography 22, 118–127. doi: 10.5670/oceanog.2009.102
Cohen, A. L., and McConnaughey, T. (2003). Geochemical perspectives on coral mineralization. In Biomineralization (eds. P. Dove, S. Weiner and J. Yoreo). Rev. Mineral. Geochem. 54, 151–187. doi: 10.2113/0540151
Cohen, A. L., McCorkle, D. C., de Putron, S., Gaetani, G. A., and Rose, K. A. (2009). Morphological and compositional changes in the skeletons of new coral recruits reared in acidified seawater: insights into the biomineralization response to ocean acidification. Geochem. Geophys. Geosyst. 10, 1–12. doi: 10.1029/2009GC002411
DeCarlo, T. M., D’Olivo, J. P., Foster, T., Holcomb, M., Becker, T., and McCulloch, M. T. (2017). Coral calcifying fluid aragonite saturation states derived from Raman spectroscopy. Biogeosciences 14, 5253–5269. doi: 10.5194/bg-14-5253-2017
DeCarlo, T. M., Gaetani, G. A., Holcomb, M., and Cohen, A. L. (2015). Experimental determination of factors controlling U/Ca of aragonite precipitated from seawater: implications for interpreting coral skeleton. Geochim. Cosmochim. Acta 162, 151–165. doi: 10.1016/j.gca.2015.04.016
DeCarlo, T. M., Ren, H., and Farfan, G. A. (2018). The origin and role of organic matrix in coral calcification: insights from comparing coral skeleton and abiogenic aragonite. Front. Mar. Sci. 5:170. doi: 10.3389/fmars.2018.00170
Doney, S. C., Fabry, V. J., Feely, R. A., and Kleypas, J. A. (2009). Ocean acidification: the other CO2 problem. Annu. Rev. Mar. Sci. 1, 169–192. doi: 10.1146/annurev.marine.010908.163834
Drenkard, E. J., Cohen, A. L., McCorkle, D. C., de Putron, S. J., Starczak, V. R., and Zicht, A. E. (2013). Calcification by juvenile corals under heterotrophy and elevated CO2. Coral Reefs 32, 727–735. doi: 10.1007/s00338-013-1021-5
Fairchild, I. J., and Treble, P. C. (2009). Trace elements in speleothems as recorders of environmental change. Quat. Sci. Rev. 28, 449–468. doi: 10.1016/j.quascirev.2008.11.007
Feely, R. A., Sabine, C. L., Hernandez-Ayon, J. M., Ianson, D., and Hales, B. (2008). Evidence for upwelling of corrosive “acidified” water onto the continental shelf. Science 320, 1490–1492. doi: 10.1126/science.1155676
Feely, R. A., Sabine, C. L., Lee, K., Berelson, W., Kleypas, J., Fabry, V. J., et al. (2004). Impact of anthropogenic CO2 on the CaCO3 system in the oceans. Science 305, 362–366. doi: 10.1126/science.1097329
Form, A. U., and Riebesell, U. (2012). Acclimation to ocean acidification during long-term CO2 exposure in the cold-water coral Lophelia pertusa. Global Change Biol. 18, 843–853. doi: 10.1111/j.1365-2486.2011.02583.x
Foster, T., Falter, J. L., McCulloch, M. T., and Clode, P. L. (2016). Ocean acidification causes structural deformities in juvenile coral skeletons. Sci. Adv. 2:1130. doi: 10.1126/sciadv.1501130
Gabitov, R. I., Gaetani, G. A., Watson, E. B., Cohen, A. L., and Ehrlich, H. L. (2008). Experimental determination of growth rate effect on U6+ and Mg2+ partitioning between aragonite and fluid at elevated U6+ concentration. Geochim. Cosmochim. Acta 72, 4058–4068. doi: 10.1016/j.gca.2008.05.047
Gaetani, G. A., and Cohen, A. L. (2006). Element partitioning during precipitation of aragonite from seawater: a framework for understanding paleoproxies. Geochim. Cosmochim. Acta 70, 4617–4634. doi: 10.1016/j.gca.2006.07.008
Gaffey, S. J., and Bronnimann, C. E. (1993). Effects of bleaching on organic and mineral phases in biogenic carbonates. J. Sediment. Res. 63, 752–754. doi: 10.1306/D4267BE0-2B26-11D7-8648000102C1865D
Gattuso, J. P., Frankignoulle, M., Bourge, I., Romaine, S., and Buddemeier, R. W. (1998). Effect of calcium carbonate saturation of seawater on coral calcification. Glob. Planet. Change 18, 37–46. doi: 10.1016/S0921-8181(98)00035-6
Georgian, S. E., DeLeo, D., Durkin, A., Gomez, C. E., Kurman, M., Lunden, J. J., et al. (2016a). Oceanographic patterns and carbonate chemistry in the vicinity of cold-water coral reefs in the Gulf of Mexico: Implications for resilience in a changing ocean. Limnol. Oceanogr. 61, 648–665. doi: 10.1002/lno.10242
Georgian, S. E., Dupont, S., Kurmann, M., Butler, A., Stromberg, S., Larsson, A., et al. (2016b). Biogeographic variability in the physiological response of the cold-water coral Lophelia pertusa to ocean acidification. Mar. Ecol. 37, 1345–1359. doi: 10.1111/maec.12373
Hathorne, E. C., Gagnon, A., Felis, T., Adkins, J., Asami, R., Boer, W., et al. (2013). Interlaboratory study for coral Sr/Ca and other element/Ca ratio measurements. Geochem. Geophys. Geosyst. 4, 3730–3750. doi: 10.1002/ggge.20230
Hennige, S. J., Wicks, L. C., Kamenos, N. A., Perna, G., Findlay, H. S., and Roberts, J. M. (2015). Hidden impacts of ocean acidification to live and dead coral framework. Proc. R. Soc. Lond. 282, 1–10. doi: 10.1098/rspb.2015.0990
Hofmann, G. E., Barry, J. P., Edmunds, P. J., Gates, R. D., Hutchins, D. A., Klinger, T., et al. (2010). The effect of ocean acidification on calcifying organisms in marine ecosystems: an organism-to-ecosystem perspective. Annu. Rev. Ecol. Evol. Syst. 41, 127–147. doi: 10.1146/annurev.ecolsys.110308.120227
Holcomb, M., DeCarlo, T. M., Gaetani, G. A., and McCulloch, M. (2016). Factors affecting B/Ca ratios in synthetic aragonite. Chem. Geol. 437, 67–76. doi: 10.1016/j.chemgeo.2016.05.007
Holcomb, M., Venn, A. A., Tambutté, E., Tambutté, S., Allemand, D., Trotter, J., et al. (2014). Coral calcifying fluid pH dictates response to ocean acidification. Sci. Rep. 4, 1–4. doi: 10.1038/srep05207
Janiszewska, K., Stolarski, J., Benzerara, K., Meibom, A., Mazur, M., Kitahara, M. V., et al. (2011). A unique skeletal microstructure of the deep-sea micrabaciid scleractinian corals. J. Morphol. 272, 191–203. doi: 10.1002/jmor.10906
Kurman, M. D., Gómez, C. E., Georgian, S. E., Lunden, J. J., and Cordes, E. E. (2017). Intra-specific variation reveals potential for adaptation to ocean acidification in a cold-water Coral from the Gulf of Mexico. Front. Mar. Sci. 4:111. doi: 10.3389/fmars.2017.00111
Lunden, J. J., Georgian, S. E., and Cordes, E. E. (2013). Aragonite saturation states at cold-water coral reefs structured by Lophelia pertusa in the northern Gulf of Mexico. Limnol. Oceanogr. 58, 354–362. doi: 10.4319/lo.2013.58.1.0354
Maier, C., Schubert, A., Berzunza Sánchez, M. M., Weinbauer, M., Watremez, P., Gattuso, J.-P., et al. (2013). End of the Century pCO2 levels do not impact calcification in Mediterranean cold-water corals. PLoS One 8:e62655. doi: 10.1371/journal.pone.0062655
Markgaf, S. A., and Reeder, R. J. (1985). High-temperature structure refinements of calcite and magnesite. Am. Mineral. 70, 590–600.
Mass, T., Drake, J. L., Haramaty, L., Kim, J. D., Zelzion, E., Bhattacharya, D., et al. (2013). Cloning and characterization of four novel coral acid-rich proteins that precipitate carbonates in vitro. Curr. Biol. 23, 1126–1131. doi: 10.1016/j.cub.2013.05.007
Mass, T., Giuffre, A. J., Sun, C.-Y., Stifler, C. A., Frazier, M. J., Neder, M., et al. (2017). Amorphous calcium carbonate particles form coral skeletons. Proc. Natl. Acad. Sci. U.S.A. 114, E7670–E7678. doi: 10.1073/pnas.1707890114
McCulloch, M., Falter, J., Trotter, J., and Montagna, P. (2012a). Coral resilience to ocean acidification and global warming through pH up-regulation. Nat. Clim. Change 2:623. doi: 10.1038/nclimate1473
McCulloch, M., Trotter, J., Montagna, P., Falter, J., Dunbar, R., Freiwald, A., et al. (2012b). Resilience of cold-water scleractinian corals to ocean acidification: boron isotopic systematics of pH and saturation state up-regulation. Geochim. Cosmochim. Acta 87, 21–34. doi: 10.1016/j.gca.2012.03.027
McCulloch, M. T., D’Olivo, J. P., Falter, J., Holcomb, M., and Trotter, J. A. (2017). Coral calcification in a changing World and the interactive dynamics of pH and DIC upregulation. Nat. Commun. 8:15686. doi: 10.1038/ncomms15686
McCulloch, M. T., Holcomb, M., Rankenburg, K., and Trotter, J. A. (2014). Rapid, high-precision measurements of boron isotopic compositions in marine carbonates. Rapid Commun. Mass Spectrom. 28, 2704–2712. doi: 10.1002/rcm.7065
Mucci, A. (1983). The solubility of calcite and aragonite in seawater at various salinities, temperatures, and one atmosphere total pressure. Am. J. Sci. 283, 780–799. doi: 10.2475/ajs.283.7.780
Pokroy, B., Fieramosca, J. S., Von Dreele, R. B., Fitch, A. N., Caspi, E. N., and Zolotoyabko, E. (2007). Atomic structure of biogenic aragonite. Chem. Mater. 19, 3244–3251. doi: 10.1021/cm070187u
Pokroy, B., Fitch, A. N., Lee, P. L., Quintana, J. P., El’ad, N. C., and Zolotoyabko, E. (2006). Anisotropic lattice distortions in the mollusk-made aragonite: a widespread phenomenon. J. Struct. Biol. 153, 145–150. doi: 10.1016/j.jsb.2005.10.009
Pokroy, B., Quintana, J. P., El’ad, N. C., Berner, A., and Zolotoyabko, E. (2004). Anisotropic lattice distortions in biogenic aragonite. Nat. Mater. 3:900. doi: 10.1038/nmat1263
Politi, Y., Levi-kalisman, Y., Raz, S., Wilt, F., Addadi, L., Weiner, S., et al. (2006). Structural characterization of the transient amorphous calcium carbonate precursor phase in sea urchin embryos. Adv. Funct. Mater. 16, 1289–1298. doi: 10.1002/adfm.200600134
Roberts, J. M., Wheeler, A. J., Freiwald, A., and Cairns, S. D. (2009). Cold-Water Corals: The Biology and Geology of Deep-Sea Coral Habitats. Cambridge, MA: Cambridge University Press. doi: 10.1017/CBO9780511581588
Rodolfo-Metalpa, R., Houlbrèque, F., Tambutté,É, Boisson, F., Baggini, C., Patti, F. P., et al. (2011). Coral and mollusc resistance to ocean acidification adversely affected by warming. Nat. Clim. Change 1, 308–312. doi: 10.1038/nclimate1200
Rodolfo-Metalpa, R., Montagna, P., Aliani, S., Borghini, M., Canese, S., Hall-Spencer, J. M., et al. (2015). Calcification is not the Achilles’ heel of cold-water corals in an acidifying ocean. Glob. Change Biol. 21, 2238–2248. doi: 10.1111/gcb.12867
Roger, L. M., George, A. D., Shaw, J., Hart, R. D., Roberts, M., Becker, T., et al. (2017). Geochemical and microstructural characterisation of two species of cool-water bivalves (Fulvia tenuicostata and Soletellina biradiata) from Western Australia. Biogeosciences 14:1721. doi: 10.5194/bg-14-1721-2017
Sabine, C. L., Feely, R. A., Key, R. M., Bullister, J. L., Millero, F. J., Lee, K., et al. (2002). Distribution of anthropogenic CO2 in the Pacific Ocean. Glo. Biogeochem. Cycles 16, 30–31. doi: 10.1029/2001GB001639
Schoepf, V., Grottoli, A. G., Warner, M. E., Cai, W. J., Melman, T. F., Hoadley, K. D., et al. (2013). Coral energy reserves and calcification in a high-CO2 world at two temperatures. PLoS One 8:e75049. doi: 10.1371/journal.pone.0075049
Sharma, S. K., and Urmos, J. P. (1987). Micro-Raman Spectroscopic Studies of Materials at Ambient and High Pressures with CW and Pulsed Lasers. San Franciso, CA: San Franciso Press Inc., 133–136.
Stolarski, J., Przeniosło, R., Mazur, M., and Brunelli, M. (2007). High-resolution synchrotron radiation studies on natural and thermally annealed scleractinian coral biominerals. J. Appl. Crystallogr. 40, 2–9. doi: 10.1107/S002188980604489X
Tambutté, S., Holcomb, M., Ferrier-Pagès, C., Reynaud, S., Tambutté,É., Zoccola, D., et al. (2011). Coral biomineralization: from the gene to the environment. J. Exp. Mar. Biol. Ecol. 408, 58–78. doi: 10.1016/j.jembe.2011.07.026
Tambutté, E., Venn, A. A., Holcomb, M., Segonds, N., Techer, N., Zoccola, D., et al. (2015). Morphological plasticity of the coral skeleton under CO2-driven seawater acidification. Nat. Commun. 6:8368. doi: 10.1038/ncomms8368
Thresher, R. E., Tilbrook, B., Fallon, S., Wilson, N. C., and Adkins, J. (2011). Effects of chronic low carbonate saturation levels on the distribution, growth and skeletal chemistry of deep-sea corals and other seamount megabenthos. Mar. Ecol. Prog. Ser. 442, 87–96. doi: 10.3354/meps09400
Toby, B. H., and Von Dreele, R. B. (2013). GSAS-II: the genesis of a modern open-source all purpose crystallography software package. J. Appl. Crystallogr. 46, 544–549. doi: 10.1107/S0021889813003531
Urmos, J., Sharma, S. K., and Mackenzie, F. T. (1991). Characterization of some biogenic carbonates with Raman spectroscopy. Am. Mineral. 76, 641–646.
Von Euw, S., Zhang, Q., Manichev, V., Murali, N., Gross, J., Feldman, L. C., et al. (2017). Biological control of aragonite formation in stony corals. Science 356, 933–938. doi: 10.1126/science.aam6371
Wu, H. C., Dissard, D., Le Cornec, F., Thil, F., Tribollet, A., Moya, A., et al. (2017). Primary life stage boron isotope and trace elements incorporation in aposymbiotic Acropora millepora coral under ocean acidification and warming. Front. Mar. Sci. 4:129. doi: 10.3389/fmars.2017.00129
Keywords: deep-sea corals, Lophelia pertusa, crystallography, mineralogy, X-ray diffraction, ocean acidification, aragonite saturation state, aragonite
Citation: Farfan GA, Cordes EE, Waller RG, DeCarlo TM and Hansel CM (2018) Mineralogy of Deep-Sea Coral Aragonites as a Function of Aragonite Saturation State. Front. Mar. Sci. 5:473. doi: 10.3389/fmars.2018.00473
Received: 01 May 2018; Accepted: 26 November 2018;
Published: 10 December 2018.
Edited by:
Jessica Carilli, University of Massachusetts Boston, United StatesReviewed by:
Charles Alan Jacoby, St. Johns River Water Management District, United StatesPaulina Kaniewska, The University of Queensland, Australia
Copyright © 2018 Farfan, Cordes, Waller, DeCarlo and Hansel. This is an open-access article distributed under the terms of the Creative Commons Attribution License (CC BY). The use, distribution or reproduction in other forums is permitted, provided the original author(s) and the copyright owner(s) are credited and that the original publication in this journal is cited, in accordance with accepted academic practice. No use, distribution or reproduction is permitted which does not comply with these terms.
*Correspondence: Colleen M. Hansel, chansel@whoi.edu