Treading Water: Tools to Help US Coastal Communities Plan for Sea Level Rise Impacts
 Emily A. Smith1*
  William Sweet2
  Molly Mitchell3
  Ricardo Domingues2,4
  Christopher P. Weaver5
  Molly Baringer2
  Gustavo Goni2
  John Haines5
  J. Derek Loftis3 John Boon3 David Malmquist3
- 1University Corporation for Atmospheric Research, Cooperative Programs for the Advancement of Earth System Science (CPAESS), Silver Spring, MD, United States
- 2National Oceanic and Atmospheric Administration, Washington, DC, United States
- 3Virginia Institute of Marine Science, College of William & Mary, Gloucester Point, VA, United States
- 4Cooperative Institute for Marine and Atmospheric Studies, University of Miami, Miami, FL, United States
- 5U.S. Global Change Research Program, Washington, DC, United States
As communities grapple with rising seas and more frequent flooding events, they need improved projections of future rising and flooding over multiple time horizons, to assist in a multitude of planning efforts. There are currently a few different tools available that communities can use to plan, including the Sea Level Report Card and products generated by a United States. Federal interagency task force on sea level rise. These tools are a start, but it is recognized that they are not necessarily enough at present to provide communities with the type of information needed to support decisions that range from seasonal to decadal in nature, generally over relatively small geographic regions. The largest need seems to come from integrated models and tools. Agencies need to work with communities to develop tools that integrate several aspects (rainfall, tides, etc.) that affect their coastal flooding problems. They also need a formalized relationship with end users that allows agency products to be responsive to the various needs of managers and decision makers. Existing boundary organizations can be leveraged to meet this need. Focusing on addressing these needs will allow agencies to create robust solutions to flood risks, leading to truly resilient communities.
Introduction
Sea level rise is a real and present effect of climate change that is already impacting communities globally. The sea level is rising globally due to the thermal expansion and melting of land glaciers and ice sheets (Church and White, 2011), but that process is not uniform around the world. Regionally, there are other processes that can affect the rate of sea level changes (e.g., vertical land motion, ocean circulation changes, and weather events) relative to the land (known as relative sea level or RSL). The combined effects of these global and regional processes can lead to recurrent flooding events that are rapidly increasing in frequency and magnitude (Sweet and Park, 2014). These events pose a threat to coastal communities; human life and health; ecosystems and infrastructure; and require large efforts to prepare for and mitigate potential damage.
For communities to be able to adapt to and plan for the increasing frequency and severity of these events, they need access to appropriate information in a timely fashion and usable format. We discuss in this paper a number of products representing progress toward that goal. We also examine a few case studies of communities that are directly experiencing these more frequent effects of sea level changes today and look at how they are adapting.
Needed Information for Communities to Plan
The most critical information communities need for planning is an understanding of the likely extent and impact of future flooding on a local scale, which emphasizes RSL rise rates – and associated extreme water levels – rather than global or regional sea level rise. RSL rise can be highly variable across relatively short distances (Boon et al., 2018) and on various timescales due to the interaction of ocean dynamics, local drivers of subsidence and tectonic activity. Therefore, increasing resilience to future flood events requires that localities have a good grasp on changing conditions at their specific location for different time horizons, and how their decision-making may alter future RSL rise rates (e.g., intense groundwater withdrawal can exacerbate local subsidence). In addition, they need to understand how rising water levels will impact infrastructure, such as roads, corrosion of underground service pipes, storm sewer networks and buildings under normal and storm conditions.
To help communities plan, a broad network of tide and land subsidence monitoring is needed to compare local conditions (short term) to long term changes at historical NOAA tide gauge stations (e.g., for the United States East Coast, Figure 1). These networks serve three purposes: they reduce the uncertainty inherent in extrapolating water levels to locations remote from established gauges, they capture geographically small-scale processes, and they serve as an early warning system of human-induced changes to RSL. Comparing annual trends between such newly added stations and the existing NOAA tide gauges will allow for the earlier detection of impacts of local changes due to altered hydrodynamic conditions (such as those resulting from dredging) or altered local subsidence. Where changes are due to human action (e.g., groundwater withdrawals), corrective actions can be taken to reduce RSL rise rates and increase resilience.
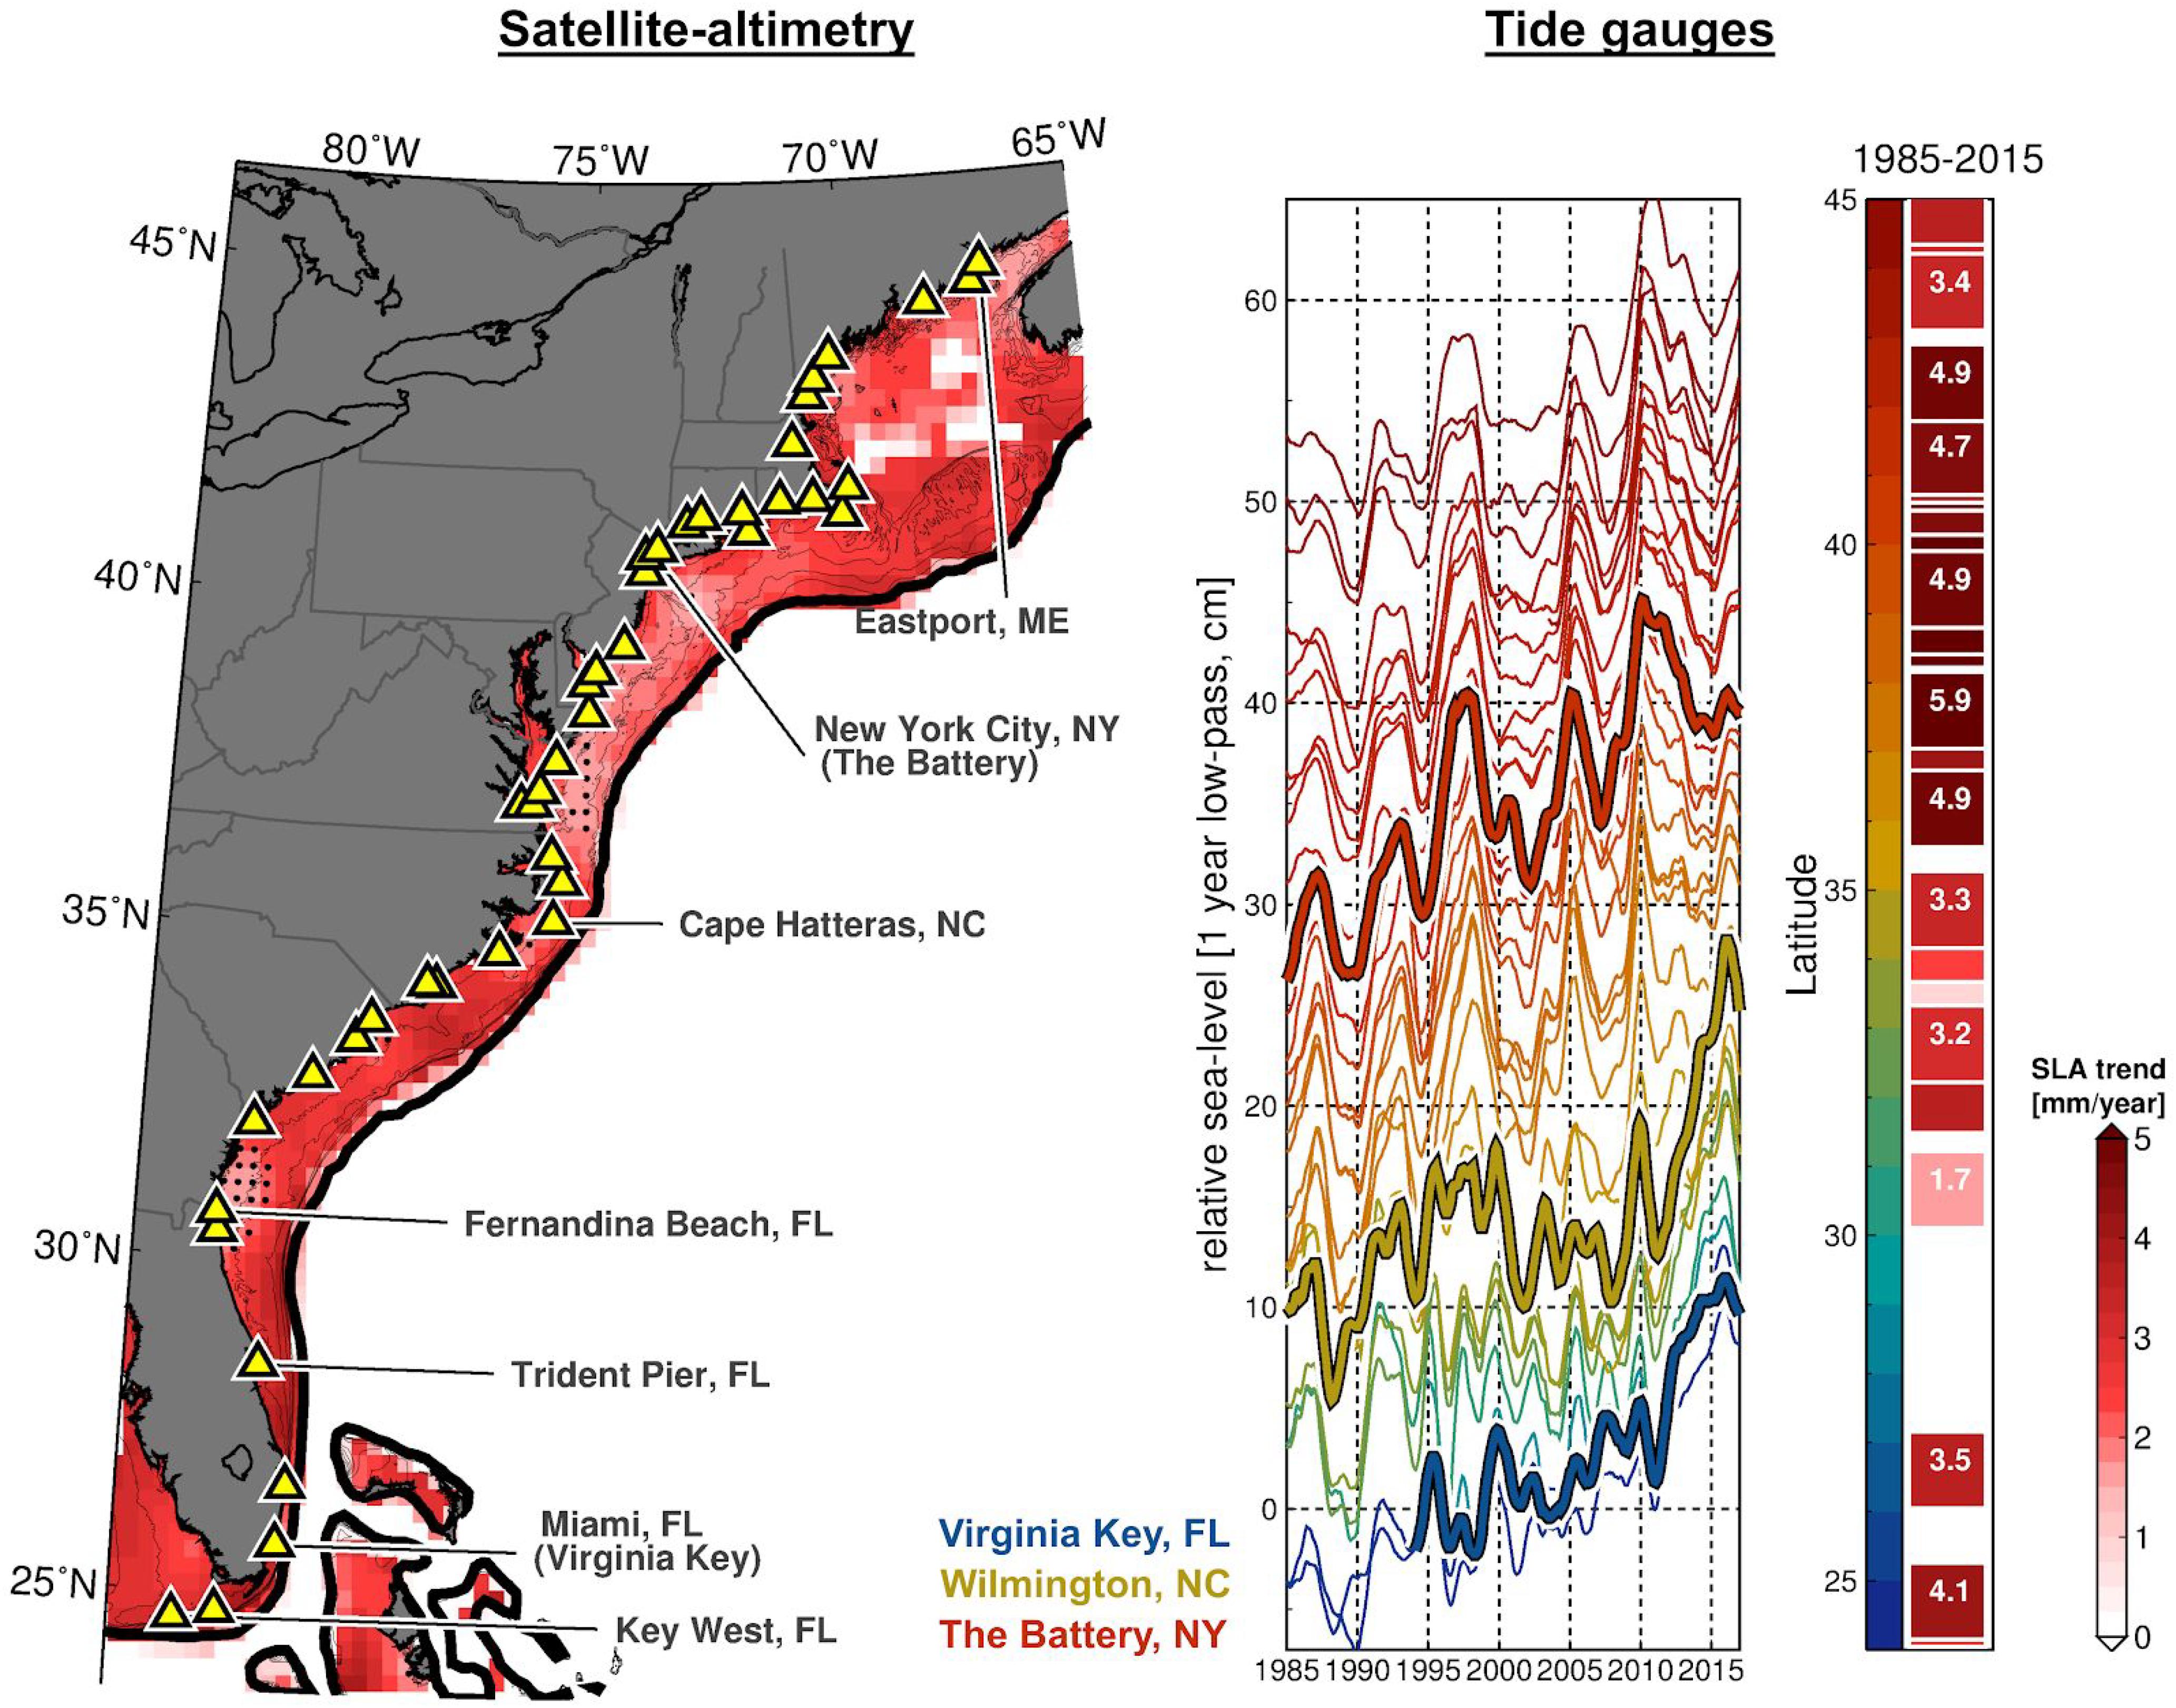
Figure 1. (Left) Location of 43 tide gauges along the United States East Coast (yellow triangles) overlaid on SLR rates estimated from satellite-altimetry for the time period of 1993–2015. (Right) 1-year low passed time series of sea level observations at the 43 tide gauges along the United States East Coast. Time-series are offset by 1.5 cm between consecutive tide gauges for display purposes, and rates of SLR for individual tide gauges are shown to the right for the time period of 1985–2015.
It is informative to know how local RSL rise has changed respective to regional and global trends over the last several decades; however, using historical data for long-term projections (e.g., end of century) may not be appropriate as future warming is likely to continue to drive an increasingly accelerated rise (e.g., Church and White, 2011; Sweet et al., 2017a) which cannot be captured in a historic record. However, sufficiently long data records of about 50 years (Boon and Mitchell, 2015), capturing important modes of variability such as annual and decadal cycles (Menéndez and Woodworth, 2010), may provide some predictive capacity important in shorter time scales, which is very important for immediate planning purposes and horizons (e.g., <30 years). This planning horizon is appropriate for many municipal-level adaptations and fits into their decision-making processes (e.g., The World Bank, 2010; Public Water Supply Utilities Climate Impact Working Group.Workshop [PWSUCIWG], 2012; Mitchell et al., 2013). For longer planning horizons (e.g., 50–100 years in the future), which are critical for risk management associated with large scale projects and projects with long lifespans, scenarios of regional sea level rise (Sweet et al., 2017b) are recommended. These projections are based on global-process models, incorporating the impact of changing climatic (over land in the ocean and atmospheric) conditions on sea level variables. They provide multiple scenarios which allow the consideration of uncertainty to be incorporated into planning efforts; leading to more robust decision making.
Moving from scenarios of projected water levels to those of projected flood impacts can be done simply, using “bathtub” mapping, where water levels are raised evenly across a digital elevation surface; but for some planning efforts, incorporating hydrodynamic models in to RSL rise mapping can provide localities with more realistic outcomes. The first type of model is useful for broad assessments of potential impacts, such as determining lifespans of roads; areas unsuitable for residential construction; and where adaptation strategies should be targeted. More detailed analyses, such as the impact of different adaptation solutions (e.g., adding tide gates, sea walls, constructing living shorelines, and elevating structures), or incorporating stormwater drainage systems into planning considerations, benefit from more dynamic models (Loftis, 2014; Wang et al., 2014). This approach requires high resolution elevation data, highly predictive models, and robust validation measures. For example, in Hampton Roads, Virginia, a street-level flooding model was compared to nearly 60,000 crowd-sourced GPS “King Tide” water levels, to validate inundation predictions (Loftis et al., 2017). The crowd-sourced data was used to improve the model fit, particularly in areas where tree cover, bridge overpasses, and culverts resulted in poor Lidar coverage. Validating hydrodynamic models with integrated observations from sensors to citizen science is useful to compare impacts of different resilience strategies, thus improving decision making (Loftis et al., 2018).
Tools Currently Available
Sea Level Report Card
Sea-Level Report Cards1 are an annually updated, web-based tool used to monitor and project changes in the sea level at 32 tide gauges along the United States coastline. Each station has three components:
(1) Projection of sea-level height to the year 2050
(2) Display of recent trends in the rates of sea-level change
(3) Explanation of processes affecting the sea level at each locality
The history and projections of each tide gauge can be used to inform management and, therefore, aid in potentially reducing future flood impacts by helping localities understand which forcing processes are most important to the long-term record and how their area may vary from others along their coast. Annual monitoring allows for early identification of changes in trends which might alter sea level trajectories, changing future forecasted water levels.
Federal Sea Level Rise and Coastal Flood Hazard Scenarios and Tools Interagency Task Force
A Task Force was convened in 2015 to coordinate the development and effective delivery of foundational scientific data products, information systems, and analyses to support hazard mitigation and risk management planning and decision-making in the coastal zone. These include products related to historical and future global, regional, and local SLR and associated extreme water levels, coastal flooding, wave action, coastal erosion, and shoreline changes. Its first major deliverable was the development of gridded future scenarios of relative SLR for the entire United States coastline (Sweet et al., 2017b) and the results of this work were made available via an interactive website supported by NOAA2 and by the United States Geological Survey (USGS3). The scenarios adjusted upward global mean sea level (GMSL) rise amounts based on new science since from the Third National Climate Assessment (NCA) (Parris et al., 2012). The NCA’s revised range of 0.3–2.5 m GMSL rise by the year 2100 spans the range of scientifically plausible future SLR across a variety of assumptions about future greenhouse gas emissions, climate system responses to those emissions, and the behavior of the Greenland and Antarctic ice sheets. The approach of Kopp et al. (2014) was leveraged to provide estimates of the probability of GMSL rise and underlying contributing processes, conditional upon greenhouse-gas emission scenarios.
These global scenarios were then used to derive regional SLR responses on a 1-degree grid covering the coastlines of the United States mainland, Alaska, Hawaii, the Caribbean, and the Pacific island territories, as well as at the locations of individual tide gauges in between these grid cell centers. These regional scenarios were provided for six discrete GMSL rise scenarios, referred to as Low (0.3 m), Intermediate-Low (0.5 m), Intermediate (1.0 m), Intermediate-High (1.5 m), High (2.0 m), and Extreme (2.5 m). GMSL was then adjusted to account for key factors important at regional scales, including:
(1) Shifts in oceanographic variables such as circulation patterns;
(2) Changes in the Earth’s gravitational field and rotation, and the flexure of the crust and upper mantle, due to melting of land-based ice; and
(3) Vertical land movement (VLM; subsidence or uplift) due to glacial isostatic adjustment, sediment compaction, groundwater and fossil fuel withdrawals, and other non-climatic factors.
Follow-on work of the Task Force used the SLR scenarios to produce future decadal estimates of high tide flood frequencies, whose impacts would be some of the first impacts of SLR and likely force initial adaptation responses (Sweet et al., 2018). A subset of the high tide flood frequency projections is available at: https://crt-climate-explorer.nemac.org/. Currently, NOAA is tracking mean sea levels relative to these scenarios to assist locations in monitoring the trajectory of local sea levels (e.g., see “Regional Scenarios” for Norfolk VA). Currently, most locations more or less track the “Low Scenario,” since this scenario is basically a local/regional manifestation of the 3 mm/year global rise rate over the last couple of decades. Future projections are expected to rise somewhere between 0.5 and 1.0 m, which represent the low-end and high-end of likely rise (17th and 83rd%) under Representative Concentration Pathways (RCP) RCP4.5 and RCP8.5 conditions. This set of authoritative Federal interagency scenarios has been integrated into a variety of coastal risk management tools and capabilities deployed by individual agencies, including NOAA’s Sea Level Rise Viewer (see text foot note 3), the USACE Sea Level Calculator4, and the USGS Coastal Change Hazards Portal– as well provided online through an interactive GIS interface and associated story map5.
We only present a couple of examples of available tools, but there are other available resources publicly available such as Sea Level Rise Viewer6, Digital Coast7, NASA’s Sea Level Change page8 to offer additional information for planning purposes.
Case Study: United States East Coast Sea Level Changes
Some areas around the world are more vulnerable to SLR than others. Here we present one study of a vulnerable shore.
The United States East Coast includes several highly populated and low-lying urban areas that are affected by recurrent nuisance flooding events during high tides, making this region particularly vulnerable to SLR. Nuisance flooding events, which are defined by the National Weather Service as flooding between about 0.3 and 0.7 above high tide, have been increasing in frequency along the United States East Coast, and are further projected to intensify during this century (Sweet et al., 2018). Even though these events are not usually associated with damaging flooding conditions, they can cause disruption of sensitive services including urban transportation (e.g., Suarez et al., 2005), degradation of wastewater (e.g., Flood and Cahoon, 2011), and saltwater intrusion in aquifers (e.g., Sukop et al., 2018). In order to maintain resilient coastal communities, planning and adaptation efforts are already in place in many large cities including Miami (Miami-Dade County, 2010) and New York City (Rosenzweig and Solecki, 2010). Sea level changes are continuously monitored along the United States East coast by 43 NOAA tide gauges (Figure 1). In addition, Sea-Level Report Cards9 provide easy access to the latest updates on SLR rates and changes along this region, allowing stakeholders, coastal managers, and planners to prepare accordingly. It shows, for example, that over the past several decades, the sea level has been increasing steadily along the United States East Coast at rates ranging from 1.2 to 5.1 mm per year, with an estimated linear (quadratic) increase in sea levels by 2050 of 13 cm (24 cm) in Key West, FL, and of 29 cm (49 cm) in Norfolk, VA, United States. Which trend (linear or quadratic) best explains the current trajectory, varies from location to location. An analysis of this question can be found in Boon and Mitchell (2015). Processes linked with ocean heat uptake (steric SLR) and polar ice sheets melting are also identified as the primary drivers for long-term SLR in the region. The combined effect of various global and regional forcing mechanisms mentioned previously, can determine the mean sea level and the occurrence of flooding above a local threshold, generally during high amplitude spring tides. Ocean Dynamics, for example, even though indicated as a negligible driver for long-term SLR in the United States East Coast Sea-Level Report Card, are known for driving sizeable contributions to coastal nuisance flooding in the region over short timescales (e.g., Sweet et al., 2016; Baringer et al., 2017). Table 1 (adapted from Sweet et al., 2017b) summarizes some of the key components causing sea level changes, along with their dominant timescale and response magnitude.
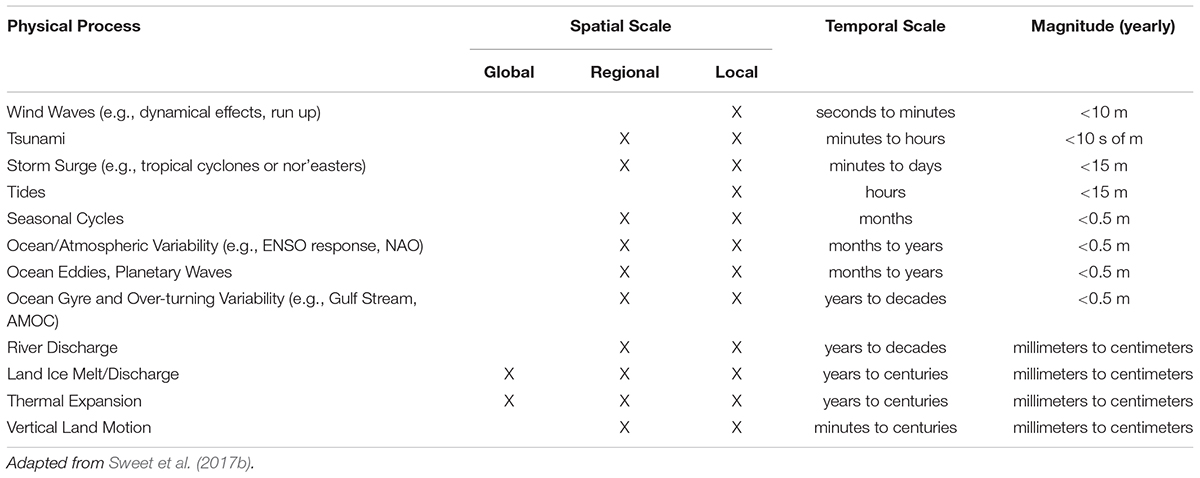
Table 1. Spatial and temporal scales of geophysical processes affecting water levels.
Over the past few years, recurrent flooding conditions in major cities along the United States East Coast such as New York City, Norfolk, Miami, and others (see Figure 6 of Sweet et al., 2018) have attracted particular attention from the media, and from the scientific community in search of answers for potential driving mechanisms. Some of the key mechanisms identified include those linked with natural modes of variability such as the North Atlantic Oscillation (NAO) and the El Nino Southern Oscillation (ENSO) (e.g., Sweet and Marra, 2015; Valle-Levinson et al., 2017; Sweet et al., 2018), which can modulate both mean sea level or synoptic variability (storm track tendencies). Sea level changes associated with these modes will generally result from variations in atmospheric pressure (Piecuch and Ponte, 2015), near-shore wind conditions (Woodworth et al., 2014; Thompson and Mitchum, 2014), and in large-scale ocean heat content in the region (Domingues et al., 2018). For example, it was estimated that about 50% of the observed sea level rise of ∼8 cm along the Northeast United States Coast during 2008–2010 was accounted for by low atmospheric pressure conditions observed, linked with an extremely low NAO (Piecuch and Ponte, 2015). From 2010 to 2015, increase in atmospheric pressure linked with near-neutral NAO conditions accounted for a net decline of 5–10 cm in the sea level between Cape Hatteras and Eastport. Over the same time period, a rapid increase of over 10 cm in the sea level along the Southeast United States coast was largely caused by the warming of the Florida Current, which can account for year-to-year changes in the sea level as large as 20 cm (Domingues et al., 2018).
In addition to natural modes of variability along the United States East Coast, work toward understanding the variability from western boundary currents (Florida Current and Gulf Stream), has been studied for their impact on sea levels. The underlying geostrophic dynamics of these currents imply that the cross-stream slope of the sea level is proportional to the intensity of their flow. In general, a decline of 1 Sv (1 Sv = 106 m3 s–1) in their transport can cause a 0.5–5.0 cm rise in sea levels along the United States East Coast (Ezer et al., 2013; Woodworth et al., 2014; Goddard et al., 2015; Ezer, 2016; Sweet et al., 2016). This is important, as changes in the Florida Current and Gulf Stream transports can result from various forcing mechanisms (i.e., baroclinic Rossby waves originated in the east North Atlantic) that may take years to reach the United States East Coast (Domingues et al., 2016; Calafat et al., 2018). In addition, because changes in the Florida Current transport can amount to ∼10 Sv change (Schott et al., 1988; Meinen et al., 2010), it is common for widespread nuisance-flooding events along the United States East Coast to coincide with low transport (Sallenger et al., 2012; Ezer and Atkinson, 2014; Sweet et al., 2016; Baringer et al., 2017). In fact, the increased sea level rise observed in the Northeast United States coast during 2008–2010 was pre-dominantly attributed to a weakening by 30% of the Gulf Stream and AMOC (Ezer, 2015; Goddard et al., 2015).
Conclusion
The information needed for robust sea level rise resilience planning requires an understanding of the drivers of sea level rise, and how those drivers are changing and interacting with local conditions. This is an active area of research, but there are still several questions that have been raised here that require further work. Having nationally available, locally tailored, toolbox solutions can help efficiently advise planning, mitigation practices, and emergency management protocols at a community scale. A number of tools have been developed over the past few years, which are being incorporated into resilience planning in some areas, but nothing yet on a national level in the United States. These types of products must be continually updated and informed by the most recent scientific understanding in order to be useful. This requires a commitment by local, state and federal decision makers to support tool maintenance. In addition, the existing tools are aimed at reducing flood impacts. Other sea level rise impacts (e.g., salinization of water supply) have received far less attention. The creation of tools to address these impacts should be considered a priority.
The two largest needs that agencies need to coordinate efforts on are integrated models and defined end user engagement processes. Integrated models would combine both multiple flood pathways (e.g., sea level rise, precipitation, and built infrastructure) into a single model. In addition, they should communicate in multiple ways to meet the needs of different stakeholders. Some stakeholders will want a single planning target (for example, the worst-case extent of flooding in 2050 under sea level rise and a major hurricane) while other stakeholders prefer flood probabilities that are more analogous to the current 100- and 500-year flood plains. Accomplishing risk communication in formats most relevant to end users leads directly to the need for a defined engagement process. Formal and responsive relationships between scientists and end users may be mediated through existing boundary organizations. Boundary organizations are already engaged in a two-way dialog with end users, both in translating science and understanding local issues. Therefore, they are perfectly placed to act as intermediaries; however, a formal structure of communication still needs to be developed. Tackling these two needs is possible within the next decade and agencies should be encouraged to take this holistic approach to addressing challenging problems such as sea level rise. Focusing on addressing these needs will allow agencies to create robust solutions to flood risks, leading to truly resilient communities.
Author Contributions
All authors listed have made a substantial, direct and intellectual contribution to the work, and approved it for publication.
Conflict of Interest Statement
The authors declare that the research was conducted in the absence of any commercial or financial relationships that could be construed as a potential conflict of interest.
Footnotes
- ^ http://www.vims.edu/research/products/slrc/index.php
- ^ https://coast.noaa.gov/slr/
- ^ http://arcg.is/1He0Tz
- ^ http://corpsmapu.usace.army.mil/rccinfo/slc/slcc_calc.html
- ^ http://usgs.maps.arcgis.com/apps/Cascade/index.html?appid=668f6dc7014d45228c993302d3eab2f5
- ^ https://coast.noaa.gov/digitalcoast/tools/slr
- ^ https://coast.noaa.gov/digitalcoast/
- ^ https://sealevel.nasa.gov/
- ^ http://www.vims.edu/research/products/slrc/compare/east_coast/index.php
References
Baringer, M. O., Smeed, D. A., Willis, J., Lankhorst, M., Hobbs, W. R., Dong, S., et al. (2017). Meridional overturning and oceanic heat transport circulation observations in the North Atlantic Ocean in “State of the climate in 2016”. Bull. Am. Meteorol. Soc. 98, S84–S87.
Boon, J. D., and Mitchell, M. (2015). Nonlinear change in Sea Level Observed at North American Tide Stations. J. Coast. Res. 31, 1295–1305. doi: 10.2112/JCOASTRES-D-15-00041.1
Boon, J. D., Mitchell, M., Loftis, J. D., and Malmquist, D. L. (2018). “Anthropocene Sea Level Change: A History of Recent Trends Observed in the U.S. East, Gulf and West Coast Regions,” in Special Report in Applied Marine Science and Ocean Engineering (SRAMSOE) No. 467, (Gloucester Point, VA: Virginia Institute of Marine Science).
Calafat, F. M., Wahl, T., Lindsten, F., Williams, J., and Frajka-Williams, E. (2018). Coherent modulation of the sea-level annual cycle in the United States by Atlantic Rossby waves. Nat. Commun. 9:2571. doi: 10.1038/s41467-018-04898-y
Church, J. A., and White, N. J. (2011). Sea-level rise from the late 19th to the early 21st century. Surv. Geophys. 32, 585–602. doi: 10.1007/s10712-011-9119-1
Domingues, R., Baringer, M., and Goni, G. (2016). Remote sources for year-to-year changes in the seasonality of the Florida current transport. J. Geophys. Res. Oceans 121, 7547–7559. doi: 10.1002/2016jc012070
Domingues, R., Goni, G., Baringer, M., and Volkov, G. (2018). What caused the accelerated sea level changes along the United States East Coast during 2010-2015? Geophys. Res. Lett. 45, 367–373.
Ezer, T. (2015). Detecting changes in the transport of the Gulf Stream and the Atlantic overturning circulation from coastal sea level data: the extreme decline in 2009–2010 and estimated variations for 1935–2012. Glob. Planet. Chang. 129, 23–36. doi: 10.1016/j.gloplacha.2015.03.002
Ezer, T. (2016). Can the Gulf Stream induce coherent short-term fluctuations in sea level along the US East Coast? A modeling study. Ocean Dyn. 66, 207–220. doi: 10.1007/s10236-016-0928-0
Ezer, T., and Atkinson, L. P. (2014). Accelerated flooding along the US East coast: on the impact of sea-level rise, tides, storms, the Gulf Stream, and the North Atlantic oscillations. Earth’s Future 2, 362–382. doi: 10.1002/2014ef000252
Ezer, T., Atkinson, L. P., Corlett, W. B., and Blanco, J. L. (2013). Gulf Stream’s induced sea level rise and variability along the US mid-Atlantic coast. J. Geophys. Res. Oceans 118, 685–697. doi: 10.1002/jgrc.20091
Flood, J. F., and Cahoon, L. B. (2011). Risks to coastal wastewater collection systems from sea-level rise and climate change. J. Coast. Res. 27, 652–660. doi: 10.2112/jcoastres-d-10-00129.1
Goddard, P. B., Yin, J., Griffies, S. M., and Zhang, S. (2015). An extreme event of sea-level rise along the Northeast coast of North America in 2009–2010. Nat. Commun. 6:6346. doi: 10.1038/ncomms7346
Kopp, R. E., Horton, R. M., Little, C. M., Mitrovica, J. X., Oppenheimer, M., Rasmussen, D. J., et al. (2014). Probabilistic 21st and 22nd century sea-level projections at a global network of tide-gauge sites. Earth’s Future 2, 383–406. doi: 10.1002/2014ef000239
Loftis, J. D. (2014). Development of a Large-Scale Storm Surge and High-Resolution Sub-Grid Inundation Model for Coastal Flooding Applications: A Case Study during Hurricane Sandy. Ph.D. Dissertation, College of William & Mary, Williamsburg, VA.
Loftis, J. D., Mitchell, M., Atkinson, L., Hamlington, B., Allen, T. R., Forrest, D., et al. (2018). Integrated ocean, earth and atmospheric observations in hampton roads, Virginia. Mar. Technol. Soc. J. 52, 68–83. doi: 10.4031/mtsj.52.2.8
Loftis, J. D., Wang, H., Forrest, D., Rhee, S., and Nguyen, C. (2017). “Emerging Flood Model Validation Frameworks for Street-Level Inundation Modeling with StormSense. SCOPE ’17,” in Proceedings of the 2nd International Workshop on Science of Smart City Operations and Platforms Engineering, Pittsburgh, PA.
Meinen, C. S., Baringer, M. O., and Garcia, R. F. (2010). Florida current transport variability: an analysis of annual and longer-period signals. Deep Sea Res. Part I Oceanogr. Res. Pap. 57, 835–846. doi: 10.1016/j.dsr.2010.04.001
Menéndez, M., and Woodworth, P. L. (2010). Changes in extreme high water levels based on a quasi-global tide-gauge data set. J. Geophys. Res. Oceans 115:C10011.
Miami-Dade County (2010). Green Print – Our Design for a Sustainable Future. Available at: http://www.miamidade.gov/greenprint/home.asp (accessed January 1, 2018).
Mitchell, M., Hershner, C., Herman, J., Schatt, D., Eggington, E., and Stiles, S. (2013). Recurrent Flooding Study for Tidewater Virginia. Virginia Senate Document No. 3. Gloucester Point, VA: Virginia Institute of Marine Science, College of William and Mary.
Parris, A. S., Bromirski, P., Burkett, V., Cayan, D. R., Culver, M. E., Hall, J., et al. (2012). Global Sea Level Rise Scenarios for the United States National Climate Assessment. Silver Spring, MD: NOAA.
Piecuch, C. G., and Ponte, R. M. (2015). Inverted barometer contributions to recent sea level changes along the northeast coast of North America. Geophys. Res. Lett. 42, 5918–5925. doi: 10.1002/2015gl064580
Public Water Supply Utilities Climate Impact Working Group.Workshop [PWSUCIWG] (2012). PWSUCIWG. Available at: http://floridawca.org/sites/default/files/documents/WorshopSummaryJan20-PWSU-CIWGfinal.pdf (accessed February 28, 2012).
Rosenzweig, C., and Solecki, W. (2010). Introduction to climate change adaptation in New York City: building a risk management response. Ann. N.Y. Acad. Sci. 1196, 13–18. doi: 10.1111/j.1749-6632.2009.05306.x
Sallenger, A. H. Jr., Doran, K. S., and Howd, P. A. (2012). Hotspot of accelerated sea-level rise on the Atlantic coast of North America. Nat. Clim. Change 2:884. doi: 10.1038/nclimate1597
Schott, F. A., Lee, T. N., and Zantopp, R. (1988). Variability of structure and transport of the Florida Current in the period range of days to seasonal. J. Phys. Oceanogr. 18, 1209–1230. doi: 10.1175/1520-0485(1988)018<1209:vosato>2.0.co;2
Suarez, P., Anderson, W., Mahal, V., and Lakshmanan, T. R. (2005). Impacts of flooding and climate change on urban transportation: a systemwide performance assessment of the Boston Metro Area. Transport. Res. Part D Transport Environ. 10, 231–244. doi: 10.1016/j.trd.2005.04.007
Sukop, M. C., Rogers, M., Guannel, G., Infanti, J. M., and Hagemann, K. (2018). High temporal resolution modeling of the impact of rain, tides, and sea level rise on water table flooding in the Arch Creek basin, Miami-Dade County Florida USA. Sci. Total Environ. 616, 1668–1688. doi: 10.1016/j.scitotenv.2017.10.170
Sweet, W., Dusek, G., Obeysekera, J., and Marra, J. (2018). Patterns and Projections of High Tide Flooding Along the U.S. Coastline Using a Common Impact Threshold. NOAA Technical Report NOS CO-OPS, Vol. 86. Silver Spring, MA: National Oceanic and Atmospheric Administration.
Sweet, W. V., Horton, R., Kopp, R. E., LeGrande, A. N., and Romanou, A. (2017a). “Sea level rise,” in Climate Science Special Report: Fourth National Climate Assessment, Volume I, eds D. J. Wuebbles, D. W. Fahey, K. A. Hibbard, D. J. Dokken, B. C. Stewart, and T. K. Maycock (Washington, DC: U.S. Global Change Research Program).
Sweet, W. V., Kopp, R., Weaver, C. P., Obeysekera, J., Horton, R., Thieler, E., et al. (2017b). Global and Regional Sea Level Rise Scenarios for the United States. NOAA Technical Report NOS CO-OPS, Vol. 83. Silver Spring, MA: National Oceanic and Atmospheric Administration.
Sweet, W. V., and Marra, J. J. (2015). 2014 State of Nuisance Tidal Flooding [Supplement in NOAA NCEI, State of the CLIMATE. Available at: http://www.ncdc.noaa.gov/sotc/national/201508 (accessed August 2015).
Sweet, W. V., Menendez, M., Genz, A., Obeysekera, J., Park, J., and Marra, J. J. (2016). In tide’s way: southeast florida’s september 2015 sunny-day flood. Bull. Am. Meteorol. Soc. 97, S25–S30.
Sweet, W. V., and Park, J. (2014). From the extreme to the mean: acceleration and tipping points of coastal inundation from sea level rise. Earth’s Future 2, 579–600. doi: 10.1002/2014ef000272
The World Bank (2010). Climate Risks and Adaptation in Asian Coastal Megacities: A Synthesis Report. 2010. The International Bank for Reconstruction and Development. Washington, DC: THE WORLD BANK.
Thompson, P. R., and Mitchum, G. T. (2014). Coherent sea level variability on the North Atlantic western boundary. J. Geophys. Res. Oceans 119, 5676–5689. doi: 10.1002/2014JC009999
Valle-Levinson, A., Dutton, A., and Martin, J. B. (2017). Spatial and temporal variability of sea level rise hot spots over the eastern United States. Geophys. Res. Lett. 44, 7876–7882. doi: 10.1002/2017gl073926
Wang, H. V., Loftis, J. D., Liu, Z., Forrest, D., and Zhang, J. (2014). The storm surge and sub-grid inundation modeling in New York city during hurricane sandy. J. Mar. Sci. Eng. 2, 226–246. doi: 10.3390/jmse2010226
Keywords: sea level, coastal processes, inundation, sea level rise, community planning
Citation: Smith EA, Sweet W, Mitchell M, Domingues R, Weaver CP, Baringer M, Goni G, Haines J, Loftis JD, Boon J and Malmquist D (2019) Treading Water: Tools to Help US Coastal Communities Plan for Sea Level Rise Impacts. Front. Mar. Sci. 6:300. doi: 10.3389/fmars.2019.00300
Received: 31 October 2018; Accepted: 21 May 2019;
Published: 21 June 2019.
Edited by:
Nuria Marba, Spanish National Research Council (CSIC), SpainReviewed by:
Gabriel Jorda, University of the Balearic Islands, SpainGuillem Chust, Centro Tecnológico Experto en Innovación Marina y Alimentaria (AZTI), Spain
Copyright © 2019 Smith, Sweet, Mitchell, Domingues, Weaver, Baringer, Goni, Haines, Loftis, Boon and Malmquist. This is an open-access article distributed under the terms of the Creative Commons Attribution License (CC BY). The use, distribution or reproduction in other forums is permitted, provided the original author(s) and the copyright owner(s) are credited and that the original publication in this journal is cited, in accordance with accepted academic practice. No use, distribution or reproduction is permitted which does not comply with these terms.
*Correspondence: Emily A. Smith, emily.a.smith@noaa.gov