Seasonal Variations of Marine Environment and Primary Production in the Taiwan Strait
 Hsiao-Chun Tseng1
  Wan-Lynn You1 Wei Huang1
  Chih-Ching Chung1
  An-Yi Tsai1
  Tzong-Yueh Chen1 Kuo-Wei Lan2
  Gwo-Ching Gong1,3*
- 1Institute of Marine Environment and Ecology, National Taiwan Ocean University, Keelung, Taiwan
- 2Department of Environmental Biology and Fisheries Science, National Taiwan Ocean University, Keelung, Taiwan
- 3Center of Excellence for the Oceans, National Taiwan Ocean University, Keelung, Taiwan
The first data set of seasonal marine environment and euphotic zone integrated primary production (IP) variations in the Taiwan Strait was reported. The measured annual IP was 123 ± 86 gC m–2 year–1 (338 ± 235 mgC m–2 day–1), and its seasonal variations can be described with a left-skewed normal distribution curve. The average seasonal IP values from the highest to the lowest were summer (664 ± 270 mgC m–2 day–1), autumn (350 ± 118 mgC m–2 day–1), spring (202 ± 110 mgC m–2 day–1), and winter (137 ± 68 mgC m–2 day–1). The lowest IP was during the nutrient-rich winter because it had a short insolation duration, low incident photosynthetic active radiation (PAR) and low light transmission (shallow euphotic zone depth) due to strong vertical mixing. In contrast to the winter, the highest IP was during the nutrient-depleted summer, which had a long insolation duration, high incident PAR and high light transmission (deeper euphotic zone depth). In addition, the heterotrophic nutrients from upwelling in the south might also support the highest IP in summer. As three primary water masses exist in the Taiwan Strait and three of them have different characteristics, different mixing ratios of water masses may cause different chemical and hydrographic conditions, which leads to different levels of Chl a concentrations and primary production. It is worth to mention that offshore wind farm (OWF) construction in the Changyun Rise (CYR) of the Taiwan Strait is on-going. As primary production is the foundation for a marine ecosystem and supports the food web and fish stock, the results of this research can not only be used as the baseline for evaluating the OWF impact on the marine ecosystem but also be used for assessing their influence on fishery resources.
Introduction
The Taiwan Strait, with an average depth of 60 m, is located in the western Pacific Ocean and is an important channel in transporting water and chemical constituents between the East China Sea and the South China Sea (Chen et al., 2010; Hong et al., 2011; Huang et al., 2015). It is also an important path way for ship navigation and fish migration (Hong et al., 2011). The Taiwan Strait is strongly influenced by the East Asian monsoon. Wind stress explains a majority of the transport reversals (Ko, 2003). As the wind directions have changed, the transportations and circulations of water masses in the Taiwan Strait have changed (Jan et al., 2002, 2006, 2010; Chen, 2003, 2011; Chen and Sheu, 2006; Wu et al., 2007; Chen et al., 2010). The wind fields over the strait are southwesterly dominated in summer and northeasterly dominated in winter. Seasonal changes of the wind directions have resulted in different currents and circulations, which brings different water masses into the Taiwan Strait (Jan et al., 2006). Jan et al. (2010) revealed three primary water masses in the Taiwan Strait: the Kuroshio Branch Water (KBW) with high temperature and high salinity, the Mixed China Coastal Water (MCCW) with low temperature and low salinity, and the South China Sea Water (SCSW) with intermediate temperature and salinity. Additionally, tropical storms and typhoons also influence this area during the summer via induced heavy rainfall, strong vertical water mixing or upwelling (Ko et al., 2016). Jan et al. (2002) pointed out that the deep Penghu Channel guides the intruding KBW northward into the Changyun Rise (CYR) and partially blocks along-strait transport on the eastern side of the strait in winter. On the other hand, the MCCW is conveyed by the northeast monsoon-driven flow to the northern Taiwan Strait during the winter (Jan et al., 2002). In addition, Jan et al. (2010) found that the source water in the Taiwan Strait comes from the SCSW in summer. Huang et al. (2018) also reported that during the summer and autumn, the main water mass in the Penghu Channel is the SCSW. Moreover, since precipitation is heavier in summer, water in the top layer is warmer and fresher during the summer than during the autumn (Huang et al., 2018). As three primary water masses in the Taiwan Strait have different characteristics, different mixing ratios of water masses may cause different chemical and hydrographic conditions. This dynamic will lead to differing levels in chlorophyll a (Chl a) and primary production, which may be influenced by the phytoplankton community structure (Hong et al., 2011).
Since the wind energy potential of the offshore areas of Taiwan’s west coast is excellent (Archer and Jacobson, 2005; Fang, 2014; Chen et al., 2015) and Taiwanese government has sought to increase the use of renewable energy, 14 offshore wind farms (OWFs) are planned for installation in the CYR of the Taiwan Strait, offshore of Changhua county (Figure 1). They will have a wind power capacity of approximately 2400 MW, which will occupy 62.6% of the total offshore wind power capacity in Taiwan. Although wind energy is commonly recognized as a clean and environmentally friendly renewable energy resource, the potential environmental impacts due to installation, operation, maintenance and removal phases of the wind turbines cannot be ignored (Wilhelmsson and Malm, 2008; Smyth et al., 2015). Therefore, marine environmental investigations before OWF installation are needed to ensure and maintain the sustainability of both the social economy and marine environment. To understand the seasonal variations of marine environment and primary production in the Taiwan Strait and possible future impact of OWF on marine ecosystem, four seasonal cruises in 2017 were conducted. Hydrography, nutrients, Chl a and primary production conditions were investigated during the cruises.
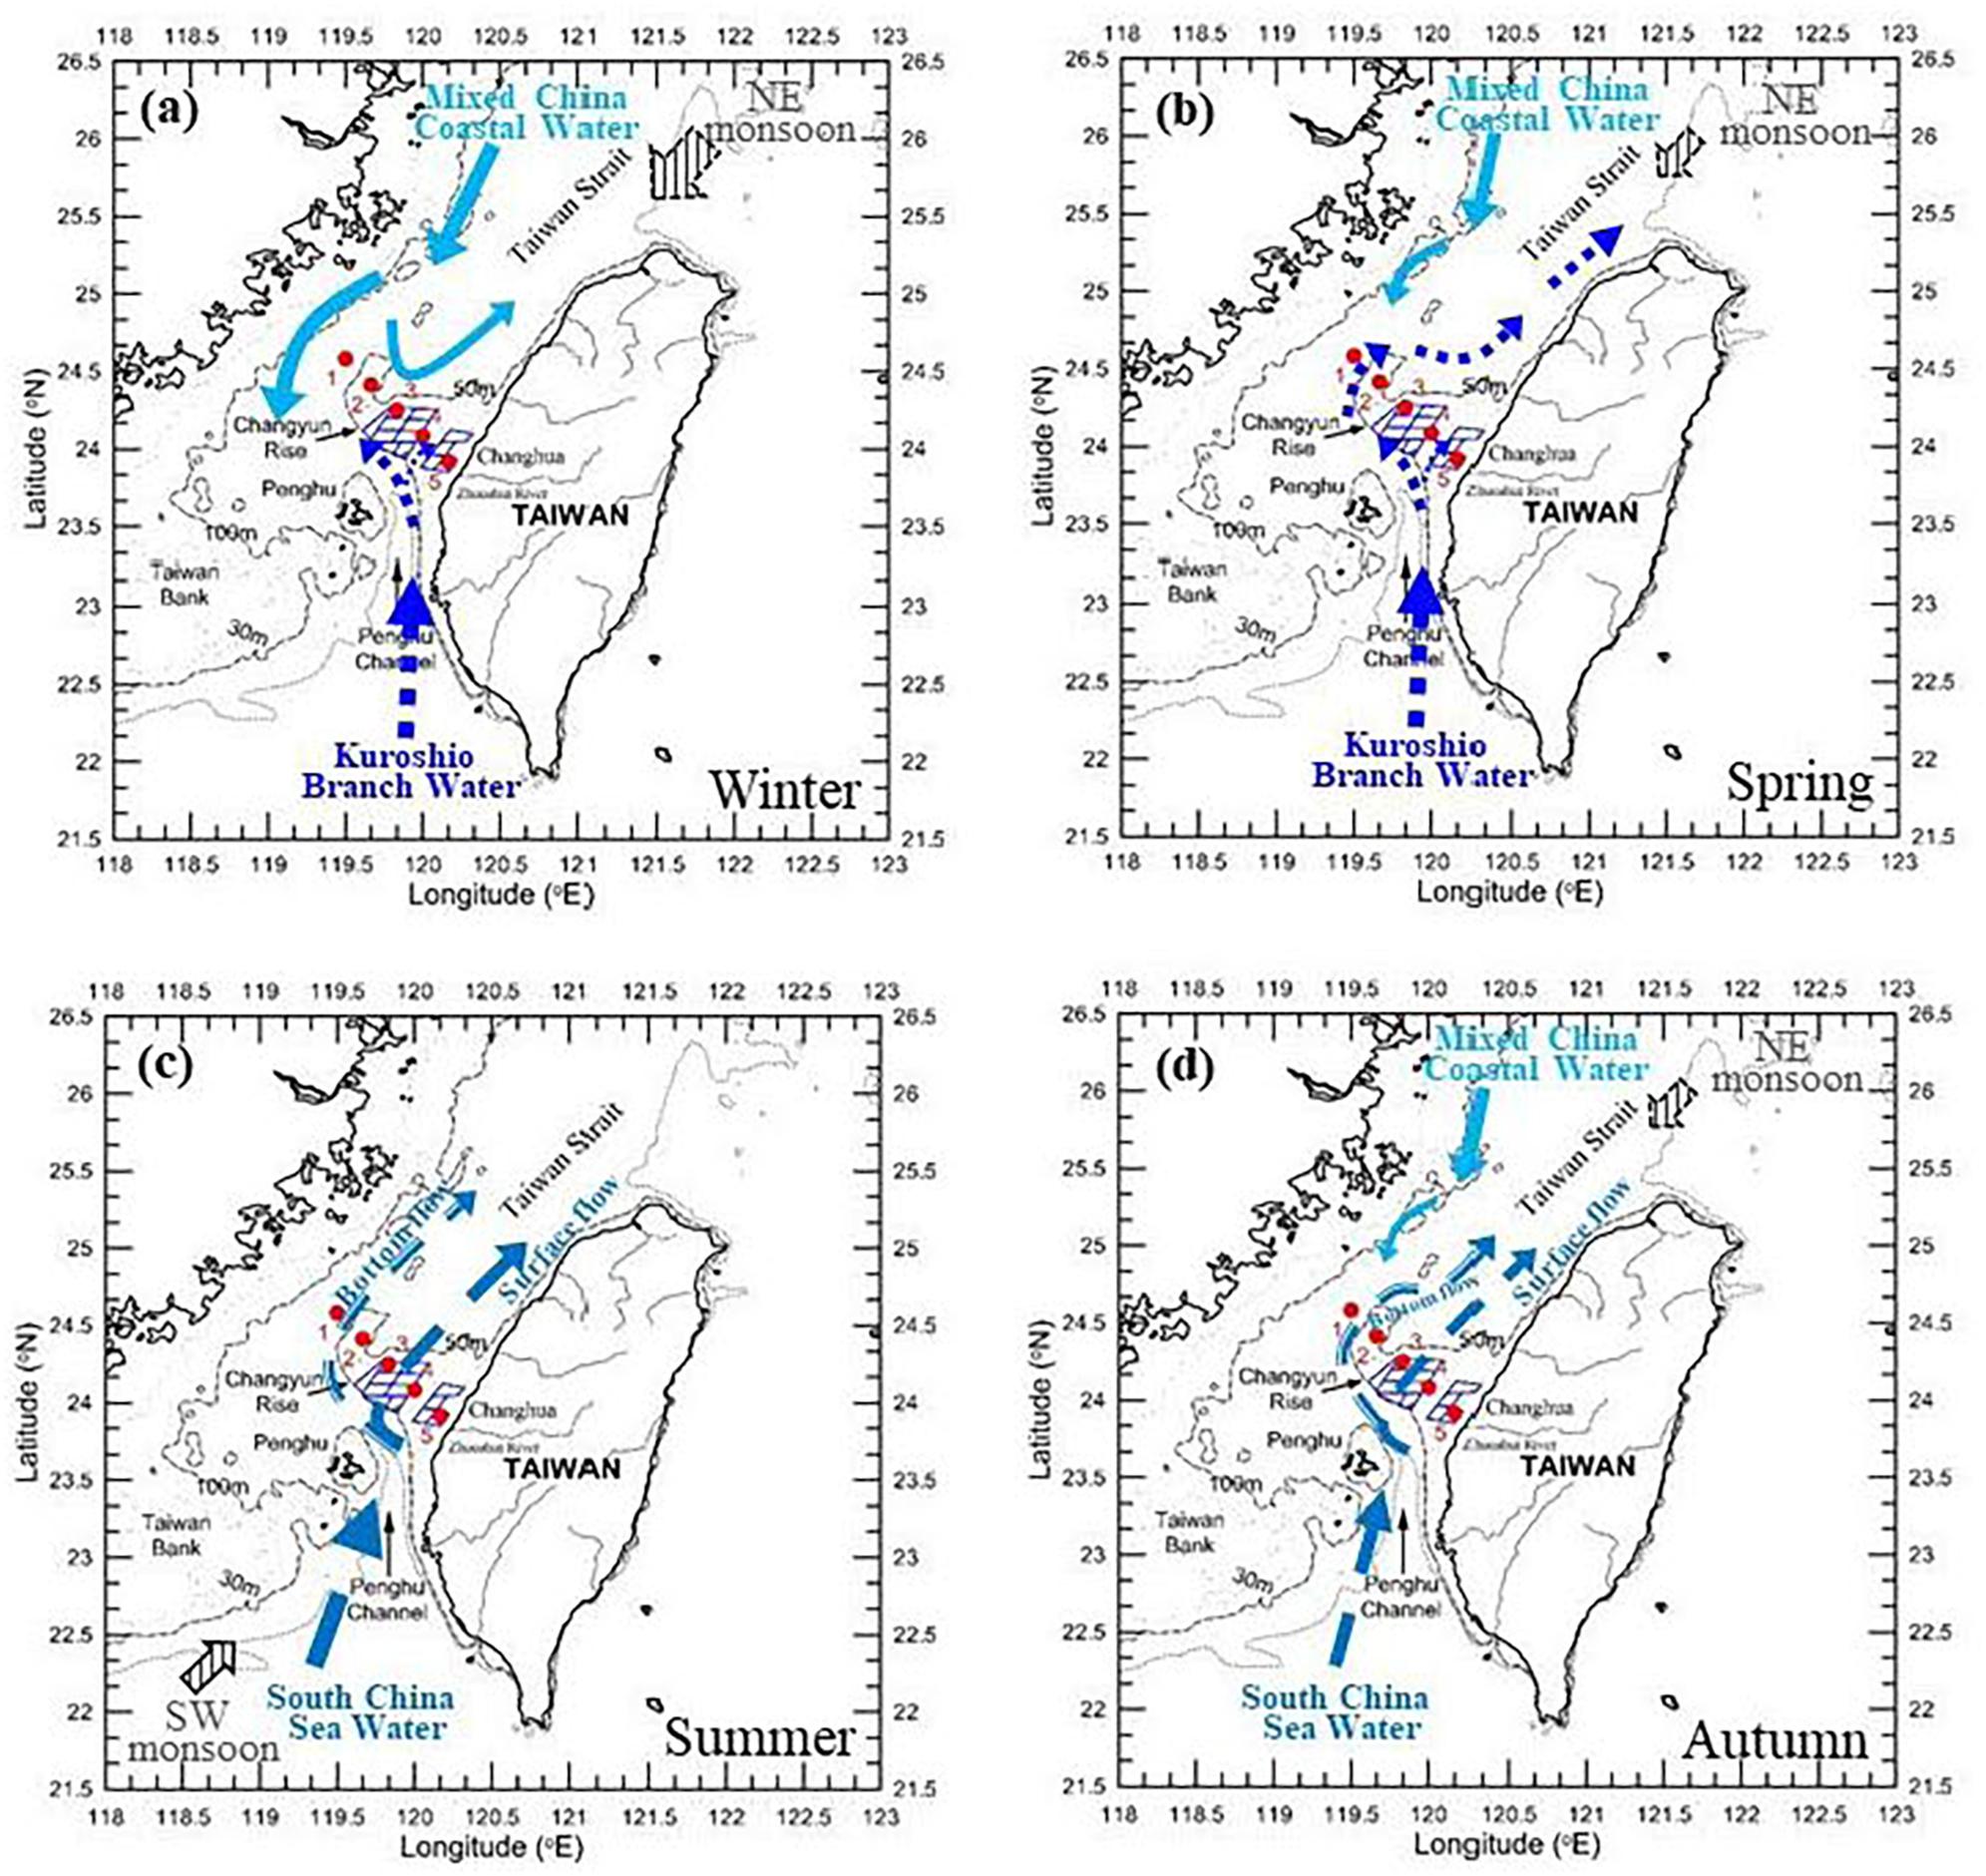
Figure 1. Map of the study area and sampling stations (red dots represent the sampling stations). The areas that are framed by blue lines are designed to be offshore wind farms. The Changyun Rise is between 119.5–120.1°E and 23.9–24.6°N, where the water depth shallower than 50 m. Schematic showing the Taiwan Strait circulation in (a) winter, (b) spring, (c) summer, and (d) autumn (water currents were taken from Jan et al., 2002).
Materials and Methods
Cruise Information and Sampling Instruments
Seasonal water samples were taken at five sampling stations in the Taiwan Strait (Figure 1) during four cruises on board an R/V Ocean Researcher 2: OR2-2212 (January 2017), OR2-2229 (April 2017), OR2-2253 (July 2017), and OR2-2269 (October 2017). Most of the sampling stations were in the CYR and all of them were located on the east of 119.5°E in order to follow the “median line” agreement. The vertical profiles of seawater temperature, salinity, downwelling scalar irradiance, and light transmission (TM) were measured with a conductivity–temperature–depth instrument (CTD; SBE 9/11, Seabird Scientific, United States). Downwelling scalar irradiance was measured with a photosynthetic active radiation (PAR) sensor (Chelsea Technologies Group Ltd., United Kingdom). TM was measured with a 25 cm path length transmissometer (C-Star, Seabird Scientific, United States). Seawater samples from various depths were collected using a carousel water sampler (SBE32, Seabird Scientific, United States) that was fitted with 20 L Teflon-coated Go-Flo bottles (General Oceanic, United States) mounted on a CTD assembly. The daily cycle of incident PAR above the sea surface was measured on deck using a 4p scalar irradiance sensor (QSR-2100, Biospherical Instruments Inc., United States). The euphotic zone depth was defined as the depth of 1% of the surface PAR remains (Kirk, 1994). On deck, incubations of photosynthetic-irradiance (PB-E curve) experiments were carried out during the daytime at 2–3 depths to obtain the primary productivity at each depth. Primary productivity obtained from the on deck PB-E curve experiment is described in detail elsewhere (Gong et al., 2003). Euphotic zone integrated primary production (IP) was calculated using a trapezoid rule. The satellite sea surface temperature data were from the group for high resolution sea surface temperature (GHRSST) project, NASA and the Ocean Data Bank of the Ministry of Science and Technology, R.O.C.1
Chemical Analysis
Water samples for nutrient analysis were placed in 100 ml polypropylene bottles and frozen immediately with liquid nitrogen. The methods employed for nutrient analysis are described in detail elsewhere (Gong et al., 1995a, 1996, 1997, 2000). The precision in the measurements of nitrate (NO3–), phosphate (PO43–), and silicate (SiO44–) was ± 0.3, ± 0.01 and ± 0.1 μmol L–1, respectively. Water samples for Chl a analysis were immediately filtered through GF/F filter paper (Whatman, 47 mm) and stored at -20°C. A Turner Designs model 10-AU-005 fluorometer (Turner Inc., United States) was utilized to measure the Chl a concentration following extraction by 90% acetone (Strickland and Parsons, 1972; Gong et al., 1993, 1995b).
Results
Marine hydrographic and chemical data as well as Chl a and primary production were measured during four seasonal cruises in the Taiwan Strait. Detailed information of the cruises and the euphotic zone results for averaged hydrographic data, nutrient concentrations, Chl a concentrations and IP at each station are listed in Table 1. Figure 2 presents the daily wind observation data from the Central Weather Bureau of Taiwan at Penghu Weather Station in 2017. The incident PAR daily cycles for the four seasonal cruises are shown in Figure 3. The results of marine environmental conditions and primary production of the four seasons in 2017 are described below.
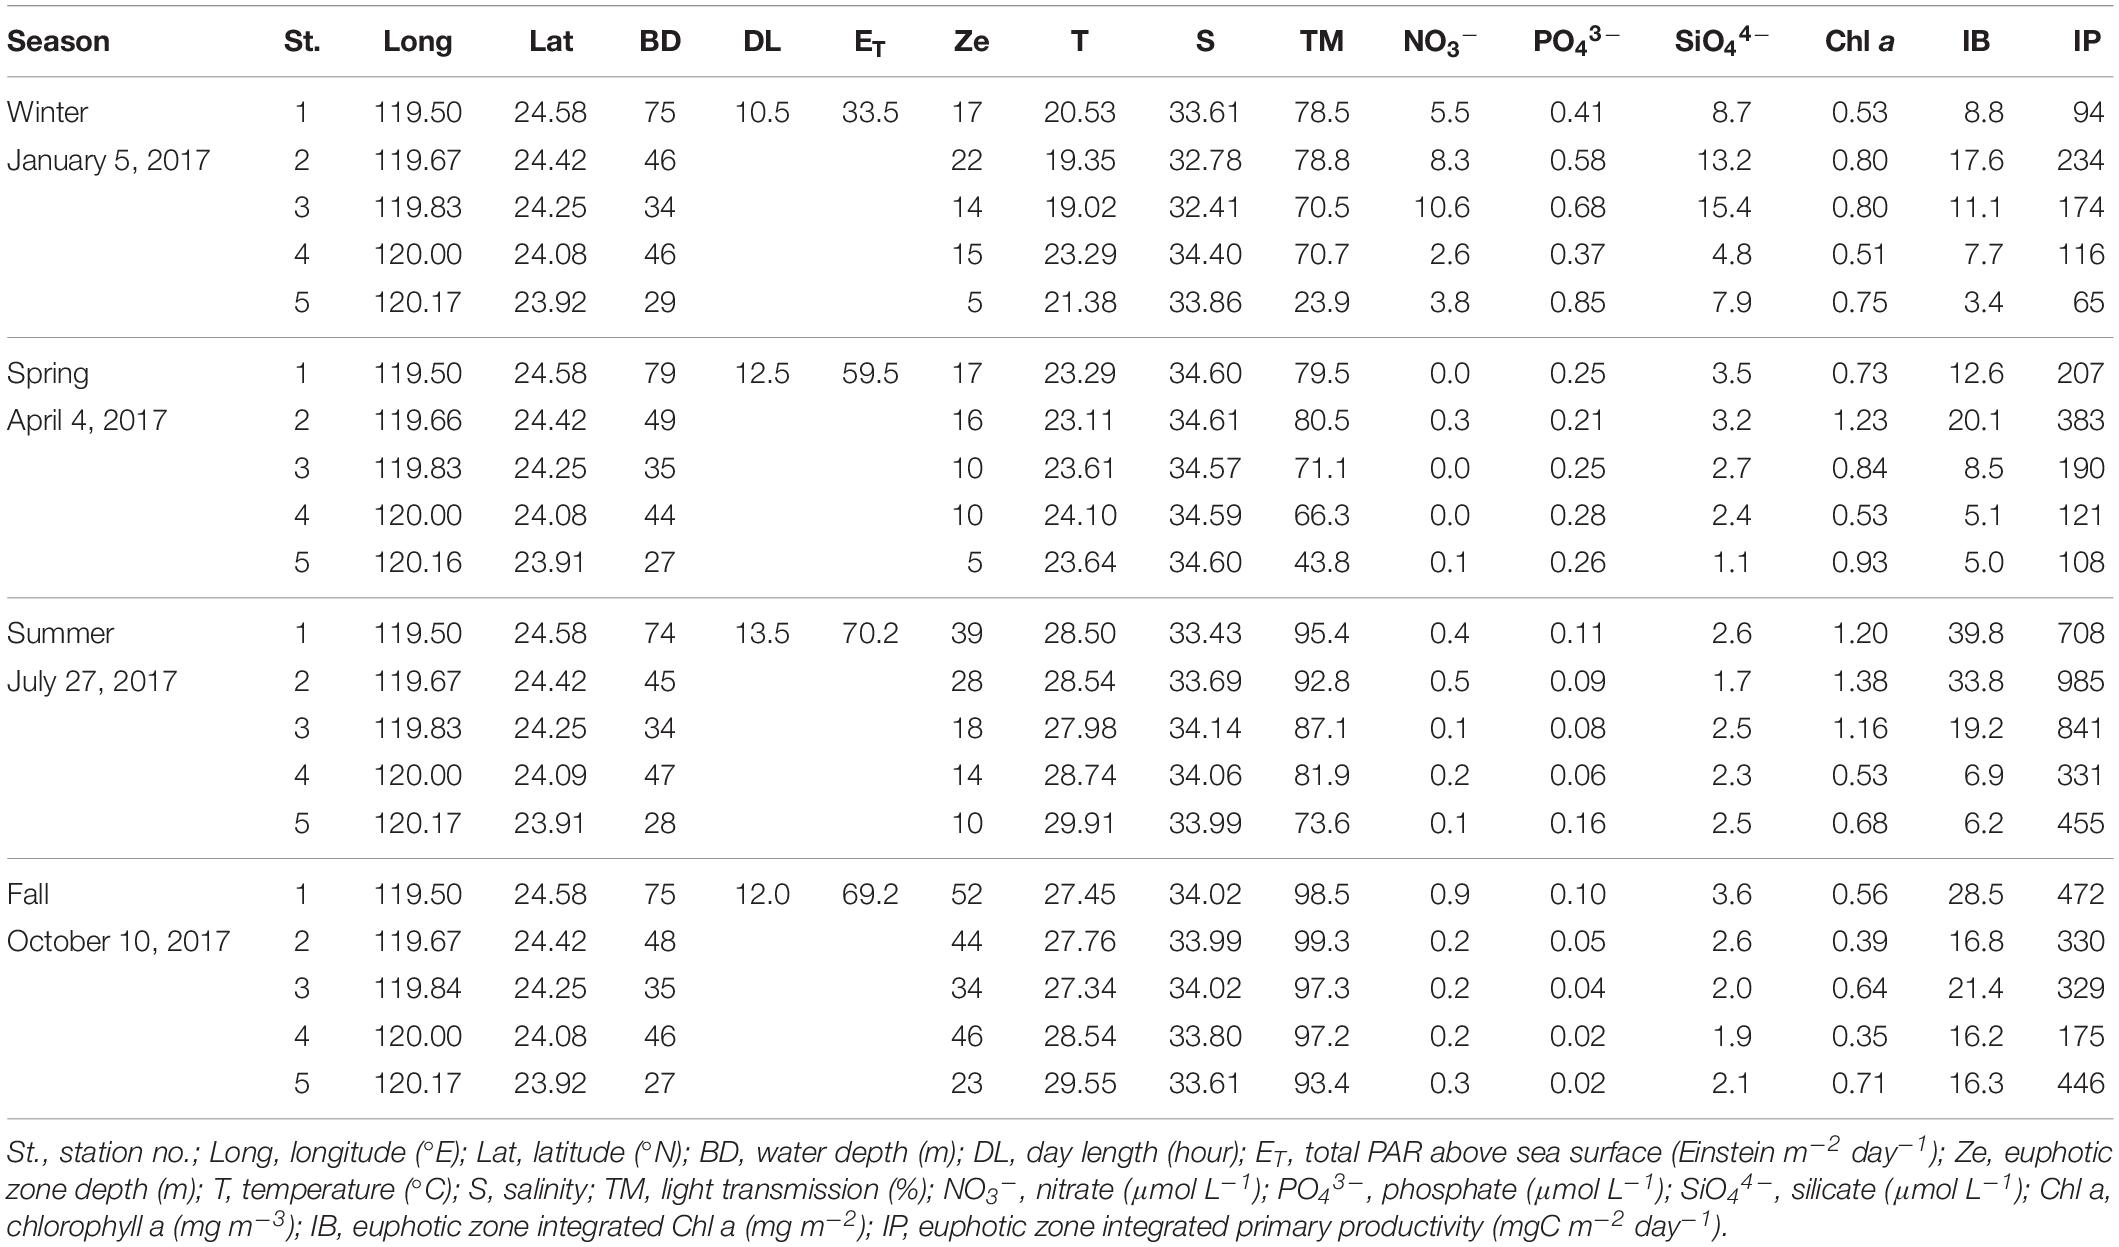
Table 1. Seasonal variation of day length, total photosynthetic active radiation (PAR) above the sea surface, euphotic zone depth (Ze), euphotic zone averaged marine environmental data, and primary production for each station.
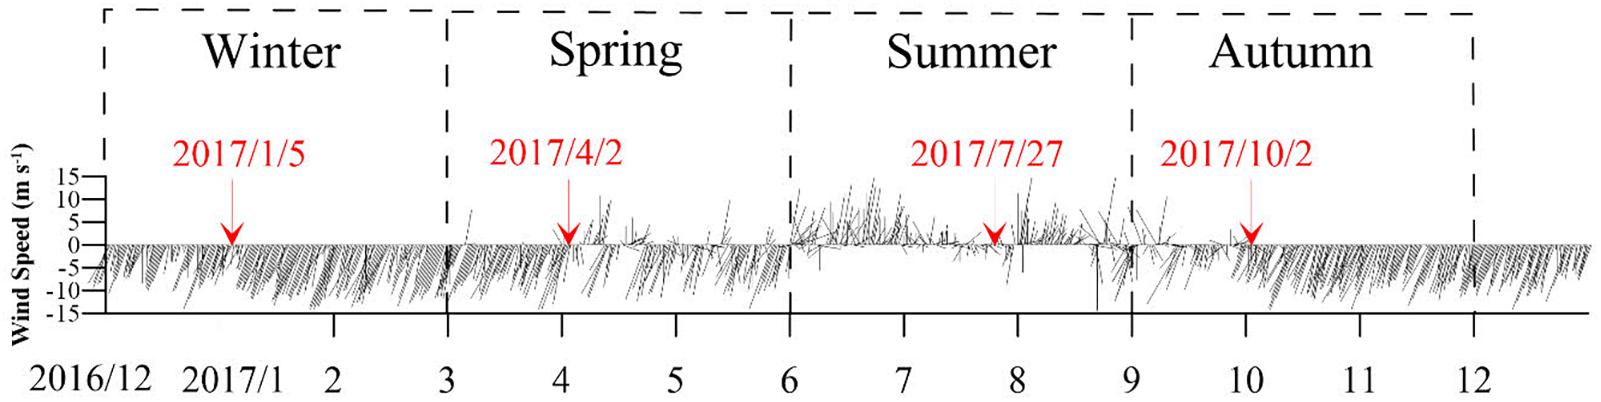
Figure 2. Average daily wind observation data from the Central Weather Bureau of Taiwan at Penghu Weather Station in 2017, and the sampling dates were indicated. Positive values represent a wind direction between 90° and 270°.
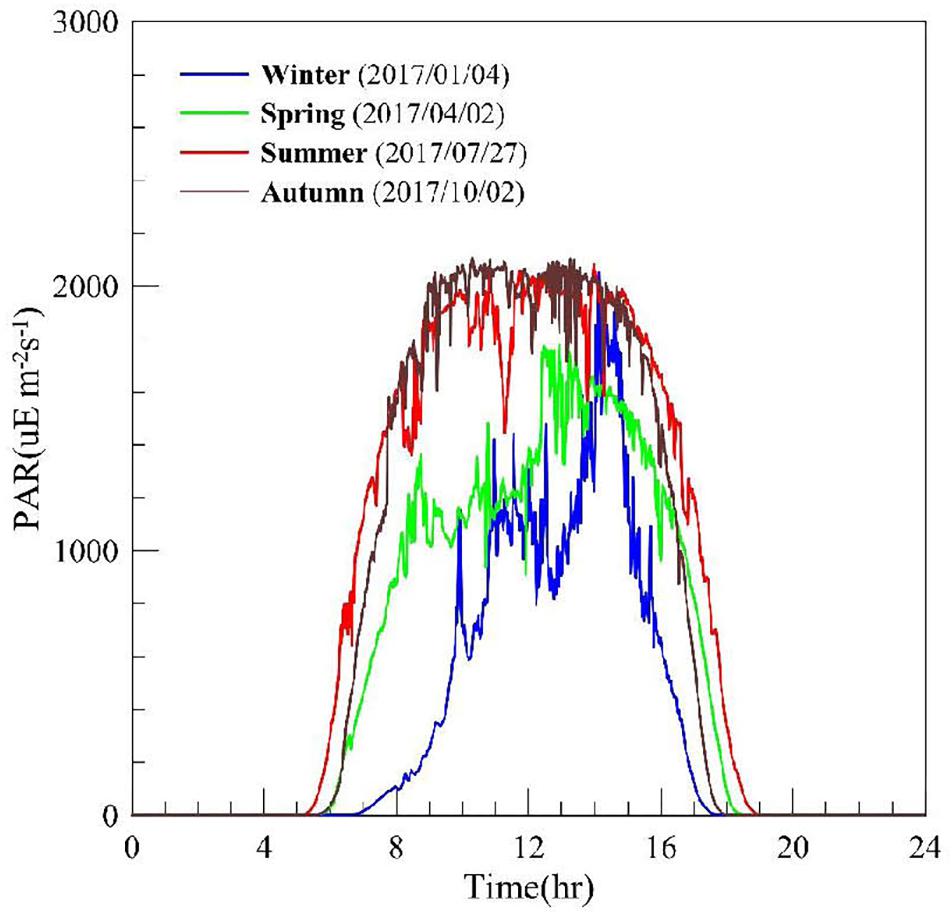
Figure 3. Averaged daily cycle of the incident PAR during the four field campaigns: winter (blue line), spring (green line), summer (red line), and autumn (brown line).
Marine Environmental Conditions and Primary Production in Winter
The prevailing northeast monsoon was observed in winter (Figure 2). The PAR daily cycle in winter (Figure 3) indicated that the insolation duration (also known as day length) was approximately 10.5 h and the daily total PAR was 33.5 Einstein m–2 day–1 (Table 1). Seawater temperature and salinity ranged from 19.02 to 23.29°C and 32.41 to 34.40, respectively (Table 1). The lowest temperature and salinity values were observed in station 3 while the highest temperature and salinity values were observed near the shore (station 4; Figure 4A). The cross-sections of the Taiwan Strait (Figures 5a–d) display as vertically uniform, indicating a strong vertical mixing within the prevailing northeast monsoon. The euphotic zone depth ranged between 5 and 22 m and decreased from offshore to inshore (Figure 5b). Station 5 had the lowest TM, which was under 30% throughout the whole water column. A low temperature and salinity with high nutrients were observed at stations 2 and 3 while a high temperature and salinity with relatively low nutrients were observed at station 4 (Figures 5a,c,d). Chl a concentrations ranged between 0.51 and 0.80 mg m–3 (Figure 5d) and had the same pattern as the nutrient distributions. The euphotic zone integrated Chl a concentration (IB) and IP varied ranges were 3.4–17.6 mg m–2 and 65–234 mgC m–2 day–1, respectively (Table 1). The highest IB and IP were at station 2 while the lowest ones were at station 5 (Figure 6).
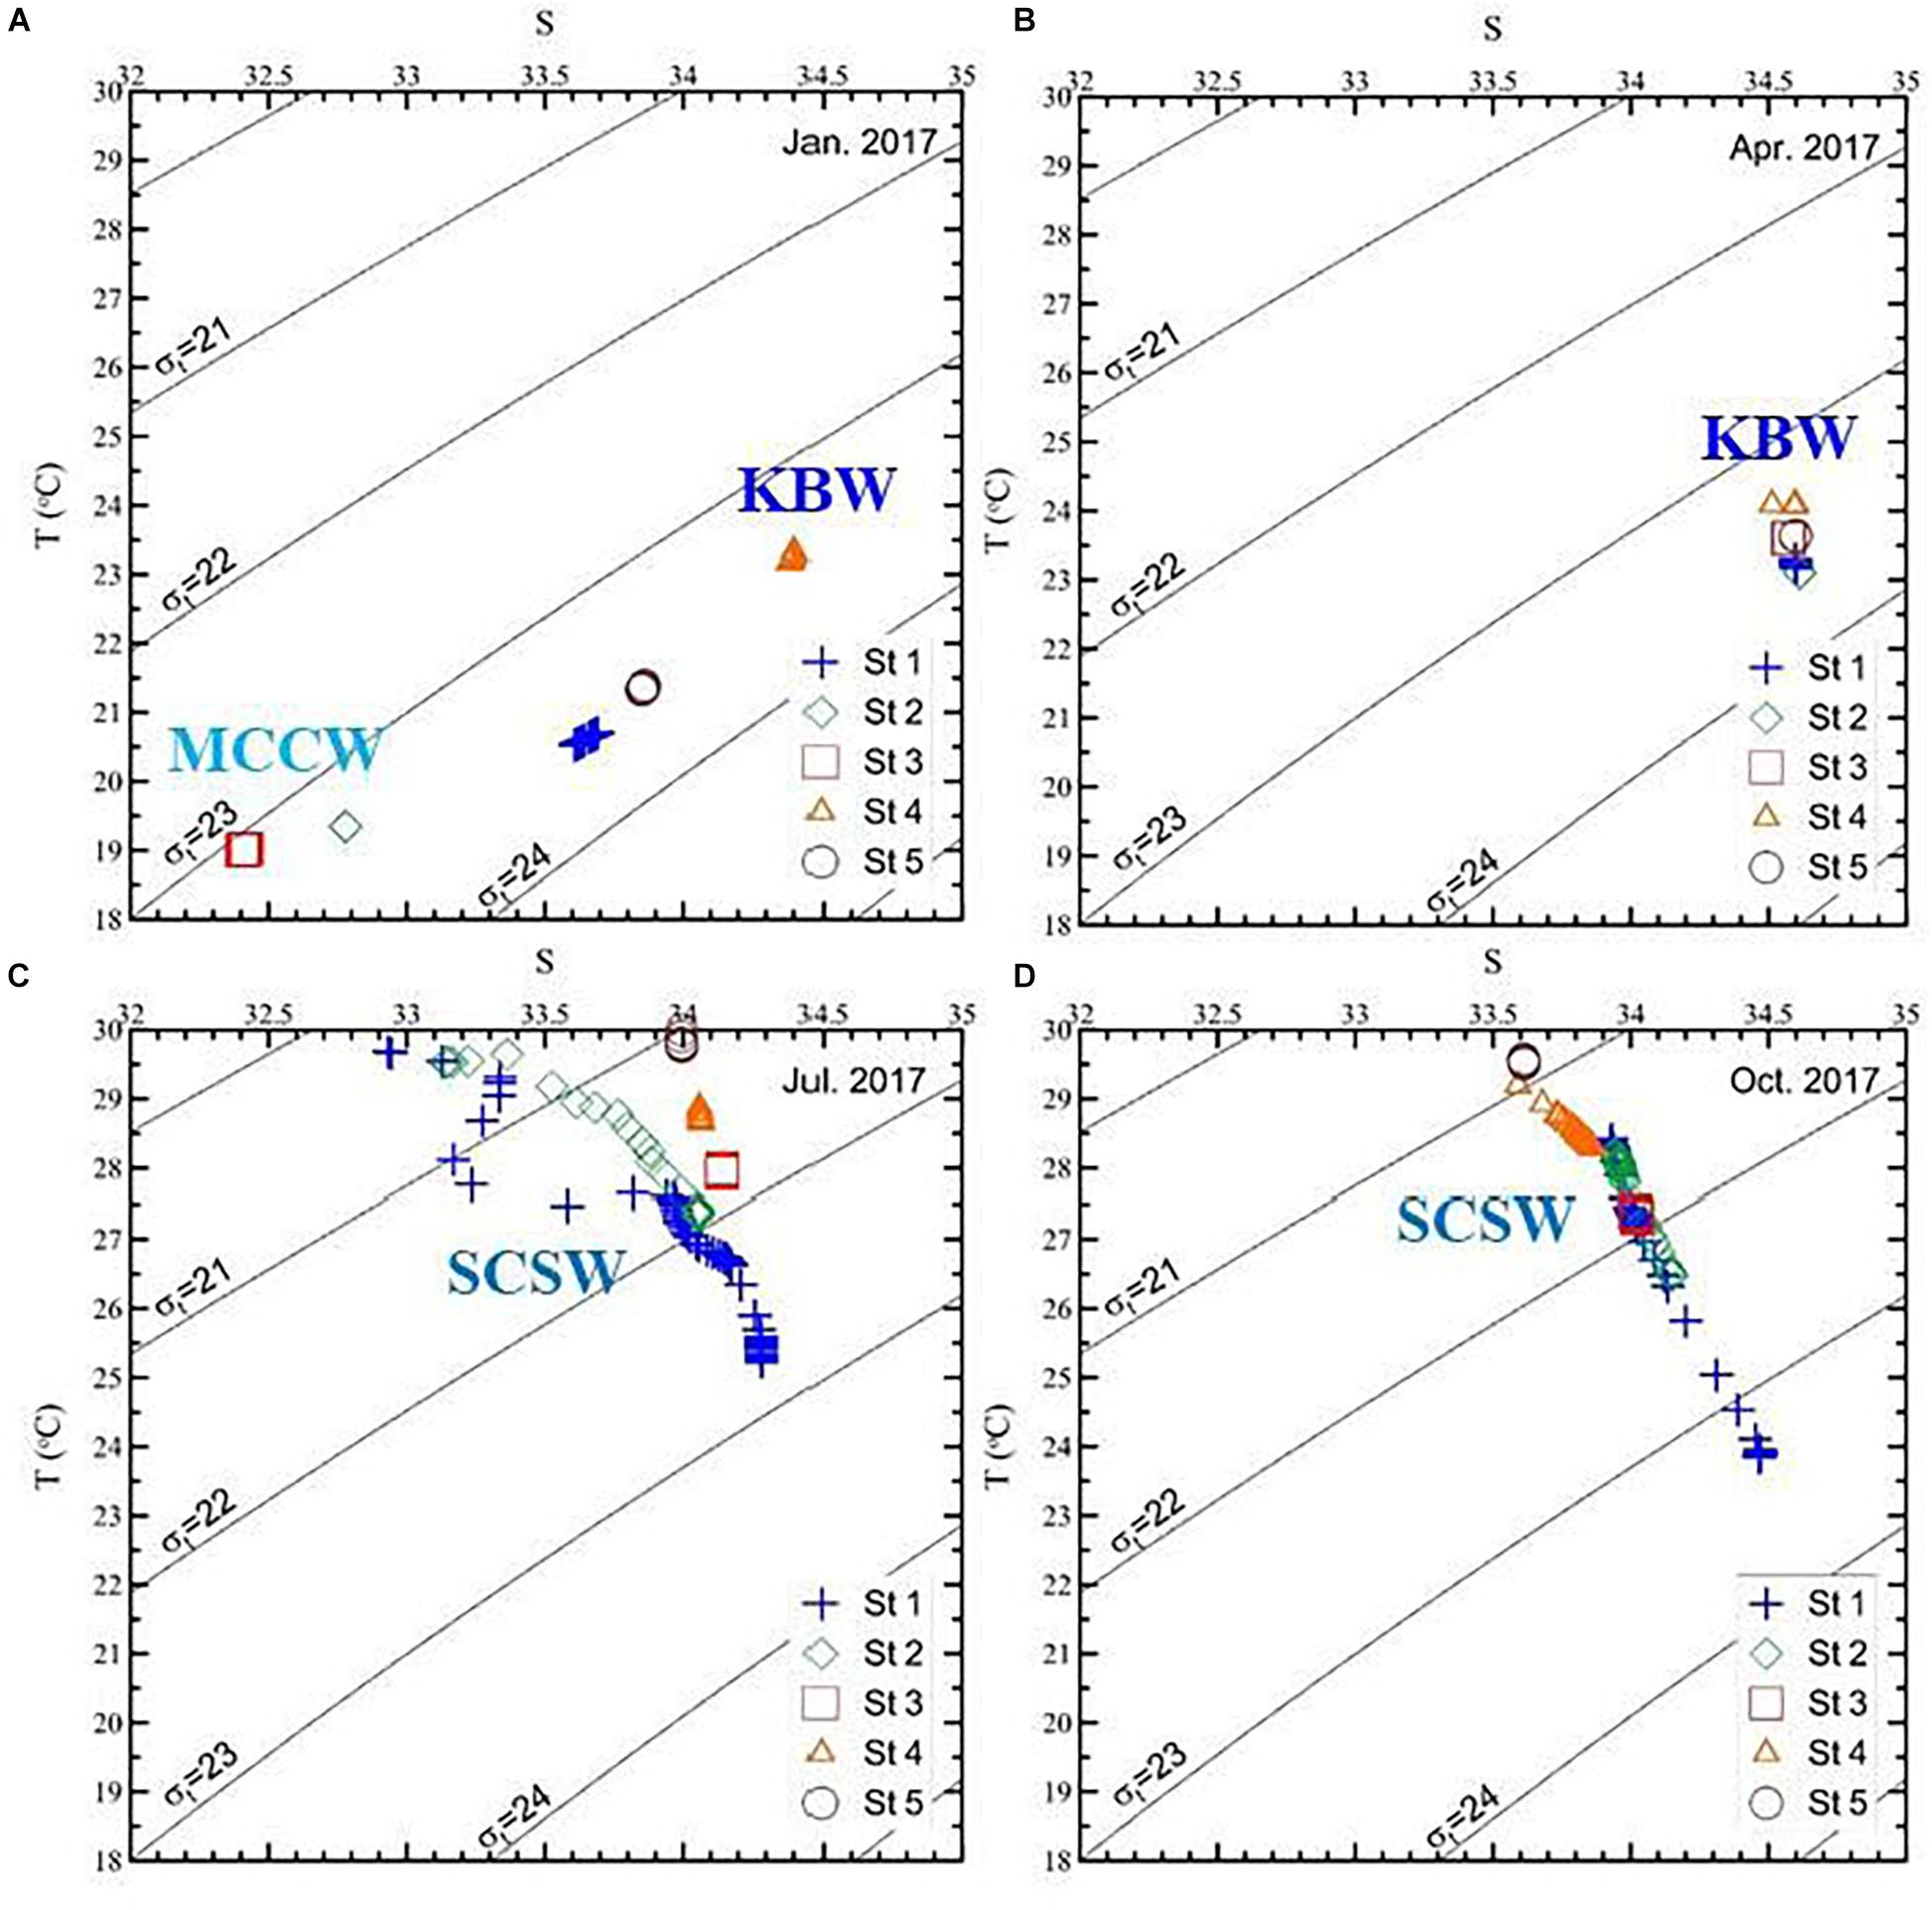
Figure 4. Temperature (T) versus salinity (S) for (A) winter, (B) spring, (C) summer, and (D) autumn in the Taiwan Strait in 2017. The primary water masses in the Taiwan Strait were the Mixed China Coastal Water (MCCW) and the Kuroshio Branch Water (KBW) in winter, the Kuroshio Branch Water (KBW) in spring and the South China Sea Water (SCSW) in summer and autumn.
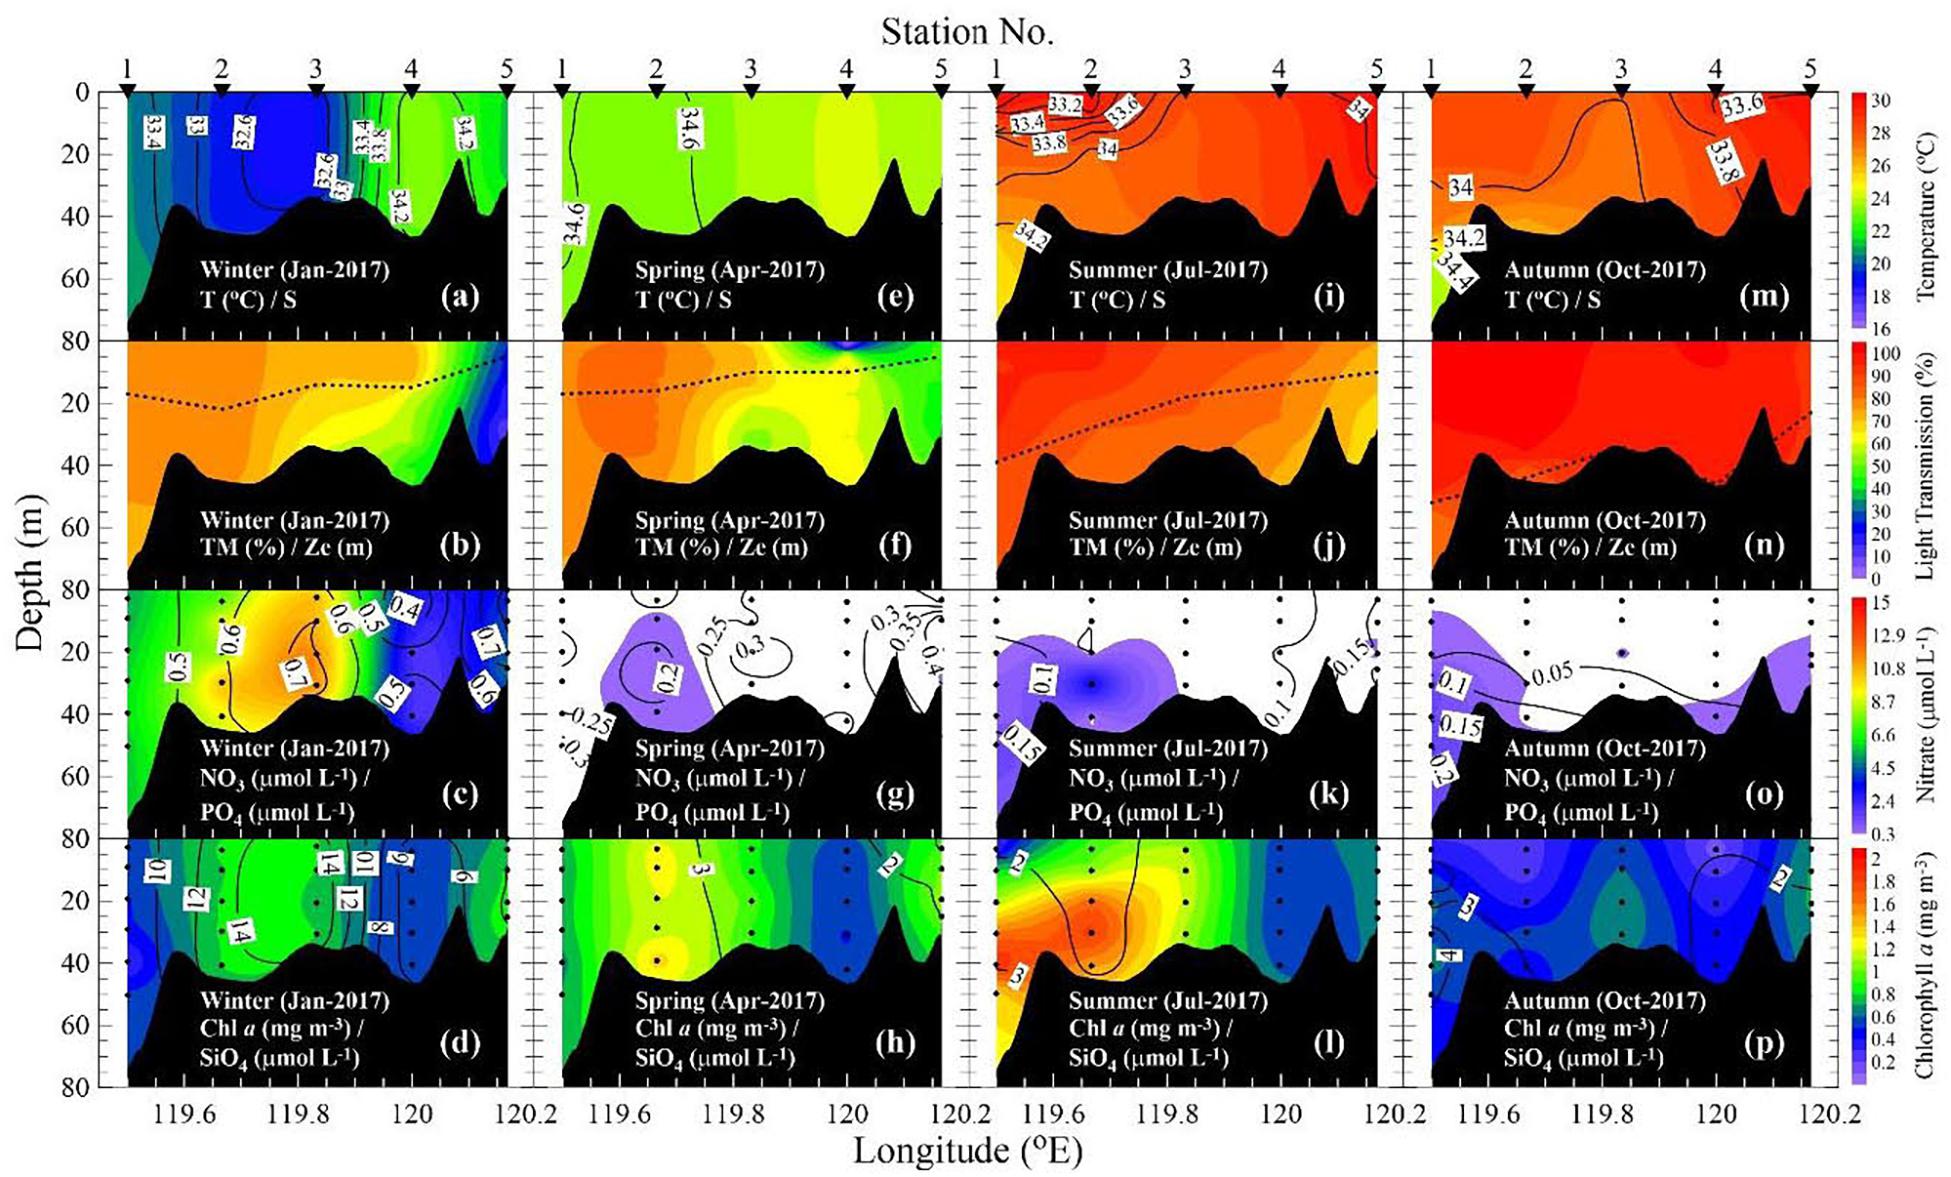
Figure 5. Cross-section of temperature (T)/salinity (S), light transmission (TM)/the dotted line represents the euphotic zone depth (Ze), NO3–/PO43– and Chl a/SiO44– (a–d) in winter, (e–h) in spring, (i–l) in summer, and (m–p) in autumn.
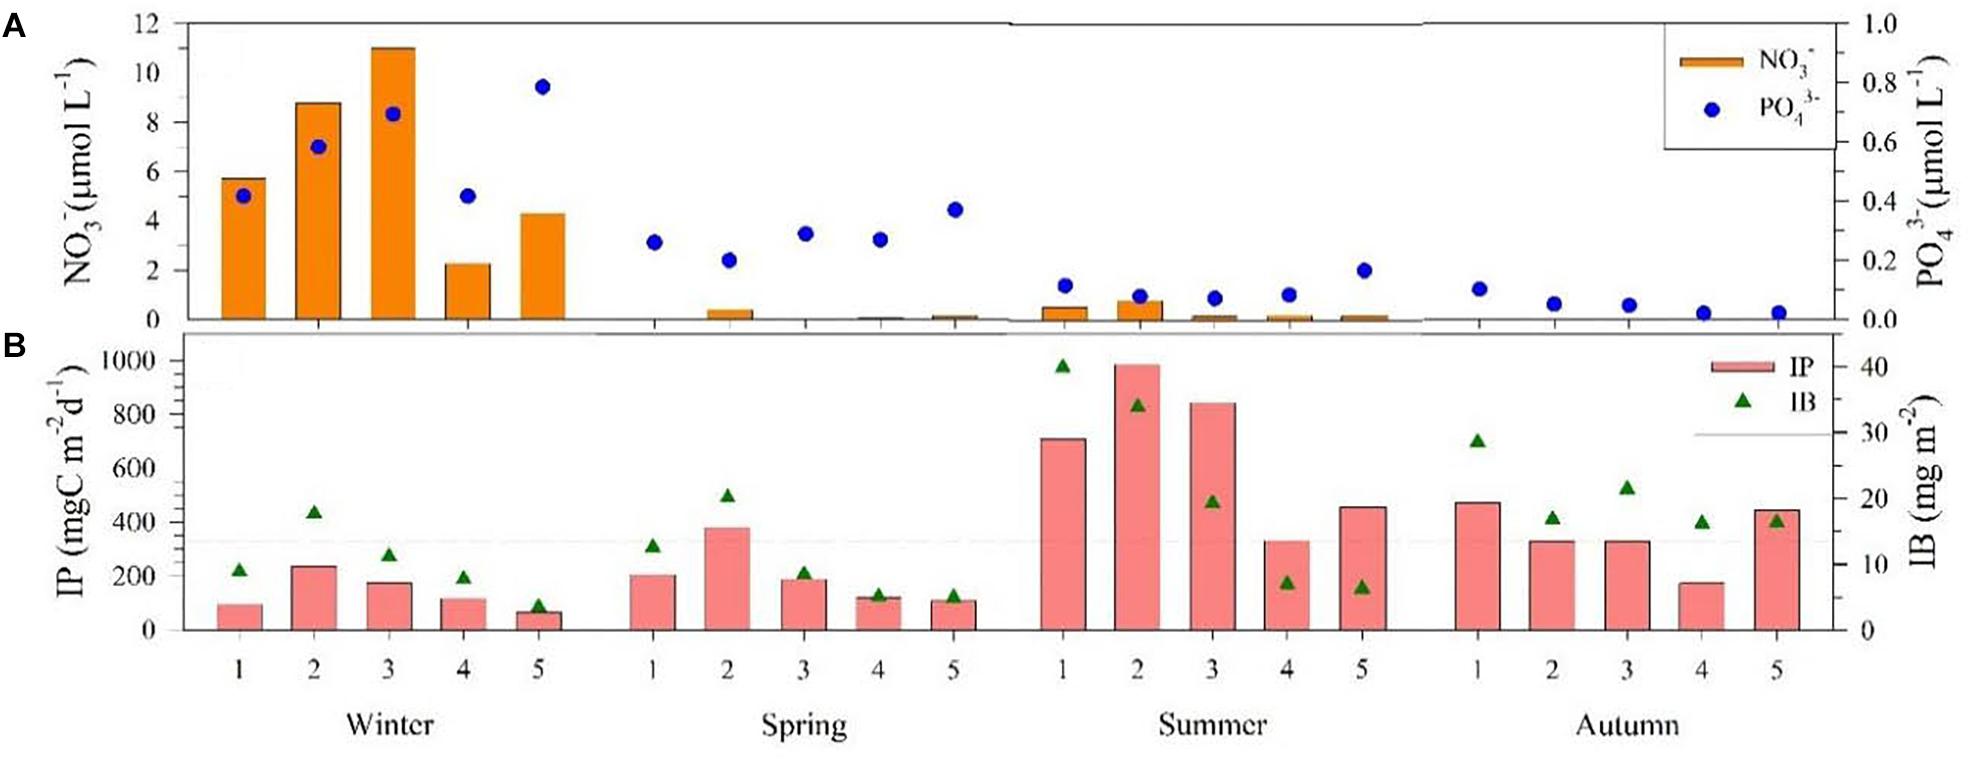
Figure 6. Seasonal trends of (A) average NO3– and PO43– concentrations (B) euphotic zone integrated Chl a concentration (IB) and primary production (IP) of each sampling station.
Marine Environmental Conditions and Primary Production in Spring
Wind speed began to slow and changed direction in early April (Figure 2). The PAR daily cycle in spring (Figure 3) indicated that the insolation duration was approximately 12.5 h and the daily total PAR was 59.5 Einstein m–2 day–1 (Table 1). Seawater temperature and salinity ranged from 23.11–24.10°C to 34.57–34.61, respectively (Table 1). The cross-sections of the Taiwan Strait (Figures 5e–h) show that water columns were thoroughly mixed vertically. Seawater in all sampling stations was of a high salinity with similar temperatures (Figure 4B). The euphotic zone depth ranged between 5 and 17 m and decreased from offshore to inshore, similar to TM (Figure 5f). There were lower NO3– concentrations in the water columns, except for some NO3– available in the bottom water of station 2, and relatively high PO43– concentrations were observed at station 5 (Figure 5g). SiO44– concentrations decreased from offshore to inshore stations, and higher concentrations of Chl a were observed at station 2 (Figure 5h). IB and IP varied between 5.0–20.1 mg m–2 and 108–383 mgC m–2 day–1, respectively (Table 1). The highest IP was found at station 2 whereas the lowest IP was at station 5 because of its low IB, TM and shallow euphotic zone depth (Figure 6).
Marine Environmental Conditions and Primary Production in Summer
In summer, wind switched to the southwest direction and the wind speed slowed (Figure 2). The PAR daily cycle in summer (Figure 3) indicated that the insolation duration was approximately 13.5 h and the daily total PAR was 70.2 Einstein m–2 day–1 (Table 1). Seawater temperature and salinity ranged from 27.98–29.91°C to 33.43–34.14, respectively (Table 1). Water columns were thoroughly mixed vertically in stations 3, 4, and 5 (Figure 4C). On the other hand, the water columns were stratified and the seawater temperature decreased as the salinity increased with depth at stations 1 and 2 (Figure 5i). The euphotic zone depth ranged between 10 and 39 m and TM values were high in all the water columns; both of them decreased from offshore to inshore (Figure 5j). Relatively high nutrient concentrations were found in the bottom water of station 1 (Figure 5k). Higher concentrations of Chl a were observed at stations 1, 2, and 3, especially in the subsurface layer (Figure 5l). IB and IP showed ranges of 6.2–39.8 mg m–2 and 331–985 mgC m–2 day–1, respectively (Table 1). The highest IP was at station 2 whereas the lowest IP was at station 4 (Figure 6).
Marine Environmental Conditions and Primary Production in Autumn
The northeast monsoon picked up after October (Figure 2). The PAR daily cycle in autumn (Figure 3) indicated that the insolation duration was approximately 12 h and the daily total PAR was 69.2 Einstein m–2 day–1 (Table 1). Seawater temperature and salinity ranged from 27.34–29.55°C and 33.61–34.02, respectively (Table 1). The water columns were stratified at stations 1 and 2 but were thoroughly mixed vertically in stations 3 and 5 (Figures 4D, 5m). The euphotic zone depth varied between 23 and 52 m, and the TM values were high in all the water columns (Figure 5n). In most of the water columns, nutrient concentrations were low during the autumn, except for the bottom water of station 1 (Figure 5o). Although Chl a concentrations were relatively low in autumn (Figure 5p), the TM values were high and the euphotic zone depths were deep in all the sampling stations. As the result, IB and IP were high with ranges of 16.2–28.5 mg m–2 and 175–472 mgC m–2 day–1, respectively (Table 1). The highest IP was at station 1 while the lowest IP was at station 4 (Figure 6).
Discussion
The objective of this research is to understand the seasonal variations of marine environment and primary production in the Taiwan Strait. As primary production is a limiting factor of fisheries’ catch rates (Chassot et al., 2010), the results of this research can not only be used as the baseline for evaluating the OWF impact on the marine ecosystem but also be used for assessing their influence on fishery resources. Three environmental factors, which are light availability, water column stability and nutrients availability, influence primary production the most. Although assemblage composition of phytoplankton as well as zooplankton grazing pressure (Tsai et al., 2018) also influence the primary production, these were not included in this study. According to the research results, IP not only varied between each sampling station in the same season but also differed among the four seasons (Table 1). The highest averaged IP (664 ± 270 mgC m–2 day–1) was observed in summer and was approximately 5 times higher than that in winter (137 ± 68 mgC m–2 day–1; Table 2). Consequently, three environmental factors of the Taiwan Strait during four seasons were analyzed to understand the key factors that influenced the IP seasonal variation.
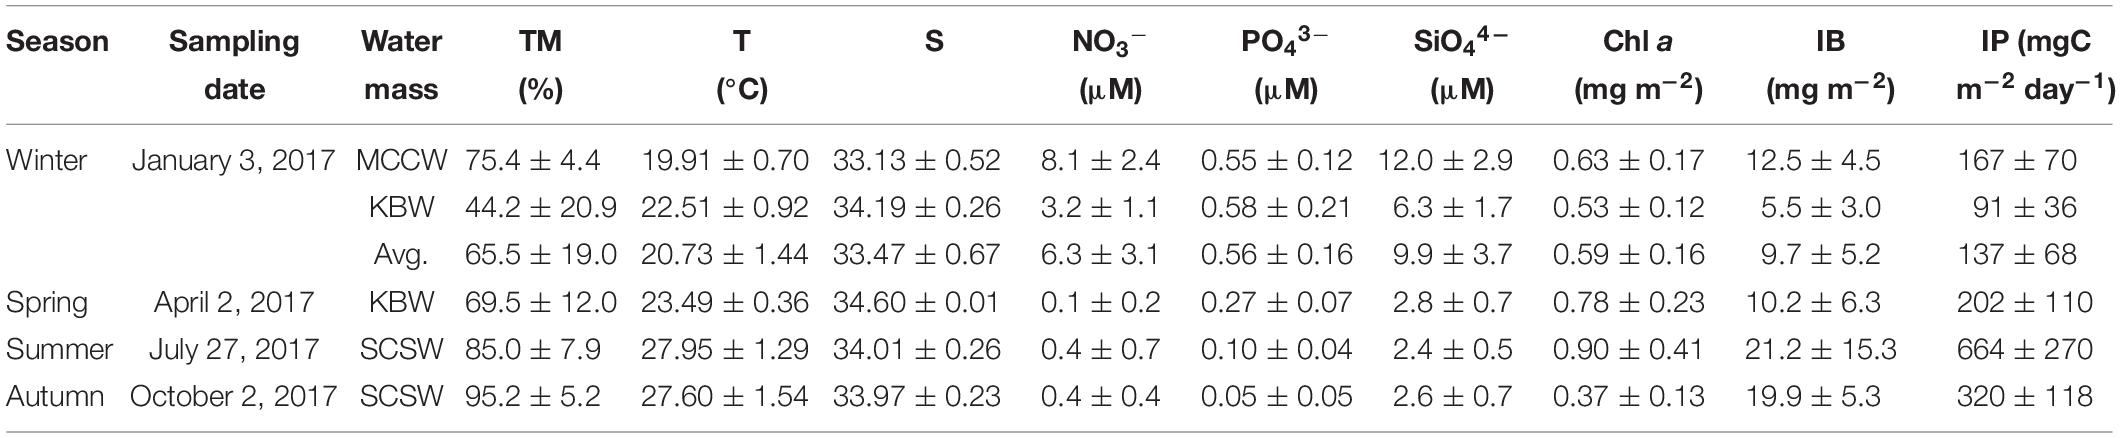
Table 2. Seasonal properties of water masses [average light transmission (TM%), temperature (T), salinity (S), NO3–, PO43–, SiO44–, and Chl a throughout the water column, euphotic zone integrated Chl a concentration (IB), and euphotic zone integrated primary production (IP) of each water mass].
Light Availability
Solar radiation is the main external source of energy for marine ecosystem (Chassot et al., 2010). Primary production has fixed the solar energy via phytoplankton in the euphotic zone. Therefore, insolation duration, light intensity and transparency of the water columns influence the primary production. The seasonal insolation durations (Figure 3) ranging from the highest to the lowest were summer (13.5 h), spring (12.5 h), autumn (12 h), and winter (10.5 h). In addition, the seasonal mean values of the daily total PAR ranging from the highest to the lowest were 70.2, 69.2, 59.5 and 33.5 Einstein m–2 day–1 in summer, autumn, spring and winter (Table 1), respectively. Moreover, the seasonal mean TM ranging from the highest to the lowest were 95.2, 85, 69.5, and 65.5% in autumn, summer, spring, and winter (Table 2), respectively. The TM in summer being lower than in autumn might be due to more phytoplankton present in the water columns (higher Chl a concentrations) in summer. Hence, light availability was better in summer and autumn than in winter and spring (Table 3).
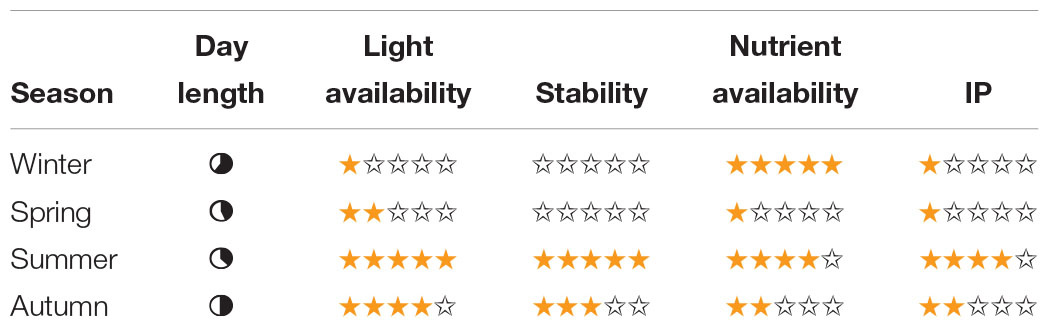
Table 3. Conceptual diagram representing the seasonal variation of day length, light availability, stability, nutrients availability, and average euphotic zone integrated primary production (IP).
Water Column Stability
Generally, wind stress is strong during the winter in the Taiwan Strait (Jan et al., 2002), and it induces violent waves and mixing while reducing TM and the euphotic zone depth. The euphotic zone depth value is a measure of water clarity, which is an important parameter regarding the health of ecosystem (Lee et al., 2007). The inshore station (station 5) had the shallowest water depth, so the water column was easily affected by terrestrial inputs or resuspend particles from the sediment, especially during the winter (Naik and Chen, 2008). As a result, the relatively shallow euphotic zone depth was observed at station 5 throughout all seasons. Figure 2 shows that strong northeastern winds had started since January and slowed down after April. The wind changed its direction to southwestern between June and August, switched back to a northeastern direction and then increased speed after October. According to the data, which is presented as a dashed line in the cross-section figures (Figures 5b,f,j,n), a lower TM and shallower euphotic zone depth were found in winter and spring due to strong vertical mixing, which indicated that the water columns were unstable. On the other hand, the water columns were thoroughly stratified in summer and autumn (Figures 5i,m). Therefore, water column stability was higher in summer and autumn than in winter and spring (Table 3).
Water Masses Variety and Nutrients Availability
As Taiwan Strait is located in the East Asian monsoon region, seasonal changes of the wind direction have caused different currents and circulations. This have brought different water masses into the Taiwan Strait (Jan et al., 2002, 2006, 2010; Chen, 2003, 2011; Chen and Sheu, 2006; Wu et al., 2007; Chen et al., 2010). In winter, the strong northeastern winds had brought the MCCW with cold, brackish and high nutrients to the western part of the Taiwan Strait and the CYR blocks part of the MCCW and forces a U-shaped flow pattern in the northern Strait (Jan et al., 2002, 2006, 2010; Wu et al., 2007). On the other hand, the intruding KBW flowed northward into the CYR through the Penghu Channel and partially blocks along-strait transport on the eastern side of the strait (Jan et al., 2002). The low temperature, salinity and high NO3– concentrations water existed in station 3 while high temperature, salinity and low NO3– concentrations water was in station 4 (Figures 4A, 7). In winter, water west of 119.8°E (station 1, 2, and 3) had high nutrient concentrations with a low temperature and salinity, which might have come from MCCW; the water east of 119.8°E (stations 4 and 5) had relatively low nutrient concentrations with a high temperature and salinity (Figures 4A, 6A, 7 and Table 2), which might have come from KBW. The MCCW confronted the KBW in the CYR in winter. Water was well mixed vertically (Figures 4A, 5a) and it was the mixture of the MCCW and the KBW horizontally. As the northeastern wind began to slow and changed direction in spring, the MCCW retreated and the KBW expanded northward. Water in the Taiwan Strait had a higher salinity in spring than in other seasons (Figure 4) and it had low NO3– concentrations (Figures 6A, 7), meaning that it presumably came from the KBW. In summer and autumn, water in the Taiwan Strait had medium salinity and low nutrient concentrations (Figures 4C,D, 6A, 7), meaning that it presumably came from SCSW. The seasonal variations of nutrients are strongly influenced by the seasonal change of different water mass occupation. Consequently, the seasonal change of water masses in the Taiwan Strait in this research is in accordance with previous research (Jan et al., 2002, 2006, 2010; Chen, 2003, 2011; Chen and Sheu, 2006; Wu et al., 2007; Chen et al., 2010; Huang et al., 2018).
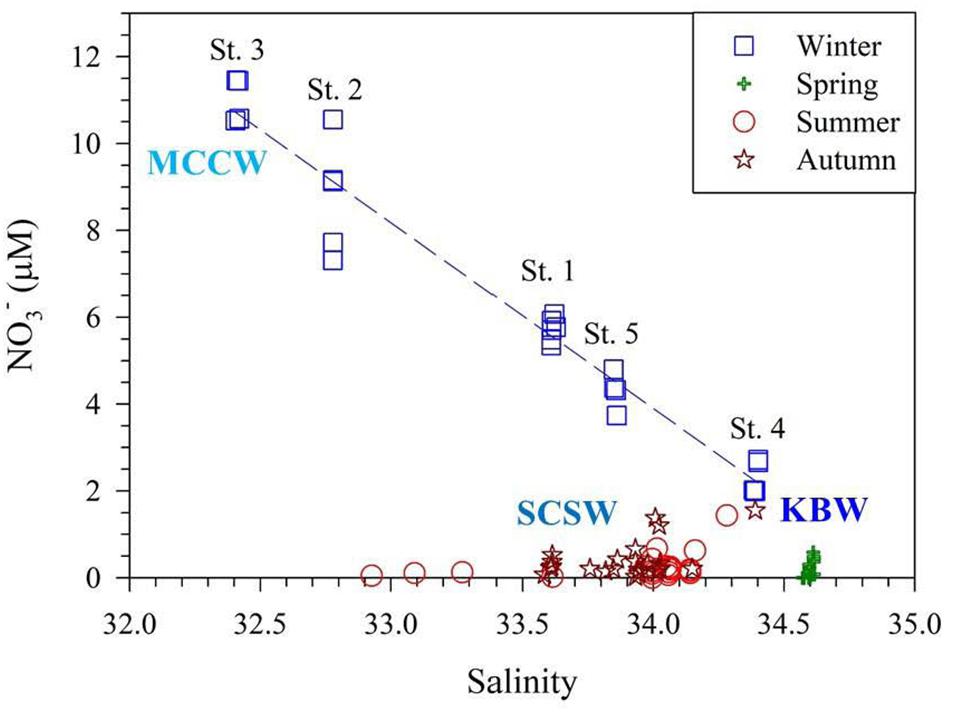
Figure 7. NO3– versus salinity for four field campaigns in the Taiwan Strait in 2017. Three water masses, the Mixed China Coastal Water (MCCW), the Kuroshio Branch Water (KBW), and the South China Sea Water (SCSW) varies seasonally in the Taiwan Strait.
Hong et al. (2011) revealed that there are three upwelling areas in the southern Taiwan Strait in summer. Upwelling near the Chinese coast occurs during the summer and depends on the prevailing southwesterly winds, while upwelling around the Taiwan Bank and the Penghu Islands occurs throughout the year, which is due to the interaction between the bottom topography and the northward flow (Hong et al., 2011). According to Jan et al. (2010), the acoustic Doppler current profiler (ADCP) data indicated that the northeastward transport increases in spring and summer, peaks in early August and weakens thereafter. In addition, typhoon Roke was formed southeast of Taiwan on July 21 and traveled northwest and passed through the Luzon Strait, reaching Hong Kong on July 23. The typhoon might have induced upwelling, and the upwelling may have been enhanced by the cyclonic vorticity (Ko et al., 2016). Southwesterly winds changed direction after October (Figure 2), which may have slowed down the northward flow and upwelling. According to the satellite sea surface temperature (SST) images (Figure 8), the area near Penghu Island and Taiwan Bank had lower SST in summer than in autumn. The temperature gradient between low SST areas and the sea areas nearby was larger in summer than in autumn, which indicates that the upwelling might be stronger in summer than in autumn. The northward currents carried the nutrient-rich seawater from the upwelling area to our sampling area. As a result, water in summer had higher nutrient concentrations than in autumn (Figure 6A). Consequently, nutrients’ availability was high in winter, medium in summer and low in autumn and spring (Table 3).
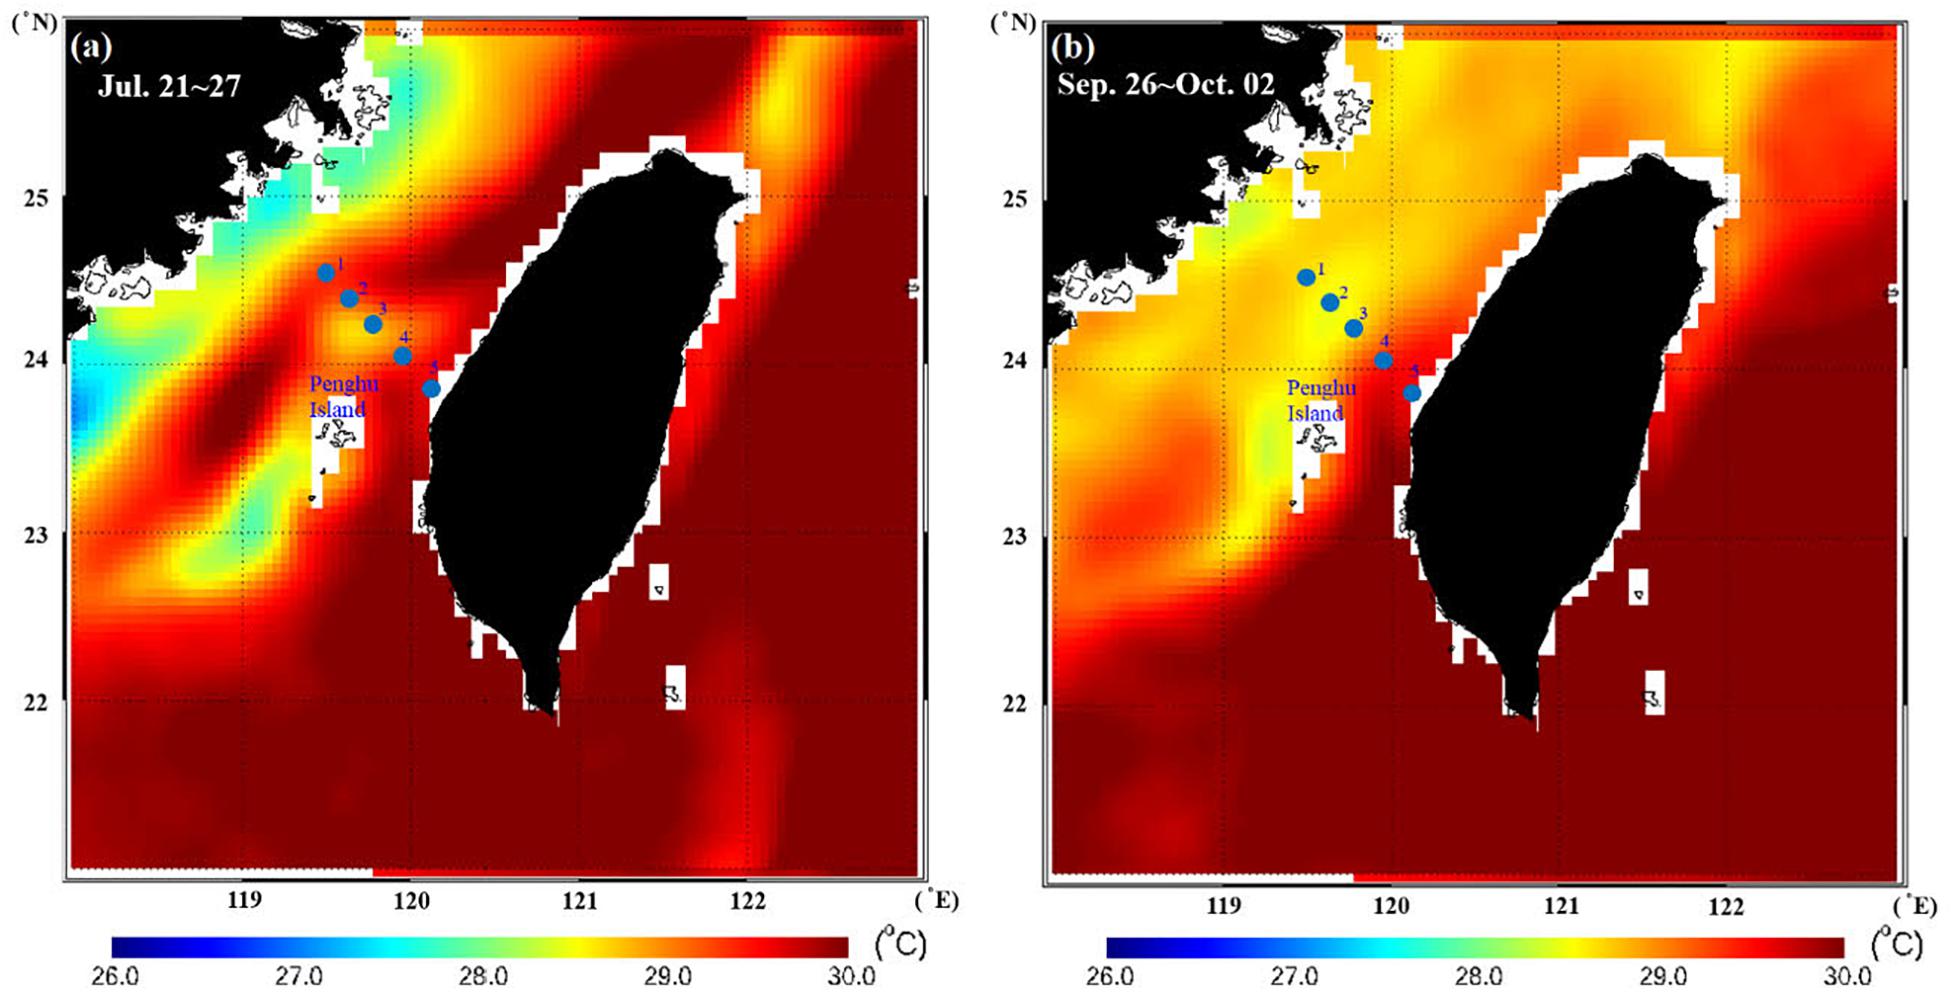
Figure 8. The weekly composite images of satellite sea surface temperature (a) between July 21 and July 27, 2017 and (b) between September 26 and October 02, 2017. Data were from the group for high resolution sea surface temperature (GHRSST) project, NASA.
Seasonal Distribution of the Euphotic Zone Integrated Chl a Concentration and Primary Production
The IB were high in spring and summer, but they were low in winter and lower in autumn (Table 2). During the spring and summer, Chl a concentrations were higher in the western part than the eastern part of the Taiwan Strait (Figures 5h,l), and the highest IB was revealed at station 2 (Table 1 and Figure 6B). Although the average Chl a concentrations in autumn were the lowest, the euphotic zone depths were the deepest among all seasons, so the values of IB were relatively high (Table 2 and Figure 6B). The seasonal mean IB values from highest to lowest were summer (21.2 mg m–2), autumn (19.9 mg m–2), spring (10.2 mg m–2) and winter (9.7 mg m–2; Table 2).
Previous research (Gong et al., 1997, 2000; Shiah et al., 2000) found that primary production is often greatly affected by physical factors, especially in coastal shelf regions due to their highly dynamic conditions. Gong et al. (2003) also pointed out that primary production might be governed by changes in physical-chemical environmental conditions. In this study, the annual IP varied between 65 and 985 mgC m–2 day–1 (Table 1), and the average value in the Taiwan Strait was 123 ± 86 gC m–2 year–1 (338 ± 235 mgC m–2 day–1). The average seasonal IP values from highest to lowest were summer (664 ± 270 mgC m–2 day–1), autumn (350 ± 118 mgC m–2 day–1), spring (202 ± 110 mgC m–2 day–1), and winter (137 ± 68 mgC m–2 day–1; Table 2).
The highest IB and IP values were observed in station 2 in summer and the lowest IP value was found at station 5 in winter (Figure 6B). The lowest IP values were observed in winter (Figure 6B). Even if the water in winter was rich in nutrients (Figures 5c,d), a short insolation duration (Figure 3), low incident PAR and shallow euphotic zone depth (Table 1) due to strong vertical mixing resulted in the lowest IP values among all seasons. The highest IP values were observed in summer (Table 2) at approximately five times higher than that in winter. Even though the nutrient concentrations were relatively low in summer (Figures 5k,l), Chl a concentrations were high (Table 1), especially at station 1, 2, and 3 (Figure 5l). Hu et al. (2015) also found the water in the coastal upwelling system in the Taiwan Strait had low nutrients but high Chl a concentrations. Because The insolation duration (Figure 3), incident PAR, Chl a concentrations and IB values were high in summer (Table 1), the highest IP values were revealed. In addition, the high values of IP in summer were presumably supported by the heterotrophic nutrients, which might have been supplied by the enhanced upwelling in the south. Overall, seasonal IP values ranged from highest to lowest in the following order: summer > autumn > spring > winter.
If we assume that the maximum IP occurred in mid-July (i.e., day 199) and that the winter value represented the base of the IP in the Taiwan Strait, the annual IP variations can be described with a left-skewed normal distribution curve (Figure 9). The fitted left-skewed normal distribution curve is:
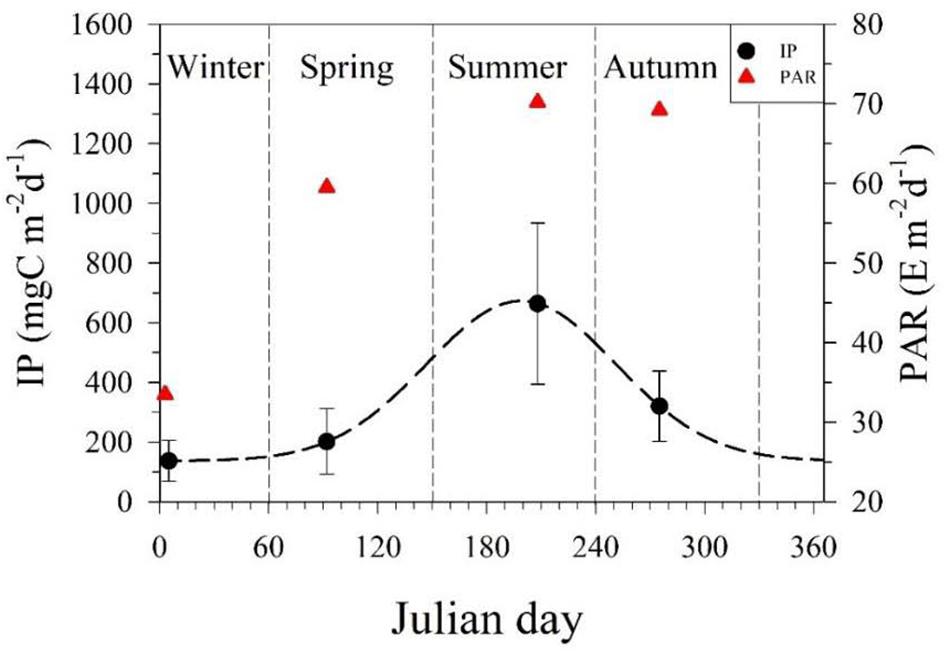
Figure 9. Annual variations in the averaged seasonal euphotic zone integrated primary production (IP) of the CYR. The error indicates one standard deviation of the mean. The dashed line represents the fitted left-skewed normal distribution curve of IP in 2017.
where μ = 199, σ = 52 and X is the Julian day.
The mean absolute relative error between the observed value and the value computed from the equation was approximately 3%. The average annual IP determined from the equation for the Taiwan Strait is approximately 120 gC m–2 year–1 (or 328 mgC m–2 day–1), which is comparable with the average annual IP 123 ± 86 gC m–2 year–1 (338 ± 235 mgC m–2 day–1) from the measurement.
Nevertheless, the wind speed slowed down (Figure 2) after our spring sampling day, which means that the signal for spring might show up after our sampling day. Thus, the IP values for spring might be underestimated. With more stability of the marine environment, the IP values in spring may have increased. In addition, typhoons may not only enhance the upwelling in the sea but also bring the rainfall on the land, which increases the freshwater input and nutrient supplies from the land to the sea. Conclusively, the IP values for summer may increase when more typhoons approach.
Potential Impacts of Offshore Wind Farm Installations on Primary Production
In recent decades, the number of OWFs has increased rapidly. With increasing OWF constructions, environmental impact assessments and monitoring programs have been deployed worldwide. However, they mainly focus on sea mammals, seabirds, benthos or demersal fish but generally ignore the potential effects that OWFs may have on the marine ecosystem (Floeter et al., 2017). As the marine environment is home for marine creatures, a change in the marine ecosystem will have major impacts on them. Primary production is the foundation for a marine ecosystem and supports the food web and fish stock. Therefore, potential OWF installation impacts on the marine environment, especially primary production, should be addressed.
According to Smyth et al. (2015), OWF installation might cause several environmental pressures associated with foundations, piles, cabling routes, waste from vessels and disturbance from vessels. Carpenter et al. (2016) indicated that as tidal currents move past the OWF foundation structures, they generate a turbulent wake that will contribute to a mixing of the stratified water column. In addition, van der Molen et al. (2014) suggested that primary production may be decreased by higher turbulence levels induced by turbine foundations. Vanhellemont and Ruddick (2014) also found that the underwater light field will be affected by increased suspended particles and the turbid wakes may significantly impact sediment transport and downstream sedimentation. Even though OWF installation may increase the vertical mixing and bring nutrients to the upper layer, it also increases suspended particles and decreases light penetration. In addition, surface sediments of the CYR are composed of sands (Liao et al., 2008), which may be disturbed during the OWF installation and thus increase the suspended particles in the seawater. As vertical mixing in the Taiwan Strait was strong and water stability was already low during the winter and spring (Table 3), the impacts on IP due to OWF installation during these seasons may be limited. On the other hand, the impacts of OWF installation on IP during the summer and autumn may be greater. Figure 9 shows the annual IP variation curve in the Taiwan Strait. If we assume the OWF installation takes 90 days and it begins on the 1st of June (day 152), approximately 46% (55.6 gC m–2 year–1) of the total annual IP may be influenced. Since the highest IP was in summer, the potential impact of OWF installation on IP reduction may be larger during the summer than during other seasons. Although it can be argued that this IP variation curve only came from data in one year, it can be improved when the data set accumulated. This annual IP variation curve not only gives an insight into how the seasonal IP changed but also takes a glimpse into how the IP might be affected by OWF installation, which could provide suggestive information for governance, managers, operators and stakeholders to reduce potential impacts of OWF installation on the marine environment.
To reduce potential impacts on the marine environment and gain social benefits from ecosystem services, the investigation or monitoring of the potential effects of OWFs on the marine ecosystem is needed. Marine environmental investigations and/or OWF monitoring can provide the necessary scientific data for managers to reduce the potential impacts on the marine ecosystem as well as inform governmental authorities, operators, operating companies and other stakeholders about the stage changes of the marine environment.
Conclusion
During four seasonal research cruises in the Taiwan Strait, the average measured IP was 338 ± 235 mgC m–2 day–1. As three primary water masses exist in the Taiwan Strait and three of them have different characteristics, different mixing ratios of water masses may cause different chemical and hydrographic conditions, which leads to different levels of Chl a concentrations and primary production. Although water in winter was rich in nutrients, it had a short insolation duration, low incident PAR and shallow euphotic zone depth. As a result, winter had the lowest IP values (137 ± 68 mgC m–2 day–1) among the four seasons. Owing to the strong vertical mixing in winter and spring, the euphotic zone depths were shallower in winter and spring than in summer and autumn, and it caused low IP values during winter and spring. The highest values of IP were observed in summer, which was 664 ± 270 mgC m–2 day–1. This might be supported by the heterotrophic nutrients from upwelling around the Taiwan Bank and the Penghu Islands. The primary impact of an OWF installation on the marine environment is increasing disturbance of the seawater in addition to noise. An increase in disturbance may decrease the euphotic zone depth, which reduces IP. As naturally vertical mixing is strong during the winter and spring, the impact on IP from an OWF installation is minor during these seasons than others. On the other hand, the potential impact of an OWF installation on IP reduction may be larger during the summer than in other seasons. Consequently, long-term marine environmental monitoring can provide information and may reduce the potential environmental impacts as well as maintain the sustainability of both the social economy and healthy marine environment.
Data Availability Statement
All datasets generated for this study are included in the article/supplementary material.
Author Contributions
G-CG was the project leader and developed the idea of the study. C-CC, A-YT, and T-YC led the research cruises and did the sampling. W-LY and WH did the samples and data analysis. K-WL obtained and calculated data related to satellite. H-CT wrote the first draft of the manuscript. All authors contributed equally to the interpretation of the results and in writing the final manuscript.
Funding
This research was supported by the Ministry of Science and Technology, R.O.C. (Taiwan) (MOST 107-2611-M-019-006; 107-2119-M-019-003; and 107-2811-M-019-505).
Conflict of Interest
The authors declare that the research was conducted in the absence of any commercial or financial relationships that could be construed as a potential conflict of interest.
Acknowledgments
The authors wish to thank the Ministry of Science and Technology, R.O.C. (Taiwan) for supporting this research, and the captain and crews of Ocean Researcher 2 for their assistance. The authors would like to thank the two reviewers for providing constructive comments which helped strengthen the manuscript. The authors would like to thank the two reviewers for providing constructive comments which helped strengthen the manuscript.
Footnotes
References
Archer, C. L., and Jacobson, M. Z. (2005). Evaluation of global wind power. J. Geophys. Res. 110. doi: 10.1029/2004JD005462
Carpenter, J. R., Merckelbach, L., Callies, U., Clark, S., Gaslikova, L., and Baschek, B. (2016). Potential impacts of offshore wind farms on North Sea stratification. PLoS One 11:e0160830. doi: 10.1371/journal.pone.0160830
Chassot, E., Bonhommeau, S., Dulvy, N. K., Melin, F., Watson, R., Gascuel, D., et al. (2010). Global marine primary production constrains fisheries catches. Ecol. Lett. 13, 495–505. doi: 10.1111/j.1461-0248.2010.01443.x
Chen, C.-T. A. (2003). Rare northward flow in the Taiwan Strait in winter: a note. Cont. Shelf Res. 23, 387–391. doi: 10.1016/s0278-4343(02)00209-1
Chen, C.-T. A. (2011). Downwelling then upwelling again of the upwelled Kuroshio water in the southern East China Sea. J. Geophys. Res. 116. doi: 10.1029/2011JC007030
Chen, C.-T. A., Jan, S., Huang, T.-H., and Tseng, Y.-H. (2010). Spring of no Kuroshio intrusion in the southern Taiwan Strait. J. Geophys. Res. 115:C08011.
Chen, C.-T. A., and Sheu, D. D. (2006). Does the taiwan warm current originate in the Taiwan Strait in wintertime? J. Geophys. Res. 111:C003281.
Chen, J. L., Liu, H. H., and Chuang, C. T. (2015). Strategic planning to reduce conflicts for offshore wind development in Taiwan: a social marketing perspective. Mar. Pollut. Bull. 99, 195–206. doi: 10.1016/j.marpolbul.2015.07.025
Fang, H.-F. (2014). Wind energy potential assessment for the offshore areas of Taiwan west coast and penghu archipelago. Renew. Energy 67, 237–241. doi: 10.1016/j.renene.2013.11.047
Floeter, J., van Beusekom, J. E. E., Auch, D., Callies, U., Carpenter, J., Dudeck, T., et al. (2017). Pelagic effects of offshore wind farm foundations in the stratified North Sea. Prog. Oceanogr. 156, 154–173. doi: 10.1016/j.pocean.2017.07.003
Gong, G. C., Chen, L. Y. L., and Liu, K. K. (1996). Chemical hydrography and chlorophyll a distribution in the East China Sea in summer: implications in nutrient dynamics. Cont. Shelf Res. 16, 1561–1590. doi: 10.1016/0278-4343(96)00005-2
Gong, G.-C., Liu, K.-K., and Pai, S.-C. (1995a). Prediction of nitrate concentration from two end member mixing in the southern East China Sea. Cont. Shelf Res. 15, 827–842. doi: 10.1016/0278-4343(94)00039-p
Gong, G.-C., Shiah, F.-K., Liu, K.-K., Chuang, W.-S., and Chang, J. (1997). Effect of the Kuroshio intrusion on the chlorophyll distribution in the southern East China Sea during spring 1993. Cont. Shelf Res. 17, 79–94. doi: 10.1016/0278-4343(96)00022-2
Gong, G.-C., Shiah, F.-K., Liu, K.-K., Wen, Y.-H., and Liang, M.-H. (2000). Spatial and temporal variation of chlorophyll a, primary productivity and chemical hydrography in the southern East China Sea. Cont. Shelf Res. 20, 411–436. doi: 10.1016/s0278-4343(99)00079-5
Gong, G.-C., Wen, Y.-H., Wang, B.-W., and Liu, G.-J. (2003). Seasonal variation of chlorophyll a concentration, primary production and environmental conditions in the subtropical East China Sea. Deep Sea Res. Part II 50, 1219–1236. doi: 10.1016/s0967-0645(03)00019-5
Gong, G.-C., Yang, W.-R., and Chang, J. (1995b). In vivo fluorescence-derived chlorophyll a concentrations in the southern East China Sea. Acta Oceanogr. Taiwan. 17, 73–85.
Gong, G.-C., Yang, W.-R., and Wen, Y.-H. (1993). Correlation of chlorophyll a concentration and sea tech fluorometer fluorescence in seawater. Acta Oceanogr. Taiwan. 31, 117–126.
Hong, H., Chai, F., Zhang, C., Huang, B., Jiang, Y., and Hu, J. (2011). An overview of physical and biogeochemical processes and ecosystem dynamics in the Taiwan Strai. Cont. Shelf Res. 31, 3–12.
Hu, J., Lan, W., Huang, B., Chiang, K.-P., and Hong, H. (2015). Low nutrient and high chlorophyll a coastal upwelling system – A case study in the southern Taiwan Strait. Estuar. Coast. Shelf Sci. 166, 170–177. doi: 10.1016/j.ecss.2015.05.020
Huang, T.-H., Chen, C.-T. A., Zhang, W.-Z., and Zhuang, X.-F. (2015). Varying intensity of Kuroshio intrusion into Southeast Taiwan Strait during ENSO events. Cont. Shelf Res. 103, 79–87. doi: 10.1016/j.csr.2015.04.021
Huang, T.-H., Lun, Z., Wu, C.-R., and Chen, C.-T. (2018). Interannual Carbon and Nutrient Fluxes in Southeastern Taiwan Strait. Sustainability 10:372. doi: 10.3390/su10020372
Jan, S., Sheu, D. D., and Kuo, H.-M. (2006). Water mass and throughflow transport variability in the Taiwan Strait. J. Geophys. Res. 111:C003656.
Jan, S., Tseng, Y.-H., and Dietrich, D. E. (2010). Sources of water in the Taiwan Strait. J. Oceanogr. 66, 211–221.
Jan, S., Wang, J., Chern, C.-S., and Chao, S.-Y. (2002). Seasonal variation of the circulation in the Taiwan Strait. J. Mar. Syst. 35, 249–268. doi: 10.1007/s11356-018-3093-9
Kirk, J. T. O. (1994). Light and Photosynthesis in Aquatic Ecosystems. New York, NY: Cambridge University Press.
Ko, D. S. (2003). Transport reversals at Taiwan Strait during October and November 1999. J. Geophys. Res. 108:C113370.
Ko, D. S., Chao, S.-Y., Wu, C.-C., Lin, I. I., and Jan, S. (2016). Impacts of tides and Typhoon Fanapi (2010) on Seas Around Taiwan. Terr. Atmos. Ocean. Sci. 27, 261–280. doi: 10.3319/tao.2015.10.28.01(oc)
Lee, Z., Weidemann, A., Kindle, J., Arnone, R., Carder, K. L., and Davis, C. (2007). Euphotic Zone Depth: Its Derivation and Implication to Ocean-Color Remote Sensing. New York, NY: US Naval Research Laboratory.
Liao, H. R., Yu, H. S., and Su, C. C. (2008). Morphology and sedimentation ofsand bodies in the tidal shelf sea of eastern Taiwan Strait. Mar. Geol. 248, 161–178. doi: 10.1016/j.margeo.2007.10.013
Naik, H., and Chen, C.-T. A. (2008). Biogeochemical cycling in the Taiwan Strait. Estuar. Coast. Shelf Sci. 78, 603–612. doi: 10.1016/j.ecss.2008.02.004
Shiah, F.-K., Chung, S.-W., Kao, S.-J., Gong, G.-C., and Liu, K.-K. (2000). Biological and hydrographical responses to tropical cyclones (typhoons) in the continental shelf of the Taiwan Strait. Cont. Shelf Res. 20, 2029–2044. doi: 10.1016/s0278-4343(00)00055-8
Smyth, K., Christie, N., Burdon, D., Atkins, J. P., Barnes, R., and Elliott, M. (2015). Renewables-to-reefs? - Decommissioning options for the offshore wind power industry. Mar. Pollut. Bull. 90, 247–258. doi: 10.1016/j.marpolbul.2014.10.045
Strickland, J. D. H., and Parsons, T. R. (1972). A Practical Handbook of Seawater Analysis. Ottawa: Fisheries Research Board of Canada.
Tsai, A.-Y., Gong, G.-C., Chung, C.-C., and Huang, Y.-T. (2018). Different impact of nanoflagellate grazing and viral lysis on Synechococcus spp. and picoeukaryotic mortality in coastal waters. Estuar. Coast. Shelf Sci. 209, 1–6. doi: 10.1016/j.ecss.2018.05.012
van der Molen, J., Smith, H. C. M., Lepper, P., Limpenny, S., and Rees, J. (2014). Predicting the large-scale consequences of offshore wind turbine array development on a North Sea ecosystem. Cont. Shelf Res. 85, 60–72. doi: 10.1016/j.csr.2014.05.018
Vanhellemont, Q., and Ruddick, K. (2014). Turbid wakes associated with offshore wind turbines observed with Landsat 8. Remote Sens. Environ. 145, 105–115. doi: 10.1016/j.rse.2014.01.009
Wilhelmsson, D., and Malm, T. (2008). Fouling assemblages on offshore wind power plants and adjacent substrata. Estuar. Coast. Shelf Sci. 79, 459–466. doi: 10.1016/j.ecss.2008.04.020
Keywords: primary production, Taiwan Strait, offshore wind farm, Changyun Rise, light transmission
Citation: Tseng H-C, You W-L, Huang W, Chung C-C, Tsai A-Y, Chen T-Y, Lan K-W and Gong G-C (2020) Seasonal Variations of Marine Environment and Primary Production in the Taiwan Strait. Front. Mar. Sci. 7:38. doi: 10.3389/fmars.2020.00038
Received: 02 October 2019; Accepted: 21 January 2020;
Published: 06 February 2020.
Edited by:
Joanne O’Callaghan, National Institute of Water and Atmospheric Research (NIWA), New ZealandReviewed by:
José Pinho, University of Minho, PortugalAlejandro Orfila, Spanish National Research Council (CSIC), Spain
Copyright © 2020 Tseng, You, Huang, Chung, Tsai, Chen, Lan and Gong. This is an open-access article distributed under the terms of the Creative Commons Attribution License (CC BY). The use, distribution or reproduction in other forums is permitted, provided the original author(s) and the copyright owner(s) are credited and that the original publication in this journal is cited, in accordance with accepted academic practice. No use, distribution or reproduction is permitted which does not comply with these terms.
*Correspondence: Gwo-Ching Gong, gcgong@mail.ntou.edu.tw