Quantifying Coral Reef Resilience to Climate Change and Human Development: An Evaluation of Multiple Empirical Frameworks
 Ashley H. Y. Bang1†
  Chao-Yang Kuo1†
  Colin Kuo-Chang Wen2
  Kah-Leng Cherh3
  Ming-Jay Ho1 Nien-Yun Cheng1,4 Yen-Chia Chen1
  Chaolun Allen Chen1,2,5*
- 1Biodiversity Research Center, Academia Sinica, Taipei, Taiwan
- 2Department of Life Science, Tunghai University, Taichung, Taiwan
- 3Sprouts Nature Education, Taichung, Taiwan
- 4Institute of Marine Biology, National Taiwan Ocean University, Keelung, Taiwan
- 5Department of Life Science, National Taiwan Normal University, Taipei, Taiwan
The integrity of coral reefs has increasingly been threatened by human development and climate change. As a result, the concept of ecological resilience – an ecosystem's capability to resist and recover from environmental stressors – has become an important aspect of coral reef conservation. In this study, coral reef resilience was quantitatively scored in Kenting National Park (KNP), Taiwan, using four different assessment frameworks: the first uses the opinions of local reef experts, the second includes metrics specific to the local reef context, the third combines the previous two approaches, and the fourth relies solely on ecological metrics from biodiversity surveys. To evaluate the accuracy of each assessment, the resulting resilience scores were compared with historical coral recovery rates, which served as a proxy for resilience. While each approach to measuring resilience has its merits and drawbacks, the picture of resilience became clearest when a few key indicators were included to reflect core ecosystem processes. Trends in resilience scores varied depending on the makeup of the assessment's indicators, and there was little correlation between the baseline metrics measured using different data collection methods. However, all resilience assessment trends indicated that KNP's Nanwan area is high in resilience. This is likely due to the effects of local tidally-induced upwelling, which significantly relieve the growing thermal stress placed on surrounding coral communities. Ultimately, the most successful assessments were those that empirically quantified ecological processes and local factors with only a few indicators, rather than broader approaches that measured many indicators. These findings are particularly relevant for reef managers to consider as they develop and employ resilience-based management strategies.
Introduction
Coral reefs are facing threats ranging from local to global scales: destructive fishing and water pollution degrades the integrity of local ecosystems (Meng et al., 2008), while climate change and ocean acidification hinders the survival and growth of coral communities worldwide [reviewed in Anthony (2016)]. During the recent third global bleaching event in 2014–2017, anomalously warm sea surface temperatures led to the loss of one-third of the Great Barrier Reef's coral cover (Hughes et al., 2018). Coral reproduction output was severely inhibited over the following year, further hindering the recovery of coral communities (Heron et al., 2016). Such disturbances will continue to increase in both frequency and severity in the future, making coral reef conservation more crucial than ever. From a management standpoint, understanding both the historic and future responses of corals to these stressors is critical to identifying areas of resilience for coastal and marine conservation (Roche et al., 2018).
Ecological resilience was first defined by Holling (1973) as the ability of an ecological system to absorb change and disturbance while maintaining system stability. Since then, the concept of resilience has been expanded upon by other authors, whereby the resilience of a system is predicated on its return time to a stable state following a disturbance [reviewed in Gunderson (2000)]. Within coral reefs, the idea that a system can return to an alternative stable state following a disturbance has also been established, balancing a baseline state of coral cover dominance with a second, macroalgae-dominated state (Mumby et al., 2007). More recently, McClanahan et al. (2012) adapted this definition to further highlight two key components of reef resilience: resistance and recovery, both of which are tangible and relevant to management strategies (Nyström et al., 2008).
The concept of resilience to global environmental change has been a cornerstone of recent coral reef ecosystem management strategies, leading to the development of numerous frameworks for its quantification (hereon referred to as resilience assessments) (Anthony et al., 2014; Standish et al., 2014). Seeing as the management outcomes may be influenced by the definition of resilience applied, the present study uses the definition from McClanahan et al. (2012), which others have also adopted in their resilience assessments on reef systems (e.g., Cinner et al., 2013; Anthony et al., 2014; Maynard et al., 2015).
Typically, resilience is scored based on a set of indicators that represent aspects of ecosystem states, functions, or processes (Lam et al., 2017). These indicators range from being broad and standardized to localized and fine-scale (Lam et al., 2020). Reef resilience was first quantified in by the IUCN in 2009 (Obura and Grimsditch, 2009). The framework, which applies 61 indicators, is one of the most comprehensive standardized assessments to date (Obura and Grimsditch, 2009). Subsequent studies have used a wide variety of metrics, data collection methods, and scopes [reviewed in Lam et al. (2017)], ranging from field-based surveys of ecological processes (e.g., Gibbs and West, 2019) to the Bayesian modeling of historical reef data (e.g., van Woesik, 2013).
Resilience quantification has only recently been incorporated into management strategies, and thus there are few long-term datasets that monitor resilience (Standish et al., 2014). Some resilience assessments have instead utilized existing long-term reef monitoring datasets, particularly coral cover, as proxies or indicators for resilience (Cinner et al., 2013; Mumby et al., 2014; Lam et al., 2017; Guest et al., 2018). Following disturbances, reefs with high coral cover are believed to have high resilience, as the remaining population has tolerated past stressors and is able to populate the next generation of recruits (Maynard et al., 2010). Coral cover data have been collected for decades to describe reef status and measure recovery from disturbances, making it ideal for use in quantifying resilience (West and Salm, 2003; Adjeroud et al., 2009; Sweatman et al., 2011). In particular, recovery rates calculated from coral cover have shown to be suitable instantaneous proxies for ecological resilience and recoverability (Lam et al., 2020).
On the other hand, a single indicator may not capture the multifaceted factors that underlie resilience, such as structural complexity, anthropogenic stressors, and ecosystem processes (Darling et al., 2019; Lam et al., 2020). To include these aspects, many resilience assessments include a wide variety of indicators extending beyond direct measures of coral population (Lam et al., 2017). Assessments also range in scope depending on the intended outcome and application. Broad-scope assessments, which have the advantage of being practical and accessible, typically utilize simplified scoring systems to qualitatively assess complex metrics (Lam et al., 2017; Gibbs and West, 2019; Obura and Grimsditch 2009). Some resilience assessments have also been tailored to suit the local environmental setting by starting with a previously established set of indicators and adding or removing indicators accordingly (Maynard et al., 2015; Gibbs and West, 2019). This approach makes use of existing taxonomically-specific survey data, hence improving the assessment's spatial and temporal resolution and rigor (Lam et al., 2017). Additionally, the inclusion of indicators that specifically represent the reef's capacity for resistance and recovery on a local level has been identified as a crucial component of effective resilience quantification (Maynard and Mcleod, 2012).
Despite the many resilience frameworks in existence, it is unclear whether the wide range of approaches yield similar resilience scores and conservation outcomes when applied to the same reef system. To address this gap, our study quantified the resilience of coral reefs in Kenting National Park (KNP), Taiwan, using four different frameworks. KNP is Taiwan's oldest established marine national park, and possesses high heterogeneity in environmental, biological, and anthropogenic factors that influence reef resilience across five park regions (Meng et al., 2008; Keshavmurthy et al., 2019) (Figure 1A). The reefs of KNP have demonstrated historical resilience to the impacts of climate change due to a variety of factors: (a) high genetic connectivity of corals within the West Pacific and South China Sea; (b) local tidally-influenced upwelling that ameliorates the effects of thermal stress; and (c) association with thermal-tolerant Synbiodinaceae (Chen and Keshavmurthy, 2009; Keshavmurthy et al., 2019). While these unique factors all contribute to the resilience of KNP's reefs to various climate change impacts, there has yet to be a quantitative assessment of resilience within this region. The four assessments used in this study apply a range of approaches and data collection methods, which are evaluated for the extent of overlap, or lack thereof, in resulting resilience scores and management implications. This investigation ultimately sheds light on which approaches allow for a practical yet accurate evaluation of resilience for direct application in reef management.
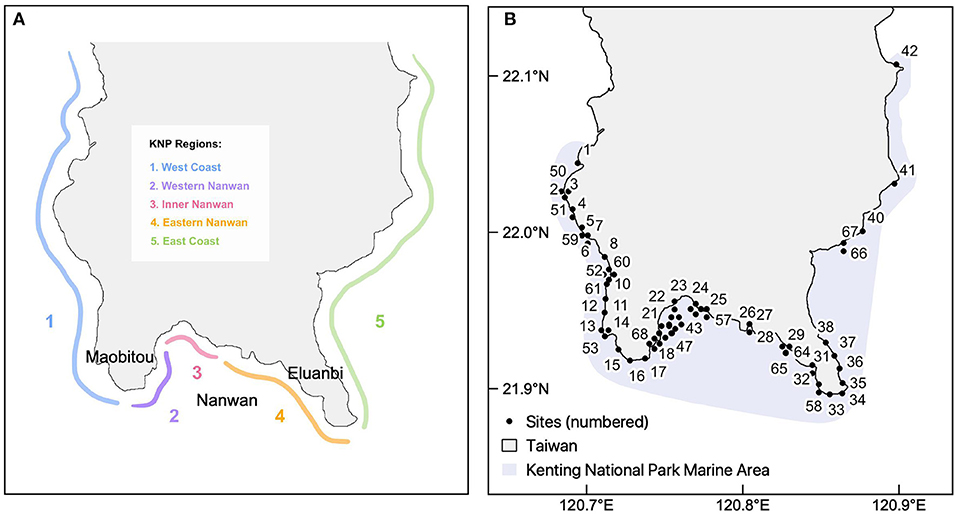
Figure 1. The five geographical regions of the Kenting National Park in southern Taiwan (A) and the 68 study sites (black points) (B).
Materials and Methods
Study Area
Located on the southernmost tip of Taiwan's Hengchun Peninsula, Kenting National Park (KNP) lies at the intersection of currents from the Bashi Channel, South China Sea, and Pacific Ocean. It is influenced by seasonal typhoon paths that approach Taiwan, mainly from the southeast [Dai, 1993; reviewed in Keshavmurthy et al. (2019)]. A section of the southern coast of KNP, Nanwan (meaning South Bay in Chinese, Figure 1A), is sheltered from typhoons and has highly localized tidally-induced upwelling throughout the year. This effect circulates cooler currents toward the surface and contributes to the high degree of ecological heterogeneity within KNP (Lee et al., 1999a,b). Additionally, KNP has a very low tidal range, with the difference between high and low tide in KNP being approximately one and a half meters.
In total, the park encompasses 152 km2 of coastal waters, managed through four zoning types: protected, landscape, recreation, and general use (Chen et al., 2017). This zoning system was established in 1984 and last updated in 2014 (Ho et al., 2016). Overall, the marine park provides habitats for over 300 coral species, 1,015 reef fish species, and 146 shellfish species (Dai, 1997, 2018). KNP is a also very popular tourist destination in Taiwan; several hundreds of thousands of visitors partake in recreational water sports and land-based tourist activities annually in KNP, particularly in Nanwan (Chen et al., 2017). Western Nanwan also houses a nuclear power plant, which has been expelling hot water effluent onto the surrounding reefs since its construction in 1985 (Keshavmurthy et al., 2012). Consequently, corals within the power plant's vicinity are constantly exposed to temperatures 2–3°C higher than other park areas (Keshavmurthy et al., 2012, 2019). These local factors make KNP a unique system to study both anthropogenic and ecological influences on reef resilience.
Biodiversity Field Surveys
The following indicators were measured through a comprehensive biodiversity survey conducted in the summer of 2014: coral species richness and diversity (Simpson's index), coral recruitment [referring to the abundance of juvenile corals <5 cm in size, see Obura and Grimsditch (2009)], fish biomass, and macroalgae cover (see Supplementary Table 1 for more detail). The biodiversity surveys were conducted at 68 reef sites in KNP, which were selected to represent coral communities along the coast at a high-resolution scale and reduce selection bias. Fifty-two sites were surveyed at 6-m depth, one at 10-m depth, nine at 15-m depth, and six at 25-m depth (Figure 1B). At each depth, the biological indicators were surveyed along a 60-m long transect haphazardly placed along the depth contours.
To survey adult coral assemblage composition and the abundance of coral recruitment, the 60-m transect was divided into four 10-m transects with 5-m intervals between transects. The same 60-m transect was divided into two 25-m transects with 5-m intervals to survey macroalgae abundance. Adult coral assemblage composition data were collected using the line intercept transect (LIT) method, coral recruitment was recorded along four 10-m × 0.5-m belt transects, and macroalgae abundance was measured using point intercept transects (PIT) at 0.5-m intervals along each 25-m transect [modified from the Reef Check protocol, see Hodgson et al. (2006)]. Corals of the World (Veron and Stafford-Smith, 2000) and Scleractinia of Taiwan I and II (Dai and Horng, 2009a,b) were used as guides to identify coral species.
The relative biomass of fish was surveyed along the 60-m transect, divided into two 30-m long sections, using the underwater visual census method (English and Wilkinson, 1997). Fish abundances and the body lengths were recorded in each 30-m by 5-m by 5-m belt transect. Marine Fishes in Kenting National Park (Chen and Kwang, 2010) was used as a guide to identify each fish to the species level. The abundance of fish in KNP were not substantially affected by the time of day at which the survey was conducted. The relative biomass of total fish at each site was estimated by summing the cubed body length of each fish. Each of the biological indicators was either directly scored from one (lowest resilience) to five (highest resilience), or the field measurements were statistically scaled from 1 to 5. This combined scoring/scaling method has been commonly used in frameworks that apply both field-based and evaluative scoring methods (Obura and Grimsditch, 2009; McClanahan et al., 2012).
Expert Opinion Workshop
In addition to the biodiversity survey data, resilience indicators were also scored via a workshop held with local coral reef experts. The expert opinion workshop capitalized on the multidecadal knowledge of reef experts and their holistic understanding of complex factors influencing coral reef resilience. They were asked to score 11 resilience indicators outlined in the evidence-based framework of McClanahan et al. (2012): coral diversity, coral recruitment, fish biomass, macroalgae, fishing pressure, resistant coral species, temperature variability, nutrients (pollution), sedimentation, physical human impacts, and coral disease (Table 1). The local reef experts scored the indicators for the same 68 sites on a 5-point Likert scale, with one denoting low resilience conditions and five denoting high resilience conditions as in the biodiversity surveys (McClanahan et al., 2012). Participants were also provided with detailed descriptions of scoring criteria from the IUCN's resilience assessment framework (Obura and Grimsditch, 2009, see Supplementary Table 2). Since Taiwanese coral reef ecology is a relatively small discipline, only four local experts possessed the requisite knowledge to perform the comprehensive evaluation required for the assessment. Though having so few workshop participants may have enhanced individual bias and uncertainty, this reason should not prevent resilience studies from being carried out in historically understudied reefs such as KNP.
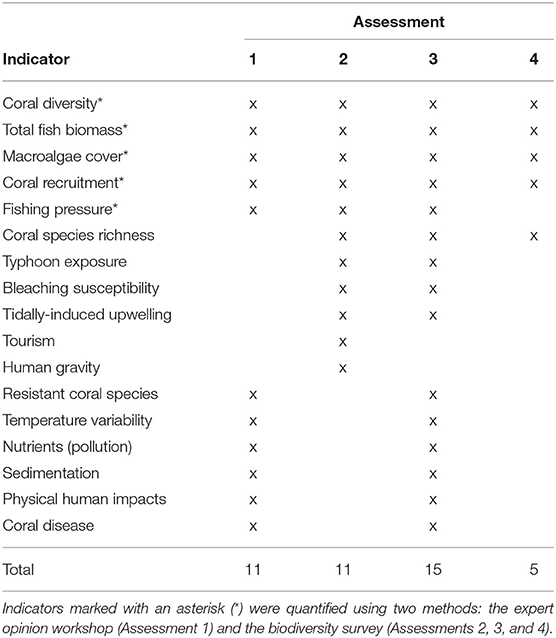
Table 1. Summary of indicators (marked with an “x”) used in four assessments: (1) workshop-scored indicators, (2) localized indicators and biodiversity survey metrics, (3) combined indicators from Assessments 1 and 2, (4) biodiversity survey metrics only.
Additional Resilience Indicators
The local coral reef experts consulted in the resilience scoring workshop also recommended the removal of six resilience indicators from the original McClanahan et al. (2012) framework and subsequent substitution with indicators that were more relevant to the local context. The indicators removed were: coral disease, resistant coral species, physical human impacts, temperature variability, nutrients, and sedimentation. These indicators were substituted with: bleaching susceptibility, human gravity [a measure of human accessibility to reefs, calculated by dividing the population of the nearest human settlement by the squared travel time to the reef site, see Cinner et al. (2018)], tourism, coral species richness, typhoon exposure, and tidally-induced upwelling (see Supplementary Tables 3, 4 for detailed explanation on indicator substitution).
The six additional indicators were quantified using existing data to produce scores for each site on the same scale as the previous indicators. Bleaching susceptibility was quantified by consulting coral reef experts to assign a bleaching sensitivity score (on a scale of one to five) for each coral genus within KNP. A site-specific bleaching susceptibility score was then calculated by multiplying the abundance of each genus by its sensitivity score. Human gravity was calculated from data from Taiwanese government reports on the populations of the nearest town to each reef site (Taiwan Ministry of the Interior, 2019). Similarly, the level of tourism at each site was quantified by the number of annual tourists visiting the nearest tourist landmark (Taiwan Ministry of the Interior, 2017). Coral species richness was calculated from the biodiversity survey dataset (see section Biodiversity field surveys). Typhoon exposure was scored by ranking each site for their geographic exposure to the two major typhoon paths influencing KNP (Dai, 1991; Kuo et al., 2011, 2012; Keshavmurthy et al., 2019). Lastly, tidally-induced upwelling data was adapted from previous measurements taken in KNP (Lee et al., 1999a,b) to score each site for its level of upwelling. Each of the indicators was scaled on a range of one to five, with one indicating low resilience conditions and five indicating high resilience conditions.
Resilience Assessment Frameworks
The four frameworks that were used to quantify resilience apply different combinations of indicators and data types (Table 1, further described below). In total, 17 resilience indicators were measured through quantitative or qualitative surveys and employed across the four frameworks (Tables 1, 2 and Supplementary Table 1). For each assessment, the resilience score for each site was calculated by averaging the scaled scores of the resilience indicators. Although some studies have explored the use of weighting systems for indicators (Maynard et al., 2010; Ladd and Collado-Vides, 2013; Gibbs and West, 2019), there is no clear evidence that implementing weighting schemes is effective (Maynard and Mcleod, 2012). Studies that have tested indicators under a variety of weighting systems have also showed that the resulting management actions and derived outcomes were largely unaffected by the weighting (Gibbs and West, 2019). Thus, the indicators in our resilience assessments were equally weighted.
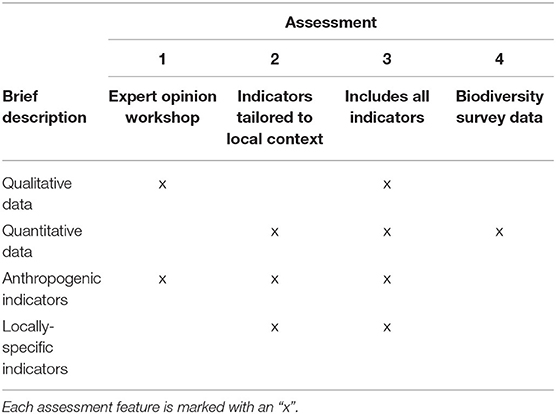
Table 2. Overview of different resilience assessments and comparison of approach types.
Assessment 1, the most generalized assessment approach, followed the protocol of the evidence-based framework of McClanahan et al. (2012) and used the 11 indicators scored in the expert opinion workshop (Table 1).
Assessment 2 adapted the framework from McClanahan et al. (2012) by incorporating the additional indicators that were reflective of the local context in KNP and quantified empirically. The indicators in this assessment were scored from the biodiversity surveys rather than the expert opinion workshop. A total of 11 indicators were used in this assessment, applying the six substitutions suggested by the local reef experts (Table 1).
Assessment 3 addressed the holistic approach applied in frameworks such as the IUCN's by using as many indicators as possible to calculate resilience (Obura and Grimsditch, 2009). Fifteen of the 17 total indicators measured were applied in this assessment, excluding the human gravity and tourism indicators to avoid redundancy with the physical human impacts indicator. This approach combined both the quantitative field data and qualitative workshop data described in the previous two assessment frameworks (Table 1).
Assessment 4 contrasts with Assessment 3 by focusing solely on characterizing resilience using field measurements of parameters indicative of a few key biological reef processes [as in Ladd and Collado-Vides (2013); Maynard et al., 2015, etc.]. Resilience was calculated from the five metrics directly measured in the biodiversity survey: coral diversity, species richness, coral recruitment, fish biomass, and macroalgae cover) (Table 1).
Coral recovery rate, calculated as the difference between coral cover in 2010 and 2016, was used to evaluate the outcomes of the resilience assessments (see Supplementary Table 1). The 2010 to 2016 timespan encompasses a period of rapid reef recovery between two major typhoon disturbances in KNP: Typhoon Morakot (2009) and Meranti (2016) (Kuo et al., 2011, 2012; Keshavmurthy et al., 2019). Multidecadal coral cover data for this period were obtained from the Long-Term Ecological Research (LTER) project, which recorded data at eight sites in KNP (Kuo et al., 2012; Keshavmurthy et al., 2019).
Spatial and Statistical Data Processing
Resulting resilience scores were classified into quartiles for comparison between assessments (Gibbs and West, 2019). The Kruskal-Wallis test (KW test) was used to test whether mean resilience scores differed significantly, and the Kolmogorov-Smirnov test (KS test) was used to conduct pairwise comparisons of resilience scores from each assessment. The extent to which scores from the expert opinion workshop and the field surveys overlapped was evaluated by calculating the Pearson's correlation coefficient (PCC) for indicators that were measured in both datasets (i.e., coral diversity, coral recruitment, macroalgae cover, fish biomass, and fishing pressure). All statistical data processing was carried out in R v.3.5.1 (R Core Team, 2020).
Spatial trends of relative resilience scores were analyzed on QGIS v3.8.1 (QGIS Development Team, 2020). The Moran's I index was calculated to test the null hypothesis that scores were randomly distributed throughout the study area. Scores from each assessment were then interpolated along a 500-m coastal buffer zone using the inverse distance weighting tool. The buffer zone was extended in parts of Nanwan, where study sites were >500 m from the shore. Coral recovery rates were also interpolated within this region for spatial comparison with resilience scores. Resilience scores were also compared with coral recovery rates for statistical correlation via the Pearson's correlation coefficient.
Results
Biodiversity Field Surveys
The ecological survey yielded over 21,000 data points on benthic composition, fish, macro-invertebrates, and coral recruitment (see Supplementary Table 5 for regional summary statistics and Supplementary Table 1). The west coast of KNP had the highest regional average of coral diversity (average = 0.876, Simpson's diversity index), though diversity was relatively high in all park regions barring the east coast (average = 0.738, Supplementary Table 5). Between 2010 and 2016, Western Nanwan had the highest mean living coral cover in 2016 (average = 61.0%) and the west coast had the lowest (average = 26.5%). The highest coral species richness was concentrated in Inner Nanwan (average = 47.1 species at each site), where the relative biomass of total fish (average = 643,600 cm3) was also the highest. The east coast had the lowest coral species richness (average = 27.4 species at each site) and the lowest relative biomass of total fish (average = 155,000 cm3).
Resilience Scores and Indicators
Resilience scores from the four assessments ranged between 2.28 and 4.28 at each site (Table 3), with the lowest and highest mean scores being 3.21 (Assessment 1) and 3.40 (Assessment 3). There were no significant differences between the average resilience score of each assessment and the group mean (KW test χ2 = 271, df = 237, p = 0.0639), though pairwise comparisons of assessments indicated significant differences in the distributions of four out of the six pairs (Table 4). There was little to no correlation in the indicators measured in both qualitative and quantitative surveying methods (Table 5). Coral diversity had the strongest correlation between the two datasets, but this was only moderate (PCC = 0.423, Table 5). Macroalgae cover had virtually no correlation between the two measurement methods (PCC = 0.042), while the others had correlation coefficients ranging from 0.141 to 0.396 (Table 5).
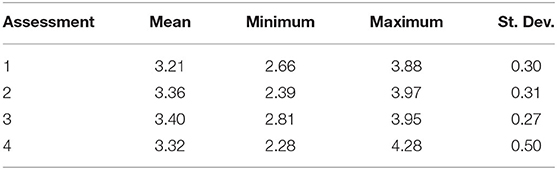
Table 3. Summary of resilience scores generated from the localized and generalized assessments.
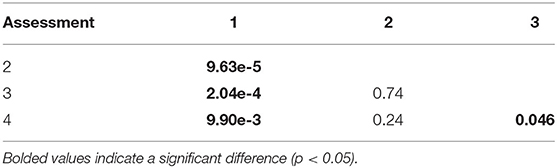
Table 4. P-values from the Kolmogorov-Smirnoff test comparing distributions of resilience scores in Assessments 1–4.
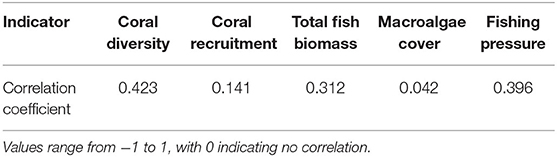
Table 5. Pearson's correlation coefficient for indicators scored by both qualitative (expert opinion workshop) and quantitative (biodiversity field survey) methods.
The breakpoints for resilience quartiles were 3.09 (25%), 3.31 (50%), and 3.55 (75%). Only six sites (39, 43, 45, 51, and 52) were grouped into in the same resilience quartile by all four assessments (Table 6). Fifteen sites were grouped into in the same quartile by three out of the four assessments, nine of which were classified as high resilience (4th quartile). In contrast, more than half of the sites (n = 38) were classified into three or even four different quartiles.
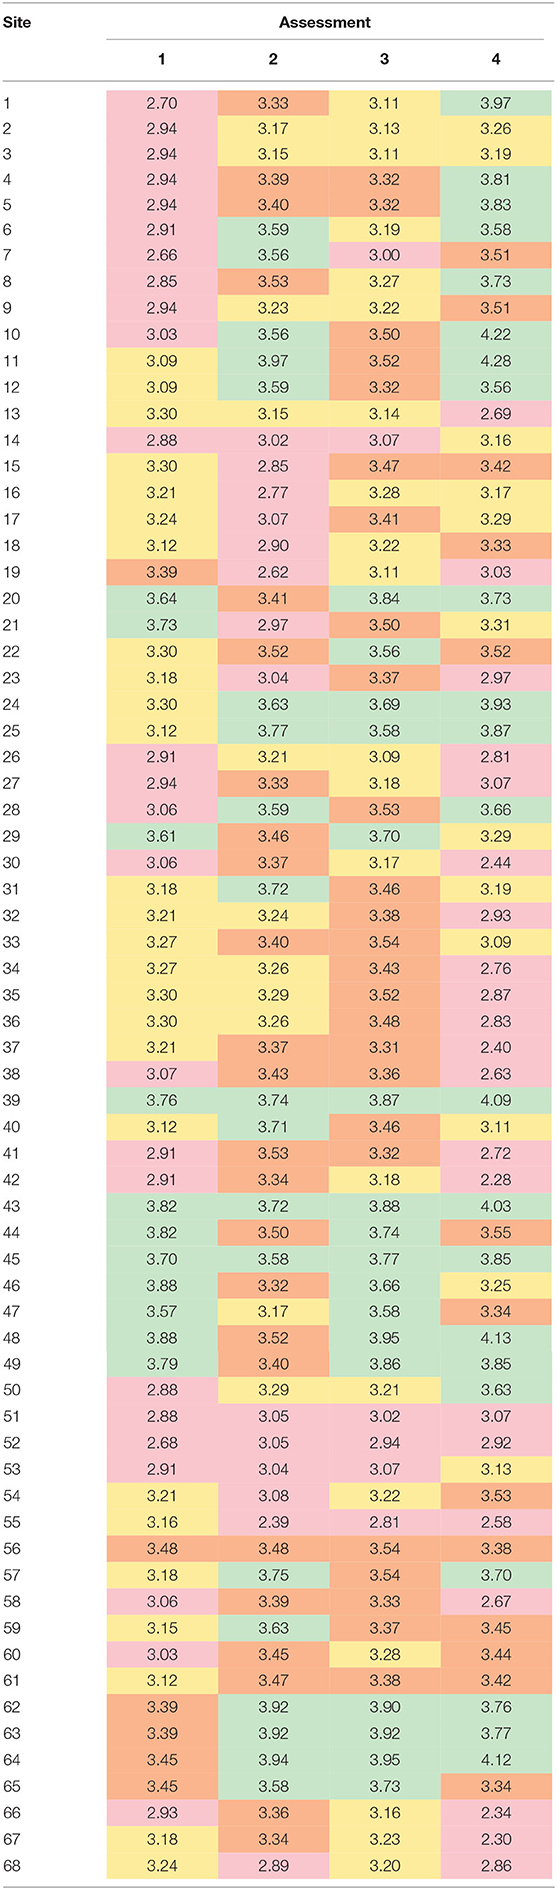
Table 6. Comparison of resilience quartiles between the four assessments at each site, where: Q1 (red, low resilience) is <3.09, Q2 (orange) is 3.09–3.31, Q3 (yellow) is 3.31–3.55, and Q4 (green, high resilience) is >3.55.
In all four assessments, the spatial distribution of resilience scores had a highly significant tendency toward clustering (Moran's Index, I = 0.261, p < 0.001). Most of the sites in Inner Nanwan (i.e., around sites 21–25) and part of Eastern Nanwan (i.e., sites 28 and 29) were identified as high resilience areas by all assessments, while the sites off the east coast of KNP (sites 35–42) generally had mid-to-low resilience (Figure 2). Other areas in KNP had spatial patterns of resilience that varied depending on the assessment (Figure 2). The two peninsulas of KNP, Eluanbi and Maobitou, had relatively high resilience in Assessment 1 (Figure 2A), but mid-level resilience in Assessment 3 and 4 (Figures 2C,D) and low resilience in Assessment 2 (Figure 2B). The west coast of KNP had mostly low resilience in Assessments 1 and 3, but very high resilience in Assessment 4. The resilience of western Nanwan reefs was interpreted differently by each assessment: high resilience by Assessment 1, mid/low by Assessments 3 and 4, and very low by Assessment 2.
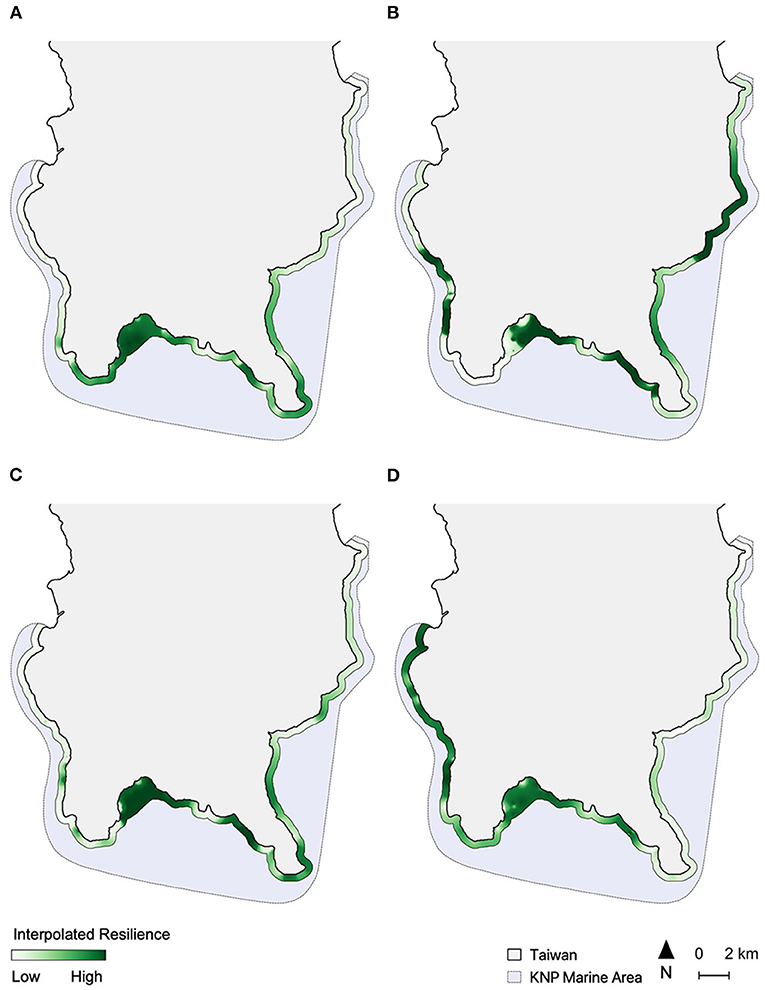
Figure 2. Spatial interpolation of relative resilience scores along a 500-m coastal buffer from each of the four assessments, including (A) Assessment 1; (B) Assessment 2; (C) Assessment 3, and (D) Assessment 4. Resilience score scales are relative for each map and colored on a quantile scale.
Coral Recovery Rates
The highest coral recovery rates were found in the innermost parts of Nanwan (mean recovery rate of 494.3%, see Supplementary Table 5), which is also where all resilience assessments identified high resilience reefs (Figure 3). Recovery rates were also relatively high off the southwestern coast of Hengchun Peninsula and in eastern Nanwan (mean recovery rate of 115.2%). The lowest site-based recovery rates were near Eluanbi and the nuclear power plant in western Nanwan (Figure 3) and the lowest regional recovery rate was along the east coast (mean recovery rate of −38.6%). These spatial patterns of coral cover recovery were most closely replicated in Assessments 2 and 4 (Figures 2B,D, 3). The resilience pattern of Assessment 1 largely lacked similarity to those of the coral recovery rates, particularly in Eluanbi and western Nanwan (Figures 2A, 3). Lastly, Assessment 3 classified Maobitou as low resilience and Eluanbi as relatively high resilience, which is the opposite of the coral recovery rate trends (Figures 2C, 3). Based on a visual comparison of spatial trends in coral recovery rates and the resilience scores, assessment performance can be ranked from high to low accuracy as follows: 4, 2, 1, 3 (Figures 2, 3). From a statistical correlation standpoint, the assessments rank 2, 4, 3, 1 (Pearson's correlation coefficient: 0368, 0.310, 0.283, 0.147, respectively).
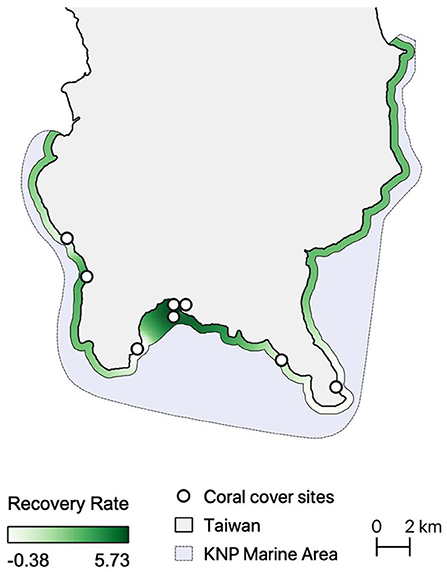
Figure 3. Spatial Interpolation of coral cover recovery rate (2010 vs. 2016) along a 500-m coastal buffer. The white points indicate the sites monitored by the Long-Term Ecological Research (LTER) project in Kenting National Park.
Discussion
This study is the first to investigate how resilience scores are affected by different assessment approaches. We tested four resilience assessment frameworks to score resilience in KNP, Taiwan, yielding unique insights into ecological resilience quantification. The study also highlights the importance of in-situ quantitative studies on ecological processes, which have shown to be more reliable indicators of resilience than qualitatively-assessed indicators.
Influence of Indicator Selection on Resilience Scores
Our analysis demonstrated that Assessments 2 and 4 generally showed resilience trends with better consistency than did the broader-scale and qualitative Assessments 1 and 3. The substantial variation in scores between assessments can largely be attributed to differences in indicator selection. In many of the studied sites, indicators were scored similarly in the expert opinion workshop and biodiversity survey, but the overall resilience score and quartile ranking varied depending on the assessment's set of indicators. For instance, all four assessments were in general consensus with low scores for coral recruitment, fish biomass, tourism, and human impacts at western Nanwan sites (e.g., sites 18, 19, 54). Yet, overall resilience scores diverged due to the inclusion of other indicators in some assessments that detracted from the overall similarities. Incorporating sedimentation, nutrient pollution, and coral disease in Assessments 1 and 3 increased the resilience scores at these sites, while scores remained low in Assessments 2 and 4 without these indicators. This example illustrates how the inclusion of different indicators can influence the final resilience score of a site despite the core ecological processes conferring the same level of resilience.
The method of data collection can also lead to large differences in resilience scores, as seen in the weak correlation between the datasets of five indicators measured in both the expert opinion workshop and biodiversity survey. This lack of overlap highlights the discrepancies between qualitative, opinion-based scoring and empirical, field-based scoring in the context of resilience quantification. Our use of an expert opinion workshop incites the assumption that the experts are both accurate and relatively consistent with one another, though a certain degree of dissonance amongst individual opinions is unavoidable (Lam et al., 2020). The large majority of similar studies quantified their indicators through field surveys resembling our biodiversity surveys (e.g., Cinner et al., 2013; Maynard et al., 2015; Hock et al., 2017), suggesting that this approach may be more suitable for resilience assessments than expert scoring. The opinions of experts, however, are still valuable in shaping the framework approach and indicator selection [as in Gibbs and West (2019)] and offering insight into the validity of quantified resilience scores (McClanahan et al., 2012).
Previous resilience studies have shown that assessment outcomes are sensitive to the number of indicators used, in which more indicators do not necessarily lead to a better portrayal of resilience (Lam et al., 2020). The incremental importance of each indicator diminishes as the total number of indicators increases, and scores thus tend to revert to the group average (Maynard and Mcleod, 2012; McClanahan et al., 2012). Indeed, we found that the assessment that applied the most indicators had the least reliable outcome: Assessment 3 included a combination of different data collection methods using 17 diverse indicators, yet yielded the least congruous results (Figure 2). Therefore, the inclusion of more indicators and data types in the hopes of “covering all the bases” is not necessarily beneficial when it comes to quantifying reef resilience (McClanahan et al., 2012; Mumby et al., 2014).
Strengths of a Localized and Succinct Approach
The success of Assessment 4, which consisted of five indicators that characterize ecological processes, suggests that resilience can be modeled relatively well with a few key indicators. It may thus be redundant to include anthropogenic drivers that are already reflected in baseline ecological and environmental indicators. Including such indicators, like pollution, fishing, or even typhoon exposure, may introduce a level of bias or error that outweighs the indicator's marginal contribution to resilience modeling. Like many prior resilience studies, the succinct approach of Assessment 4 has shown success because it places ecosystem processes and biodiversity at the focal point of resilience (Hughes et al., 2005). Other resilience assessments conducted on similar spatial scales have also successfully calculated relative resilience without factoring in anthropogenic indicators (e.g., Maynard et al., 2015).
Furthermore, the assessments in our study that utilized empirically measured field data (Assessments 2 and 4) performed better than did those that used qualitative data derived from expert opinion (Assessments 1 and 3). Resilience assessments, therefore, need not stray too far from traditional biodiversity surveys, which capture aspects of baseline ecological functions at a high resolution (Lam et al., 2017). Since the diversity of species and functional groups have been established as key supporters of ecosystem resilience, metrics that quantify these features are important components of resilience assessments (Walker et al., 1999; Gunderson, 2000).
Existing historical reef monitoring programs can easily be adapted to suit resilience frameworks, as demonstrated in our study (Bachtiar et al., 2019; Gibbs and West, 2019). These are important considerations to keep in mind when designing future resilience assessments, especially to maximize the use of time, energy, and funding resources. The inclusion of locally-relevant indicators in Assessment 2 contributed to its success in portraying resilience, particularly because the level of influence of each indicator is dependent on the environmental setting (Maynard and Mcleod, 2012). However, this approach is limited in that not all reefs have high-resolution, long-term monitoring data for multiple resilience indicators. Field survey data represent a single time point, while scoring conducted via expert opinions capitalizes on the multidecadal, holistic knowledge of its scorers (Lam et al., 2017).
Despite the four assessments having diverging trends, all four identified KNP's Nanwan region, particularly Inner Nanwan, as high resilience areas. This is likely driven by the effects of tidally-influenced upwelling, which provides significant year-round cooling effects to relieve thermal stress placed on the coral communities (Keshavmurthy et al., 2019). This effect is particularly strong in Inner and Western Nanwan, where maximum summer temperature fluctuations can range from 4 to 5°C within 2 h (Keshavmurthy et al., 2019). Additionally, Nanwan is sheltered from direct damage from oncoming typhoons, but is simultaneously well-positioned to benefit from the dissipation of warm surface waters by cool storm surges induced by the typhoons (Keshavmurthy et al., 2019). A combination of these unique local environmental effects contributes to the consistent identification of Nanwan as a high resilience region in all assessments.
One important caveat of the present study was that our proxy for resilience, coral cover, is just one metric that characterizes a complex ecological concept. There are other aspects of reef dynamics, such as coral assemblage composition, that cannot be captured by coral cover, yet also contribute to the holistic picture of resilience. However, we currently do not have additional data to expand our resilience assessment analysis and instead have endeavored to provide an initial overview given the data constraints. In the coming years, we hope to conduct more comprehensive surveys in KNP and work toward a more sophisticated portrayal of resilience.
Toward a Better Resilience Assessment
Our results show that while each approach to measuring resilience has its merits and drawbacks, the picture of resilience becomes clearest when a few key indicators are included to reflect core ecosystem processes and locally-relevant factors. The assessment that included as many indicators as possible was less successful at capturing resilience than was the one that concisely quantified key ecological processes, thus suggesting that “less is more” when it comes to selecting the number of indicators in a resilience assessment. We also found that individual indicator selection is a critical component of the framework design that is highly influential over scoring outcomes. As such, it is important to thoroughly consider the resilience framework's design within the context of specific reef management goals and the local environmental setting.
Some studies assert the need for a standardized resilience scoring system that can be applied across all reefs (e.g., Hodgson et al., 2015), but this comes with the loss of crucial factors such as local specificity. The exclusion of metrics that characterize the unique mechanisms governing the ecosystem's shifts to alternative stable states, a key aspect in recent resilience concepts, may lead to an inaccurate portrayal of resilience (Petraitis and Dudgeon, 2016; Lam et al., 2020). Resilience assessments must also be adapted to complement the scale at which management strategies are being implemented (Lam et al., 2020). The findings produced from our analysis of different frameworks approaches and data collection methods support this notion, which can be further explored in future resilience assessments.
In our study, each approach interpreted resilience in KNP's reefs differently, but the high degree of dissonance was largely ameliorated through cross-checking areas with their resilience quartile classifications. The application of multiple approaches or data collection methods can thus be an effective way to ascertain a more holistic and accurate portrayal of reef resilience. Overall, when employed with careful planning and consideration, resilience assessments are a powerful tool for enacting practical conservation strategies. Our holistic snapshots of reef health and relative resilience to environmental changes makes these frameworks highly valuable to coral reef ecologists, managers, and policymakers alike.
Data Availability Statement
The raw data supporting the conclusions of this article will be made available by the authors, without undue reservation.
Author Contributions
All authors contributed to the conception and design of the study. CC, CW, C-YK, K-LC, M-JH, N-YC, and Y-CC conducted the field data collection. AB conducted the data processing and analysis and wrote the first draft of the manuscript. AB, CC, CW, C-YK, and K-LC contributed to manuscript revisions. All authors have read and approved of the submitted version.
Funding
Research for this project funded by a Research Fellows Grant from the Fulbright Program and the Foundation for Scholarly Exchange (Fulbright Taiwan) awarded to AB, the Academia Sinica Postdoctoral Fellowship awarded to C-YK, and the Long-Term Ecological Research grant from Kenting National Park Headquarters to CC.
Conflict of Interest
The authors declare that the research was conducted in the absence of any commercial or financial relationships that could be construed as a potential conflict of interest.
Acknowledgments
Many thanks to the lab members of Coral Reef Evolutionary and Ecological Genetic Laboratory of the Biodiversity Research Center, Academia Sinica, for providing logistical support and conducting fieldwork for the long-term ecological research (LTER) and reef surveys of the Kenting National Park (KNP), Taiwan. We thank Aichi Chung and Chieh Wei for contributing their expertise to the generalized resilience assessment workshop. We also thank Noah Last of Third Draft Editing for his English language editing.
Supplementary Material
The Supplementary Material for this article can be found online at: https://www.frontiersin.org/articles/10.3389/fmars.2020.610306/full#supplementary-material
References
Adjeroud, M., Michonneau, F., Edmunds, P. J., Chancerelle, Y., Lison de Loma, T., Penin, L., et al. (2009). Recurrent disturbances, recovery trajectories, and resilience of coral assemblages on a South Central Pacific reef. Coral Reefs 28, 775–780. doi: 10.1007/s00338-009-0515-7
Anthony, K. R. N. (2016). Coral reefs under climate change and ocean acidification: challenges and opportunities for management and policy. Annu. Rev. Env. Resour. 41, 59–81. doi: 10.1146/annurev-environ-110615-085610
Anthony, K. R. N., Marshall, P. A., Abdulla, A., Beeden, R., Bergh, C., Black, R., et al. (2014). Operationalizing resilience for adaptive coral reef management under global environmental change. Glob. Change Biol. 21, 48–61. doi: 10.1111/gcb.12700
Bachtiar, I., Suharsono, A. D., and Neviaty, P. Z. (2019). Practical resilience index for coral reef assessment. Ocean Sci. J. 54, 117–127. doi: 10.1007/s12601-019-0002-1
Chen, C. A., and Keshavmurthy, S. (2009). Taiwan as a connective stepping-stone in the Kuroshio traiangle and the conservation of coral ecosystems under the impacts of climate change. Kuroshio Sci. 3, 15–22.
Chen, J.-P., and Kwang, T.-S. (2010). Marine Fishes in Kenting National Park, 1st Revised Edn. Kenting: Kenting National Park Headquarters.
Chen, Y.-J., Cai, Y.-L., and Zhang, Q.-H. (2017). Monitoring Survey of Fishing Resource of Kenting National Park (In Chinese). Kenting: Kenting National Park Headquarters.
Cinner, J. E., Huchery, C., Darling, E. S., Humphries, A. T., Graham, N. A. J., Hicks, N. M., et al. (2013). Evaluating social and ecological vulnerability of coral reef fisheries to climate change. PloS ONE 8:e74321. doi: 10.1371/journal.pone.0074321
Cinner, J. E., Maire, E., Huchery, C., MacNeil, A., Graham, N. A. J., Mora, C., et al. (2018). Gravity of human impacts mediates coral reef conservation gains. Proc. Natl. Acad. Sci. U.S.A. 115, e6116–e6125. doi: 10.1073/pnas.1708001115
Dai, C.-F. (1991). Reef environment and coral fauna of southern Taiwan. Atoll. Res. Bull. 354, 1–24. doi: 10.5479/si.00775630.354.1
Dai, C.-F. (1993). Patterns of coral distribution and benthic space partitioning on the fringing reefs of Southern Taiwan. Mar. Ecol. 14, 185–204. doi: 10.1111/j.1439-0485.1993.tb00479.x
Dai, C.-F. (1997). Assessment of the present health of coral reefs in Taiwan. Status of Coral Reefs in the Pacific. UNIHI Sea Grant CP-98-01. Honolulu, HI: University of Hawaii, 123–131.
Dai, C.-F. (2018). “Coastal and shallower water ecosystem,” in Regional Oceanography of Taiwan Version II, ed S. Jan (Taipei: National Taiwan University Press), 263–299.
Dai, C.-F., and Horng, S. (2009a). Scleractinia of Taiwan I. The Complex Group. Taipei: National Taiwan University.
Dai, C.-F., and Horng, S. (2009b). Scleractinia of Taiwan II. The Robust Group. Taipei: National Taiwan University.
Darling, E. S., McClanahan, T. R., Maina, J., Gurney, G. G., Graham, N. A. J., Januchowski-Hartley, F., et al. (2019). Social–environmental drivers inform strategic management of coral reefs in the Anthropocene. Nat. Ecol. Evol. 3, 1341–1350. doi: 10.1038/s41559-019-0953-8
English, S. A., and Wilkinson, C. R. (1997). Survey Manual for Tropical Marine Resources, 2nd Edn. Townsville, QLD: Australian Institute of Marine Science.
Gibbs, D. A., and West, J. M. (2019). Resilience assessment of Puerto Rico's coral reefs to inform reef management. PLoS ONE 14:e0224360. doi: 10.1371/journal.pone.0224360
Guest, J. R., Edmunds, P. J., Gates, R. D., Kuffner, I. B., Andersson, A. J., Barnes, B. B., et al. (2018). A framework for identifying and characterising coral reef “oases” against a backdrop of degradation. J. Appl. Ecol. 55, 2865–2875. doi: 10.1111/1365-2664.13179
Gunderson, L. H. (2000). Ecological resilience – in theory and application. Ann. Rev. Ecol. Syst. 31, 425–439. doi: 10.1146/annurev.ecolsys.31.1.425
Heron, S. F., Maynard, J. A., van Hooidonk, R., and Eakin, C. M. (2016). Warming trends and bleaching stress of the world's coral reefs 1985-2012. Sci. Rep. 6:e38402. doi: 10.1038/srep38402
Ho, M.-J., Cheng, N.-Y., Chen, Y.-C., Kuo, C.-Y., Wen, C. K.-C., Cherh, K.-L., et al. (2016). Investigating current status of benthic ecology in the Kenting National Park Marine zones, Taiwan. J. Nat. Park. 26, 46–56.
Hock, K., Wolff, N. H., Oritz, J. C., Condie, S. A., Anthony, K. R. N., Blackwell, P. G., et al. (2017). Connectivity and systemic resilience of the great barrier reef. PLoS Biol. 15:e2003355. doi: 10.1371/journal.pbio.2003355
Hodgson, D., McDonald, J. L., and Hosken, D. J. (2015). What do you mean, ‘resilient'? Trends Ecol. Evol. 30, 503–506. doi: 10.1016/j.tree.2015.06.010
Hodgson, G., Kiene, W., Mihaly, J., Liebeler, J., Shuman, C., and Maun, L. (2006). A Guide to Coral Reef Monitoring. Instruction Manual. Pacific Palisades, CA: Reef Check Foundation, 1–86.
Holling, C. S. (1973). Resilience and stability in ecological systems. Annu. Rev. Ecol. Evol. Syst. 4, 1–23. doi: 10.1146/annurev.es.04.110173.000245
Hughes, T. P., Bellwood, D. R., Folke, C., Steneck, R. S., and Wilson, J. (2005). New paradigms for supporting the resilience of marine ecosystems. Trends Ecol. Evol. 20, 380–386. doi: 10.1016/j.tree.2005.03.022
Hughes, T. P., Kerry, J. T., Baird, A. H., Connolly, S. R., Dietzel, A., Eakin, C. M., et al. (2018). Global warming transforms coral reef assemblages. Nature 556, 492–496. doi: 10.1038/s41586-018-0041-2
Keshavmurthy, S., Hsu, C.-M., Kuo, C.-Y., Meng, P.-J., Wang, J.-T., and Chen, C. A. (2012). Symbiont communities and host genetic structure of the brain coral Platygyra verweyi, at the outlet of a nuclear power plant and adjacent areas. Mol. Ecol. 21, 4393–4407. doi: 10.1111/j.1365-294X.2012.05704.x
Keshavmurthy, S., Kuo, C.-Y., Huang, Y.-Y., Carballo-Bolaños, R., Meng, P.-J., Wang, J.-T., et al. (2019). Coral reef resilience in Taiwan: lessons from long- term ecological research on the coral reefs of Kenting National Park. J. Mar. Sci. Eng. 7:388. doi: 10.3390/jmse7110388
Kuo, C.-Y., Meng, P.-J., Wang, J.-T., Chen, J.-P., Chiu, Y.-W., Lin, H.-J., et al. (2011). Damage to the reefs of Siangjiao Bay marine protected area in Kenting National Park, Taiwan during Typhoon Morakot. Zool. Stud. 50:85. Available online at: http://hdl.handle.net/11455/71637
Kuo, C.-Y., Yuen, Y. S., Meng, P.-J., Ho, P.-H., Wang, J.-T., Liu, P.-J., et al. (2012). Recurrent disturbances and the degradation of hard coral communities in Taiwan. PLoS ONE 7:e44364. doi: 10.1371/journal.pone.0044364
Ladd, M. C., and Collado-Vides, L. (2013). Practical applications of monitoring results to improve managing for coral reef resilience: a case study in the Mexican Caribbean. Biodiv. Cons. 22, 1591–1608. doi: 10.1007/s10531-013-0493-5
Lam, V. Y. Y., Doropoulos, C., Bozec, Y., and Mumby, P. J. (2020). Resilience concepts and their application to coral reefs. Front. Ecol. Evol. 8, 1–14. doi: 10.3389/fevo.2020.00049
Lam, V. Y. Y., Doropoulos, C., and Mumby, P. J. (2017). The influence of resilience-based management on coral reef monitoring: a systematic review. PLoS ONE 12:e0172064. doi: 10.1371/journal.pone.0172064
Lee, H.-J., Chao, S.-Y., and Fan, K.-L. (1999a). Flood-ebb disparity of tidally induced recirculation Eddies in a semi-enclosed basin: Nan Wan Bay. Cont. Shelf Res. 19, 871–890. doi: 10.1016/S0278-4343(99)00006-0
Lee, H.-J., Chao, S.-Y., Fan, K.-L., and Kuo, T.-Y. (1999b). Tide-induced eddies and upwelling in a semi-enclosed basin: Nan Wan. Estuarine Coastal Shelf Sci. 49, 775–787. doi: 10.1006/ecss.1999.0524
Maynard, J. A., Marshall, P. A., Johnson, J. E., and Harman, S. (2010). Building resilience into practical conservation: identifying local management responses to global climate change in the southern great barrier reef. Coral Reefs 29, 381–391. doi: 10.1007/s00338-010-0603-8
Maynard, J. A., McKagan, S., Raymundo, L., Johnson, S., Ahmadia, G. N., Johnston, L., et al. (2015). Assessing relative resilience potential of coral reefs to inform management. Biol. Conserv. 192, 109–119. doi: 10.1016/j.biocon.2015.09.001
Maynard, J. A., and Mcleod, K. (2012). How-to-Guide for Conducting Resilience Assessments. Available online at: https://www.reefresilience.org/pdf/How-to_Guide_Final.pdf (accessed January 2, 2020).
McClanahan, T. R., Donner, S. D., Maynard, J. A., MacNeil, M. A., Graham, N. A. J., Maina, J., et al. (2012). Prioritizing key resilience indicators to support coral reef management in a changing climate. PLoS ONE 7:e42884. doi: 10.1371/journal.pone.0042884
Meng, P. J., Lee, H. J., Wang, J. T., Chen, C. C., Lin, H. J., Tew, K. S., et al. (2008). A long-term survey on anthropogenic impacts to the water quality of coral reefs, southern Taiwan. Environ. Pollut. 156, 67–75. doi: 10.1016/j.envpol.2007.12.039
Mumby, P. J., Chollett, I., Bozec, Y. M., and Wolff, N. H. (2014). Ecological resilience, robustness and vulnerability: how do these concepts benefit ecosystem management? Curr. Opin. Environ. Sust. 7, 22–27. doi: 10.1016/j.cosust.2013.11.021
Mumby, P. J., Hastings, A., and Edwards, H. J. (2007). Thresholds and the resilience of Caribbean coral reefs. Nature 450, 98–101. doi: 10.1038/nature06252
Nyström, M., Graham, N., Lokrantz, J., and Norström, A. (2008). Capturing the cornerstones of coral reef resilience: linking theory to practice. Coral Reefs 27, 795–809. doi: 10.1007/s00338-008-0426-z
Obura, D., and Grimsditch, G. (2009). “Resilience Assessment of coral reefs—Assessment protocol for coral reefs, focusing on coral bleaching and thermal stress.” in IUCN Working Group on Climate Change and Coral Reefs (Gland: IUCN). Available online at: https://www.icriforum.org/wp-content/uploads/2019/12/resilience_assessment_final.pdf
Petraitis, P. S., and Dudgeon, S. R. (2016). Cusps and butterflies: multiple stable states in marine systems as catastrophes. Mar. Freshwater Res. 67, 37–46. doi: 10.1071/MF14229
QGIS Development Team (2020). ‘QGIS Geographic Information System', Open Source Geospatial Foundation Project. Available online at: http://qgis.osgeo.org (accessed December 5, 2020).
R Core Team (2020). R: A Language and Environment for Statistical Computing. R Foundation for Statistical Computing, Vienna, Austria. Available online at: https://www.R-project.org/ (accessed November 8, 2020).
Roche, R. C., Williams, G. J., and Turner, J. R. (2018). Towards developing a mechanistic understanding of coral reef resilience to thermal stress across multiple scales. Curr. Clim. Change Rep. 4, 51–64. doi: 10.1007/s40641-018-0087-0
Standish, R. J., Hobbs, R. J., Mayfield, M. M., Bestelmeyer, B. T., Suding, K. N., Battaglia, L. L., et al. (2014). Resilience in ecology: abstraction, distraction, or where the action is? Biol. Conserv. 177, 43–51. doi: 10.1016/j.biocon.2014.06.008
Sweatman, H., Delean, S., and Syms, C. (2011). Assessing loss of coral cover on Australia's great barrier reef over two decades, with implications for longer-term trends. Coral Reefs 30, 521–531. doi: 10.1007/s00338-010-0715-1
Taiwan Ministry of the Interior (2017). Fourth Comprehensive Review of Kenting National Park (In Chinese). Kenting: Kenting National Park Headquarters.
Taiwan Ministry of the Interior (2019). Number of Households and Population by Village. Dataset (In Chinese). Available online at: https://data.moi.gov.tw/MoiOD/Data/DataList.aspx (accessed September 26, 2019).
van Woesik, R. (2013). Quantifying uncertainty and resilience on coral reefs using a Bayesian approach. Environ. Res. Lett. 8, 1–8. doi: 10.1088/1748-9326/8/4/044051
Veron, J. E. N., and Stafford-Smith, M. (2000). Corals of the World. Townsville: Australian Institute of Marine Science.
Walker, B., Kinzig, A., and Langridge, J. (1999). Plant attribute diversity, resilience, and ecosystem function: the nature and significance of dominant and minor species. Ecosystems 2, 95–113. doi: 10.1007/s100219900062
Keywords: coral reef co nservation, ecological resilience, resilience assessment, marine protected areas, Taiwan
Citation: Bang AHY, Kuo C-Y, Wen CK-C, Cherh K-L, Ho M-J, Cheng N-Y, Chen Y-C and Chen CA (2021) Quantifying Coral Reef Resilience to Climate Change and Human Development: An Evaluation of Multiple Empirical Frameworks. Front. Mar. Sci. 7:610306. doi: 10.3389/fmars.2020.610306
Received: 25 September 2020; Accepted: 15 December 2020;
Published: 13 January 2021.
Edited by:
Nina Yasuda, University of Miyazaki, JapanReviewed by:
Lyndon Mark DeVantier, Coral Reef Research, AustraliaHironobu Fukami, University of Miyazaki, Japan
Copyright © 2021 Bang, Kuo, Wen, Cherh, Ho, Cheng, Chen and Chen. This is an open-access article distributed under the terms of the Creative Commons Attribution License (CC BY). The use, distribution or reproduction in other forums is permitted, provided the original author(s) and the copyright owner(s) are credited and that the original publication in this journal is cited, in accordance with accepted academic practice. No use, distribution or reproduction is permitted which does not comply with these terms.
*Correspondence: Chaolun Allen Chen, cac@gate.sinica.edu.tw
†These authors have contributed equally to this work