CMEMS-Based Coastal Analyses: Conditioning, Coupling and Limits for Applications
 Agustin Sanchez-Arcilla1*
  Joanna Staneva2
  Luigi Cavaleri3
  Merete Badger4
  Jean Bidlot5
  Jacob T. Sorensen6
  Lars B. Hansen7
  Adrien Martin8
  Andy Saulter9
  Manuel Espino1
  Mario M. Miglietta10
  Marc Mestres1
  Davide Bonaldo3
  Paolo Pezzutto3
  Johannes Schulz-Stellenfleth2
  Anne Wiese2
  Xiaoli Larsen4
  Sandro Carniel3 Rodolfo Bolaños11 Saleh Abdalla5
  Alessandro Tiesi10
- 1Universitat Politecnica de Catalunya, BarcelonaTech (UPC), Barcelona, Spain
- 2Institute of Coastal Systems, Helmholtz Centre for Materials and Coastal Research (HZG), Geesthacht, Germany
- 3Institute of Marine Science, National Research Council (CNR), Venezia, Italy
- 4Technical University of Denmark (DTU), Lyngby, Denmark
- 5European Centre for Medium-Range Weather Forecasts, Reading, United Kingdom
- 6Danish Hydrologic Institute, Copenhagen, Denmark
- 7Danish Hydraulic Institute (DHI) – DHI GRAS, Hørsholm, Denmark
- 8National Oceanography Centre, University of Southampton, Southampton, United Kingdom
- 9Met Office, Exeter, United Kingdom
- 10Institute of Atmospheric Sciences and Climate (CNR-ISAC), Bologna, Italy
- 11DHI, Hørsholm, Denmark
Recent advances in numerical modeling, satellite data, and coastal processes, together with the rapid evolution of CMEMS products and the increasing pressures on coastal zones, suggest the timeliness of extending such products toward the coast. The CEASELESS EU H2020 project combines Sentinel and in-situ data with high-resolution models to predict coastal hydrodynamics at a variety of scales, according to stakeholder requirements. These predictions explicitly introduce land discharges into coastal oceanography, addressing local conditioning, assimilation memory and anisotropic error metrics taking into account the limited size of coastal domains. This article presents and discusses the advances achieved by CEASELESS in exploring the performance of coastal models, considering model resolution and domain scales, and assessing error generation and propagation. The project has also evaluated how underlying model uncertainties can be treated to comply with stakeholder requirements for a variety of applications, from storm-induced risks to aquaculture, from renewable energy to water quality. This has led to the refinement of a set of demonstrative applications, supported by a software environment able to provide met-ocean data on demand. The article ends with some remarks on the scientific, technical and application limits for CMEMS-based coastal products and how these products may be used to drive the extension of CMEMS toward the coast, promoting a wider uptake of CMEMS-based predictions.
Introduction
Coastal metocean dynamics are typically characterized by tight interactions among a wide range of hydrodynamic, wave, and atmospheric processes (with scales ranging from 0.1 to 10 km and from 0.1 s to several seasons or longer), modulated by topo-bathymetric gradients. In shallow water, the relative thickness of surface and bottom boundary layers magnify the importance of air-sea-bed interactions, which control local dynamics. These interactions are mostly non-linear, and influence met-ocean predictions through several mechanisms, such as depth-induced wave breaking, topographic waves, up/downwelling, or bathymetric evolution (e.g., Grifoll et al., 2016; Staneva et al., 2017; Bonaldo et al., 2018), giving rise to a variety of small- to meso-scale oceanographic features with a strong spatial variability.
The presence of land discharges, supplying freshwater, sediments, nutrient, and pollutants, contributes to the development of strong horizontal and vertical interaction gradients that, combined with bathymetric variations, may also affect met-ocean dynamics at larger scales, conforming the coastal zone as an active boundary layer (Stanev et al., 2016). Examples of these interactions are the effects of sea surface roughness or temperature on the coastal surface wind velocity/direction, or the dramatic implications of small-scale gradients on the predictability of intense coastal phenomena, controlling water quality, and hazards (e.g., Carniel et al., 2016).
The EU H2020 project CEASELESS (Copernicus Evolution and Applications with Sentinel Enhancements and Land Effluents for Shores and Seas) aims to enhance the coastal dimension of CMEMS (Copernicus Marine Environmental Monitoring System) by achieving a high-grade analysis of coastal sea dynamics. For this analysis, a combination of Sentinel information, in-situ coastal observations and met-ocean models that explicitly consider the land boundary condition has been applied to perform a coastal downscaling for a set of pilot cases. These pilot cases, complementary in terms of met-ocean drivers and applications, span from the North Sea to the Mediterranean and have provided results to derive scientific, technical and application criteria for a robust coupling of wind-wave-circulation models at high resolution and calibrated/validated with satellite and in-situ data (Cavaleri et al., 2019a; Cerralbo et al., 2019; Grifoll et al., 2019; Wiese et al., 2019). The project has developed new coastal products that control error intervals for irregular coastal domains, subject to non-linear interactions and sharp gradients in metocean variables. This control has implications for prediction limits, and the way they affect the introduction of such predictions into coastal decision-making. Summarizing, the research carried out within CEASELESS has led to advances in model coupling, data collocation, error metrics, process parameterizations, and coastal applications, summarized in this article. The article structure follows the development of the project, with the CEASELESS methodology set forth in section “Methodology.” Section “Results” presents the main results and section “Discussion” discusses and summarizes the project achievements from the perspective of a CMEMS coastward extension. For the sake of clarity, section “Results” is further divided into 5 subsections: section “Evolution of Coastal Data Conditioning” addresses the role and limitations of satellite and in-situ data for calibrating coastal models with new knowledge on coastal gradients and interactions; section “Coupled High-Resolution Coastal Simulations” reviews the selected coastal models for met-ocean fields, with emphasis on wind, waves, currents and their feedbacks; section “Coastal Assimilation and Error Control” analyses the generation and propagation of errors in coastal domains, exploring the role of CMEMS products in terms of boundary conditions, inner drivers and calibration data; section “Advances on Parameterizations, Data Collocation, and Interfacing” tackles the advances obtained on parameterizations (e.g., wave boundary layer), data collocation and interfacing; section “Limits and Recommendations for Coastal Applications” presents a number of CEASELESS coastal applications dealing with hydro-morphodynamic interactions, water quality or renewable energy, the basis to discuss how data interoperability and automated data flows can enhance the demand for CMEMS-based products.
Materials and Methods
Copernicus evolution and applications with sentinel enhancements and land effluents for shores and seas has explored the role of coastal processes in high-resolution (HR) coupled oceanographic modeling, validated with in situ and remote sensing (RS) data. Sentinel products, with advanced retrieval capacities, have been used for the two-way validation of Sentinel 1, 2, and 3 data (S1, S2, and S3, hereafter), exploring in particular the potential and limitations for wave-current-surge fields in coastal areas, and the validity of using Sentinel sea-surface wind data as a driver for numerical forecasting of severe storms. The analyzed Sentinel data include wind fields from S1 and S3, significant wave heights (HS) from S3, or sea surface color from S2, amongst others. Equivalent products from older satellites (CryoSat-2, Jason-2 and Saral-Altika, for instance; see Figure 1) have been used to assess the quality improvement provided by more recent Sentinel data (Wiese et al., 2018). For this purpose, the new retracker SAMOSA++ (Dinardo et al., 2020) has been assessed against coupled model simulations and in-situ observations, analyzing the under-performance over coastal waters (Moore et al., 2018; Fenoglio et al., 2021). The new retracker profits from the extra-waveform information now available out of the L1B SAR processing and conforms to a single step retracker, allowing a seamless approach between ocean and coastal domains.
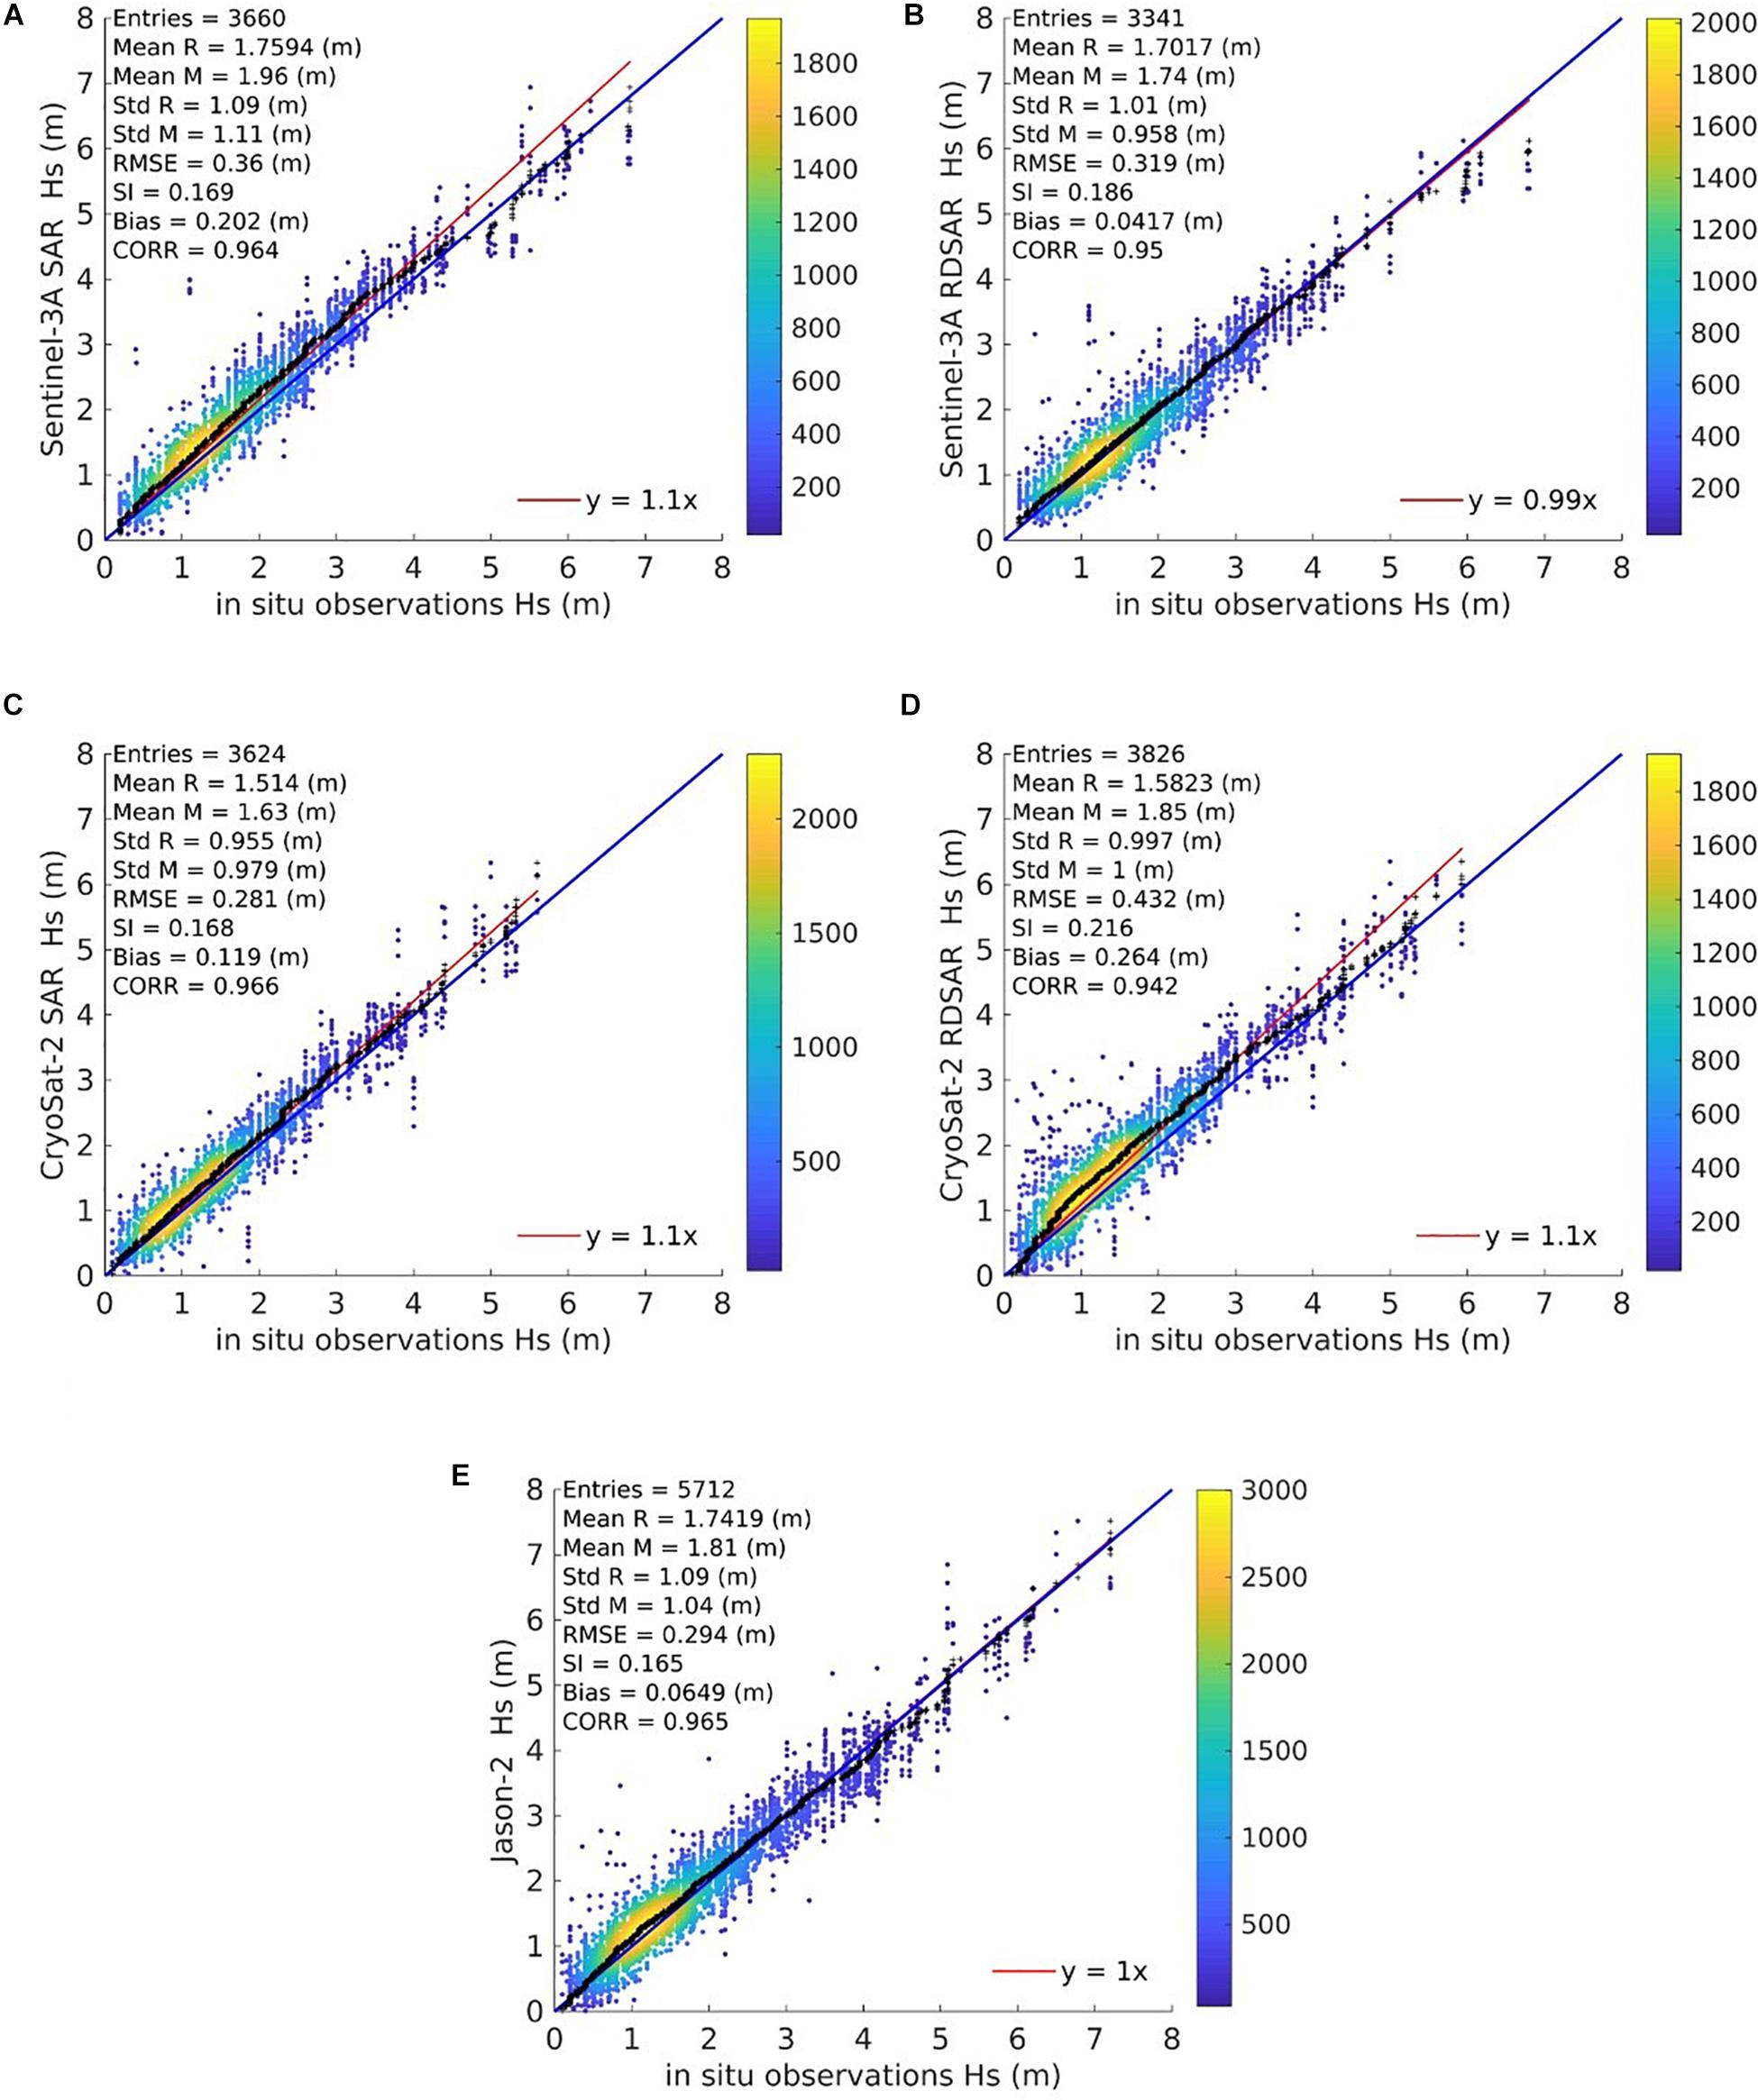
Figure 1. QQ-Scatter plots of measured HS (in-situ GTS) versus remote sensing data from: (A) Sentinel-3A SAR, (B) Sentinel-3A RDSAR, (C) CryoSat-2 SAR, (D) CryoSat-2 RDSAR, and (E) Jason-2. The comparison is for the period June to November, 2016. The QQ-plot is indicated by black crosses, the 45° reference line by the blue line and the least-squares best fit line through the origin by the red line.
Different coupled modeling suites, based on a structured grid approach, have been applied to selected severe met-ocean events in the different pilot sites. These numerical results have been compared with unstructured grid models to assess the performance of different coupling configurations. Table 1 provides the list of models and main metocean events considered at each pilot site (Figure 2). Due to the presence of a land border, co-registration, and fusion techniques have been adapted for asymmetric domains. This has enhanced the benefit of local assimilation for anisotropic and highly non-linear shallow water processes, allowing a better quantification of coastal gradients. The analysis has been based on quantitative error models and adapted triple collocation descriptors, suited for characterizing the error spatial structure for a given coastal geometry (Schulz-Stellenfleth and Staneva, 2019). This work has shown how the new Sentinel constellation allows a new level of data assimilation for prognostic wave-circulation models (range of hours to days). Prediction uncertainties, trying to comply with often conflicting requirements from stakeholders, must be supported by a combination of different coastal data, which has led to a set of criteria for optimising resolution and accuracy, as a function of coastal distance. This combination requires an objective definition of what is the coastal zone, understood as a region where land and marine factors influence the domain dynamics, defining its boundaries in terms of the covariance anisotropy. Because of the land-water boundary, the coastal zone has been defined (Sánchez-Arcilla et al., 2019) as the region where covariance for key metocean variables is clearly anisotropic. The key variables selected include significant wave height, wind velocity or current velocity, both from predicted and measured fields. The project work has quantified the benefits of data assimilation, for data with spatial (satellite) and temporal structure (point time series), despite the limited coastal memory (e.g., of order 1 day for wave fields). The CEASELESS assessment of Sentinel data, in particular S3 altimeter wave height measurements in coastal zones, has proved the value of this data source for improving wave forecasting and a new level of now-casting (Wiese et al., 2018).
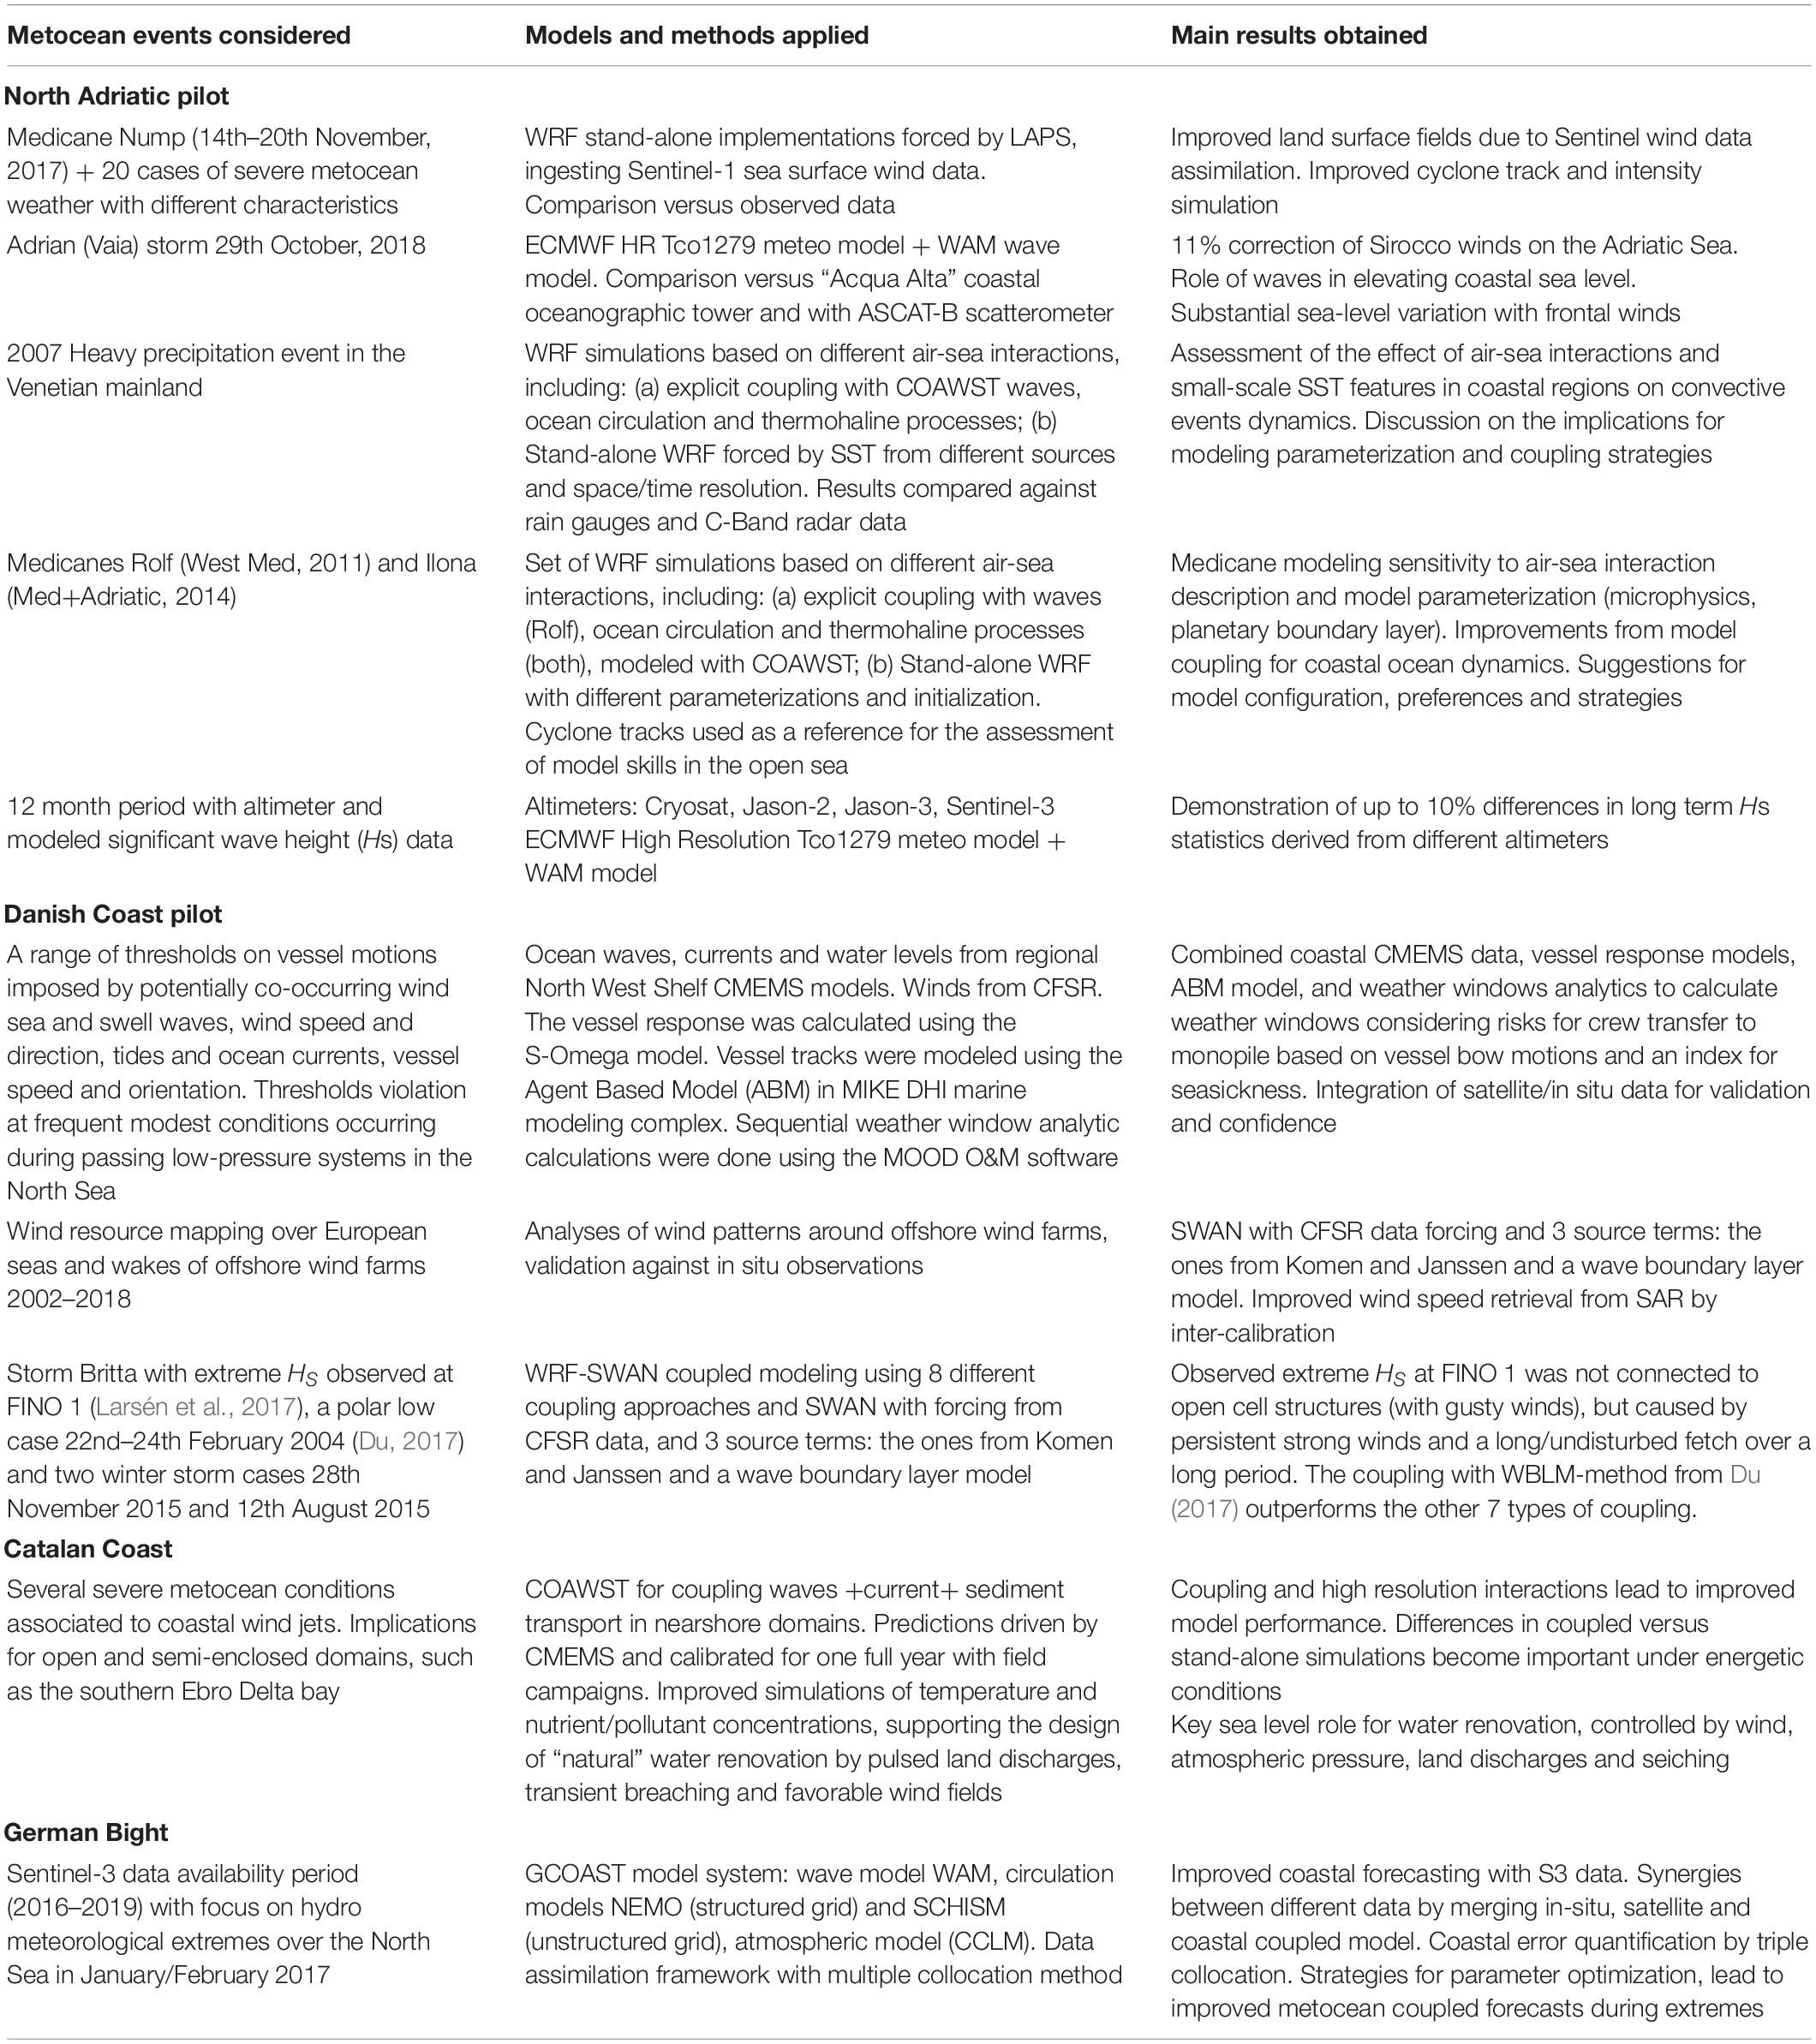
Table 1. Summary of main metocean events considered at each CEASELESS pilot site, together with the models applied to analyze these events and the main results obtained.
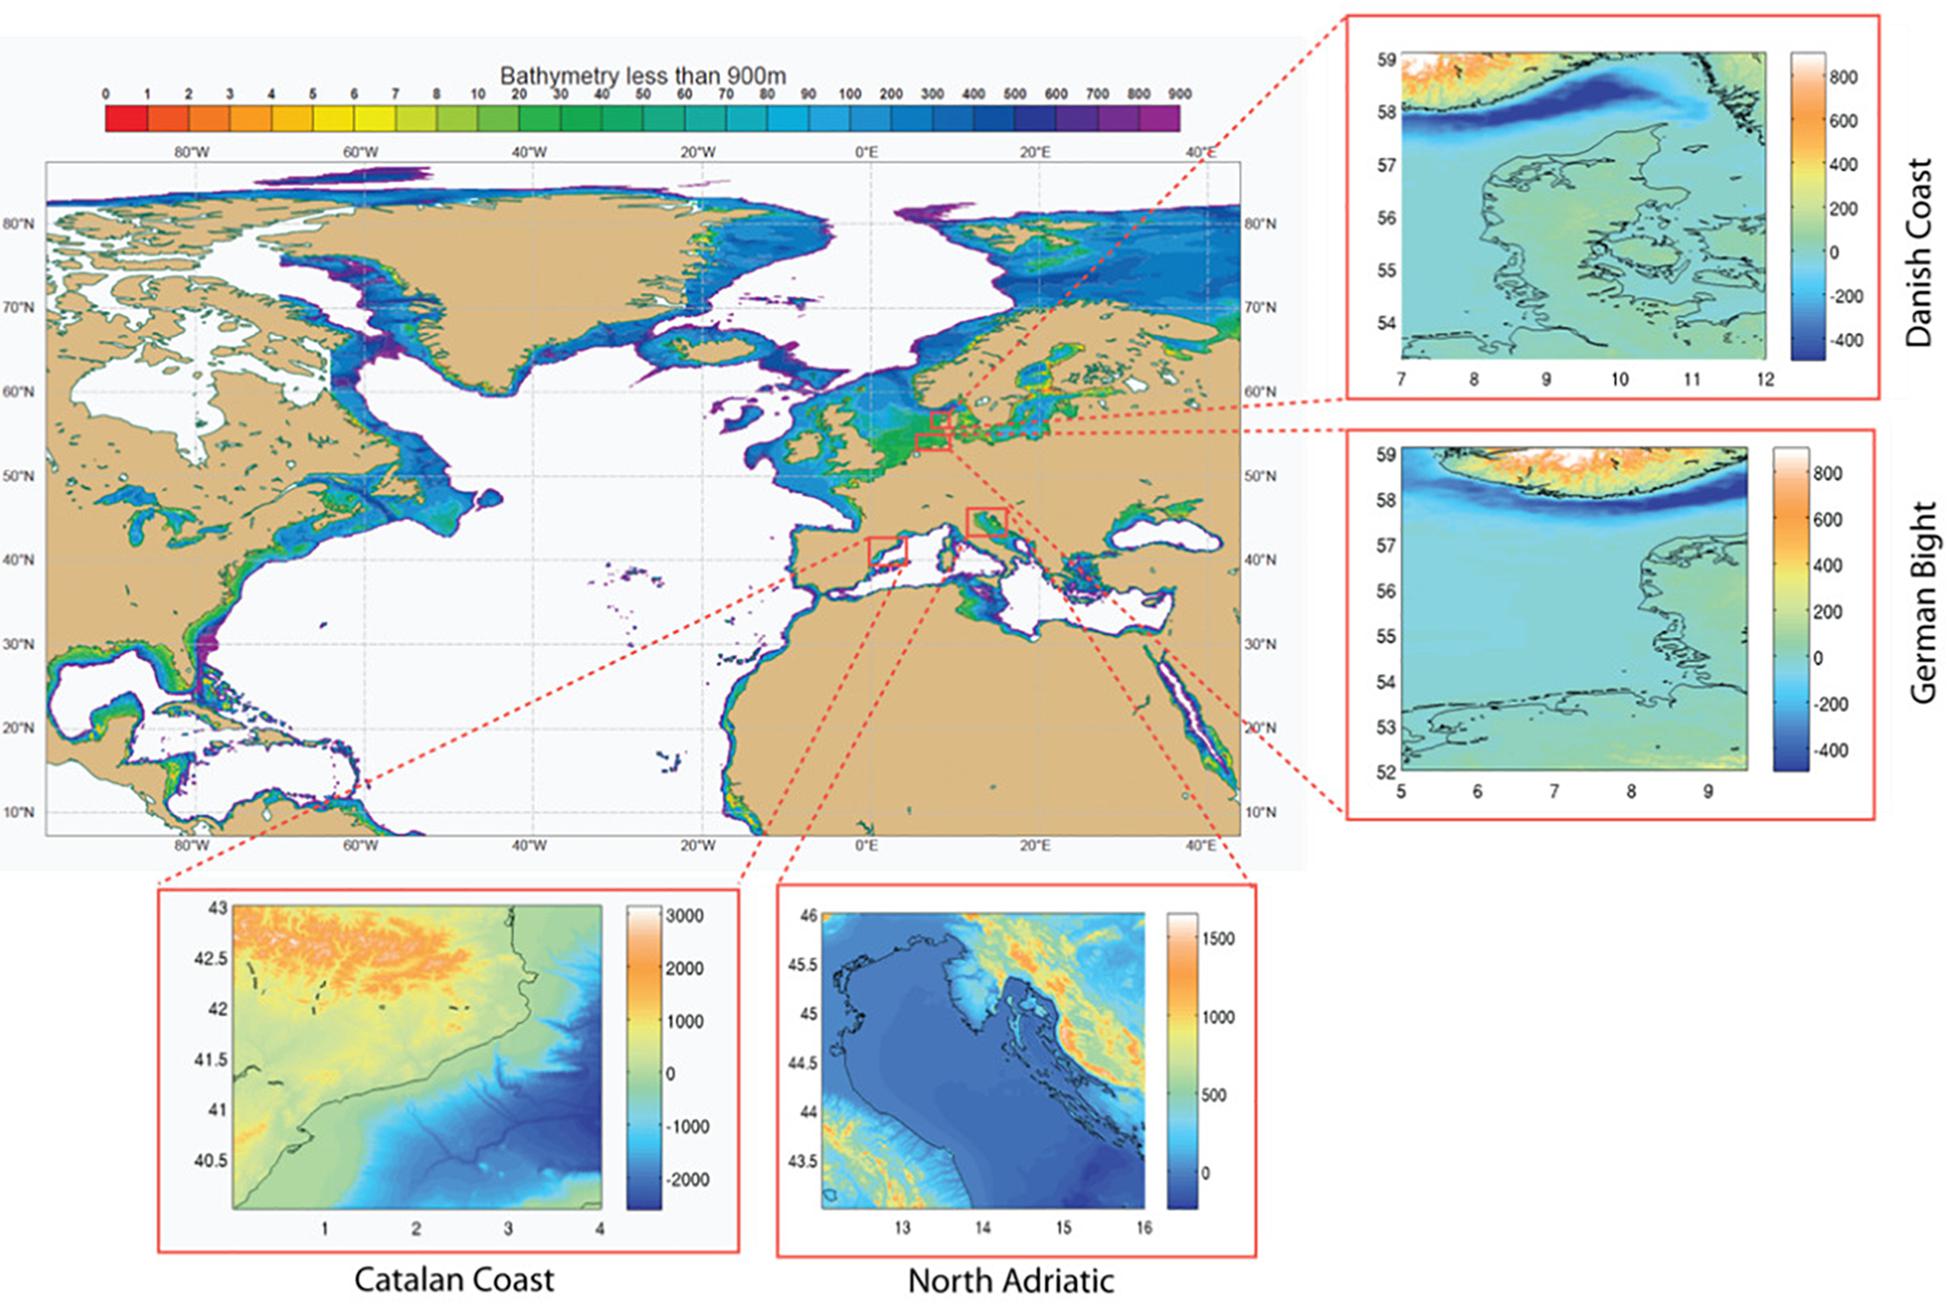
Figure 2. CEASELESS pilot cases: Mediterranean/North Atlantic offshore domains and coastal domains representing open/gulf coasts (Catalan/Northern Adriatic) and estuary/inlet coasts (German Bight/Danish coast).
Copernicus evolution and applications with sentinel enhancements and land effluents for shores and seas results have, thus, contributed to the advance of coastal oceanography, enhancing the application of CMEMS-based products for traditional and new stakeholders. The project has demonstrated the technical feasibility and economic viability of a combined satellite/in situ data exploitation, within a high-resolution coupled modeling system as part of a future coastal service extension in CMEMS. This demonstration has included severe metocean events (Table 1), such as the Adrian storm (Venice coast in 2018) or several consecutive storms in the German Bight during 2017, illustrating the limits/challenges of coastal met-ocean predictions and the role of Sentinel altimetry for early warning. This work has advanced the state of the art in coupled modeling using structured grids (Staneva et al., 2017; Lewis et al., 2019; Wu et al., 2019) and unstructured grids (e.g., Schloen et al., 2017; Bolaños et al., 2018; Ràfols et al., 2019; Ricchi et al., 2019; Stanev et al., 2019b; Lin-Ye et al., 2020). Such coupled models have been applied for a representative range of metocean events, exploring the potential/limits for coastal applications such as aquaculture, harbor exploitation (Campos et al., 2019; Haid et al., 2020), search-and-rescue operations (Staneva et al., 2018a), renewable energy (Schulz-Stellenfleth and Staneva, 2019; Staneva et al., 2019), or coastal risk assessments (Staneva et al., 2016; Lin-Ye et al., 2020).
Results
Evolution of Coastal Data Conditioning
Coastal applications have proved the relevance of different S1, S2, and S3 sensing modes and products, fostering the creation of open access databases (e.g., https//satwinds.windenergy.dtu.dk), used alike by experts (e.g., in meteorology and oceanography), and stakeholders (e.g., renewable energy or aquaculture applications). Metocean validations at the CEASELESS pilot cases (Figure 2) have encompassed (Cerralbo et al., 2019; e.g., Cavaleri et al., 2019b; Grifoll et al., 2019) wind fields from S1 and S3, HS from S3 and sea surface color from S2, improving retrieval algorithms and a wider uptake of RS products. Such validations have resulted in: (a) improved wind retrieval from SAR data through consistent processing, using new wind direction inputs from ERA 5, and through inter-calibration of radar backscatter observations between sensors; (b) two-way calibration with numerical models and in situ measurements, particularly high frequency radar data (HFR), which has been facilitated by developing a suite of MATLAB and PYTHON scripts for the combined assessment of Sentinel products, e.g., altimetry and SAR imagery (Du et al., 2019). Additionally, the project has produced new RS datasets (e.g., coastal altimetry) in netCDF format, compliant with the Climate Forecast (CF) conventions, facilitating their uptake by numerical modellers and coastal stakeholders (Schulz-Stellenfleth and Staneva, 2019).
The validation of S1 Level 2 RVL (ocean radial velocity) products against HFR data has shown the limits of uncorrected instrument effects, which prevent the direct exploitation of these satellite data (Caballero et al., 2020; Rulent et al., 2020). S1 RVL products have a large potential for mapping across-track surface currents, as proved by the combination of S1 Doppler measurements and altimetry fields, in spite of large biases and the lack of correction for wind-wave bias. However, these errors can be reduced by correcting the RS data with the land effect and the wind-wave bias; in the German Bight, using ECMWF or S1 winds, the bias has been reduced to 0.08 m/s and the root mean square error (RMSE) to about 0.4 m/s as compared against the HFR. The comparison of S3A wind-wave and sea-level products against Jason 3 at the four CEASELESS pilot cases has shown that S3A presents a smaller bias than Jason. Within the first 10 km off the coast, the bias of the S3A significant wave height is reduced by 0.08 m and the correlation is increased by 10% compared to that for Jason (Wiese et al., 2018). No consistent bias in sea-level has been observed for neither the North Sea nor the Mediterranean. The comparison of S3A total water level against coupled wave-current forecasts shows very good agreement, with discrepancies below 0.2 m on a monthly average (Staneva et al., 2018b).
Decorrelation of sea level, wind and wave variables (based on altimeter synergies) shows that HS presents a larger range of spatial decorrelation, with scales ranging from 50 km for the Denmark pilot case to 120 km for the North Adriatic pilot case. In contrast, the sea surface height anomaly shows smaller spatial decorrelation lengths, ranging from 17 km for the Catalan sea to 60 km for the North Adriatic Sea. The decorrelation scales of wind speed are very consistent between all CEASELESS pilot cases, with a value around 30 km. However, there is a clearly different behavior (Cerralbo et al., 2019; Tomaselli et al., 2021) between the two Mediterranean regions (Adriatic and Catalan coast) and the Danish pilot regarding the temporal decorrelation. Mediterranean sites present longer decorrelation times for sea level than for wave height or wind speed. However, for the Denmark pilot case the behavior is the reverse. Such variations can be attributed to differences in metocean patterns and, thus memory scales, between North Sea and Mediterranean pilot cases.
Metocean assimilation has considered HR sea-surface wind data from S1 and meteorological forecasts using the meso-scale atmospheric model WRF as well as the Local Analysis and Prediction System (LAPS) code from NOAA. LAPS has been designed for nowcasting purposes and allows a “hot start” initialization of WRF (Cavaleri et al., 2019a; Ricchi et al., 2019). The impact of S1 sea-surface wind data was evaluated for 20 case studies over the North Adriatic pilot case, spanning complementary atmospheric conditions from 2014 to 2018 and including episodes of heavy precipitation and strong land wind (Bora wind from the North/North-East in the North Adriatic pilot). The WRF simulations have been compared with an independent set of surface wind records provided by the regional meso-network. Assimilation of S1 sea-surface wind has shown the benefits in sea surface variables and accumulated precipitation, filling the data gap in most coastal seas, poorly covered with surface stations. These results prove how Sentinel data can play a key role in better representing surface winds near the coast, which is particularly relevant for tropical-like cyclones in the Mediterranean (Medicanes), as illustrated by a case study in the Ionian Sea in November 2017. The S1 wind data assimilation for a specific Medicane improved both analyses (wind speed at the initial time) and simulations (position of the pressure minimum in the first 7 h of simulation), leading to a better representation of local surface-wind structures over the sea. Sentinel data can play here a unique role to monitor and improve the prediction of cyclones, which according to climate projections will affect European coastal seas with increasing intensity. As a nowcasting tool, such detailed information on wind speed will allow a better simulation of the position and intensity of these cyclones that spend most of their lifetime over the sea, where the availability of in-situ data is generally limited.
The use of Sentinel data can be critical to improve the analysis and predictability of such cyclones, where the enhanced retrieval of RS wind data and the existence of archived wind fields will enable a two-way validation between Sentinel and forecasted data. The ingestion of Sentinel sea-surface winds in wave-current models has resulted in a direct benefit for nowcasting, particularly for severe storms, providing a much-needed spatial structure for coastal atmospheric fields that truly reflect the domain anisotropy. CEASELESS has inter-compared S1, S3, and in situ data for wave fields, evaluating the performance of a variety of sensors, notably the S3A altimeter against other altimetry products (CryoSat-2, Jason-3 and Saral-Altika) at coastal scales. For this purpose, the new retracker SAMOSA++ (Dinardo et al., 2020) has been assessed against coupled model simulations and in-situ observations, analyzing the reported under-performance over coastal waters (Moore et al., 2018). The new retracker profits from the extra-waveform information now available out of the L1B SAR processing and allows a seamless approach between ocean and coastal domains. By way of illustration Figure 3 shows the application of the SAMOSA++ retracker to the German Bight pilot case, in terms of the sea-level anomaly and HS fields, as a function of distance to the coast. To account for hydrodynamic complexity as a function of coastal distance, wave models have incorporated surface currents using flexible meshes (e.g., quadrilateral cells within a Spherical Multiple-Cell grid), thus enabling the computationally efficient mapping from unstructured to regular grids required by variational assimilation packages (Li, 2012). Such flexible discretization has allowed the analysis of assimilation schemes depending on spatial and directional anisotropy, estimating background error magnitudes and length-scales. The obtained results show how accounting for spatial anisotropy has positive effects for assimilation, although the resulting benefits were limited in time due to the short length scales and limited time memory typical for coastal domains.
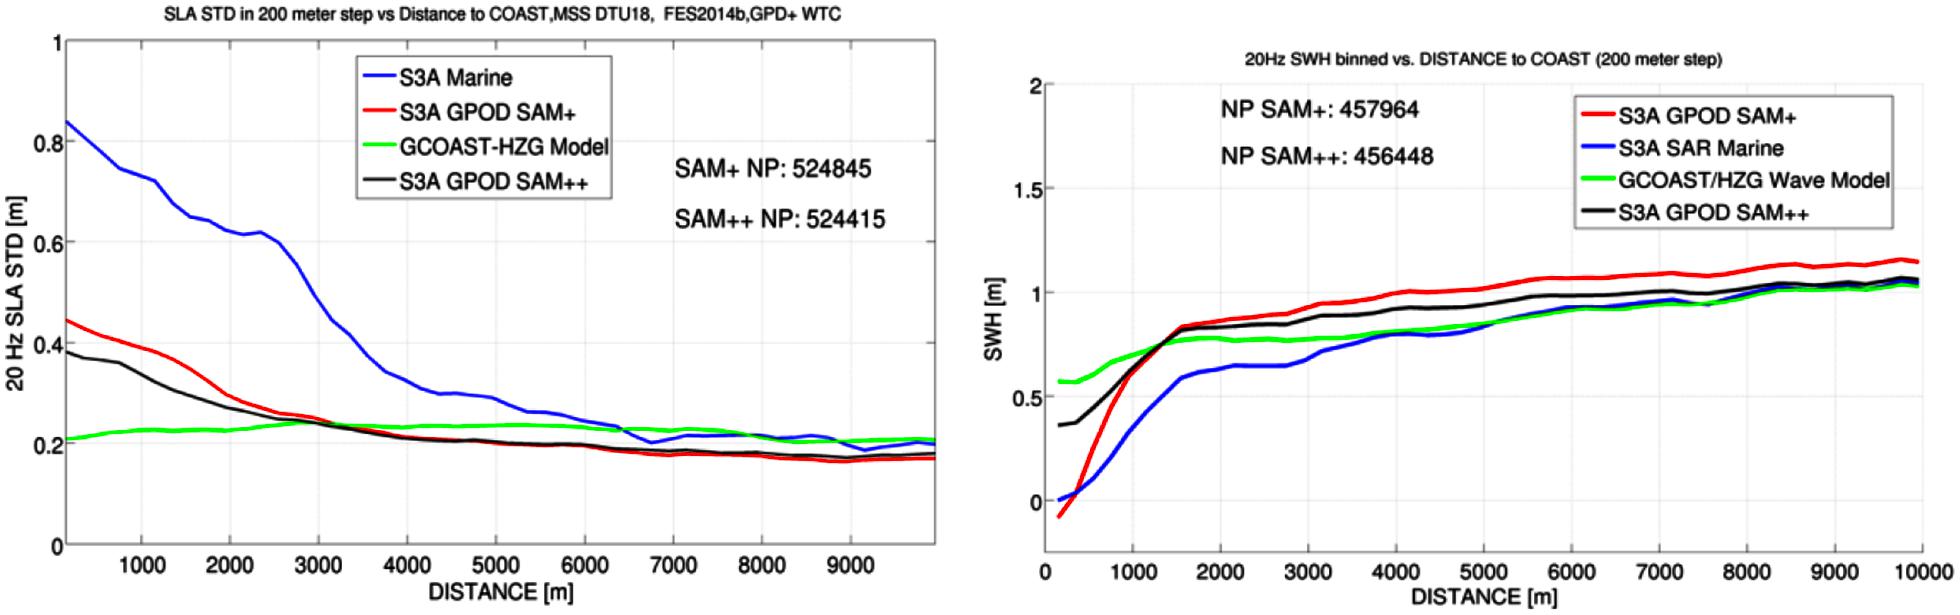
Figure 3. Sea level anomaly (SLA) standard deviation (STD) in 200 m bins (left) and 20 Hz median significant wave height – SWH – (right) as a function of distance to the coast, for retrackers SAMOSA++ (black curve), SAMOSA+ (red curve), together with SAR Marine (blue curve), and numerically simulated data (GCOAST model – green curve). NP stands for number of points (adjusted from Dinardo et al., 2020).
By comparing Sentinel data to older satellite products (Wiese et al., 2018) it has been established that, during extreme events with HS exceeding 5.0 m, RS and in-situ data show a good match, although satellites tend to overestimate in-situ measurements, especially S3A SAR and both CryoSat-2 products (Figure 1). Observations and numerical simulations tend to show larger discrepancies for shallow water regions, due to non-linear processes, inconsistent bathymetry or mismatch in the frequency band compared. For low frequencies, floating met-ocean buoys follow the wave motion sufficiently well, whereas models show an underestimation of energy. However, at high frequencies in-situ floating measurements have to be treated carefully since error profiles may show relevant peaks when the buoy resonance falls close to the driving metocean forcings. Model conditioning, based on assimilating RS/in-situ data as a Bayesian (conditional) estimation problem (Desamsetti et al., 2019), benefits from considering spatially distributed observations (for spatial structure) and high resolution time series (for temporal structure). The assimilation should consider bulk variables (e.g., significant wave height) and physically key properties, such as spectral tails, because well reproduced tails indicate a physically correct balance between generation and dissipation, adding reliability to the conditioning. Such a frequency analysis facilitates adapting assimilation methods to the wave frequency bands more relevant for the application considered, since state-of-art assimilation methods for altimeter data are mainly based on integral quantities, such as HS.
Coastal error quantification has been addressed by triple collocation (model, in-situ and altimeter data), revealing the role of coastal spatial heterogeneities and limited size of available samples (Schulz-Stellenfleth and Staneva, 2019). Sentinel altimetry, in its early stages, provided only limited size samples, hampering the derivation of statistically significant conclusions on spatial error structures. The effects of geometry (topography and bathymetry) on error structures has become apparent from the different pilot cases, pointing at the need to consider coastal zone geometry and variance intensity (Sánchez-Arcilla et al., 2019), as a function of coastal distance to assess error structures. In spite of such limitations, the decreasing return cycle of Sentinel (for instance, S1 sea surface velocity data with a return cycle of 12 days) has allowed an assessment of spatial distributions, even though the intertidal time scales (e.g., North Sea pilot cases) cannot be resolved. These results suggest combining satellite data with numerical models (Wiese et al., 2018) to validate longer-term dynamics, where spatial structures and temporal trends can be better established from present data.
Optical S2 data (e.g., Soomets et al., 2020) have been analyzed as aggregators of water quality and dynamics, related to suspended matter and Chlorophyll-a patterns, leading thus to integrated calibrations. Shallow water S2 derived bathymetry and morphodynamic evolution has been considered (Bolaños et al., 2018) as another aggregator of metocean forcings, with further added value for research and applications when used in combination with S1 and S3 data. These coastal “state” products have led to a newly developed approach in which a cloud-based environment, coupled with a machine learning algorithm, has been used to analyze long-term (up to decadal scale including Landsat data where necessary) and short-term dynamics, reflecting the coastal response at these scales. This is illustrated in Figure 4, which compares the satellite derived bathymetry (left) with the EMODnet bathymetric field (right) for part of the German Bight pilot site, in which the water depth and transparency allowed a more robust recovery of S2 data. Satellite-derived suspended sediment and nearshore evolution have been explored in the Ebro Delta pilot case, illustrating another application for this S2 product. S2 performance, in terms of total suspended matter (TSM) has been thus evaluated for Mediterranean conditions, using the Ebro Delta southern bay (Figure 5) as pilot application and retrieving TSM under strong NW winds and under calm conditions. The image shows how the strong land-wind from the NW (Mestral) substantially increases TSM concentrations in the Southeast shallow edges of the bay, controlling the subsequent advection of fine sediment toward shelf waters. Under calm conditions the values of TSM decrease significantly, leaving the river plume as the main source for suspended sediment.
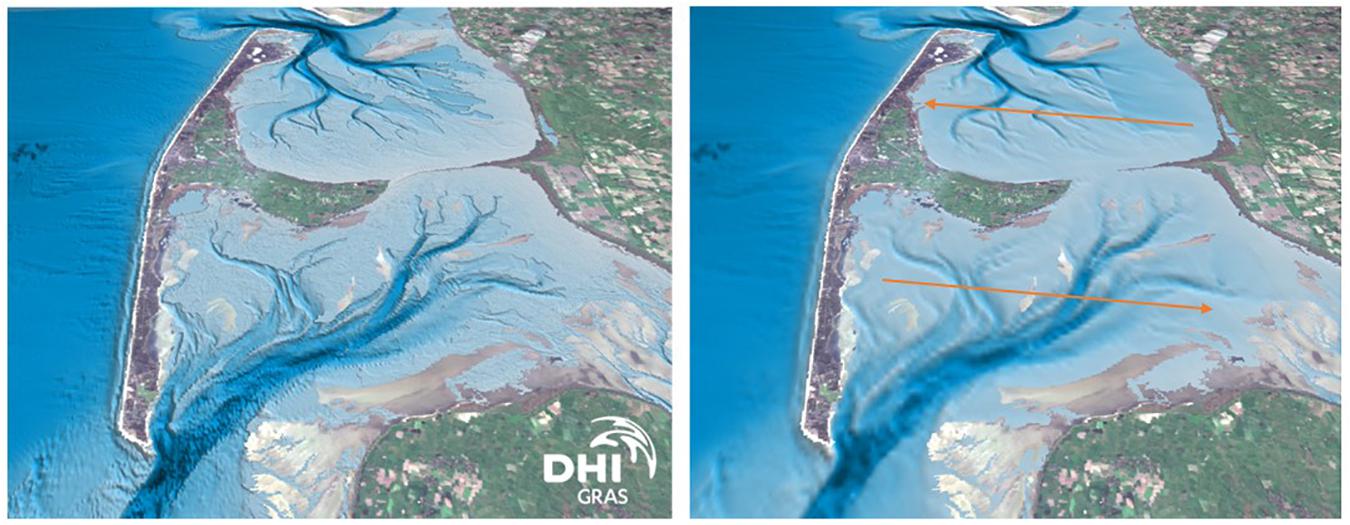
Figure 4. Illustration of the higher level of detail resulting from a S2 derived bathymetry (left) when compared to the widely used EMODnet bathymetry (right). The example shown is from the German part of the Wadden Sea, inside the corresponding CEASELESS pilot area.
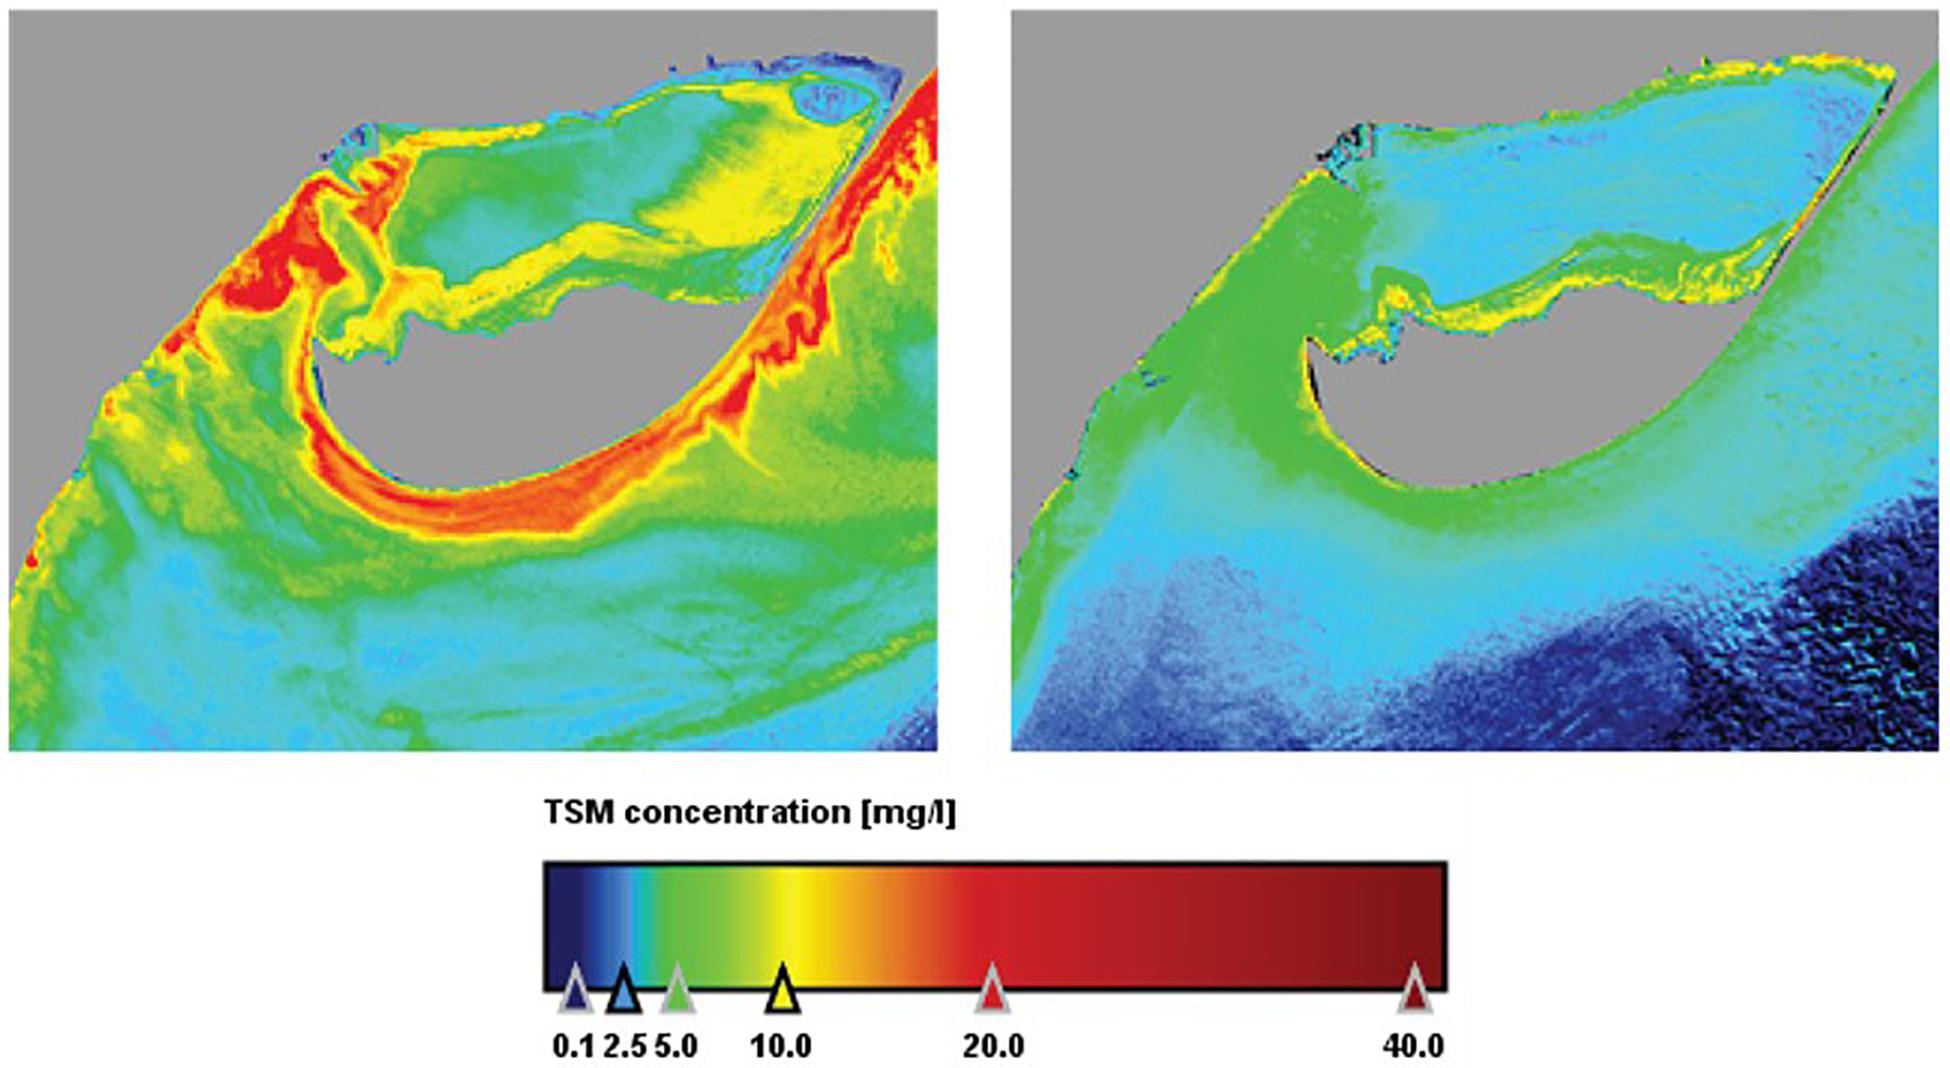
Figure 5. Total Suspended Matter (TSM in mg/l) in the Ebro delta southern bay, derived from Sentinel-2 data for two different scenarios: NW winds (left panel: 27th December, 2017) and calm conditions (right panel: 15th February, 2018). The images depict the TSM originating from local resuspension and irrigation discharges – within the bay domain – plus the TSM contributed by the main river mouth (not shown) located above the figure domain.
Although satellite observations are available in two “horizontal” dimensions, characterising free surface patterns, for many applications it is necessary to include vertical structure through a synergetic mixture of satellite data with in situ observations (e.g., profiling LIDAR’s or ADCP’s). Such a combination, supplemented by 3D modeling outputs, can lead to 3D metocean fields where data merging appears as a promising solution. This approach has been applied to combine daily scatterometer wind observations with SAR data, presenting higher detail but more limited spatial coverage. Various strategies to merge data and simulations as a function of metocean conditions and domain geometry have been explored for the pilot cases, assessing the extrapolation potential for other coastal seas. Merging for areas with high sea surface temperature may require tuned parameterizations and enhanced air-sea exchanges, when compared to typical bulk parameterizations. These constraints, consistently applied to data and simulations have been based on multi-sensor validations, combining RS, buoy and HFR information. Data merging, spanning depths from 700 m to 30 m (e.g., Catalan coast case), has highlighted the importance of associating each variable to its prevailing variation intervals, relating intensity (e.g., surface height) to depth or directional sector. Such merged results have shown how RS data products may provide an important and often missing component in coastal data, effectively linking sparse in-situ measurements with modeled fields by adding a spatial structure to point observations. Combined Sentinel data (1, 2, and 3), aggregating multiple SAR sensors operating at different wavelengths, should be added to existing European datasets (available through Copernicus), improving temporal coverage and resolution, which would lead to improved climatologies and atlases of metocean parameters for coastal seas.
Coupled High-Resolution Coastal Simulations
Coupled coastal simulations require new coupling parameterizations and an objective definition of domain boundaries for application, considering dominant physical processes, numerical restrictions, and practical requirements for each pilot site. Shallow water domains demand a particular focus on interface parameterizations, both at sea surface and seabed (Staneva et al., 2016, 2017). Pilot case results show that the optimal configuration depends on problem specific issues such as geometry, scale of relevant phenomena and numerical technique employed, with clear advantages for coupled over uncoupled approaches for sufficiently energetic conditions (Staneva et al., 2021). Coupling terms should be adapted to metocean and geometry conditions, looking for consistent interactions across scales, such as for instance, the transfer of heat and momentum at the air-sea interface, that should be appropriate for considered climatology (Komen et al., 1984; Breivik et al., 2015; Staneva et al., 2018b; Wu et al., 2019). An accurate reproduction of interaction processes always benefits from local knowledge, using local datasets to compensate for the incomplete control over these interactions and to overcome the history of stand-alone model (atmospheric and oceanographic) calibration (Walters et al., 2015, 2019; Wiese et al., 2019; Li et al., 2021). In fact, most atmospheric and oceanographic models implemented in coupled configurations result from long-term calibrations performed mostly under uncoupled conditions (e.g., Lionello et al., 1992; Skamarock et al., 2008; Staneva et al., 2015). This means that the main effects of the interactions (Sakamoto et al., 2019), not explicitly reproduced in the uncoupled conditions, were accounted for by ad-hoc parameterizations (Li et al., 2021). For this reason, huge improvements in coupled experiments, compared to stand-alone analysis, should not be automatically expected at this early stage of the coupling development (Cavaleri et al., 2019b; Cerralbo et al., 2019; Lewis et al., 2019; Saulter et al., 2020; Wiese et al., 2020). Instead, some decreases in the coupled modeling skills should be counterintuitively anticipated, due to some overshooting in the explicit description of processes that were already accounted for implicitly in the stand-alone model calibration. CEASELESS results demonstrated that, although the outcomes of coupled modeling strategies are already satisfactory, a longer-term effort is required to fully exploit their potential.
The role of precipitation, a sensitive variable in coupled model assessments, was investigated for a heavy precipitation event (Davolio et al., 2009) over the Venetian mainland for the North Adriatic pilot case. Metocean coupled runs showed that, an accurate description of sea surface temperature patterns up-wind of the storm, can be crucial to reproduce the atmospheric settings that control precipitation intensity and location (Ricchi et al., 2018). The potential for low-level air particles to trigger convection depends strongly on the 3D atmospheric structure, and the stationarity of the event is a delicate balance between wind blowing from sea and the background circulation over the mainland. Similar conditions affected both the North Adriatic and Catalan coast pilot cases in 2019, showing how Medicanes can constitute a major source of hazard for coastal regions. These cyclones are characterized by a barotropic structure, with a warm core surrounded by structured and spiral convection, with sustained winds over 100 km/h (Miglietta and Rotunno, 2019). Present knowledge shows some limitations to capture atmospheric pressure gradients associated to the deepening of low pressure centres, the resulting low centre trajectory or the role played by air-sea interactions. Overcoming these limitations requires a combined multi-physics ensemble supported by atmosphere-ocean coupled modeling (Ricchi et al., 2019). Coupled metocean simulations improve sea surface fluxes and, therefore, the predictability of cyclone track and intensity. The underlying requirement is a model resolution able to provide an appropriate description of internal cyclone structure, of the order of a few km or less (Ricchi et al., 2017, 2019). Surface wind stresses and heat fluxes are among the main drivers for upper ocean dynamics, including thermodynamics, particularly in shallow water domains, where uncertainties in air-sea fluxes are crucial for robust coastal simulations (Huber and Zanna, 2017). The uncertainties in bulk algorithms for air-sea exchanges can lead to a large spread in results, shown by differences in sea-surface temperature (Mallick et al., 2018) and a warm bias under temperature gradient conditions. Air-sea interactions may result in important differences for local temperatures, wind velocities or wave/current fields over the continental shelf, particularly for wind jets blowing from land (Renault et al., 2017; Ràfols et al., 2019; Yu et al., 2020). The presence of free surface irregularities, such as wind-generated waves, affects sea surface roughness, enhancing heat fluxes and surface wind drag and, as a result, the complexity of the simulations. The “right” level of complexity should be included in the air-sea flux algorithms if coupled modeling is to properly reproduce the heat available to maintain the low-pressure centre or the analysis of wind jets (Ràfols et al., 2019). The incorporation of such concentrated forcings illustrates how metocean interactions will lead to improved model performance, where the differences in coupled versus stand-alone simulations become important under energetic conditions. Wave surface roughness reduces wind speed and may modifies pressure gradients even for low wind speeds (Figure 6), extending upward within the atmospheric boundary layer. The largest differences have been found at the warm front location, proving the need to adequately capture the sharp gradients and fronts, typically found in coastal domains (Wiese et al., 2019).
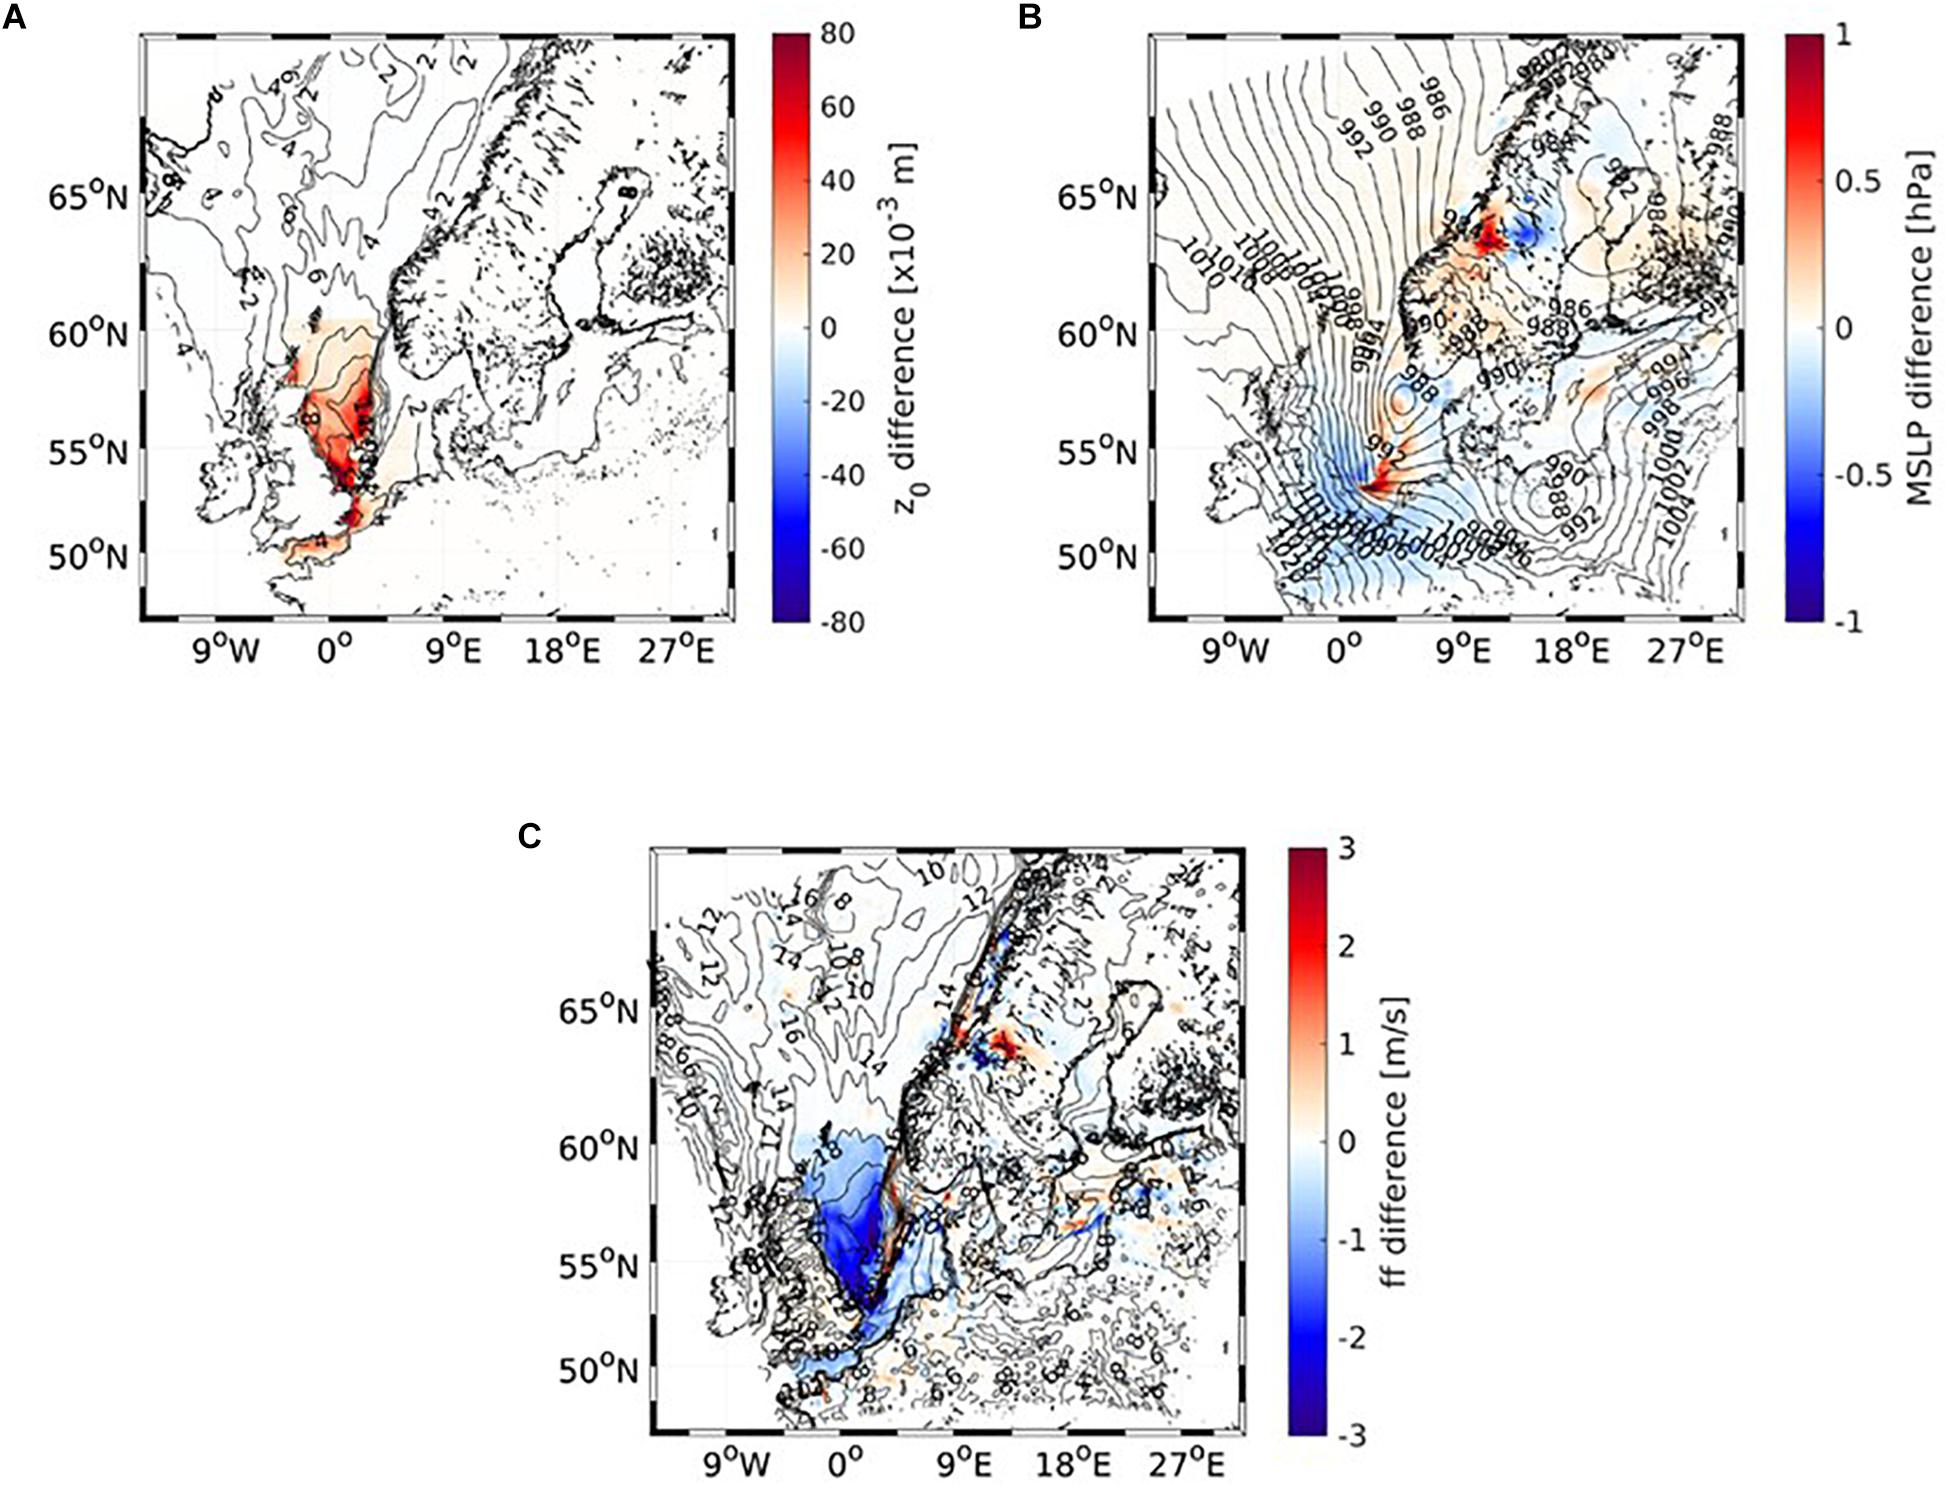
Figure 6. Absolute values of roughness length variations (A), mean sea level pressures MSLP (B), and 10 m wind speed (C) for the regional stand-alone (reference) model simulations (contours). The color coding indicates the differences between the coupled and reference model simulations in the North Sea pilot domain during a sample storm on 13th January, 2017 at 12:00 UTC.
Copernicus evolution and applications with sentinel enhancements and land effluents for shores and seas has explored the trade-off between spatial resolution and noise in the description of nearshore dynamics, based on Sentinel and in-situ data under calm and storm conditions. The analysis of L2 products provided by Copernicus has shown how low frequency (1 Hz) data may provide a good description of storm conditions in the open sea, whereas unrealistic patterns may appear at distances smaller than 10 Km from the coastline. However, the higher frequency (20 Hz) data may exhibit noisier patterns at large distances from the coast (farther than 20 Km) but good capabilities near the shore, suggesting that the variability at these higher frequencies may be associated with the sampling process, in addition to other geophysical reasons. An improvement of air-sea flux exchanges leads to higher robustness in metocean results, as demonstrated by COAWST simulations in the Catalan coast site executed with a 350 m mesh (Garcia Sotillo et al., 2020; Mestres et al., 2020). Moreover, accounting for wave-enhanced surface stresses provides enlarged mixed-layer depths and improves wave period predictions. This affects the quality of sediment transport predictions, such as resuspension events (Figure 7). An accurate evaluation of bed shear stresses within the studied domain, a restricted coastal bay, requires considering these improved air-sea interactions plus local wind-wave generation and quasi-stationary standing wave patterns due to seiching resonance. The error structures for such restricted domains also reflect geometrical dimensions and dominant wavelengths, which should be considered in calibration and assimilation to account for coastal heteroscedasticity.
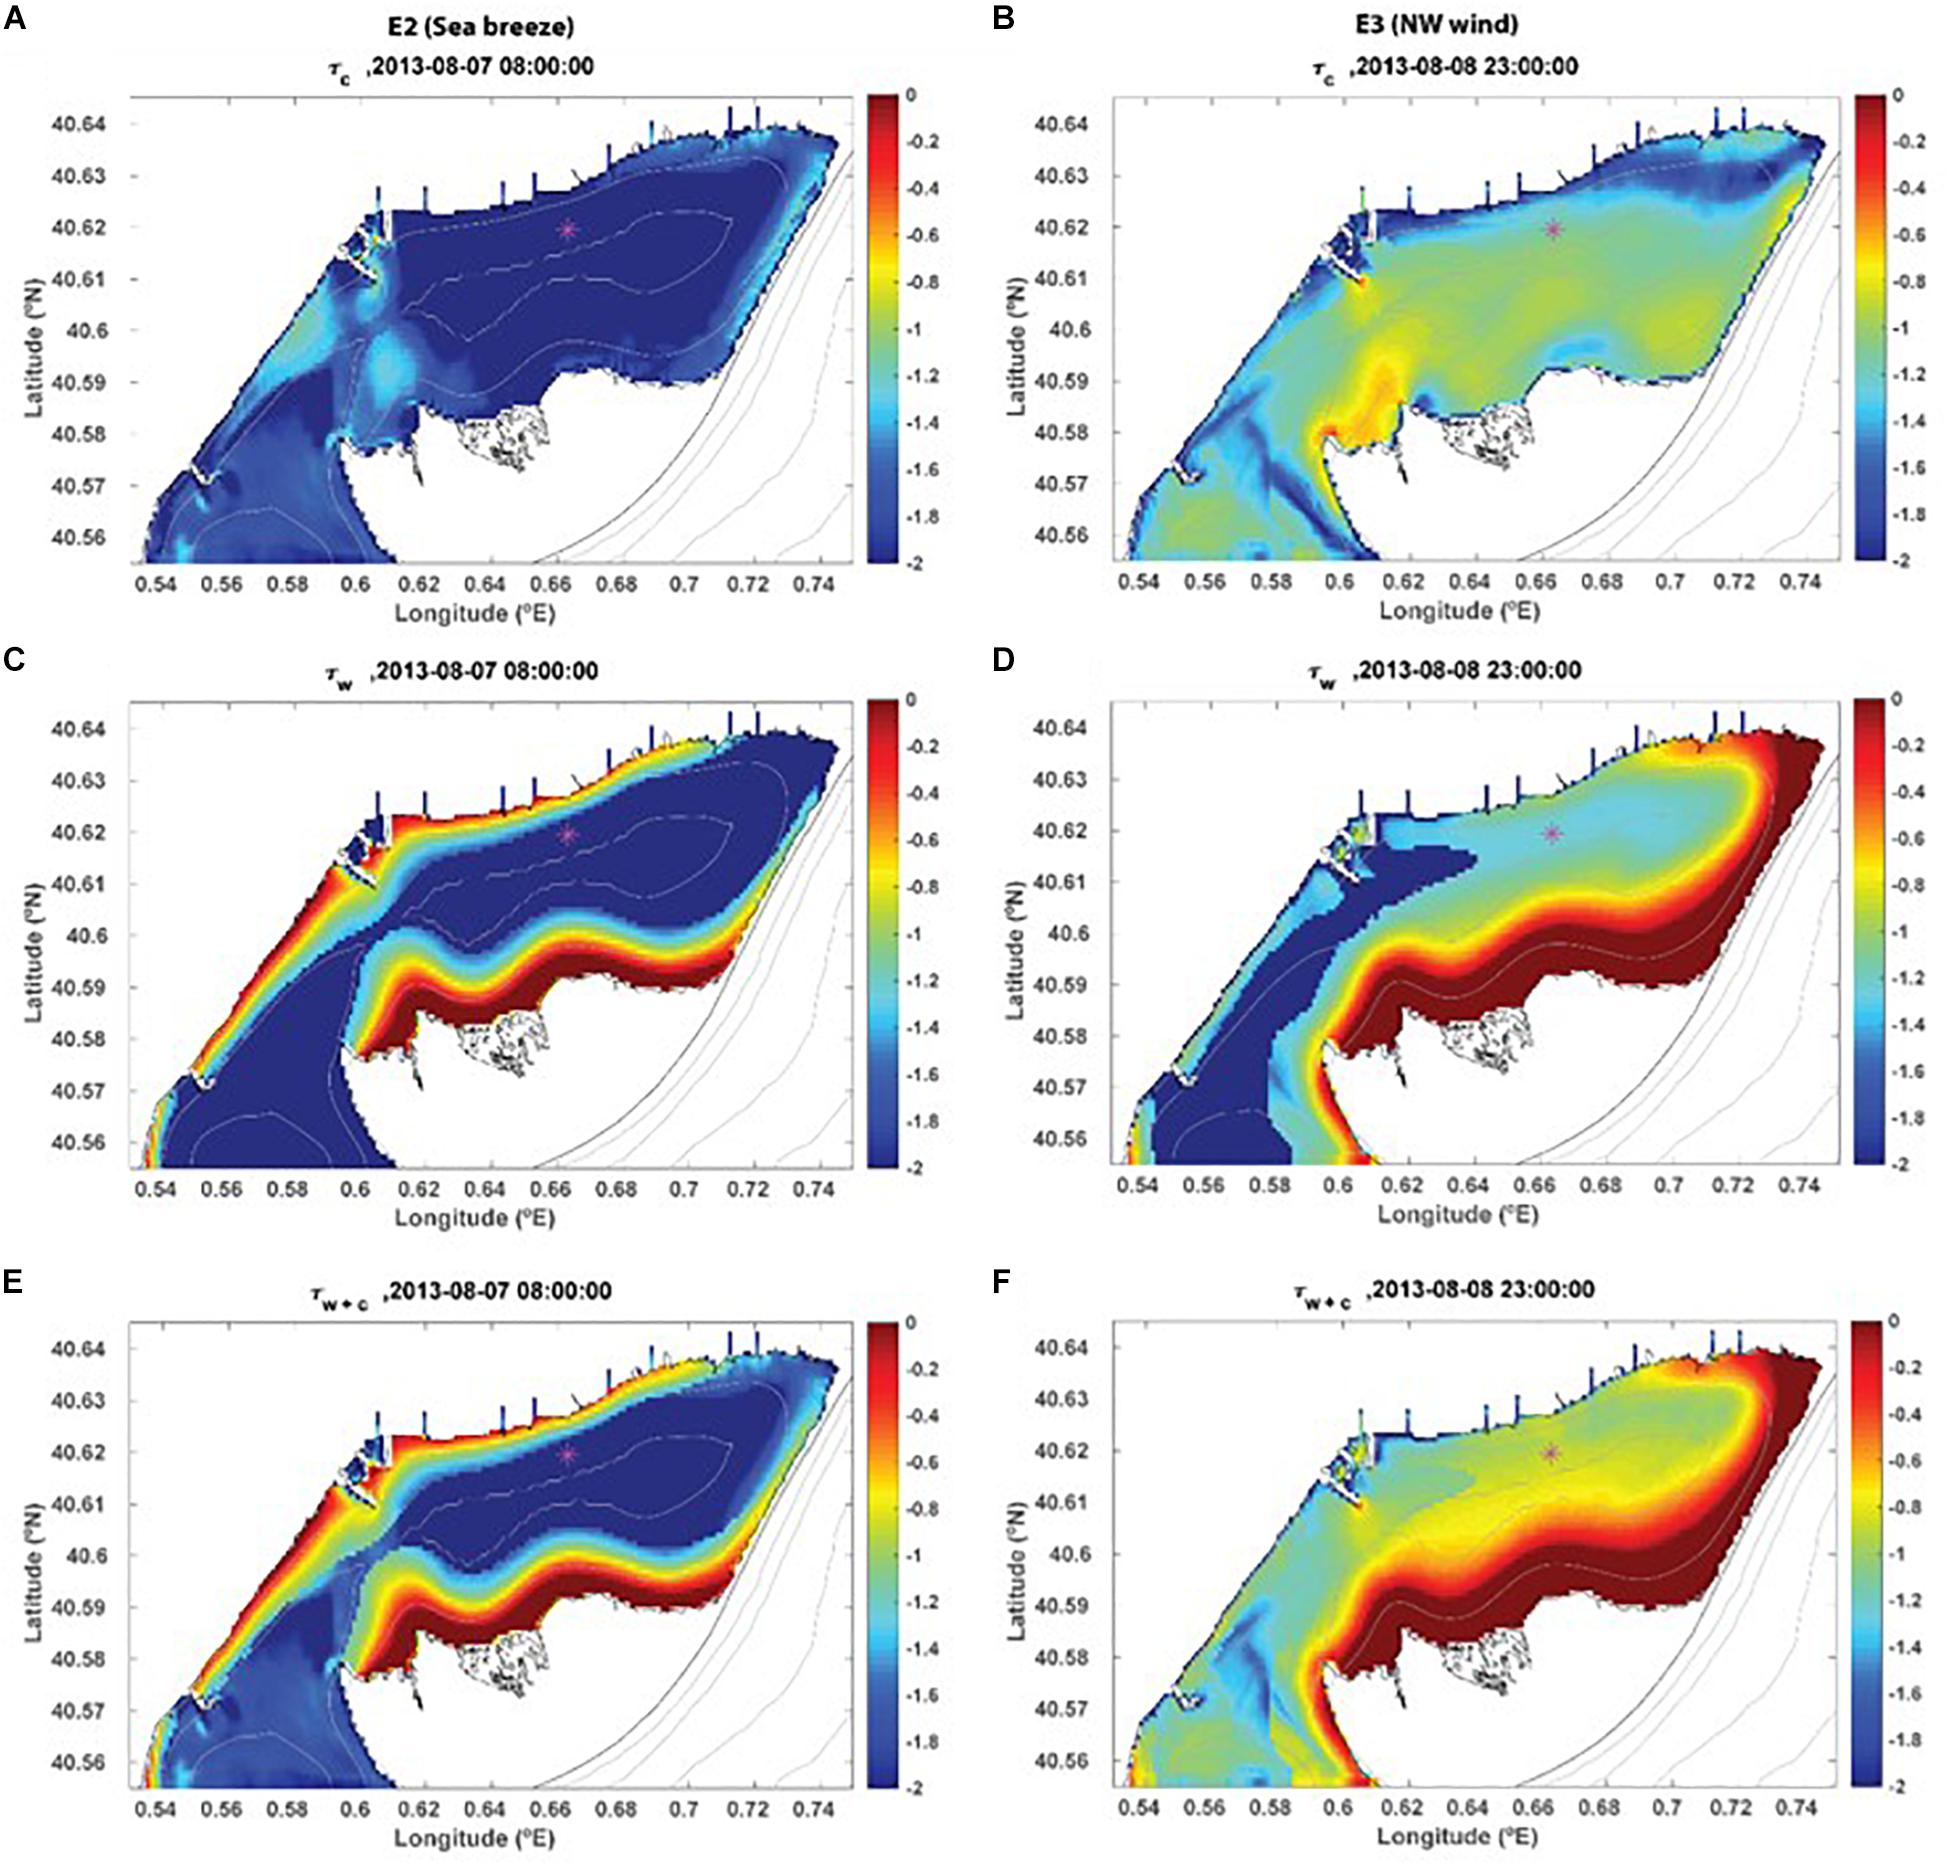
Figure 7. Distribution of bottom shear stresses under sea breeze (from E, left column, corresponding to boxes A,C,E) and land wind (from NW, right column, corresponding to boxes B,D,F). The presented bottom shear stress spatial distributions correspond to 3D circulation (boxes A,B), incoming wave fields (boxes C,D) and the nonlinear combination of wave-circulation fields (boxes E,F). All plots represent the Alfacs Bay in the southern Ebro delta within the Catalan coast pilot case, and for clarity all plots are drawn in logarithmic scale (in 10 Pa).
The synergy between model simulations and Sentinel data, supported by in-situ observations, is a key element for assessing coastal metocean coupling under macro-tidal and high wave energy conditions. Coupled models tend to outperform stand-alone versions, as analyzed for the German Bight pilot case, based on the NEMO and WAM codes for circulation and waves, respectively, using the OASIS3-MCT coupler. Sea surface roughness, wave-current interactions and turbulence levels have shown their impact on surge predictions (Staneva et al., 2021) and error patterns have been derived from a simultaneous treatment of Eulerian fields and Lagrangian trajectories. This simultaneous analysis, comparing the contributions from Eulerian near surface current, direct wind drag and Stokes drift, has allowed assessing how their respective distributions can explain anomalous transport both near the surface and in depth (Stanev et al., 2019a; Staneva et al., 2021). Error dependence on numerical grid size and type becomes relevant for shallow water areas with sharp gradients and it has been tested with a variety of codes for waves (WAM, SWAN, or WAVEWATCH III) and currents (NEMO or ROMS). Figure 8 shows an example where the performance of a WAVEWATCH III model with a variable grid (AMM15, 3 km cells offshore refined to 1.5 km at the coast, atmospheric forcing at 1 h) is compared against a coarser regular grid configuration (AMM7, 7 km cells). The comparison is based on conventional error metrics, in this case normalized RMSE, where the normalizing factor is the standard deviation of observations. The main parameter verified is significant wave height, for a 2-year hindcast interval against observed data. In open waters there is little difference between the two models, but grid effects become much more substantial in the coastal zone, with the refined grid model generally performing better. At a number of coastal sites, where the AMM15 model performance degrades, dominant process scales (e.g., due to strong current shear in the Bristol Channel or morphological wetting and drying in the Wash and Thames approaches) are below the resolution of both models. The variable grid AMM15 wave model now forms the basis for operational wave forecast products delivered by the Met Office for both United Kingdom waters and the CMEMS Northwest European Shelf service.
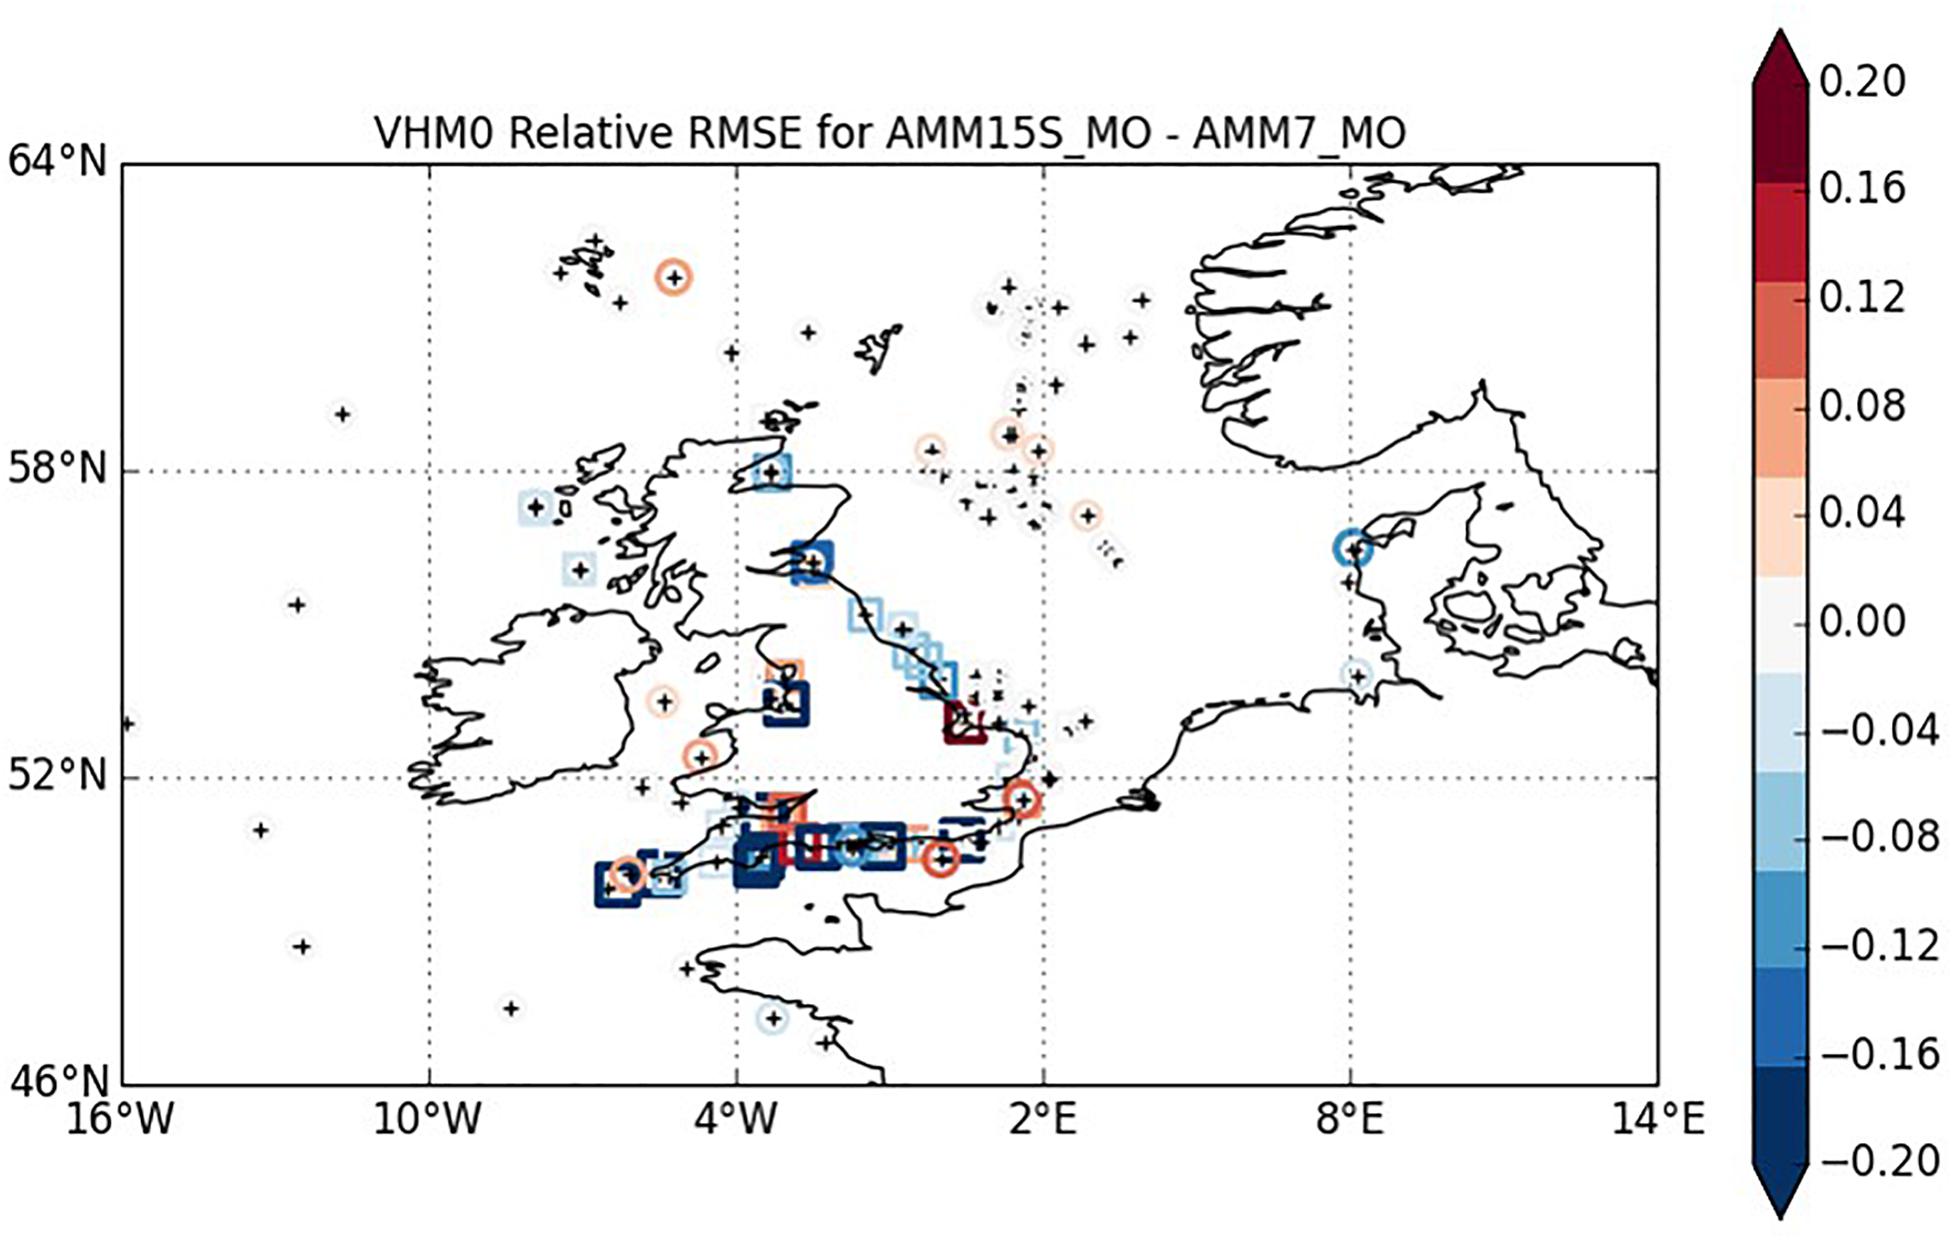
Figure 8. Relative change in normalized root-mean-square error (RMSE) of significant wave height (denoted VHM0 following CMEMS variable naming convention) compared with in-situ observations for 3–1.5 km versus 7 km WAVEWATCH III models (AMM15 and AMM7, respectively). The error shows a degradation in performance in red and an improvement in performance in blue, where AMM15 NRMSE changes relative to AMM7 NRMSE. The increasing resolution has a largely neutral impact in open waters, while for coastal zone predictions a majority of in-situ sites verify better for the AMM15 model.
Coastal Assimilation and Error Control
Modeling skills for coastal domains have improved with data assimilation, provided the observations have enough spatial structure, as in the case of satellite data. Performed simulations show how assimilation increases forecast skill over lead times up to 12 h, both for offshore and coastal zones. For HS, this impact was a 0.05–0.10 m improvement in RMSE for offshore locations in the North Sea pilot case. Such an improvement resulted in up to 0.03 m error reductions for coastal areas (Figure 9). A sensitivity analysis, combining in-situ observations from offshore and coastal deployments plus altimeter data, suggested that the longer-lived skill improvements, versus a free running control experiment, were underpinned by broad scale assimilation of altimeter data in the offshore domain. Addition of offshore in-situ data also introduced a significant improvement, but only for the first few hours of forecast. A similar, but even more short-lived benefit, was found when extending assimilation to in-situ coastal observations, although the benefit can become more significant for evolving (in space, time and frequency) metocean fields, often validated by a limited number of in-situ deployments or by satellite data with a limited time coverage. Error quantification, which requires extrapolations/interpolations with seldom estimated effects, is normally referred to integral quantities, while local (coastal) assessments usually require an error distribution in time, space and frequency axes to comply with application needs, such as two wave directions for longshore transport under bi-modal wave conditions. Coastal error metrics should thus reflect preferential correlations, spectral features, and troublesome directional sectors, which may lead to augmented uncertainty by non-linear interactions.
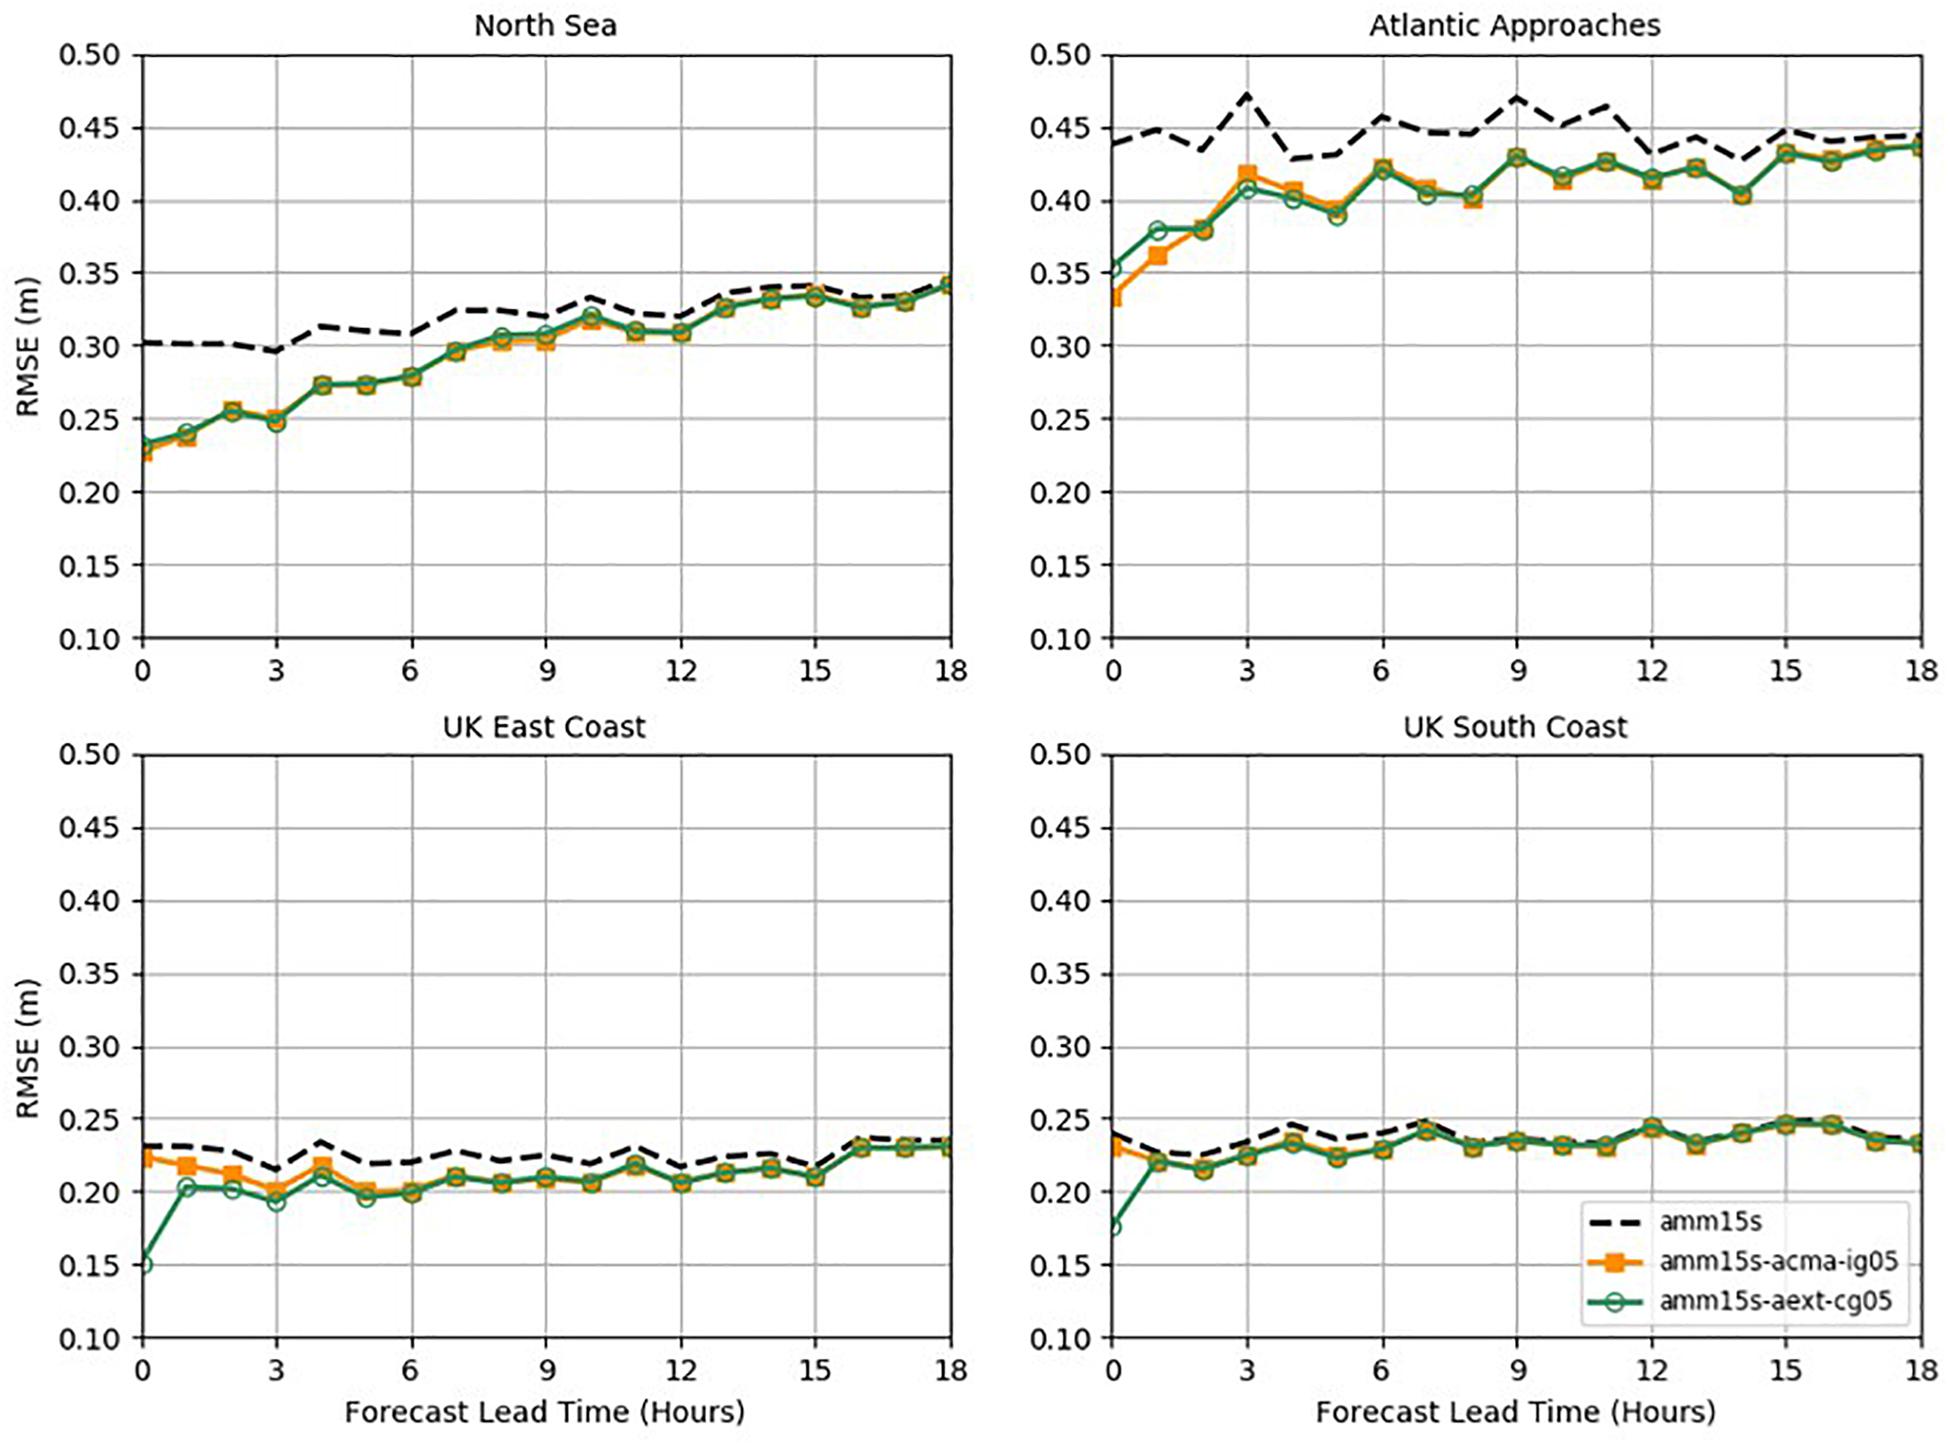
Figure 9. RMSE for significant wave height predictions in the North Sea pilot case, corresponding to the North Sea domain (top left), the Atlantic approaching area (top right), the UK East Coast (bottom left) and the UK South Coast (bottom right). The three analyzed numerical experiments have been inter-compared to show how they can help controlling the RMSE. Each of the panels present: model run without data assimilation (amm15s, black dashed line); model run with assimilation of satellite altimeter and in-situ wave observations in open water (amm15s-acma-ig05, gold line); model run with assimilation of satellite altimeter and in-situ wave observations covering both open and coastal waters (amm15s-aext-cg05, green line).
Coastal error patterns are controlled by physical processes, numerical schemes, domain geometry (topo-bathymetry) and energetic level of the metocean event considered. Of these, wind fields, and heat fluxes remain responsible for a large part of the error bar in the pilot cases without significant freshwater discharges such as the Mediterranean pilot cases during specific summer seasons (Feng and Shinoda, 2019; Marra et al., 2019; Yu et al., 2020). For different metocean conditions or in different pilot cases, initialization, salinity/temperature and bathymetric evolution, affected by land/metocean conditions, may provide significant contributions to the error (Wiese et al., 2020). The uncertainty of atmospheric parameters and air-sea transfers expands within wave and circulation models in a complicated manner, depending on local parameterizations and numerical techniques. Numerical discretization is related to dissipation levels, where combined physical and numerical diffusivities tend to smooth error propagation. Resulting error bars are reduced by the cumulative character of meteorological forcing, but increase by the limited resolution of meteo forcings. CEASELESS simulations driven by 6-hourly ECMWF fields have illustrated the increase in uncertainty for fast developing storms (e.g., in the Mediterranean, with an average duration of 12 h), while the use of forecasts with higher time and spatial resolution (using ECMWF operational global model of 9 km as reference) leads to improved predictions, particularly for underestimated offshore winds. The “traditional” wind enhancement coefficient (Cavaleri and Bertotti, 2004) decreases with increasing meteorological resolution and can be refined within a given coastal domain and depending on directional sector, because the problem is associated to fetch. Such a behavior was confirmed (Cavaleri et al., 2019a) for the Adrian storm (named Vaia in Italy) in October 2018 (Figure 10), when the south-east Sirocco wind was blowing along the Adriatic Sea, as shown by ASCAT-b scatterometer pictures of the storm (local) wind field. The comparison between model results and measured data (Figure 10) shows a best-fit underestimate of order 11% for wind speed, with directions differing on average by less than 2 degrees. The use of “corrected” winds by an enhancement factor may lead, thus, to smaller coastal errors when predicting waves and surges.
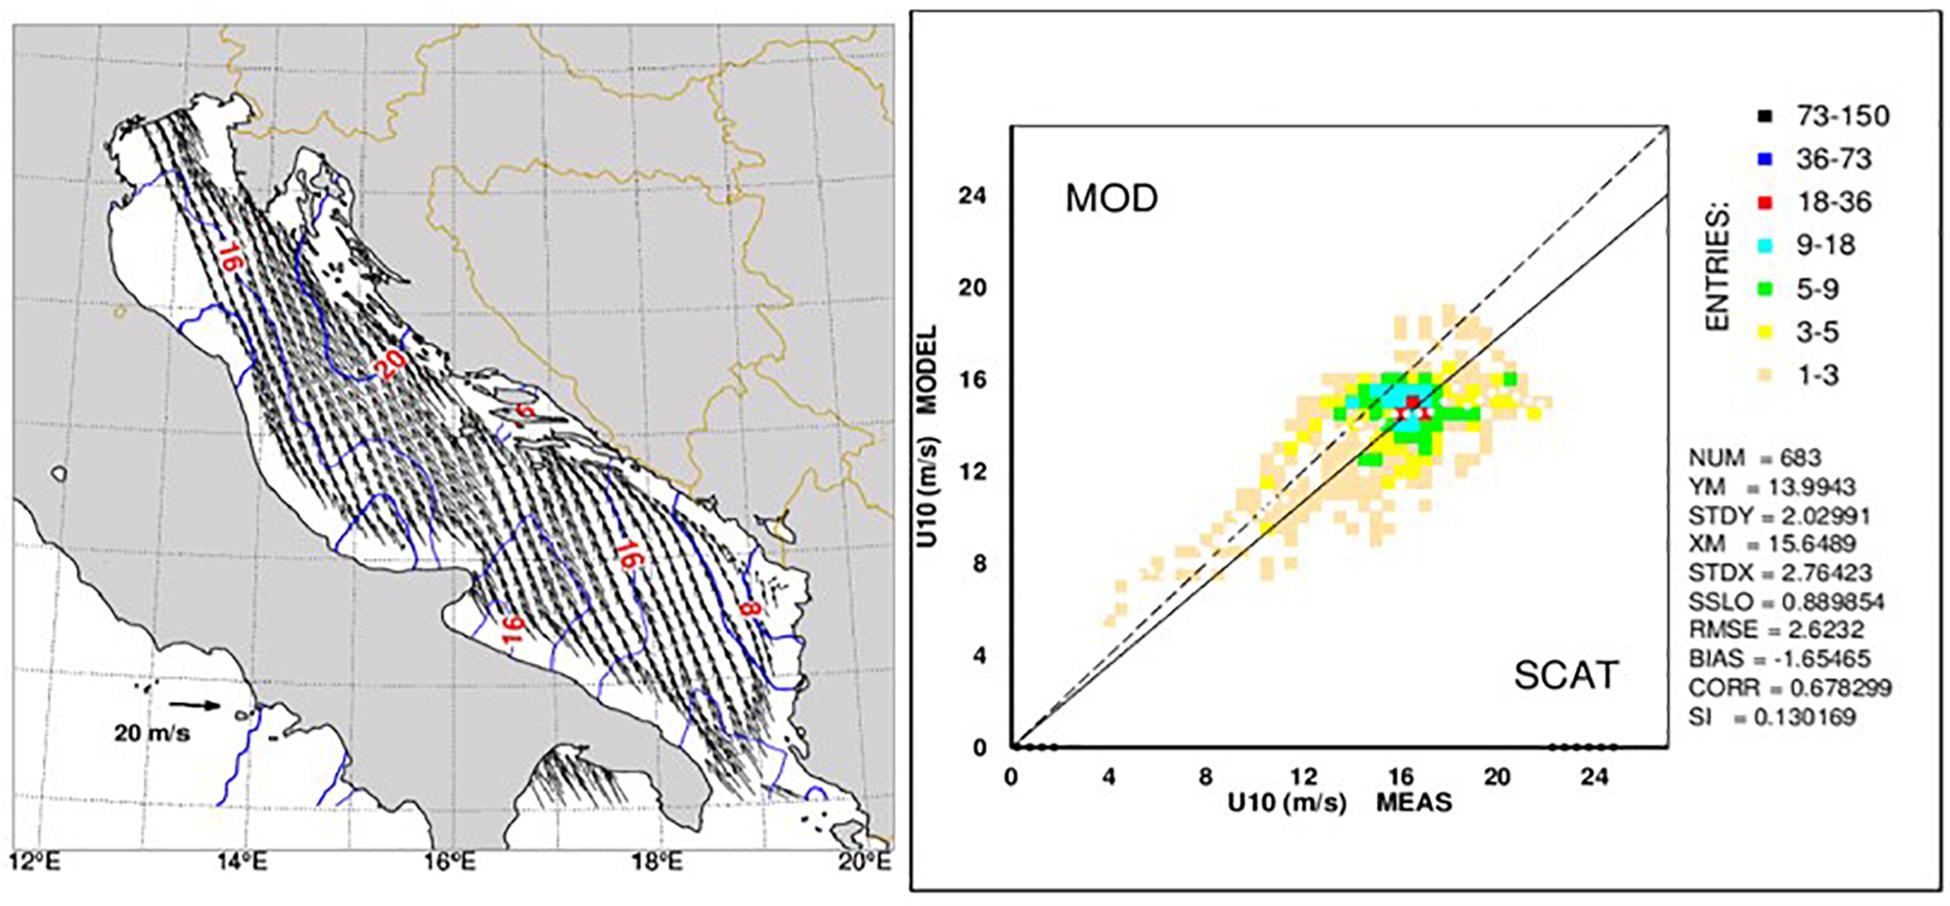
Figure 10. Wind field derived from ASCAT-B scatterometer in the evening of 29th October, 2018 over the Adriatic Sea pilot (left), and comparison between modeled and measured wind speed values for that event (right).
The accuracy of atmospheric fields has been improved by limited area models, initialized with mesoscale data assimilation procedures. Regardless of the assimilation technique employed for convective scale numerical weather prediction, the ingestion of data from local measurements and high-resolution RS retrievals, have improved forecast quality, compared to conventional downscaling (e.g., Gustafsson et al., 2018). The role of local features at high resolution has been considered over the North Adriatic pilot case, with Sentinel wind data ingested into a local analysis and prediction (LAPS) system (McGinley et al., 1992; Tiesi et al., 2016) to generate initial conditions for high-resolution WRF simulations. These runs, with 2 km grid spacing, have spanned 20 events of severe weather conditions, showing a sensible improvement in the first 7–10 h of simulation for surface variables and cumulated precipitation. Circulation results show RMSE between analysis and HFR patterns ranging from 0.10 to 0.15 m/s in general, although higher deviations are present in very shallow areas due to bathymetric errors in the modeling.
Coastal metocean data suffers from a limited spatial coverage, thus receiving less attention than open ocean conditioning. Experience before CEASELESS considered that coastal assimilation had a limited impact for improving global predictions, particularly at coarse resolution. However, the amount of coastal in-situ data has increased steadily and model resolutions have become finer, allowing a robust assessment of assimilation benefits for coastal predictions. Enhanced assimilation techniques (e.g., Belyaev et al., 2019; De Mey-Frémaux et al., 2019) and model-to-model ‘data assimilation’ is now gaining attention in the scientific literature, applied for instance to ingest coastal model data into larger scale models. The assessments carried out for wave fields, using stand-alone wave model experiments, employed the 28 km resolution ECMWF global model (ECMWF, 2019) and forcing wind fields from the operational ECMWF forecasts. Initial conditions were extracted from a long-term stand-alone wave height forecast, while data assimilation was based on optimum assimilation (Abdalla and Janssen, 2017), using an equal-specification background error for in-situ and altimeter data. Hourly continuous analysis windows were used and 7-day forecasts (from 0 and 12 UTC) were produced to study the impact of data assimilation on forecast quality. In-situ measurements from October 2018, available at ECMWF, were carefully selected and quality controlled, yielding 199.766 in-situ data from 355 individual measuring stations. Performed numerical experiments correspond to: (a) no data; (b) in-situ data assimilation; (c) altimeter data combined with in-situ data assimilation. The RS data involved all altimeters available at the time of the study (S3A, Jason-3, Jason-2, CryoSat-2, and Saral-Altika). Model verification was done using peak period and mean wave period in-situ data, since HS was used in the assimilation and no longer constituted an independent dataset.
The impact of assimilation has been evaluated using conventional metrics and the Random Error Reduction index (RER), a particularly robust parameter that is defined as:
Here SDDX–Y is the standard deviation of the difference between the X and Y fields, and subscripts H, M, and B refer to the hindcast without data assimilation, the model run with data assimilation and to the collocated in-situ measurements, respectively. This index describes the role of assimilated data in reducing random model errors when compared to the free run without assimilation. Therefore, the higher the RER value is, the more effective the assimilation data are.
The evolution of significant wave height error (RER, RMSE, or similar metrics) has been computed for the assimilation experiments, comparing the runs with (in-situ and remote) and without data assimilation for October 2018 (Figure 11). Because in-situ buoy data have been already assimilated, the random error reduction for buoy data and the combined buoy-altimeter assimilation shoot up at the analysis time to values around 44%. Due to the limited geographical coverage of in-situ data and proximity to the coast, their impact diminishes faster than the impact from altimeter data, although the addition of in-situ data to altimeter data has a beneficial effect on the forecast. The analysis has also shown how assimilation reduces the error in wave period predictions. The impact of in-situ assimilation for mean wave period lasts more than 37 h in the forecast range and therefore adding in-situ wave data to altimeter wave data again improves short-range coastal forecasts. The combination of both data sources appears to be additive and, as more in-situ data become available, in particular from recent drifting buoys, further benefits for operational systems might be produced. The system memory in this global application was found to be substantially longer than in the coastal case. Nevertheless, the additive improvement from using in-situ data combined with satellite data, has been systematically observed in both cases, suggesting the important role of in-situ data in forecast applications at ocean scales, rapidly cycling now-casts and reanalysis products at both ocean and coastal scales.
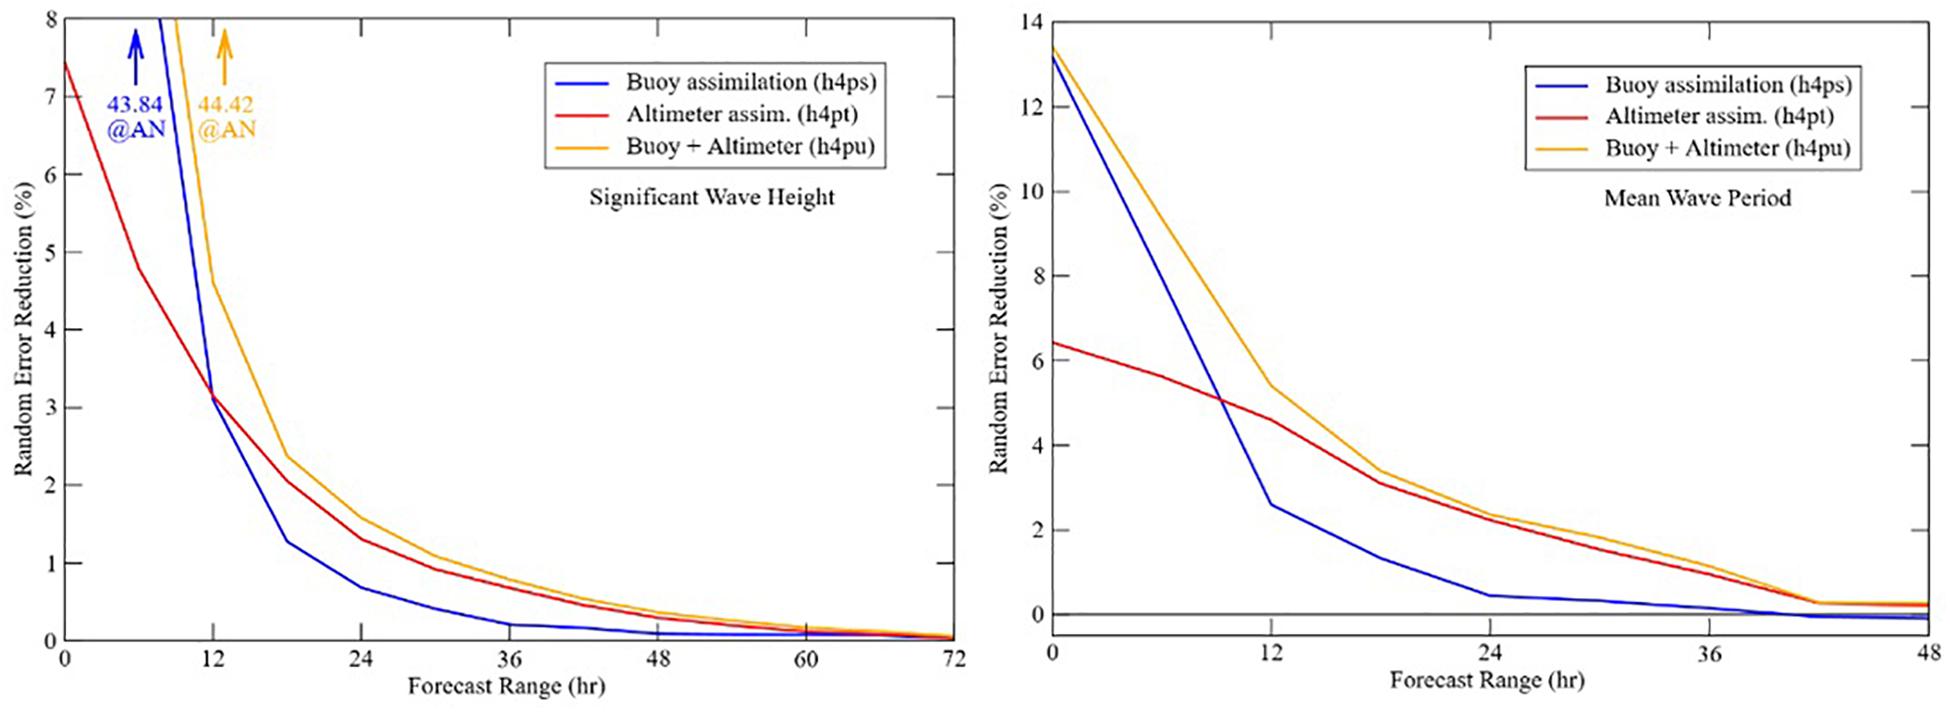
Figure 11. Random error reduction in significant wave height HS (left) and mean wave period (right) from all performed experiments compared to the experiment without data assimilation, verified with all available in-situ data for the whole month of October 2018. Note that the random error reduction by in-situ-assimilation and the combined in-situ-altimeter assimilation shoot up at analysis times to the depicted values.
Assimilation improvements can be referred to specific temporal/spatial regions, to predefined frequency bands or to aggregated variables (e.g., HS or eddy energy), showing different levels of benefit and duration. The zero-order spectral error, that is the average over frequencies and directions of the differences between forecast spectral density (EF) and observed spectral density (EO), is proportional to the error of the squared significant wave height, where σ indicates the variance for characterising energy):
Which upon averaging becomes:
Hence, at least to lower order, the correct information on the model error is given by the weighted error of HS, with integrated errors in spectral density resulting in both HS error (Ho baseline value) and uncertainty, affecting the modeling skills for low energy sea states. Moreover, heteroscedastic errors in the wave height may translate into non-heteroscedastic energy errors, affecting sediment transport or renewable energy. If the ΔHS distribution is not narrow, the RMSE for the wave height must be included. This means that it is necessary to have error and uncertainty for fields like wave height, when describing the first order moment of the energy error distribution, and that higher order moments are needed to describe the actual model uncertainty.
Repeating the approach for the RMSE of the zero spectral moment results in:
Here, the scales of the baseline (observational or forecasted) enter the equation and therefore participate in the skill assessment.
The performed analyses have shown how assimilation makes sense, even for a coastal system with a short memory due to its constrained domain geometry. By correcting systematic errors (e.g., poorly estimated bottom friction) it is indeed feasible to improve the quality of such coastal predictions. Forecasting diagnosis will require dedicated metrics, normally related to spectral descriptions for waves or specific patterns in the current or atmospheric fields, although many stakeholders still prefer conventional metrics (e.g., RMSE) or applications for derived variables, where non-linearity and combinations of original variables (e.g., wave height and period for wave steepness) introduces further complexities in error propagation.
Advances on Parameterizations, Data Collocation and Interfacing
Comparing RS and in-situ observations with simulations, at coastal scales, has led to advances based on triple collocation, that aim to circumvent issues due to scarce data (e.g., from new satellites like S3). Because of coastal anisotropy and gradients, the lack of data tends to enhance uncertainties in the estimation of heterogeneous errors. High resolution simulations and observations have required developing statistical approaches to estimate uncertainties for different variables, preferably as a function of distance to land, or for restricted domains with low signal-to-noise ratios. Model coupling, considering dominant scales and process interactions, has allowed important improvements in the predictions, particularly for high energy events. Air-sea exchanges have been addressed by implementing a wave boundary layer model inside spectral wave models. This wave boundary layer is based on momentum conservation, with the wind input provided by the WRF atmospheric model. Turbulent stresses are used to calculate the source function in the wave model (SWAN) and, from this, wave induced stresses have been derived and fed back into the momentum conservation equations. The resulting total stress is transferred back to the atmospheric model (Du et al., 2017, 2019), performing a comparison with other state-of-the-art coupling approaches, including Taylor and Yelland (2001), Oost et al. (2002), Drennan et al. (2003), Li (2011), and Fan et al. (2012). The associated advances in circulation modeling have been assessed from the analysis of particle transport driven by coupled wave-current-atmospheric models (Staneva et al., 2021).
The methodology for assessing simulation quality includes a combination of Lagrangian and Eulerian experiments, enabling the intercomparison of (observed) distinctive features such as anomalous gradients, transport patterns, and circulation reversals. These reversals have been considered for near surface and deeper layers, analyzing their longer-term implications. Particle tracking has been calibrated using observed GPS drifter movement and Lagrangian trajectories, supported by observations from wooden drifters. The contributions from the Eulerian near-surface current, direct wind drag, and Stokes drift have been quantified (Figure 12), analyzing the propagation of model drifters and the spatial patterns of coupled current-wave-wind fields, supported by sensitivity experiments using different parameterizations for wave-current interactions. Coupled metocean predictions, including the wave boundary layer model as a new wind source function for wave codes, have allowed assessing short wave sheltering by the presence of long waves, and calculating wind profiles within the wave boundary layer that differ from logarithmic ones, suggesting a way to circumvent some of the drawbacks of the Janssen (1991) approach. These advances, based on different codes and closure formulations, have been evaluated against Sentinel and buoy data. Observed coastal gradients, with implications for coastal risk forecasting associated to flooding or search/rescue operations, have been investigated for energetic meteorological conditions. The predicted wave height gradients, also observed in in-situ data and CMEMS products (AMM15) for the German Bight coastal area, have been analyzed using triple collocation to separate different error sources and to assess modeling performance. The spatial structure derived from Sentinel altimeter data has allowed determining a regional picture of the wave height field that, when combined with regional oceanographic models, has served to optimize the representation of wave growth and dissipation processes near the coast.
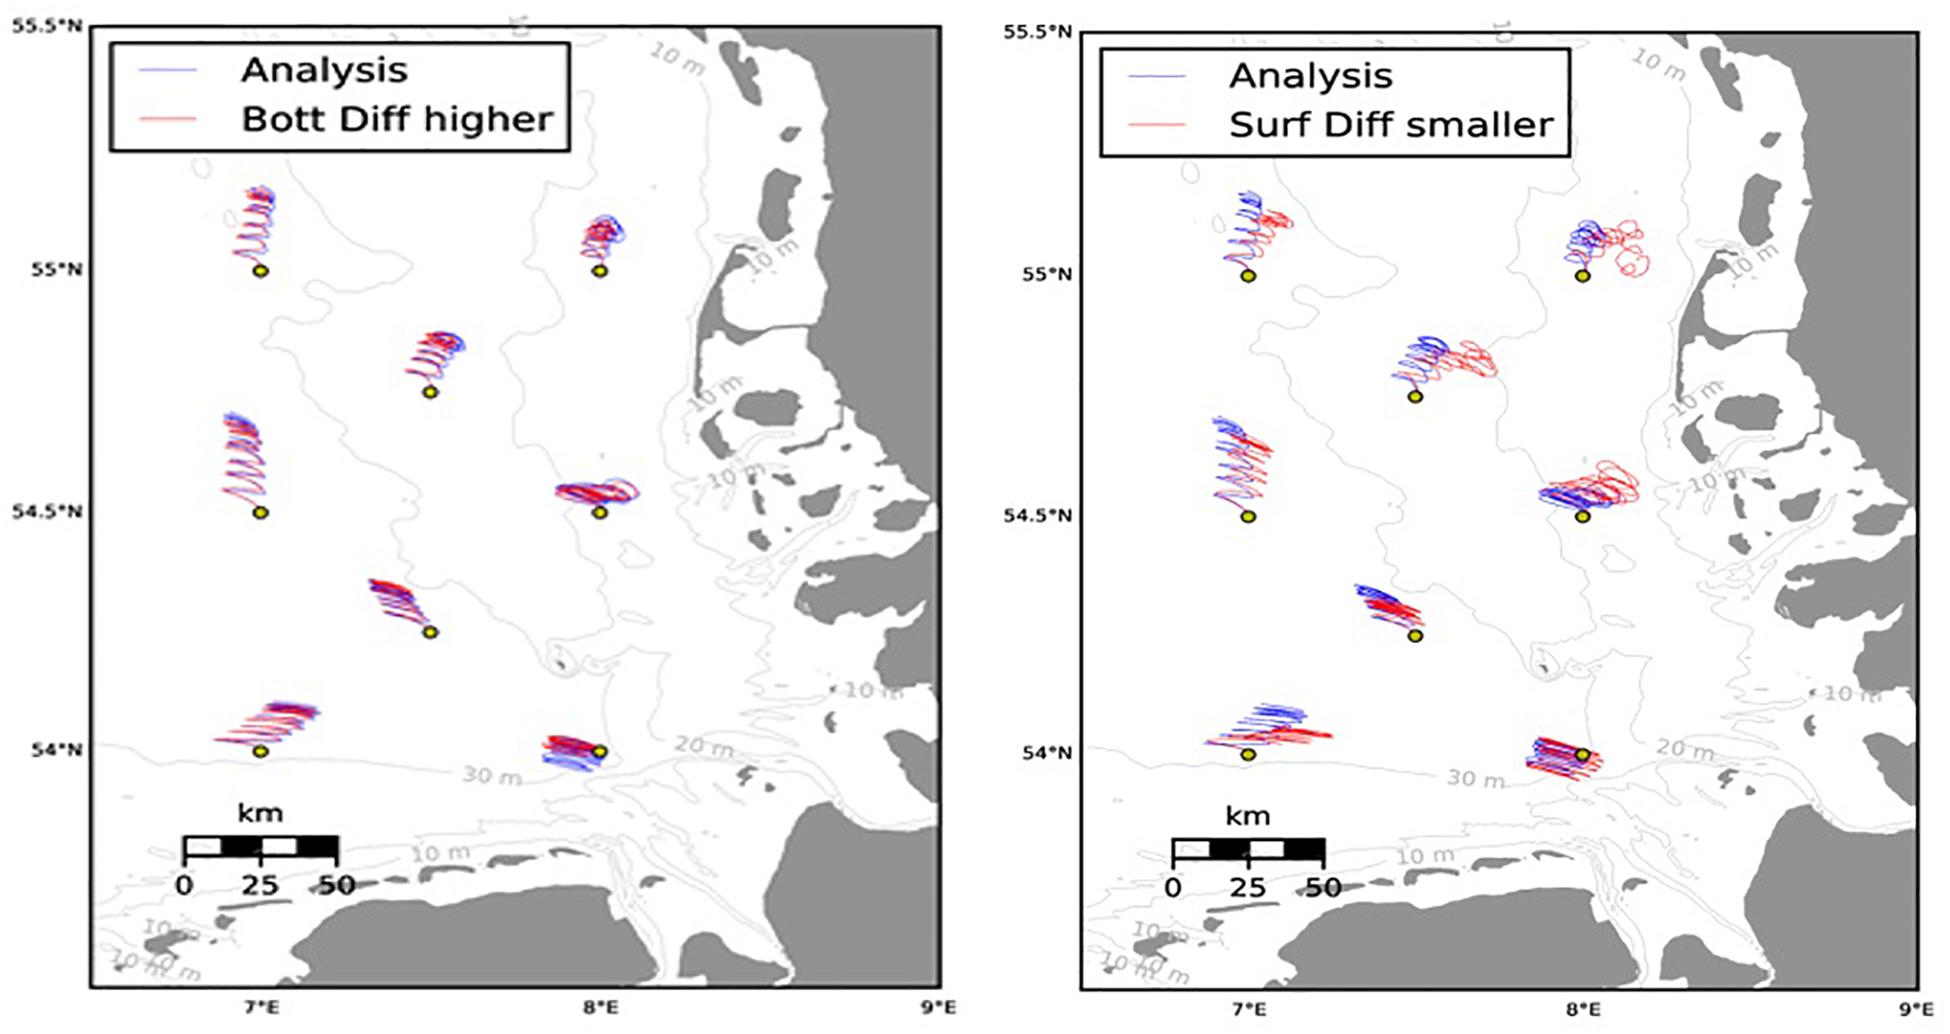
Figure 12. Comparisons of surface drift trajectories derived from analyzed model runs (blue trajectories) against first guess runs (red curves) over a period of 5 days for the German Bight pilot case. The yellow dots indicate the release locations. The red trajectories in the left plot are based on a higher bottom roughness estimation. The red trajectories in the right plot are related to a reduction of the momentum diffusion in the surface layer. The pictures also show the 10, 20, and 30 m isobaths in the domain, superimposed as gray lines.
Error reduction, by combining RS and modeled data, is a key element for enhanced coastal applications and the optimization of coastal observatories. The benefit from new measurements depends largely on the type of model errors that can be potentially corrected in subsequent analyses. In shallow water areas, coastal complexities such as an evolving bathymetry, bottom friction associated to bed roughness, or topo-bathymetric gradients, hamper the error assessment, particularly for short fetch conditions. In addition, the method used to combine boundary forcings (e.g., current velocities and water levels) from different sources has proved to have a large impact in constrained coastal domains. In cases with sharp atmospheric gradients (e.g., topographic wind channeling), air-sea interactions may affect the quality of the predictions, requiring assimilation of satellite data that can provide unique information on the spatial structure for these fields. Such an assimilation was performed in the German Bight using a 4D variational approach for model optimization, resulting in an improvement of model parameters and trajectory predictions. This type of forecasting error reduction is a requirement for enhanced coastal applications, in which wave and currents interact and are affected by non-linear processes that may lead to different results, depending on the selected parameters or closure sub-models.
These advances illustrate possible synergies between high-resolution models, satellite data and in-situ observations, supported by co-developed user interfaces that have shown throughout the project the coastal potential of CMEMS products. CEASELESS results demonstrate the potential of the proposed coastal products for their eventual ingestion into a properly verified CMEMS coastal extension, playing an increasingly important role in assessments as well as decision/policy making. Proposed recommendations for verifying coastal products and enabling quality comparisons against existing regional products are based on principles of: (a) simplicity (ease of use); (b) reproducibility (ability for CMEMS customers to confirm and use verification data); (c) extensibility (verification products that are relevant and useable for both offshore and coastal domains). The following points summarize some of the suggested good practice criteria for verifying the quality of coastal predictions:
• Apply “neighborhood verification,” in which a probabilistic analysis of model results is performed, using a neighborhood of model data points surrounding the observation or study point (Ebert, 2009), as a unified approach to verification in both offshore and coastal zones. This enables users to understand not only model skill, but also the scales over which data can be applied.
• Verify with robust error metrics, such as Mean Absolute Error (MAE), Random Error Reduction (RER) or Continuous Rank Probability Score (CRPS; Hersbach, 2000) to determine forecast skill and long-term model evolution. RER and MAE are metrics well aligned with the generic requirement for simplicity in CMEMS product verification. CRPS score is suggested for ensemble forecasts, where it can be compared with RER or MAE for the present generation of deterministic forecasts when examining long term service changes.
• Verify data together with metadata, for example distance to the coast, to provide users with a better understanding of the limits for model performance, e.g., as a function of coverage or coastal distance. Verifications should include a discussion of application limits with illustrative examples as well as maps of verification ‘blind spots’ in the CMEMS Quality Information Documents (QuIDs) that are used to summarize model performance.
• Verify with explicit post-processing for model and observation data, including the supporting routines for CMEMS product verification statistics. This information, along with application guidelines, should help downstream users generate their own application-specific verifications.
Limits and Recommendations for Coastal Applications
The CMEMS-based coastal products developed in CEASELESS, which include shallow water processes and interactions, have incorporated local knowledge, stakeholder criteria and requirements to advance the state-of-the-art in a wide set of sectors, from storm and risk now-casting to sustainable aquaculture, from coastal hazard management to offshore wind farm operation or as support of search/rescue and coastal management activities. These applications have used available metocean data to provide explicit error assessments, illustrating the technical and economic feasibility of the proposed methodology and products, for both mild and severe metocean conditions. The heat summer waves in the Catalan coast pilot case or storm that hit the Adriatic pilot case in the last week of October 2018 are typical examples. The data to characterize energetic drivers such as the strong winds and extensive rainfall leading to the Venice flooding were made available on demand, following standardized protocols. The predictability of the intensity and timing of such energetic events was investigated, paying special attention to the phase shift between storm surge predictions and astronomical tide, which was crucial in limiting the extent of flood damage for the Venice pilot case. Flooding was limited by the fortunate mismatch between storm surge and astronomical tides, which limited flooding damages, as opposed to a later event (12th November, 2019), during which the recorded sea level reached just 7 cm below the peak of the historical 1966 flood (Cavaleri et al., 2020). The water renovation and peaks in temperature or nutrient concentrations (Cerralbo et al., 2019) for semi-enclosed coastal bays was forecast to enable users such as aquaculture farmers to take anticipatory action. Special attention was paid to the predictability of local wind fields, enhancing natural renovation and controlling suspended matter concentrations (Grifoll et al., 2019) and thus water quality for aquaculture management. In these applications Sentinel data can play a key role in early warning and risk assessments, limiting the uncertainty in flooding time/intensity or in water quality temperature/concentration peaks. Surge predictions and shelf circulation/water levels can benefit from using the spatial pattern of wind and sea level provided by RS, together with the time variation from in-situ data. The proposed combination of satellite/in-situ data and numerical forecasts in restricted domains can overcome present modeling limits in terms of capturing fast moving pressure minima, introducing shelf sea level patterns and, in general, improving the quality of short-term coastal forecasts.
Medicanes, another illustration of sharp coastal gradients, have been analyzed by a combination of high-resolution models and Sentinel data, improving the prediction of variables that are poorly characterized by conventional measurements, such as near surface wind speeds over the sea, where these cyclones spend most of their lifetime and where the availability of data is generally limited. Here, limited area modeling combined with relevant information on the location of the cyclone centre provided by RS has led to an improved nowcasting capability. Sentinel data are able to represent such spatial wind patterns and gradients with unprecedented resolution, offering new perspectives on the detailed wind structures in these cyclones, while providing also a unique tool for their accurate monitoring and nowcasting. This is exemplified by the rapid changes of sea level gradients observed in the Venice coast, which illustrate the challenge for improved predictions: differences larger than 0.30 m between sea levels at coastal tide gauges and the nearby North Adriatic oceanographic tower (15 km offshore and in 16 m water depth) decreased suddenly when the sea level at the tower dropped by 0.20 m in about 5 min (Figure 13) due to the sudden halt of the Sirocco sea wind associated to the passage of the meteorological front. This illustrates how the wind stress was supporting the increase in mean sea level and the spatial gradients between coastal and offshore locations, and how improved forecasting and error bounding can result from simultaneous offshore and coastal data acquisition.
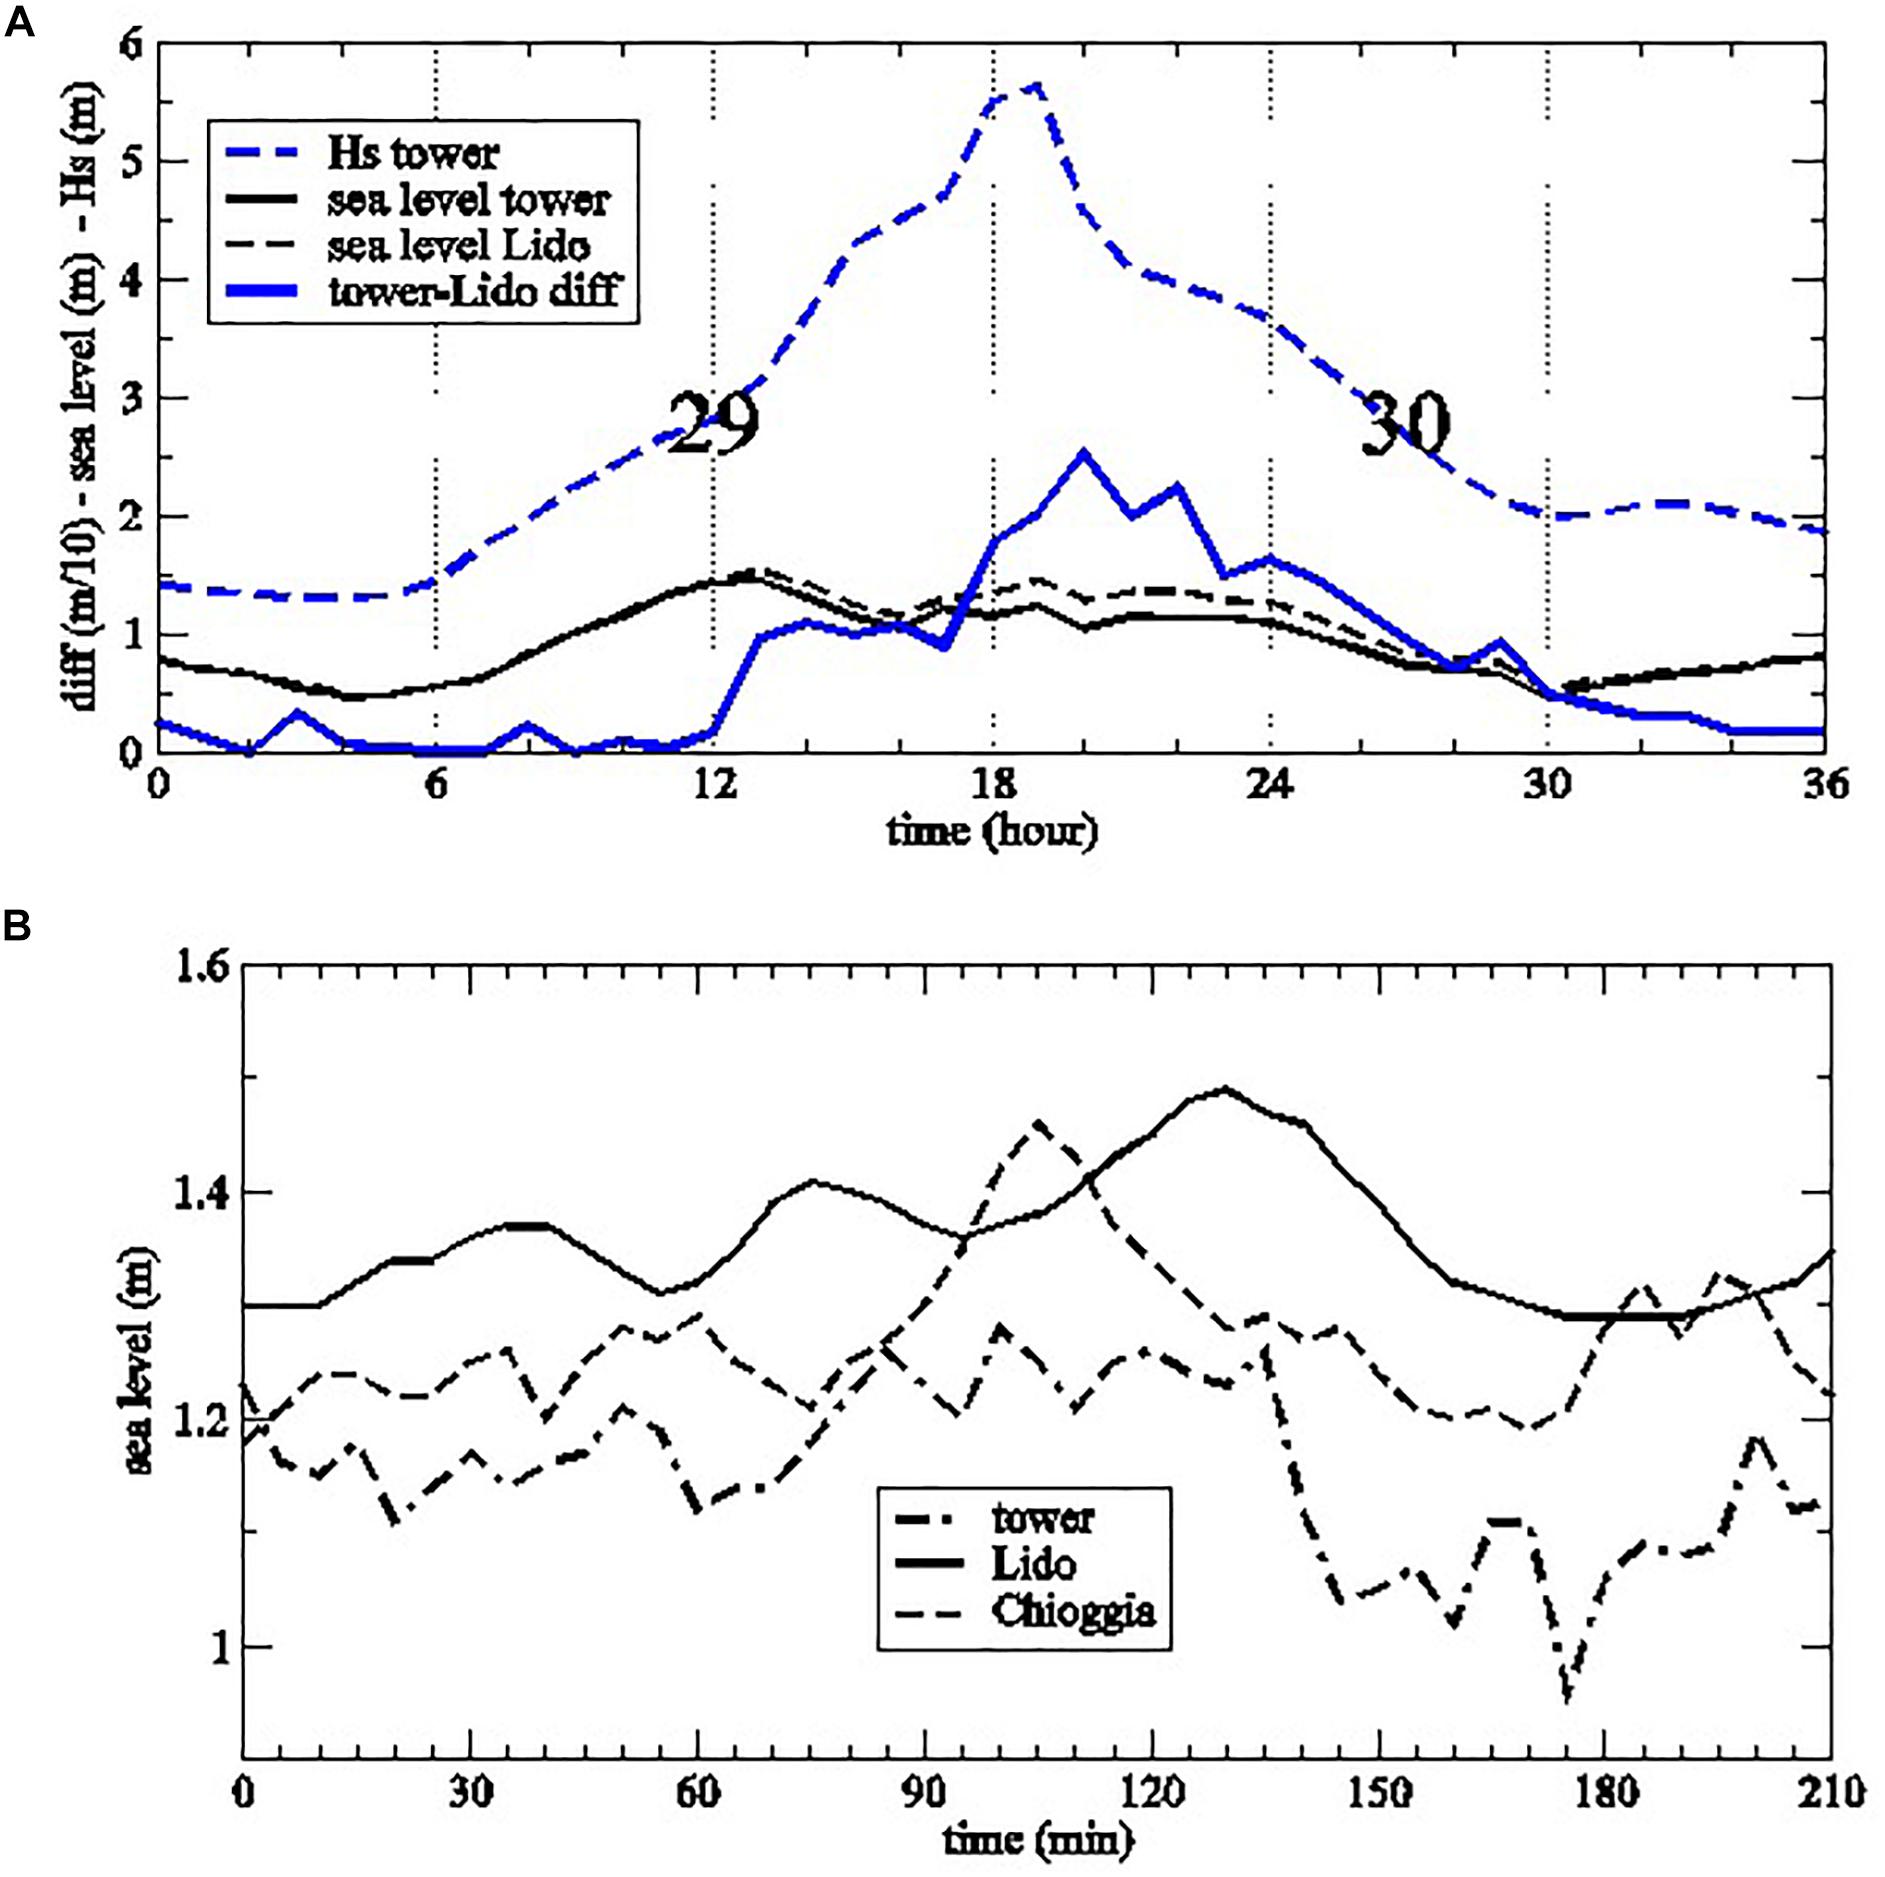
Figure 13. Time evolution and relationship between HS at the Aqua Alta tower (Northern Adriatic Sea pilot) and the sea level differences between the coastal (termed Lido) and the tower tide gauges (A) together with mean sea level variations between the tower and two coastal gauges (B). Note the sharp gradients occurring at 135 min at the tower signal, associated to the passage of the cold front on 29–30th October, 2018. Large numbers in the top plot indicate the day within the event duration.
Semi-enclosed domains, such as the Southern Ebro Delta Bay (Figure 14), have demonstrated the key role played by sea level in water quality and renovation times, controlled by wind, atmospheric pressure, land discharges, resonant seiching, and sea level at the bay mouth. CMEMS-forced predictions, calibrated for one full year with field campaigns, have allowed characterising temperature and nutrient/pollutant concentrations, supporting the control of water quality in the bay by means of pulsed land discharges and transient breaching in the fronting barrier beach, when renovation is enhanced by favorable wind fields. This has led to an advancement of present modeling capabilities for micro-tidal conditions, where the velocities are so weak (order of a few cm/sec) that conventional Eulerian calibration becomes difficult. These coastal cases require an accurate topo-bathymetric description that can be provided by S2 satellite-derived bathymetry (SDB), supplying an evolving and consistent domain geometry (shorelines, bed forms and isobaths) that are essential for an accurate prediction of current-wave coupled fields, where the differences in HS may exceed 100%, with sudden increases of more than 1.0 m. The potential of SDB to infer strong enough wave fields, modulated by seabed geometry, has also been assessed for the Danish coast case, exploring the potential of S2 images to detect wind mill wakes and local wave fields. These applications are very relevant considering the rapid development of offshore windfarms in coastal areas like the North Sea and Baltic Sea, but also to other shelf seas in Europe, providing criteria to determine the limits in atmospheric conditions that enable detecting wind-sea surface-sea bed-structure interactions. Such expansion of wind farms from coastal areas to open seas may affect the modeling requirements for tower and turbine design, since metocean conditions will become more isotropic and may not require the high-resolution coupled modeling approach of coastal areas. However, interactions between wind, waves and wakes will affect wind energy assessments and the resulting sea conditions, which need a more systematic research, as proved by the project results. Here, the role of satellite data combined with atmospheric models needs to be refined and applied with nested or unstructured grids, starting from regional or even global simulations. The combination of in-situ and SAR measurements can help advancing the present level of knowledge, so that the next generation of atmospheric models can better assess the renewable energy resource under local wind farm conditions, supporting future planning and operation decisions.
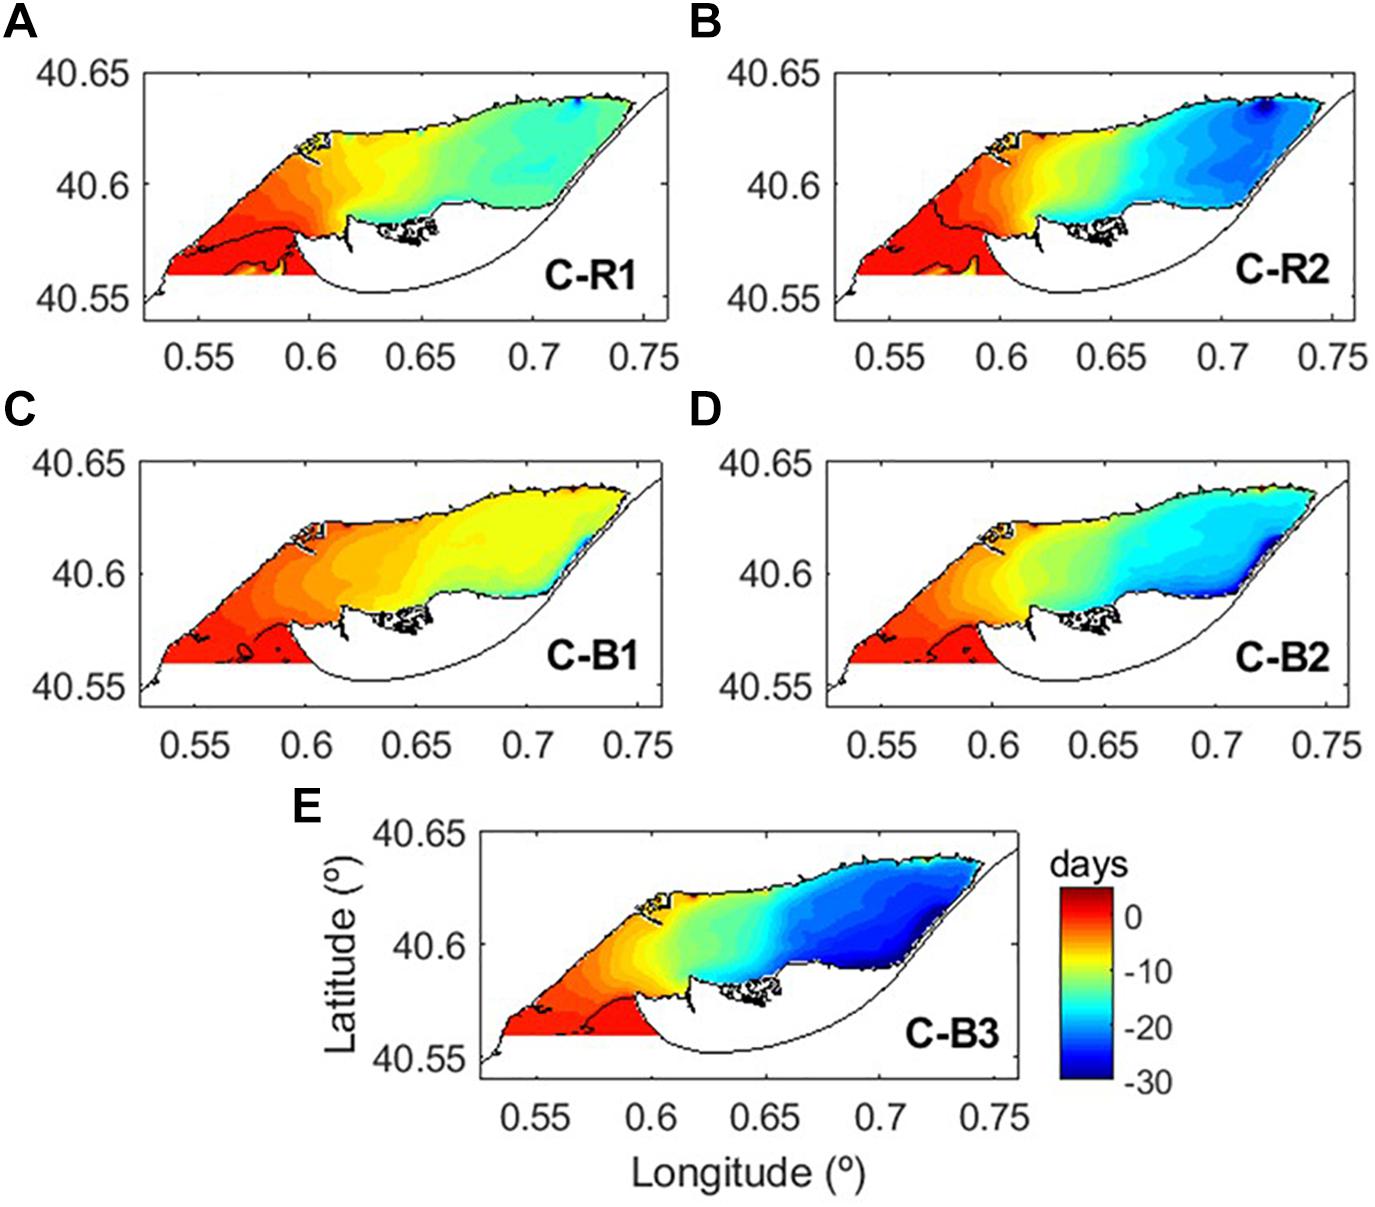
Figure 14. Differences (in days) for bay water renovation, in terms of e-flushing times, when applying different interventions (all based on natural bay functioning) to the Southern Ebro Delta bay, a microtidal environment in the NW Mediterranean. All plots depict the control run (without any intervention) minus the run with intervention, which can be of three types: (1) pulsed land discharges with different discharge rates, named R1for low and R2 for high flow discharges (A,B); (2) transient connections to open sea with beach breaching of different widths, named B1 for narrow, B2 for medium and B3 for wide breaching (C–E). The color scale indicates the variation in renovation times (in days), where negative/positive values indicate shorter/longer e-flushing times due to the intervention (compared to the control simulation).
Renewable wind energy exploitation will benefit from wind resource maps, as the ones here produced for European seas using SAR wind fields (from 2002 to present) and ASCAT wind fields (covering 2017 and 2018). These maps are available at different levels above the sea surface (from 10 to 150 m) and have been updated periodically to include the latest S1 data, for a CMEMS integration accompanied by good practice criteria for downscaling and subsequent elaboration. This elaboration includes a probabilistic analysis for relevant parameters to map uncertainties with a spatial resolution of 0.02°. The results have served to develop an extreme wind and wave atlas for the pilot sites, based on the modeling of a statistically significant number of storms (more than 1000), and simulated using the advanced CEASELESS parameterizations. Error estimations have been based on triple collocation for fields such as waves, using S3 altimeter wave height measurements, to assess systematic and stochastic errors (Schulz-Stellenfleth and Staneva, 2019). The assessment comes from a comparison that takes into account how in-situ data can be affected by measurement errors. Separating error contributions from in-situ or satellite data is in general not possible, unless numerical simulations are introduced into the analysis. Satellite and numerical model data are assumed to be affected by calibration errors, while all three data sources are considered to be affected by stochastic errors, taken as independent and additive components. The in-situ data are taken as a reference, in the sense that no biases or calibration errors are considered. The assumption of stochastic error independence could be violated if the three data sources present different spatial resolutions, as is usually the case in many coastal applications. The parameter estimation for error distributions is based on the first and second order moments of the input data from the three mentioned sources. The model error, e.g., for significant wave height data, can be formulated as follows (Schulz-Stellenfleth and Staneva, 2019):
Here, HS is the “true” significant wave height, and bS3 and bWAM are possible biases of satellite and model data. Both model and the satellite data may be affected by calibration problems represented by the factors αWAM and αS3. All three data sets have stochastic errors εBuoy, εS3, and εWAM as additive components and these are assumed to be independent. The in-situ measurement is taken as a reference, meaning that no biases or calibration errors are considered (n is sample size):
In this error analysis, the effective resolutions of numerical simulations and altimeter data were very similar, which led to disregarding error correlations. The plotted results, using the altimeter tracks of S3A (Figure 15, top left), show the CMEMS buoy positions (blue diamonds) together with the GTS positions (red triangles). Each track was passed by the satellite about once per month during the analysis period, which was 2018. An illustration of the resulting HS field (AMM15 for 9th December, 2018 at 00:00 UTC) is also shown in the figure (top right). Collocation assumes that: (a) model points are interpolated to the buoy location using linear interpolation; (b) model points are interpolated to the closest altimeter point using linear interpolation; (c) both buoy and model data are interpolated to the satellite overflight time. The comparison between wave height measurements from the Elbe buoy (20 km offshore) with ascending (red) and descending (green) satellite tracks is also shown (Figure 15, bottom) with the bias and calibration corrected values, for both model and S3A data. The smallest stochastic errors correspond to the buoy, and the widespread assumption that satellite passes from land to sea are affected by a stronger noise could not be observed in the analyses. The scatter of estimated values depends, to some degree, on the relatively small sample size, a situation that will improve with time as longer time series from S3A become available.
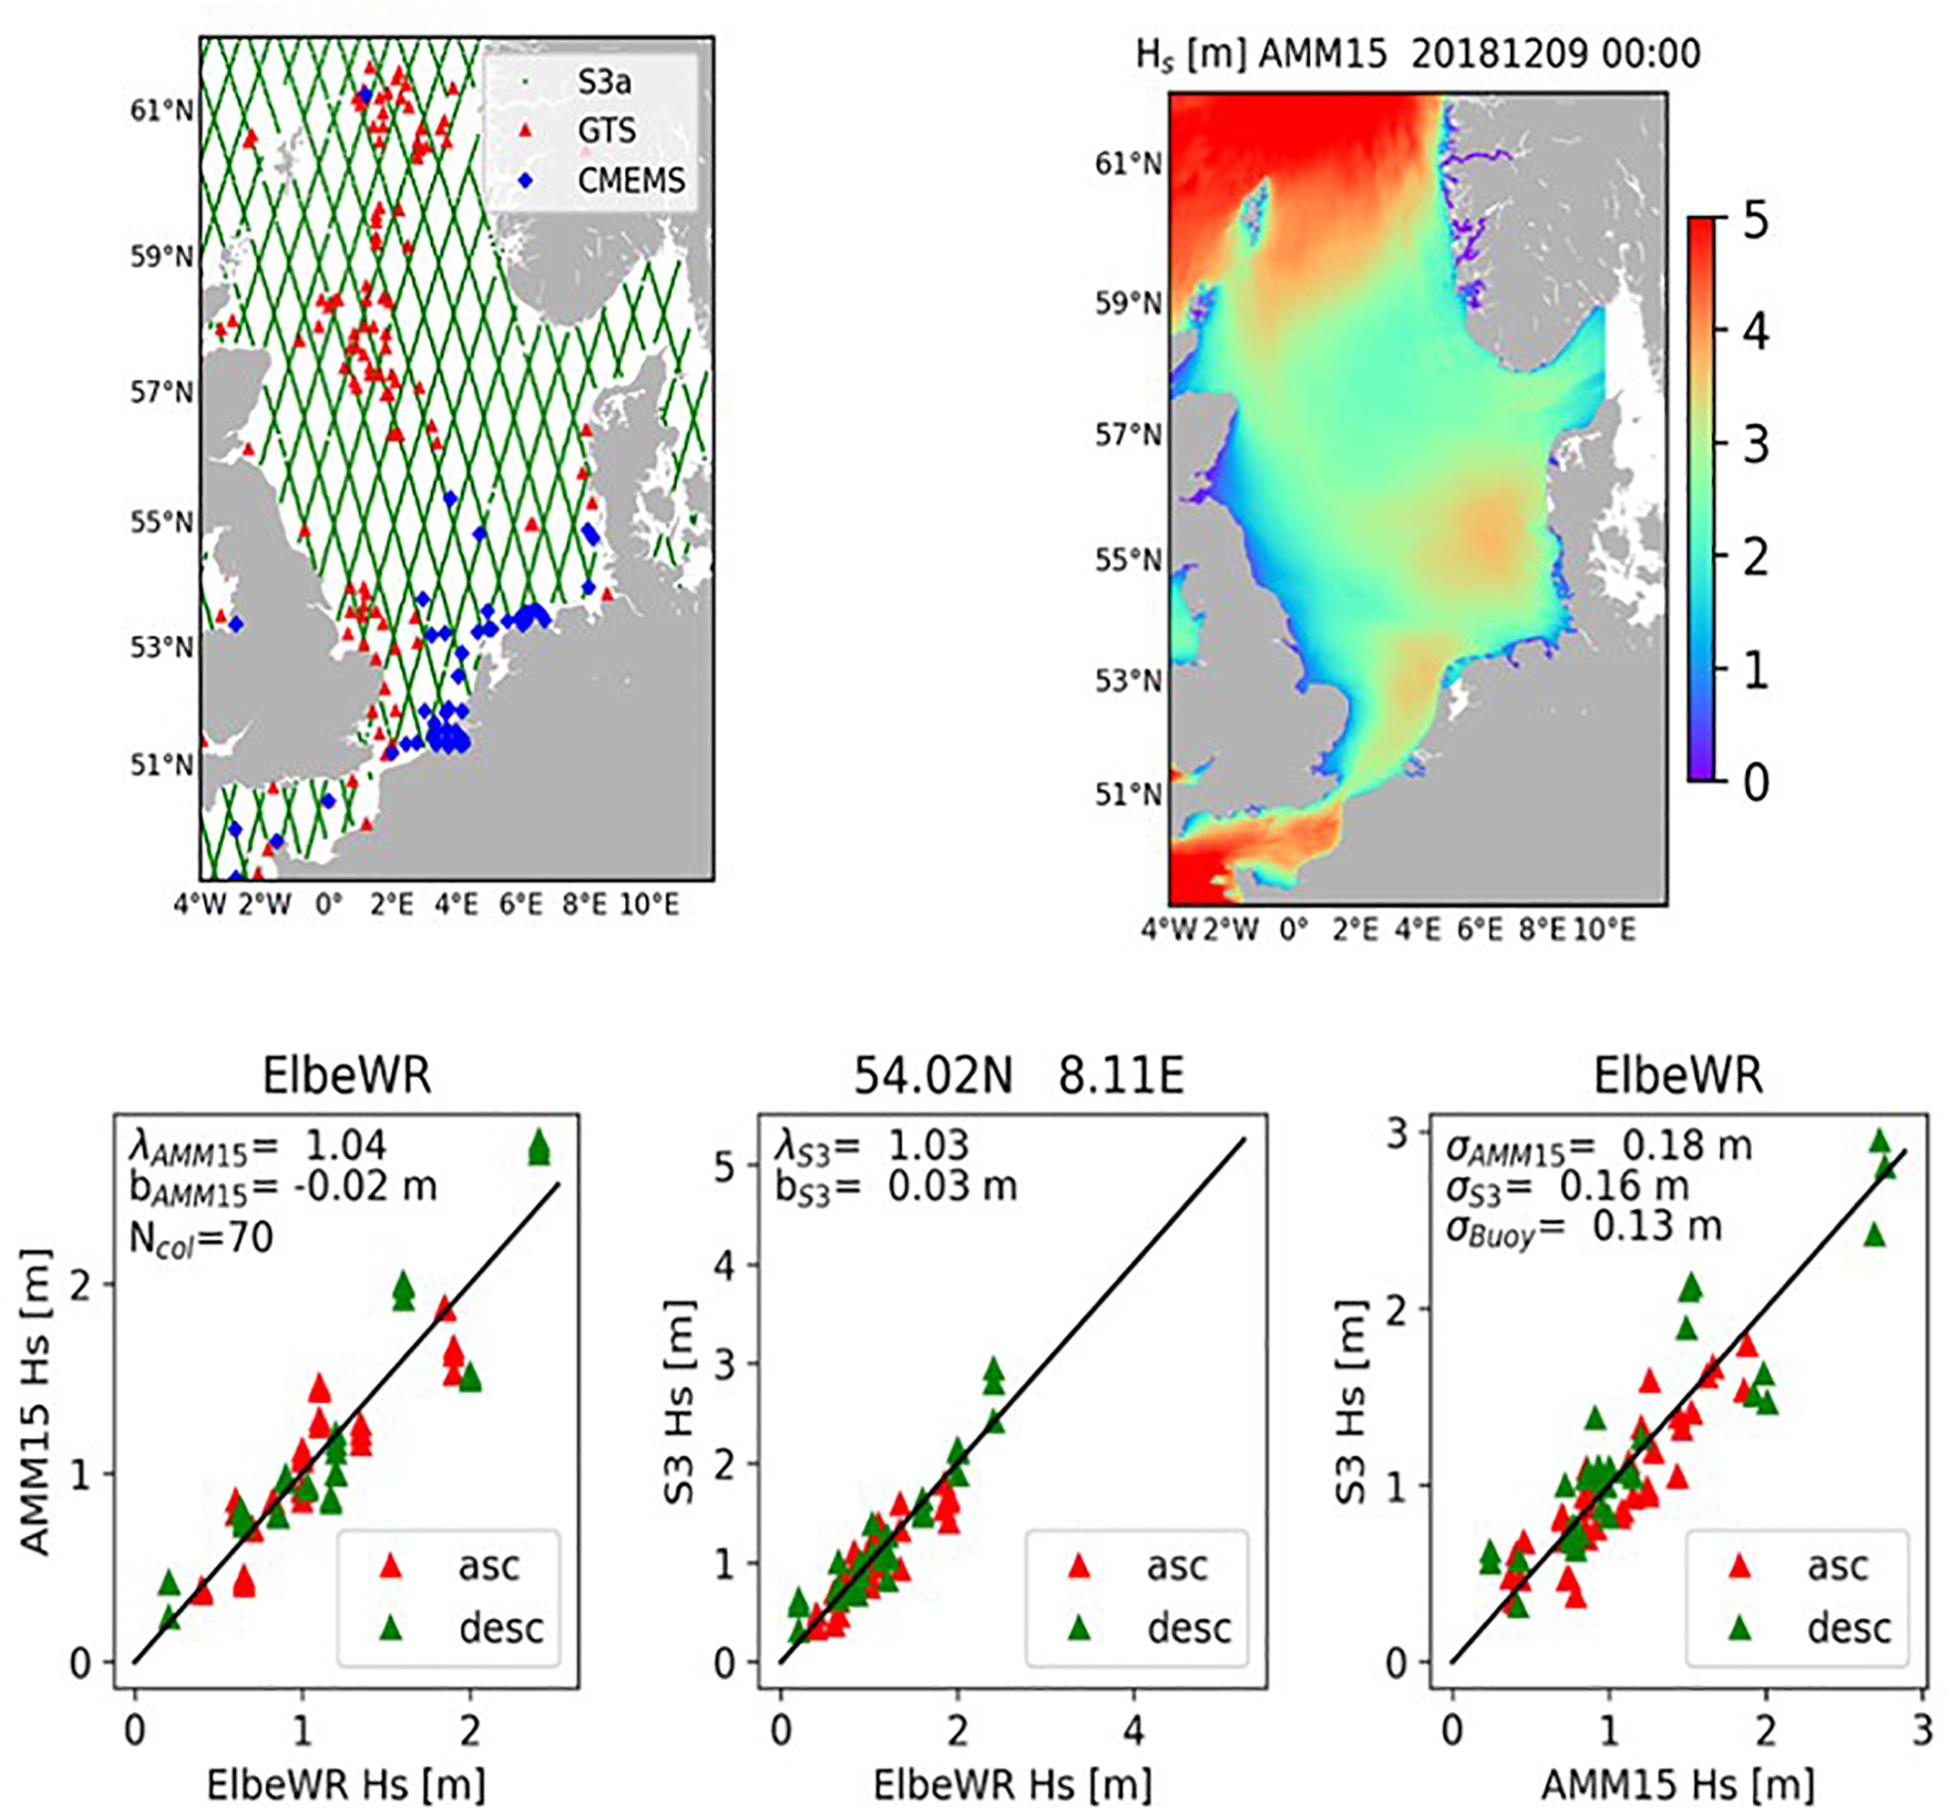
Figure 15. Sentinel-3a tracks together with positions (top left) of CMEMS in-situ wave measurement stations (blue diamonds) and additional GTS wave stations (red triangles), together with an example (top right) of CMEMS AMM17 model HS values for the North Sea pilot case on 10th December, 2018 00:00 UTC. The three bottom panels show a comparison of HS (significant wave height) measured by the Elbe buoy with numerical model results (bottom left), and Sentinel-3A altimeter measurements (bottom centre) for 2018. After correcting model and satellite data with the calibration factors and bias parameters estimated in the triple collocation procedure, the comparison between Sentinel 3 and modeled data shows (bottom right) limited differences for ascending (asc)and descending (desc) satellite passes, represented by red (asc) and green triangles (desc), respectively.
Stochastic errors have been estimated by triple collocation for S3, WAM modeling and buoy data, showing reasonable error levels in all three datasets, with only a few cases exceeding 0.2 m, suitable for many coastal applications. The average errors estimated for simulated fields (WAM), buoy observations (Buoys) and S3 data, considering all the buoy locations in the German Bight, are given by:
Buoy data presents the smallest errors on average, followed by altimeter and model data. Part of the observed scatter, due to the small sample sizes, will be reduced by the expected steady growth of simulated and observed data for coastal areas.
Discussion and Conclusion for a Continued CMEMS Extension Toward the Coast
Copernicus evolution and applications with sentinel enhancements and land effluents for shores and seas has contributed to pave the way for a CMEMS coastal extension that should consider: (a) scientific aspects, such as coastal processes and their parameterization, conditioned by coastal discretization and evolving bathymetry; (b) application requirements, where conflicting stakeholder views and coastal error patterns may limit applicability; (c) social benefits, commonly found in coastal applications but also on coastal early warning with explicit error bars and a transparent procedure, to facilitate the use of numerical predictions for decision making.
These three elements determine the technical, economic and scientific viability of such a CMEMS coastal extension, which will also depend on site- and application-specific characteristics. The North Adriatic pilot case has supported the Venice authority in charge of local tidal forecasts in organizing a workshop for identifying and quantifying the uncertainty of such forecasts. The Catalan coast pilot has promoted the execution of new field campaigns to characterize water quality and bathymetry at two coastal bays, supporting a co-management table that considers improved predictions. The Danish and German pilots have prompted new datasets and industrial applications in renewable energy extraction, aquaculture and search/rescue operations. Operational services such as ECMWF and the Met Office in the United Kingdom have improved the reliability and accuracy of their predictions by ingesting CEASELESS developments in assimilation, ensemble predictions, and coastal error metrics.
By merging in-situ, satellite and high-resolution numerical data, the project has explored synergies among different data sources and strategies for parameter optimization, leading to improved metocean coupled predictions in coastal restricted domains. To comply with stakeholder requirements, these high-resolution predictions should include: (a) cross validation with multiple source measurements; (b) consistent provision of accuracy for all sensors; (c) optimal blending of information from satellite, in-situ and modeled data. However, the low probability of having a satellite overpass coincident with a critical period, such as a storm peak (i.e., right place at the right time) constitutes the main limitation of the CEASELESS methodology, suggesting as an alternative, a posteriori applications of the proposed methodology, using Sentinel data for hindcast verification and improvement of modeling physics.
Calibrating coupled atmospheric-circulation-wave models requires a synergetic merging of satellite data (providing spatial structure for the sea surface) and in-situ observations (providing vertical structure and temporal variation, albeit at a scarce number of points). Subsequent validations, based on different data sets, represent a tough challenge, because of differences in the data resolution and/or accuracy, and in the modeling level, where collocation errors and sub-resolution effects may need to be taken into account. This happens, for instance, in coastal wave modeling, where the errors of in-situ measurements (e.g., wave buoys) can no longer be ignored in validation studies. The variety of field instruments nowadays available, with different observation characteristics, require multi-collocation methods to monitor errors in RS, in-situ and modeled datasets. This type of method has been used here to identify both systematic and stochastic errors, where monitoring the performance of model and instruments on a continuous basis would be required, based on common standards and documented analyses. Such a methodological approach will increase the effectiveness for research, practical applications and operational/data products. The scatter introduced by the relatively small size of in-situ samples and the large spatial coverage of satellite observations, albeit at a low frequency of revisit times, needs an adaptive quality control, avoiding present limitations (in knowledge/data) that hamper further coastal applications, particularly for coastal geometries.
The coupled approach, new parameterizations and assimilation developed in CEASELESS have enhanced the capabilities of state-of-the-art models (e.g., WAM, WAVEWATCH, SWAN, NEMO, or ROMS) and the scientific and practical performance of regional data assimilation. This underpins the potential of a CMEMS coastal extension, based on anisotropic errors, memory limits and derived (stakeholder-oriented) variables from coupled simulations. Although the coastal system memory is comparatively short, the project has demonstrated how to make the most of CMEMS products for limited domain size assimilation. The main applications proposed consist of rapidly cycling short-range forecasts (such as nowcasts) or reanalysis products. The assimilation for two-way coupled circulation-wave models should include the proposed approach for data assimilation, as illustrated by the NEMOVAR software for assimilation (Saulter et al., 2020), enabling a smooth operational integration of data assimilation in coastal oceanography. Such a development could take place as part of a CMEMS service extension, illustrating how coastal forecasting systems can deliver improved analyses and short-range forecasts based on CMEMS.
Regarding future work, CEASELESS has identified the need of upgrading data assimilation by covering an enhanced range of variables, such as wave height, period and direction for wave fields, or the 3D structure for circulation fields. The incorporation of new retrackers (e.g., SAMOSA++, Dinardo et al., 2020; Fenoglio et al., 2021) can provide a much-needed seamless coverage between offshore and coastal domains (Roohi et al., 2019), avoiding the conventional cut-off of exploitable data at about 30 to 40 km from the coast and bringing it down to shorter distances (below 10 km). CEASELESS work has determined that, when starting at 5 km from the coast and moving offshore, the error decreases steadily in both satellite and model data, based on advanced state-of-art codes suitably calibrated for the domain geometry and metocean conditions. These models and post-processing routines should combine all relevant coastal processes for each application, enhancing the application field of coastal predictions, illustrated by wave-current interactions and wave-induced turbulence that can play a key role for modulating coastal surges and thus affect the application of these products to manage coastal risks.
The growing availability of new RS data, suitable for correcting an increased range of variables (e.g., CFOSAT for wave periods) and the combination of high-resolution deterministic models with coarser ensemble models, will serve to spin-up predictive and data assimilation capabilities near the coast. These advances should push forward coastal applications, like those explored in CEASELESS (the metocean on-demand portal is just an example) and for more L2 oceanographic coastal products. Although new satellites may provide better directional wave information (e.g., CFOSAT when compared to SAR images), the minimum wavelength should be considered near the land boundary, where for CFOSAT it is about 60 m wave length, which may limit the applications for Mediterranean wave fields, with modal periods clearly below 10 s.
The increasing wealth of coastal observations/simulations will require, from an application perspective, on-demand and easy accessibility to the data. The challenge of bringing modeling, in situ and satellite data into coastal activities must be supported by a deep knowledge of stakeholder demands, regarding data quality and resolution. This, in turn, needs technical competence and building trust against other industry standards. From here, CMEMS-based products are expected to progressively enter into coastal decision-making procedures, providing an answer to coastal societal challenges in a wide range of new digital services integrating metocean data. Such an evolution will reinforce the position of the Copernicus Marine Service as a pan-EU core service, with coastal applications, as proposed in CEASELESS, based on a clear co-delineation and co-development with downstream coastal systems (e.g., operated by local actors or member state institutes). Flexible data access is critical, as proved by CEASELESS applications, so that an efficient interaction with stakeholders is achieved to ingest (interoperable) data within optimized workflows. This development is well illustrated through the MOOD O&M (MetOcean-On-Demand Operation & Maintenance) application in the CEASELESS pilot case at the Danish Coast (Figure 2). This new decision support tool exploits the more accurate and validated CEASELESS results to provide better planning advice for the operation and maintenance (O&M) of offshore windfarms. To maximize the effectiveness and efficiency of offshore wind O&M plans, downscaled metocean conditions with variables tailored to infer vessel motions directly, can provide two key decision inputs for O&M applications: (a) safety of technician transfer from support vessels to the offshore wind turbine; (b) motions experienced during the trip, which can result in seasickness of the technicians when arriving to the offshore wind turbine. Here, CEASELESS has demonstrated how an advanced prediction of weather windows for port to offshore wind farm trips, can result in improved O&M and lower risk levels, particularly when supported by a user interface co-created with major stakeholders.
More research is needed for new parameters, depending on the application, but illustrated by salinity, wave steepness or surface currents, subject to coastal zone gradients, and relevant for water quality and socio-economic activities. The same applies to S2 derived bathymetry (SDB) and shoreline dynamics, where the fusion of SDB with existing datasets (for instance, EMODnet) will become an important topic in coastal areas, dynamically evolving at multiple scales and affecting hydrodynamic simulations. This suggests combining SDB with submerged LIDAR images to assist modeling and downscaling by suitable routines, promoting a wider uptake of unstructured mesh applications and local validation. These achievements need to be supported by automated workflows and multitenant collaboration, leading to a sustained coastal extension, with improved skill scores for original variables (wind velocity, wave height, etc.) but also for derived variables such as particle transport or renovation times. Here, the project results have shown that improvements in skill score may reach values close to 0.9, significantly advancing present performance for off-line and on-line products.
Large data sets and high-resolution coupling will demand increasing computing capacity, suggesting a change in approach, for which cloud-based solutions have been explored for scalability, in terms of computing processing power. These alternatives in computational approach will become more relevant for complex and high-resolution applications, where coastal bathymetry and shoreline contours may evolve at short time scales (e.g., under an energetic storm event). The updating of topo-bathymetric information will play a more critical role in dynamic shallow water coastal domains, where there is also a higher number of assets and simultaneous applications. These requirements will contribute to designing of next generation cloud-based data infrastructure, as a platform for developing services reaching a wider variety of stakeholders. As an example, the technology of the CEASELESS database has been developed to be accessible through an application programming interface, while the next version of the database technology is emerging as Microsoft AZURE cloud service. Such enhanced interoperability (e.g., of short-term forecasts) plus their efficient storage and archiving, will facilitate the development of longer-term data-bases, suitable for climate and other longer term applications.
Although much remains to be done before a full coastal characterization can become operational, the project work has demonstrated how CMEMS, in general, and Sentinel data in particular, have a promising potential for coastal applications when combined with in-situ observations and high resolution coupled simulations. Error estimates will improve with the availability of a larger number of independent datasets, and this will benefit many applications via data assimilation with new error metrics using triple colocation. The observed gradients in shallow waters presented larger variance and error bars than those for offshore predictions, attributed to the complicated generation/dissipation and non-linear interaction processes in coastal areas. The availability of data sources complementary to CMEMS is considered to be a good basis for further optimizing data processing, modeling tools and multi-variable error assessments. Here, the integration of satellite and in-situ data with numerical models should lead to more reliable local and regional fields of metocean variables, enhancing multiple services to coastal stakeholders that incorporate all relevant coastal processes in forecasting and analysis. Such advances will further bound error levels in most coastal applications, complying with present stakeholder requirements and underpinning the CMEMS extension toward the coast.
Data Availability Statement
The data produced by the authors supporting the paper results and conclusions can be made available upon request without other reservations than those applicable at each of the participating institutions.
Author Contributions
AS-A coordinated the approach and its aggregation. JS, JS-S, and AW developed the German Bight research. LC, MMM, DB, PP, SC, and AT developed the North Adriatic research. MB, JTS, LH, XL, and RB developed the Danish Coast research. ME, MM, and AS-A developed the Catalan Coast research. JB, AS, and SA developed the North Sea research while the retrieval of satellite data was investigated by AM plus other members of the list, and the cross-comparisons and analyses, together with the work required by the applications, were performed by various members of the team. All authors contributed to the article and approved the submitted version.
Funding
The work of UPC team included in this paper has been funded by the Ecosistema-BC Spanish Research Project (CTM2017-84275-R/MICINN-AEI-FEDER,UE) of the 2017 RETOS State Research Program.
Conflict of Interest
JTS and RB were employed by the non-profit research company DHI.
The remaining authors declare that the research was conducted in the absence of any commercial or financial relationships that could be construed as a potential conflict of interest.
Acknowledgments
The authors want to acknowledge the European Union’s H2020 Programme for Research, Technological Development and Demonstration under grant agreement no. H2020-EO-2016-730030-CEASELESS and the Ecosistema-BC Spanish Research Project (CTM2017-84275-R/MICINN-AEI-FEDER,UE) of the 2017 RETOS State Research Program.
Abbreviations
ABM, agent based model; ADCP, acoustic doppler current profiler; AMM7, 15 Atlantic margin model, at 7 1.5 km resolution; CCLM, COSMO (Consortium for Small Scale Modelling) model in climate mode; CEASELESS, copernicus evolution and applications with sentinel enhancements and land effluents for shores and seas; CFOSAT, Chinese-French Oceanography Satellite; CFSR, climate forecast system reanalysis; CMEMS, copernicus marine environmental monitoring system; COAWST, coupled-ocean-atmosphere-wave-sediment transport modeling system; ECMWF, European centre for medium-range weather forecasts; ERA 5, ECMWF re-analysis 5; GCOAST, Geesthacht Coupled cOAstal model SysTem; HFR, high frequency radar; HR, high resolution; L2, remote sensing level-2 products, geo-located geophysical products derived from level-1; LAPS, local analysis and prediction system; LIDAR, light detection and ranging; NEMO, nucleus for european modeling of the ocean; ROMS, regional ocean modeling system; RS, remote sensing; RVL, radial velocity; S1/S2/S3/S3A, Sentinel 1/Sentinel 2/Sentinel 3/Sentinel 3A; SAR, synthetic aperture radar; SCHISM, Semi-implicit Cross-scale Hydroscience Integrated System Model; SST, sea surface temperature; SWAN, simulating waves nearshore; WAM, wave model; WRF, weather research and forecasting model.
References
Abdalla, S., and Janssen, P. A. E. M. (2017). “Monitoring waves and surface winds by satellite altimetry; applications,” in Satellite Altimetry over Oceans and Land Surfaces, eds D. Stammer and A. Cazenave (Boca Raton, FL: CRC Press), 379–424.
Belyaev, K. P., Kuleshov, A. A., Smirnov, I. N., and Tanajura, C. A. S. (2019). Comparison of data assimilation methods in hydrodynamics ocean circulation models. Math. Mod. Comput. Simul. 11, 564–574. doi: 10.1134/S2070048219040045
Bolaños, R., Boye Hansen, L., Rasmussen, M. L., Golestani, M., Sandvig, J., Lisbeth, L., et al. (2018). Coastal bathymetry from satellite and its use on coastal modelling. Coast. Eng. Proc. 1:98. doi: 10.9753/icce.v36.papers.98
Bonaldo, D., Orliæ, M., and Carniel, S. (2018). Framing continental shelf waves in the southern adriatic sea, a further flushing factor beyond dense water cascading. Sci. Rep. 8:660. doi: 10.1038/s41598-017-18853-2
Breivik, Ø., Mogensen, K., Bidlot, J.-R., Balmaseda, M. A., and Janssen, P. A. E. M. (2015). Surface wave effects in the NEMO ocean model: forced and coupled experiments. J. Geophys. Res. Oceans 120, 2973–2992. doi: 10.1002/2014JC010565
Caballero, A., Mulet, S., Ayoub, N. K., Manso-Narvarte, I., Davila, X., Boone, C., et al. (2020). Integration of HF radar observations for an enhanced coastal Mean Dynamic Topography. Front. Mar. Sci. 24:588713. doi: 10.3389/fmars.2020.588713
Campos, Á, García-Valdecasas, J. M., Molina, R., Castillo, C., Álvarez-Fanjul, E., and Staneva, J. (2019). Addressing long-term operational risk management in port docks under climate change scenarios – a spanish case study. Water 11:2153. doi: 10.3390/w11102153
Carniel, S., Benetazzo, A., Bergamasco, A., Boldrin, A., Bonaldo, D., Falcieri, F. M., et al. (2016). Off-shelf fluxes across the Southern Adriatic Margin: forcing factors controlling dense water-driven transport phenomena. Mar. Geol. 375, 44–63. doi: 10.1016/j.margeo.2015.08.016
Cavaleri, L., Bajo, M., Barbariol, F., Bastianini, M., Benetazzo, A., Bertotti, L., et al. (2019a). The October 29, 2018 storm in Northern Italy – An exceptional event and its modeling. Prog. Oceanogr. 178:102178. doi: 10.1016/j.pocean.2019.102178
Cavaleri, L., Bajo, M., Barbariol, F., Bastianini, M., Benetazzo, A., Bertotti, L., et al. (2020). The 2019 flooding of venice and its implications for future predictions. Oceanography 33, 42–49. doi: 10.5670/oceanog.2020.105
Cavaleri, L., and Bertotti, L. (2004). Accuracy of the modelled wind and wave fields in enclosed seas. Tellus 56A, 167–175. doi: 10.1111/j.1600-0870.2004.00042.x
Cavaleri, L., Bertotti, L., and Pezzutto, P. (2019b). Accuracy of altimeter data in inner and coastal seas. Ocean Sci. 15, 227–233. doi: 10.5194/os-15-227-2019
Cerralbo, P., Pedrera, F. M., Mestres, M., Fernandez, M., Espino, M., Grifoll, M., et al. (2019). Use of a hydrodynamic model for the management of water renovation in a coastal system. Ocean Sci. 15, 1–12. doi: 10.5194/os-15-1-2019
Davolio, S., Mastrangelo, D., Miglietta, M. M., Drofa, O., Buzzi, A., and Malguzzi, P. (2009). High resolution simulations of a flash flood near Venice. Nat. Hazar. Earth Syst. Sci. 9, 1671–1678. doi: 10.5194/nhess-9-1671-2009
De Mey-Frémaux, P., Ayoub, N., Barth, A., Brewin, R., Charria, G., Campuzano, F., et al. (2019). Model-observations synergy in the Coastal Ocean. Front. Mar. Sci. 6:436. doi: 10.3389/fmars.2019.00436
Desamsetti, S., Dasari, H. P., Langodan, S., Titi, E. S., Knio, O., and Hoteit, I. (2019). Efficient dynamical downscaling of general circulation models using continuous data assimilation. Q. J. R. Meteorol. Soc., eds John Wiley & Sons, Ltd., 145, 3175–3194. doi: 10.1002/qj.3612
Dinardo, S., Fenoglio-Marc, L., Becker, M., Scharroo, R., Fernandes, M. J., Staneva, J., et al. (2020). A RIP-based SAR retracker and its application in north East Atlantic with sentinel-3. Adv. Space Res. 273–1177. doi: 10.1016/j.asr.2020.06.004
Drennan, W. M., Graber, H. C., Hauser, D., and Quentin, C. (2003). On the wave age dependence of wind stress over pure wind seas. J. Geophys. Res. 108:8062. doi: 10.1029/2000JC000715
Du, J. (2017). Coupling Atmospheric and Ocean Wave Models for Storm Simulation. Ph.D. thesis, Technical University of Denmark, Lyngby. doi: 10.11581/DTU:00000020
Du, J., Bolaños, R., and Larsén, X. (2017). The use of a wave boundary layer model in SWAN. J. Geophys. Res. 122, 42–62. doi: 10.1002/2016JC012104
Du, J., Bolanos, R., Larsén, X., and Kelly, M. (2019). Wave boundary layer in SWAN revisited. Ocean Sci. 15, 361–377. doi: 10.5194/os-15-361-2019
Ebert, E. E. (2009). Neighborhood verification: a strategy for rewarding close forecasts. Weather Forecast. 24, 1498–1510. doi: 10.1175/2009WAF2222251.1
ECMWF (2019). “Official IFS documentation CY46R1,” in chap. PART VII: ECMWF Wave Model. Reading, UK: ECMWF. Available online at: https://www.ecmwf.int/node/19311
Fan, Y., Lin, S., Held, I. M., Yu, Z., and Tolman, H. L. (2012). Global ocean surface wave simulation using a coupled atmosphere-wave model. J. Clim. 25, 6233–6252. doi: 10.1175/jcli-d-11-00621.1
Feng, X., and Shinoda, T. (2019). Air-sea heat flux variability in the southeast indian ocean and its relation with ningaloo niño. Front. Mar. Sci. 6:266. doi: 10.3389/fmars.2019.00266
Fenoglio, L., Dinardo, S., Uebbing, B., Buchhaupt, C., Gärtner, M., Staneva, J., et al. (2021). Advances in NE-atlantic coastal sea level change monitoring by Delay Doppler altimetry. Adv. Space. Res. doi: 10.1016/j.asr.2020.10.041
Garcia Sotillo, M., Cerralbo, P., Lorente, P., Grifoll, M., Espino, M., Sanchez-Arcilla, A., et al. (2020). Coastal ocean forecasting in Spanish ports: the SAMOA operational service. J. Operat. Oceanogr. 13, 37–54. doi: 10.1080/1755876X.2019.1606765
Grifoll, M., Aretxabaleta, A., Pelegrí, J. L., and Espino, M. (2016). Shifting momentum balance and frictional adjustment observed over the inner-shelf during a storm. Ocean Sci. 12, 137–151. doi: 10.5194/osd-12-897-2015
Grifoll, M., Cerralbo, P., Guillen, J., Espino, M., Hansen, L. B., and Sanchez-Arcilla, A. (2019). Characterization of bottom sediment resuspension events observed in a micro-tidal bay. Ocean Sci. 15, 307–319. doi: 10.5194/os-15-307-2019
Gustafsson, N., Janjiæ, T., Schraff, C., Leuenberger, D., Weissmann, M., Reich, H., et al. (2018). Survey of data assimilation methods for convective-scale numerical weather prediction at operational centres. Quart. J. Roy. Meteor. Soc. 144, 1218–1256. doi: 10.1002/qj.3179
Haid, V., Stanev, E. V., Pein, J., Staneva, J., and Chen, W. (2020). Secondary circulation in shallow ocean straits: observations and numerical modeling of the Danish Straits. Ocean Model. 148:101585. doi: 10.1016/j.ocemod.2020.101585
Hersbach, H. (2000). Decomposition of the continuous ranked probability score for ensemble prediction systems. Weather Forecast. 15, 559–570. doi: 10.1175/1520-04342000015<0559:DOTCRP<2.0.CO;2
Huber, M. B., and Zanna, L. (2017). Drivers of uncertainty in simulated ocean circulation and heat uptake. Geophys. Res. Lett. 44:71587. doi: 10.1002/2016GL071587
Janssen, P. A. E. M. (1991). Quasi-linear theory of wind generation applied to wave forecasting. J. Phys. Oceanogr. 21, 1631–1642. doi: 10.1175/1520-0485(1991)021<1631:qltoww>2.0.co;2
Komen, G. J., Hasselmann, S., and Hasselmann, K. (1984). On the Existence of a fully developed wind-sea spectrum. J. Phys. Oceanogr. 14, 1271–1285. doi: 10.1175/1520-0485
Larsén, X., Du, J., Bolanos, R., and Larsen, S. (2017). On the impact of wind on development of wave field during storm Britta. Ocean Dynam. 67, 1407–1427. doi: 10.1007/s10236-017-1100-1
Lewis, H. W., Castillo Sanchez, J. M., Siddorn, J., King, R. R., Tonani, M., Saulter, A., et al. (2019). Can wave coupling improve operational regional ocean forecasts for the north-west European Shelf? Ocean Sci. 15, 669–690. doi: 10.5194/os-15-669-2019
Li, D., Staneva, J., Bidlot, J. -R., Grayek, S., Zhu, Y., and Yin, B. (2021). Improving regional model skills during typhoon events: a case study for super typhoon lingling overthe northwest Pacific Ocean. Front. Mar. Sci. 8:613913. doi: 10.3389/fmars.2021.613913
Li, J.-G. (2011). Global transport on a spherical multiple-cell grid. Month. Weather Rev. 139, 1536–1555. doi: 10.1175/2010mwr3196.1
Li, J.-G. (2012). Propagation of ocean surface waves on a spherical multiple-cell grid. J. Comput. Phys. 231, 8262–8277. doi: 10.1016/j.jcp.2012.08.007
Lin-Ye, J., García-León, M., Gràcia, V., Ortego, M. I., Lionello, P., Conte, D., et al. (2020). Modeling of future extreme storm surges at the NW mediterranean coast (Spain). Water 12:472. doi: 10.3390/w12020472
Lionello, P., Günther, H., and Janssen, P. A. E. M. (1992). Assimilation of altimeter data in a global third-generation wave model. J. Geophys. Res. 97, 14453–14474. doi: 10.1029/92JC01055
Mallick, S., Agarwal, K., Sharma, N., and Prasad, K. V. S. R. (2018). Sensitivity of upper ocean dynamics in high resolution tropical Indian ocean model to different flux parameterizations. Int. Arch. Photogramm. XLII, 839–847. doi: 10.5194/isprs-archives-XLII-5-839-2018
Marra, A. C., Federico, S., Montopoli, M., Avolio, E., Baldini, L., Casella, D., et al. (2019). The Precipitation structure of the mediterranean tropical-like cyclone numa: analysis of GPM observations and numerical weather prediction model simulations. Remote Sens. 11:1690. doi: 10.3390/rs11141690
McGinley, J. A., Albers, S. C., and Stamus, P. A. (1992). Local data assimilation and analysis for nowcasting. Adv. Space Res. 12, 179–188. doi: 10.1016/0273-1177(92)90215-j
Mestres, M., Pein, J., Espino, M., Schultz-Stellenfleth, J., Hansen, L. B., Staneva, J., et al. (2020). “CURAE – Bridging the gap between regional CMEMS forecasts and coastal high-resolution applications,” in Proceedings of the 22nd EGU General Assembly EGU General Assembly, (Vienna: Conference Abstracts), 7234.
Miglietta, M. M., and Rotunno, R. (2019). Development mechanism of Mediterranean tropical-like cyclones (Medicanes). Q. J. Roy. Meteor. Soc. 145, 1444–1460. doi: 10.1002/qj.3503
Moore, P., Birkinshawa, S. J., Ambrózio, A., Restano, M., and Benveniste, J. (2018). CryoSat-2 Full Bit Rate Level 1A processing and validation for inland water applications. Adv. Space Res. 62, 1497–1515. doi: 10.1016/j.asr.2017.12.015
Oost, W. A., Komen, G. J., Jacobs, C. M. J., and Van Oort, C. (2002). New evidence for a relation be- tween wind stress and wave age from measurements during ASGAMAGE. Bound. Layer Meteorol. 103, 409–438. doi: 10.1023/a:1014913624535
Ràfols, L., Grifoll, M., and Espino, M. (2019). Wave–current interactions in a wind-jet region. Ocean Sci. 15, 1–20. doi: 10.5194/os-15-1-2019
Renault, L., McWilliams, J. C., and Masson, S. (2017). Satellite observations of imprint of oceanic current on wind stress by air-Sea coupling. Sci. Rep. 7:17747. doi: 10.1038/s41598-017-17939-1
Ricchi, A., Bonaldo, D., Cioni, G., Miglietta, M. M., and Carniel, S. (2018). On the use of high resolution atmosphere-ocean-wave coupled model to describe a flash-flood event over the North-East Italy. EGU Gen. Assem. Conf. Abstr. 20:1278.
Ricchi, A., Miglietta, M. M., Barbariol, F., Benetazzo, A., Bergamasco, A., Bonaldo, D., et al. (2017). Sensitivity of a Mediterranean tropical-like Cyclone to different model configurations and coupling strategies. Atmosphere 8, 92. doi: 10.3390/atmos8050092
Ricchi, A., Miglietta, M. M., Bonaldo, D., Cioni, G., Rizza, U., and Carniel, S. (2019). Multi-physics ensemble versus atmosphere – ocean coupled model simulations for a tropical-like cyclone in the Mediterranean Sea. Atmosphere 10:202. doi: 10.3390/atmos10040202
Roohi, S. h., Sneeuw, N., Benveniste, J., Dinardo, S., Issawy, E. A., and Zhang, G. (2019). Evaluation of CryoSat-2 water level derived from different retracking scenarios over inland water bodies. Adv. Space Res. (in press). doi: 10.1016/j.asr.2019.06.024
Rulent, J., Mir Calafat, F., Banks, C. J., Bricheno, L., Gommenginger, C., Green, M., et al. (2020). Comparing water level estimation in coastal and shelf seas from satellite altimetry and numerical models. FMAS Spec. 7:549467.
Sakamoto, K., Tsujino, H., Nakano, H., Urakawa, S., Toyoda, T., Hirose, N., et al. (2019). Development of a 2-km resolution ocean model covering the coastal seas around Japan for operational application. Ocean Dynam. 69, 1181–1202. doi: 10.1007/s10236-019-01291-1
Sánchez-Arcilla, A., Lin-Ye, J., García-León, M., Gràcia, V., and Pallarès, E. (2019). The land–sea coastal border: a quantitative definition by considering the wind and wave conditions in a wave-dominated, micro-tidal environment. Ocean Sci. 15, 113–126. doi: 10.5194/os-15-113-2019
Saulter, A., Bunney, C., King, R., and Waters, J. (2020). An application of NEMOVAR for regional wave model data assimilation. Front. Mar. Sci. 7:579834. doi: 10.3389/fmars.2020.579834
Schloen, J., Stanev, E. V., and Grashorn, S. (2017). Wave-current interactions in the southern North Sea: the impact on salinity. Ocean Model. 111, 19–37. doi: 10.1016/j.ocemod.2017.01.003
Schulz-Stellenfleth, J., and Staneva, J. (2019). A multi-collocation method for coastal zone observations with applications to Sentinel-3A altimeter wave height data. Ocean Sci. 15, 249–268. doi: 10.5194/os-15-249-2019
Skamarock, W. C., Klemp, J. B., Dudhia, J., Gill, D. O., Barker, D. M., Duda, M., et al. (2008). A Description of the Advanced Research WRF Version 3. NCAR/TN-475+STR. Boulder, CO: NCAR, 113.
Soomets, T., Uudeberg, K., Jakovels, D., Brauns, A., Zagars, M., and Kutser, T. (2020). Validation and comparison of water quality products in baltic lakes using sentinel-2 MSI and sentinel-3 OLCI Data. Sensors 2020:742. doi: 10.3390/s20030742
Stanev, E., Schulz-Stellenfleth, J., Staneva, J., Grayek, S., Grashorn, S., Behrens, A., et al. (2016). Ocean forecasting for the German Bight: from regional to coastal scales. Ocean Sci. 12, 2016.
Stanev, E. V., Badewien, T. H., Freund, H., Grayek, S., Hahner, F., Meyerjürgens, J., et al. (2019a). Extreme westward surface drift in the north sea: public reports of stranded drifters and lagrangian tracking. Cont. Shelf Res. 177, 24–32. doi: 10.1016/j.csr.2019.03.003
Stanev, E. V., Jacob, B., and Pein, J. (2019b). German Bight estuaries: an inter-comparison on the basis of numerical modeling. Continen. Shelf Res. 174, 48–65. doi: 10.1016/j.csr.2019.01.001
Staneva, J., Alari, V., Breivik, O., Bidlot, J.-R., and Mogensen, K. (2017). Effects of wave-induced forcing on a circulation model of the North Sea. Ocean Dynam. 67, 81–191. doi: 10.1007/s10236-016-1009-0
Staneva, J., Behrens, A., Gayer, G., and Aouf, L. (2019). “Chapter 3.3: Synergy between CMEMS products and newly available data from SENTINEL,” in Copernicus Marine Service Ocean State Report, ed. K. Schuckmann et al. doi: 10.1080/1755876X.2019.1633075
Staneva, J., Behrens, A., Ricker, M., Krüger, O., Wiesse, A., Carrasco, R., et al. (2018a). “Particle transport model sensitivity on wave-induced processes in the forecasting, coupled model system, Operational Oceanography serving Sustainable Marine Development,” in Proceedings of the Eight EuroGOOS International Conference, eds E. Buch, V. Fernández, D. Eparkhina, P. Gorringe, and G. Nolan (Bergen: EuroGOOS), 516.
Staneva, J., Behrens, A., and Wahle, K. (2015). Wave modelling for the German Bight coastal-ocean predicting system. J. Phys. Conf. Ser. 633, 233–254.
Staneva, J., Grayek, S., Behrens, A., and Günther, H. (2021). GCOAST: skill assessments of coupling wave and circulation models (NEMO-WAM). J. Phys. Conf. Ser. 1730:012071. doi: 10.1088/1742-6596/1730/1/012071
Staneva, J., Schrum, C., Behrens, A., Grayek, S., Ho-Hagemann, H., Alari, V., et al. (2018b). “A north sea-baltic Sea regional coupled models: atmosphere, wind waves and ocean,” in Proceedings of the Eight EuroGOOS International Conference, eds E. Buch, V. Fernández, D. Eparkhina, P. Gorringe, and G. Nolan (Bergen: EuroGOOS), 223–233.
Staneva, J., Wahle, K., Koch, W., Behrens, A., Fenoglio-Marc, L., and Stanev, E. (2016). Coastal flooding: impact of waves on storm surge during extremes – a case study for the German Bight. Nat. Hazards Earth Syst. Sci. 16, 2373–2389. doi: 10.5194/nhess-16-2373-2016
Taylor, P., and Yelland, M. J. (2001). The dependence of sea surface roughness on the height and steepness of the waves. J. Phys. Oceanogr. 31, 572–590. doi: 10.1175/1520-0485(2001)031<0572:tdossr>2.0.co;2
Tiesi, A., Miglietta, M. M., Conte, D., Drofa, O., Davolio, S., Malguzzi, P., et al. (2016). Heavy rain forecasting by model initialization: a case study. IEEE J. Select. Topics Appl. Earth Observ. Remote Sens. 99, 1–9.
Tomaselli, P. D., Dixen, M., Bolaños, R., and Sørensen, J. T. (2021). A decision-making tool for planning O&M activities of offshore wind farms using simulated actual decision drivers. Front. Mar. Sci. 7:588624. doi: 10.3389/fmars.2020.588624
Walters, D., Baran, A. J., Boutle, I., Brooks, M., Earnshaw, P., Edwards, J., et al. (2019). The met office unified model global atmosphere 7.0/7.1 and JULES global land 7.0 configurations. Geosci. Model Dev. 12, 1909–1963. doi: 10.5194/gmd-12-1909-2019
Walters, J., Martin, M. J., Lea, D. J., Mirouze, I., Weaver, A. T., While, J., et al. (2015). Implementing a variational data assimilation system in an operational 1/4 degree global ocean model. Q. J. Roy. Meteorol. Soc. 141, 333–349. doi: 10.1002/qj.2388
Wiese, A., Stanev, E., Koch, W., Behrens, A., Geyer, B., and Staneva, J. (2019). The impact of the two-way coupling between wind wave and atmospheric models on the lower atmosphere over the north sea. Atmosphere 10:386. doi: 10.3390/atmos10070386
Wiese, A., Staneva, J., Ho-Hagemann, H. T. M., Grayek, S., Koch, W., and Schrum, C. (2020). Internal model variability of ensemble simulations with a regional coupled wave-atmosphere model GCOAST. Front. Mar. Sci. 7:596843. doi: 10.3389/fmars.2020.596843
Wiese, A., Staneva, J., Schulz-Stellenfleth, J., Behrens, A., Fenoglio-Marc, L., and Bidlot, J.-R. (2018). Synergy of wind wave model simulations and satellite observations during extreme events. Ocean Sci. 14, 1503–1521. doi: 10.5194/os-14-1503-2018
Wu, L., Staneva, J., Breivik, Ø, Rutgersson, A., Nurser, A. J. G., Clementi, E., et al. (2019). Wave effects on coastal upwelling and water level. Ocean Model. 140:101405. doi: 10.1016/j.ocemod.2019.101405
Keywords: oceanography, coastal and regional, coupled models, sentinel data, downscaling, coastal ocean applications
Citation: Sanchez-Arcilla A, Staneva J, Cavaleri L, Badger M, Bidlot J, Sorensen JT, Hansen LB, Martin A, Saulter A, Espino M, Miglietta MM, Mestres M, Bonaldo D, Pezzutto P, Schulz-Stellenfleth J, Wiese A, Larsen X, Carniel S, Bolaños R, Abdalla S and Tiesi A (2021) CMEMS-Based Coastal Analyses: Conditioning, Coupling and Limits for Applications. Front. Mar. Sci. 8:604741. doi: 10.3389/fmars.2021.604741
Received: 10 September 2020; Accepted: 11 February 2021;
Published: 24 March 2021.
Edited by:
Enrique Alvarez Fanjul, Ports and Coastal Dynamics Division, SpainReviewed by:
Riccardo Briganti, University of Nottingham, United KingdomTomasz Dabrowski, Marine Institute, Ireland
Copyright © 2021 Sanchez-Arcilla, Staneva, Cavaleri, Badger, Bidlot, Sorensen, Hansen, Martin, Saulter, Espino, Miglietta, Mestres, Bonaldo, Pezzutto, Schulz-Stellenfleth, Wiese, Larsen, Carniel, Bolaños, Abdalla and Tiesi. This is an open-access article distributed under the terms of the Creative Commons Attribution License (CC BY). The use, distribution or reproduction in other forums is permitted, provided the original author(s) and the copyright owner(s) are credited and that the original publication in this journal is cited, in accordance with accepted academic practice. No use, distribution or reproduction is permitted which does not comply with these terms.
*Correspondence: Agustin Sanchez-Arcilla, agustin.arcilla@upc.edu