Multivariate Sub-Regional Ocean Indicators in the Mediterranean Sea: From Event Detection to Climate Change Estimations
 Mélanie Juza
 Joaquín Tintoré
- 1Balearic Islands Coastal Observing and Forecasting System (SOCIB), Palma, Spain
- 2Mediterranean Institute for Advanced Studies (IMEDEA) (CSIC-UIB), Esporles, Spain
The increasing science and society requests for ocean monitoring from global to regional and local scales, the need for integration and convergence into a globally consistent ocean observing system as well as the need for improvement of access to information are now internationally recognized goals to progress toward the sustainable management of a healthy ocean. To respond to these challenges at regional level, the Balearic Islands Coastal Observing and Forecasting System (SOCIB) is developing a comprehensive set of ocean indicators in the Mediterranean Sea and around the Balearic Islands, key environments that are strongly affected by climate change and human pressure. This new SOCIB value-added product addresses the sub-regional ocean variability from daily (events) to interannual/decadal (climate) scales. A user-friendly interface has been implemented to monitor, visualize and communicate ocean information that is relevant for a wide range of sectors, applications and regional end-users. These sub-regional indicators allowed us to detect specific events in real time. Remarkable events and features identified include marine heat waves, atmospheric storm, extreme river discharge, mesoscale eddy, deep convection among others, all of them being oceanic phenomena that directly impact the ocean circulation and marine ecosystems. The long-term variations, in response to climate change, are also addressed highlighting and quantifying trends in physical and biogeochemical components of the ocean as well as sub-regional differences. At both (sub-) regional, national and international levels, a society-aligned science will have stronger impact on policy decision-makings and will support society to implement specific actions to address worldwide environmental challenges.
Introduction
Covering 71% of Earth’s surface and by its capacity to store and redistribute large amounts of heat, freshwater and carbon around the world (IPCC, 2013; Abram et al., 2019), the ocean plays a central role in regulating weather and climate and contributes to the economic wealth and security of many nations, providing food, energy, transport, commerce, and recreation. Around 28% of the world population lives in the near-coast zone, below an elevation of 100 m and closer than 100 km from the coast (Kummu et al., 2016; Abram et al., 2019). This area is strongly impacted by the effects of climate change – such as ocean warming, sea ice melt, sea level rise, ocean acidification, and decreasing dissolved oxygen (IPCC, 2019; von Schuckmann et al., 2019) –, and human activities such as overfishing, pollution, coastal development, and resource extraction (IPCC, 2014; Visbeck et al., 2014; Visbeck, 2018). To better support the sustainable management and the protection of the ocean and its resources, systematic ocean information and long-term data records from local to global scales are increasingly required (Tanhua et al., 2019). The need for ocean monitoring and knowledge is now highly present in the political agenda with key actions. The United Nations (UN) ’s Agenda 2030 for Sustainable Development1 with Goal 14 “Life below water” is setting out to conserve (e.g., through Marine Protected Areas) and sustainably use the oceans, based on an increasing scientific knowledge and through policies and legislation at international and national [e.g., in Exclusive Economic Zone (EEZ) areas] levels (UN, 2015; Virto, 2018). The UNESCO proclaimed the UN Decade of Ocean Science for Sustainable Development (2021–2030) with the mission to produce and use the knowledge for a clean, healthy and resilient, predicted, safe, sustainably harvested and productive, transparent and accessible ocean (Ryabinin et al., 2019; UNESCO, 2020). Furthermore, the Intergovernmental Panel on Climate Change (IPCC) dedicated its last Special Report to Ocean and Cryosphere (SROCC) assessing scientifically their changes and alerting on the related risks for ecosystems, societies and sustainable development (IPCC, 2019).
Key physical, biogeochemical and biological ocean variables that critically contribute to the characterization of the ocean have been defined as Essential Ocean Variables (EOVs2) by the Global Ocean Observing System (GOOS) and the Intergovernmental Oceanographic Commission (IOC) of UNESCO (Tanhua et al., 2019) to achieve the sustainable development goals and to respond to scientific and societal issues (Lindstrom et al., 2012; Hayes et al., 2015; Reyers et al., 2017; Bax et al., 2018; Duarte et al., 2018; Miloslavich et al., 2018). Converging into such an agreed set of information provides a globally consistent approach to monitor and progress toward the sustained use of the ocean. The EOV monitoring enables to track changes in ocean properties that are essential to understand the ocean state, variability and changes at different scales. Ocean indicators provide information and estimations of the state and temporal evolution of EOVs or key (regional) derived quantities that are scientifically relevant and sufficiently simple to be suitable for widespread public communication (Hayes et al., 2015; von Schuckmann et al., 2019; Trewin et al., 2021). For the global ocean and European Seas, the Copernicus Marine Service (CMEMS) Ocean State Report (von Schuckmann et al., 2016, 2018, 2019, 2020) is reporting the so-called “Ocean Monitoring Indicators” (OMIs). They address the monitoring of various essential variables (chlorophyll-a concentration, ocean heat content, sea level, sea ice, transports, water mass and heat exchange, ocean currents, temperature and salinity), which are integrated spatially over the global ocean and/or the European Seas (Artic Ocean, Baltic Sea, European North-West Shelf Seas, Iberia-Biscay-Irish regional seas, Black Sea and Mediterranean Sea).
The Mediterranean Sea is a well-known small scale ocean (Robinson et al., 2001) of major importance in many societal aspects: culture (e.g., history and civilizations), environment (e.g., geography, biodiversity and climate), economy (e.g., natural resources, maritime transports and tourism) and science (e.g., environment and climate research) (Bethoux et al., 1999; UNEP/MAP, 2017). It is bordered by more than 20 European, north-African and eastern-Asian countries, with major coastal cities. Hundreds of small and large islands are situated in this regional sea. Moreover, much of the Mediterranean coast is a high popular place of recreation for the worldwide population. The human well-being in this region highly depends on the ocean health which has decreased in the last 50 years with increasing environmental issues (e.g., sea level rise, pollution, shipping, tourism, overfishing, natural hazards, and invasive species; Visbeck, 2018; Ryabinin et al., 2019). As semi-enclosed and relatively small basin, the Mediterranean is considered as a hot-spot for climate change effects (Giorgi, 2006; Lionello and Scarascia, 2018). Many ocean physical processes found throughout the world ocean occur in the Mediterranean Sea (Malanotte-Rizzoli et al., 2014) – such as the thermohaline circulation, deep convection, mesoscale and sub-mesoscale circulation, or shelf-slope exchanges -, making this ocean basin particularly interesting for climatic and environmental studies (Bethoux et al., 1999). These processes play an important role in governing marine sub-systems dynamics (e.g., biogeochemistry, biology, and acoustics). Environmental factors (e.g., global warming, extreme events and continental inputs) affect the Mediterranean Sea from the surface to the deep ocean and from coastal to open sea waters. These changes affect sea level, as well as marine ecosystems, with a potential associated socio-economic impact (Bethoux et al., 1999). Hydrographic changes in the Mediterranean Sea, which is connected to the North Atlantic through the Strait of Gibraltar, may also affect the global ocean thermohaline circulation through heat and salt inputs spreading northwards in the North Atlantic toward the high latitude deep water formation sites (Reid, 1979; Candela, 2001).
In line with the international initiatives and organizations – such as OceanObs’19 (Speich et al., 2019), UN SDG14 (Virto, 2018), UN Decade of Ocean Science for Sustainable Development (Ryabinin et al., 2019), and IPCC SROCC (IPCC, 2019) – one of the main objectives of the Balearic Islands Coastal Observing and Forecasting System (SOCIB) is to respond to science and society needs providing oceanographic data and added-value ocean products (Tintoré et al., 2013, 2019a). More specifically, SOCIB developed a products and services strategy described in Heslop et al. (2019). In this frame, SOCIB team is developing regional ocean indicators for the Mediterranean Sea and around the Balearic Islands in the western basin, a region with significant human pressure and strongly impacted by climate and global change. These (sub-) regional ocean indicators are an integral part of an operational product that provides continuous information about the ocean state and variability from daily to interannual scales in a simple way that could be consulted by a large user’s community, reaching both scientific and societal (decision-makers, environmental agencies, general public) end-users in the region. Scientists will be using these products for operational purposes (e.g., in support to oceanographic campaigns design), for monitoring and analyzing ocean health and ocean climate, as well as for better understanding ocean processes and their role in ocean and climate variability. Policy-makers and managers will have access to these ocean indicators and the resulting information on the ocean behavior and changes at regional scale. Such a tool will be very useful for the EEZ areas to progress in management and policy at national level for a sustainable and healthy ocean. These products can also inform the general public about ocean conditions, alert and educate citizens about the role of the ocean in climate change, the relevance and the need for detailed and sustained ocean observations at different scales, and increase awareness of the socio-economic and environmental impacts.
The purpose of this study is to characterize and analyze the sub-regional ocean variability in the Mediterranean Sea of which the strong spatial variations require specific consideration. This paper also proposes multi-parameter and multi-scale approaches to establish the possible link between the different components of the ocean (e.g., physical and biogeochemical properties, event and climate signal, oceanic and atmospheric variability) and to proper interpret and understand the ocean variations in this region. Quantitative estimations are provided for remarkable events, in particular marine heat waves, and regional trends. This paper is organized as follows: Section “SUB-REGIONAL OCEAN INDICATORS” introduces the sub-regional ocean indicators, describing the sub-regional approach in the Mediterranean Sea, giving an overview of the selected indicators, and specifying their application sectors and end-users in the region. Section “DATA AND METHODOLOGY” provides a detailed description of the data products used, the methodology applied and the diagnostics performed to produce the surface and vertically integrated ocean indicators. After introducing the operational visualization tool which provides the complete set of the ocean indicators, Section “MEDITERRANEAN SPATIO-TEMPORAL VARIABILITY: RESULTS AND DISCUSSION” discusses the results about the multivariate and sub-regional variability of the Mediterranean Sea at different temporal scales. Finally, Section “CONCLUSION AND PERSPECTIVES” provides conclusions and perspectives.
Sub-Regional Ocean Indicators
Sub-Regional Approach
The present ocean indicators aim at providing a comprehensive ocean monitoring characterization of the Mediterranean Sea, a region of major interest for science and society, from past to present. More precisely, this product focuses on the regional and sub-regional oceanic basins of the Mediterranean Sea. Observing and forecasting the Mediterranean Sea at sub-basin scale (Juza et al., 2015) allow us to establish and understand the regional ocean variability and as a result, to be able to respond to societal requests. Several sub-regions of the Mediterranean Sea are presently addressed (Figure 1). First, the western and eastern parts of the Mediterranean Sea (WMED and EMED, respectively), which have different ocean circulation, variability and dynamics, as well as different response to climate change, are considered separately. Additionally, these ocean indicators focus on the Balearic Islands region which lies at the center of the western basin, is a hot spot of biodiversity (Coll et al., 2010), with a well-established Bluefin tuna spawning area (Álvarez-Berastegui et al., 2018) and also a choke point of the western Mediterranean circulation (Heslop et al., 2012). In this sub-region, the Cabrera Island National Park, which is a protected area of major environmental importance (e.g., ZEPIM, Red Natura 2020) located off the southern coast of the Mallorca Island, is also monitored. The adjacent basins of the Balearic Islands are also considered due to their direct interactions and exchanges, as well as for their key dynamic features. In the north, the North-western Mediterranean (NWMED) is the region where circulates the permanent strong Northern Current (NC) which joins the Balearic Sea (Millot, 1999) and where winter deep convections occur (Testor et al., 2018). In the south, the Alboran Sea and Algerian sub-basin are the regions of the WMED with highest kinetic energy and intense mesoscale activity. The Alboran Sea, which connects the Atlantic Ocean and the Mediterranean Sea through the Strait of Gibraltar, is characterized by the presence of strong mesoscale eddies (Alboran Gyres, Viúdez et al., 1996; Juza et al., 2016a). The Algerian basin is characterized by the strong permanent Algerian Current (AC) and the generated strong mesoscale eddies (Escudier et al., 2016).
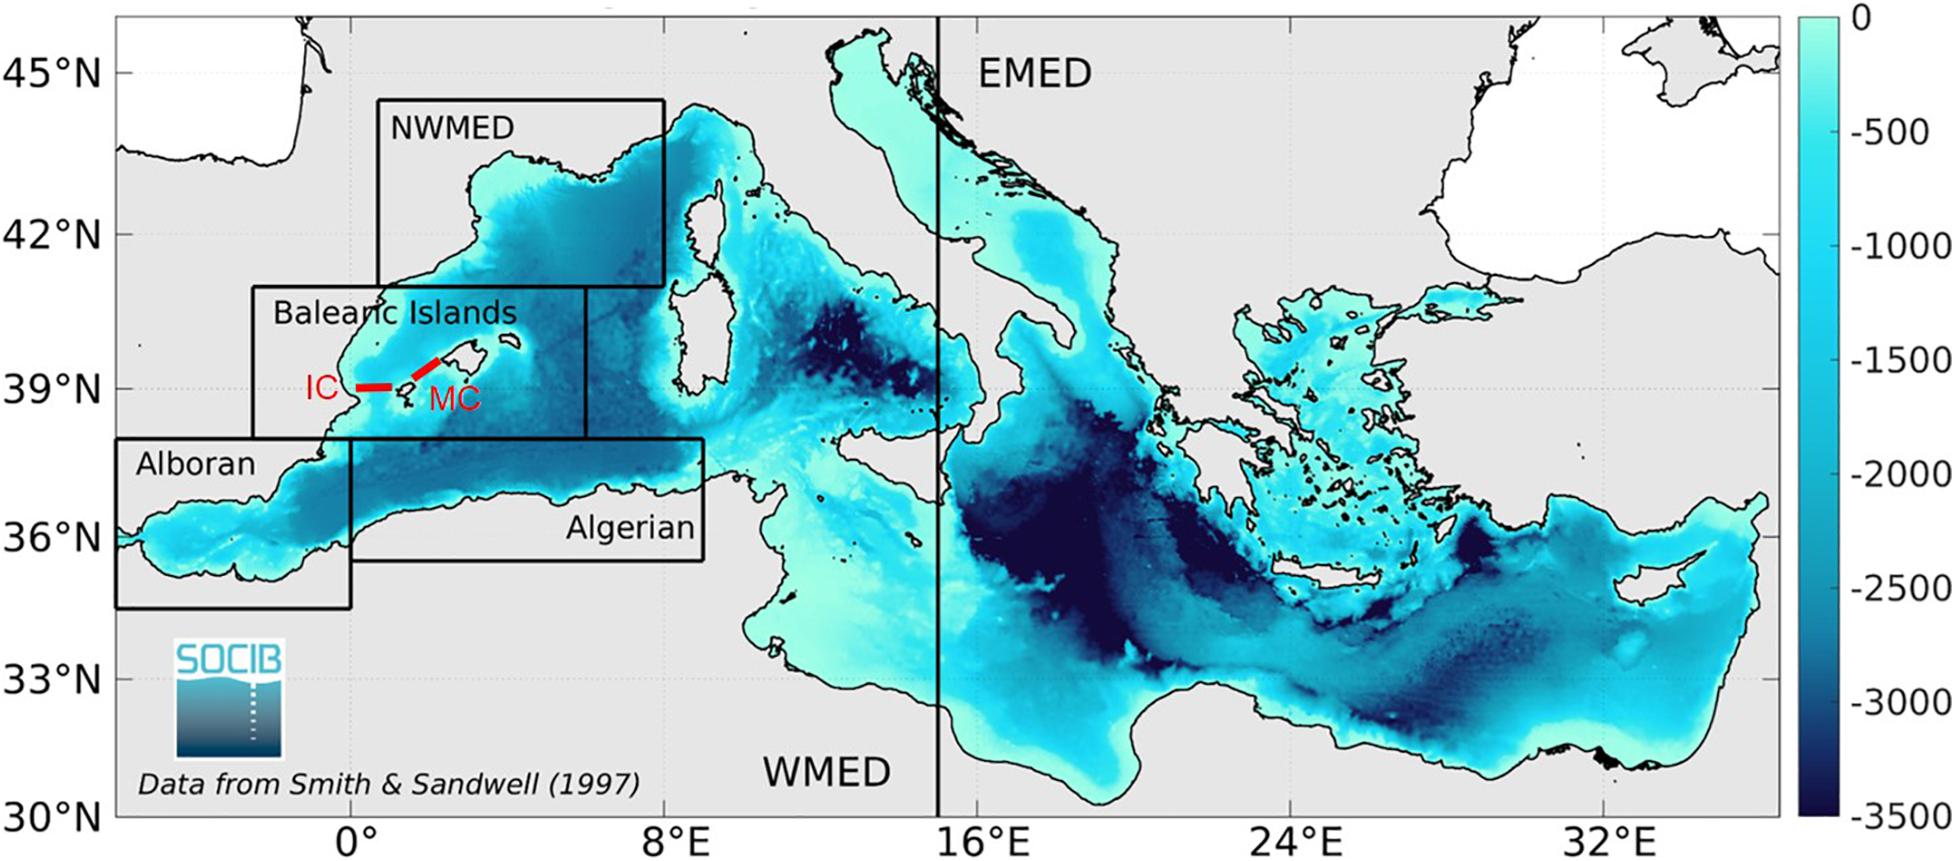
Figure 1. Bathymetry (in m) in the Mediterranean Sea with the sub-regions (black boxes) and sections (red lines) used for the current sub-regional ocean indicators: eastern and western Mediterranean (EMED and WMED), north-western Mediterranean (NWMED), Balearic Islands region (including the Cabrera Island National Park), Alboran Sea, Algerian sub-basin, Ibiza and Mallorca Channels (IC and MC).
Set of Indicators
Observations from satellite products (distributed by CMEMS) and in situ platforms (gliders collected by SOCIB, profiling floats distributed by Met-Office) are used to monitor the physical and biogeochemical essential variables. Two categories of (sub-) regionally integrated ocean indicators are considered: (1) surface ocean indicators processing sea surface temperature, chlorophyll-a concentration, ocean currents, sea level anomaly, wind speed and direction, and (2) vertically integrated ocean indicators including heat and salt contents, mixed layer properties, and water mass transports in key sections (Table 1). Two-dimensional (2D) maps and time series are displayed for the selected variables at different time scales to monitor the ocean variability from daily to interannual/decadal scales: (1) the daily mean monitoring allows detecting remarkable event or abrupt change and providing last “ocean weather”, (2) the monthly or seasonal mean monitoring aims at following the seasonal variability and (3) the annual mean and interannual variability monitoring allows estimating long-term changes in relation to climate change. The time series are integrated in the whole Mediterranean Sea and the different sub-regions (as described in Section “Sub-regional Approach” and Figure 1) to highlight the (sub-) regional variability and to provide information at regional and local scales. Juza et al. (2015) already showed the need and relevance of the sub-regional and sub-basin approach in the western Mediterranean.
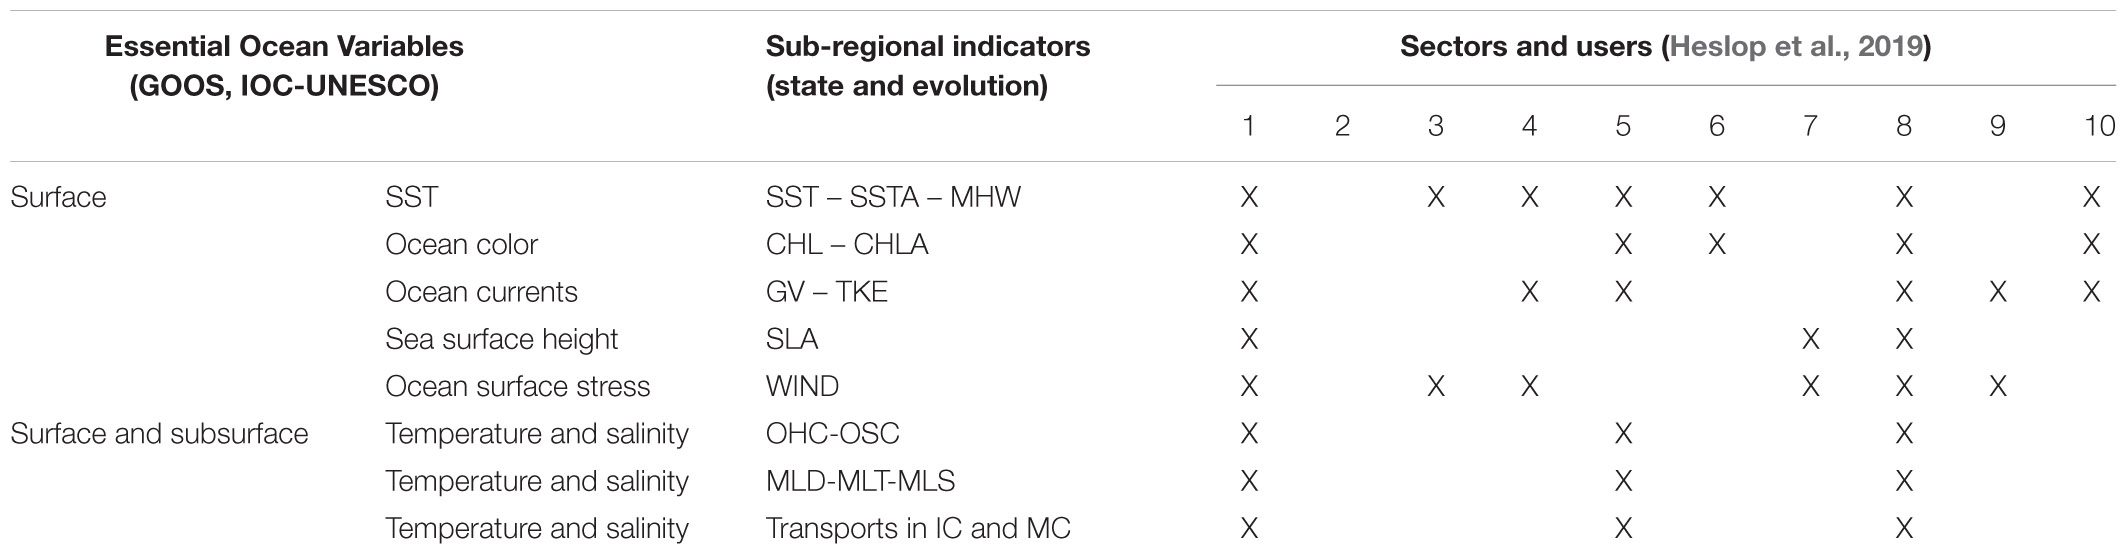
Table 1. Essential ocean variables, sub-regionally integrated ocean indicators, associated sectors and users as listed in Table 2.
Sectors and Users
When designing new products, it is essential to consider and identify, from the beginning, the different ocean sectors and end-users that need them and that accordingly will use them for knowledge based sustainable management. The society-aligned science and policy-aligned research will help to guide the science, prioritize the research questions, establish value-added products and implement effective tools.
The SOCIB products and services strategy is described in Heslop et al. (2019) with the objectives to identify and enhance the link from the ocean observing data to the regional societal end-users, to create greater value from the increasing wealth of ocean data and knowledge for users, for benefit of science and society, to deliver more to more societal end-users, and to create smart ocean products from observing system that add value to decision making and are actively used by scientific and societal customers. The main identified sectors and associated users are reported in Table 2. The regional ocean indicators, developed in this study, are a valuable product in many of these identified sectors in the region (Tables 1, 2), in particular in the following: marine and coastal research; beach, coastal communities and tourists; coastal prediction, planning and governance; sustainable marine ecosystems; integrated coastal zone and ocean management; ports and shipping; sustainability of Islands and climate change; education and kids. At the European and international levels, the indicators of this paper are also a valuable product in several sectors of the blue economy as identified and supported by CMEMS3.
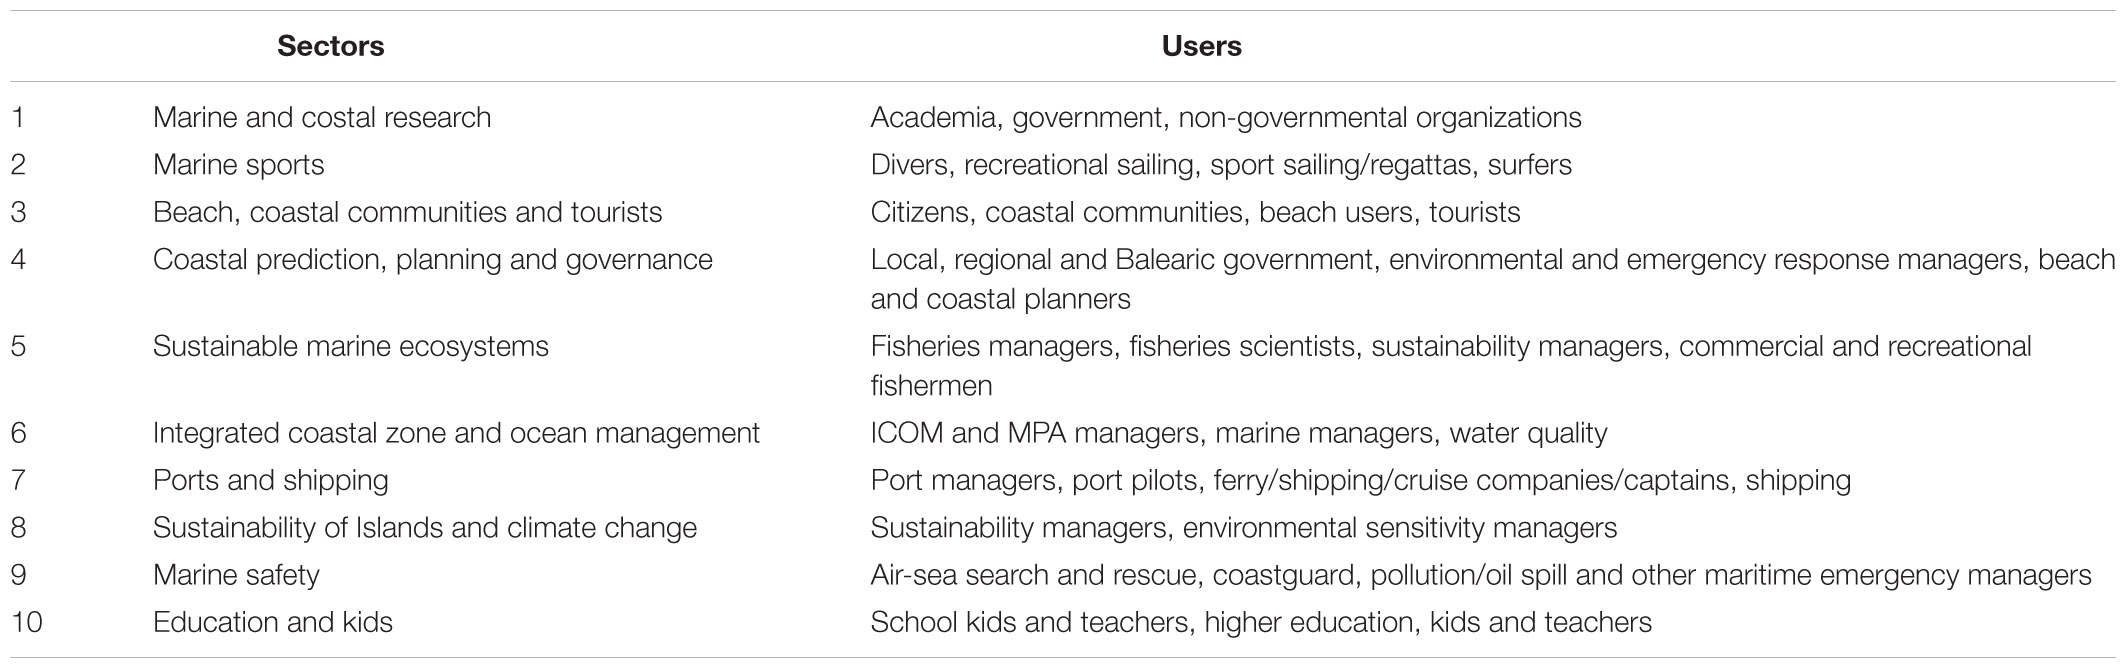
Table 2. SOCIB products and services: identified sectors and users (Heslop et al., 2019).
While the near real-time (daily) monitoring provides support to stakeholders in operational response, monthly to interannual scale information can help them to better anticipate and plan for the future. Thus, contributing to improve the knowledge and to better understand, predict and respond to the ocean state and variability, the multi-temporal scale sub-regional indicators aim at reaching several targeted regional and European sectors and users.
Criteria for Selection
To ensure the reliability and usefulness of the developed ocean indicators, they comply with selection criteria that are suitable to support efficiently the ocean management for sustainable use and conservation (Hayes et al., 2015; Duncan et al., 2019; Trewin et al., 2021), in particular: (1) data availability (free and open access, near real-time and historical data), (2) data quality (quality-controlled, validated, reliable and published data), (3) scientifically robust approaches (ocean process relevancy, ocean state and change representativeness, internationally agreed methodologies, and peer-reviewed references), (4) policy and stakeholder relevancy (indicators have to be meaningful, useful, easily understandable by a large audience, few in number), and (5) timeliness (regularly systematically update, operational visualization tool, free-flowing communication).
The next section provides a detailed description of each indicator that allows to address many relevant oceanic processes for scientific studies as well as several crucial socio-economic applications serving the sectors and users as identified in Section “Sectors and Users” (Tables 1, 2).
Data and Methodology
Surface Ocean Variables
The satellite products, which are freely available and distributed by CMEMS4, are used to produce the (sub-) regional ocean indicators at sea surface. Both the near real-time (NRT) and reprocessed (REP) products are used. When the REP product is not available, the NRT product is used. This is the case to generate the last 2D map and to complete the time series in the recent times.
Sea Surface Temperature, Marine Heat Wave
The sea surface temperature (SST) monitoring at various spatio-temporal scales enables to address many ocean processes such as air-sea exchanges, biological processes, ocean dynamics features (e.g., fronts, eddies, upwelling, coastal shelf/open ocean exchanges), or physical-biogeochemical-biological ocean response to climate change (e.g., global warming and marine heat waves) (Roquet et al., 2016; von Schuckmann et al., 2018; Bensoussan et al., 2019a).
SST is monitored using the CMEMS OSI-TAC products in the Mediterranean Sea from satellite data reprocessed by CNR-ISAC-GOS (Buongiorno et al., 2013; Pisano et al., 2016). Both the REP and NRT products used are interpolated data into a 1/8° × 1/8° grid at daily resolution over the 1982–2018 and 2019-present periods, respectively. The daily REP product is also used to build the climatology and compute the sea surface temperature anomaly (SSTA) at daily, monthly and annual scales. The chosen reference period for the climatology is 1982–2015. Since the proposed regional indicators aim at both detecting anomaly in the recent and future years and providing information about the long-term variability, the reference period chosen starts as early as possible (depending on the data availability) and ends in 2015 (discarding the recent years since 2016 to be compared between themselves with a common independent reference). For this reason, the reference period for the SSTA is 1982–2015, while for the chlorophyll-a concentration anomaly (Section “Chlorophyll-a Concentration”) is 1998–2015, for the ocean current climatology is 1993–2015 (Section “Ocean Currents”) and for the wind intensity is 1992–2015 (Section “Wind Speed and Direction”). For scientific studies directly combining the anomalies from different variables, a common reference period shall be considered.
Marine heat waves (MHW) have been increasingly observed around the world and particularly in the Mediterranean Sea under the anthropogenic climate change that strongly impacts the marine ecosystems (Hobday et al., 2016; Bensoussan et al., 2019a). Hobday et al. (2016) characterize the marine heat spike when the SST exceeds a threshold value. This latter is computed as being the 90th percentile of the local SST distribution over a long-term reference period. The MHW corresponds the marine heat spike (MHS) lasting more than five consecutive days. Following the definition and methodology from Hobday et al. (2016), MHWs are automatically identified during the daily monitoring with respect to the 1982–2015 reference period and reported in the different sub-regions.
To address the large variety of scientific and socio-economic applications, the diagnostics performed for SST and SSTA cover the daily, monthly and annual/interannual monitoring (details in Table 3).
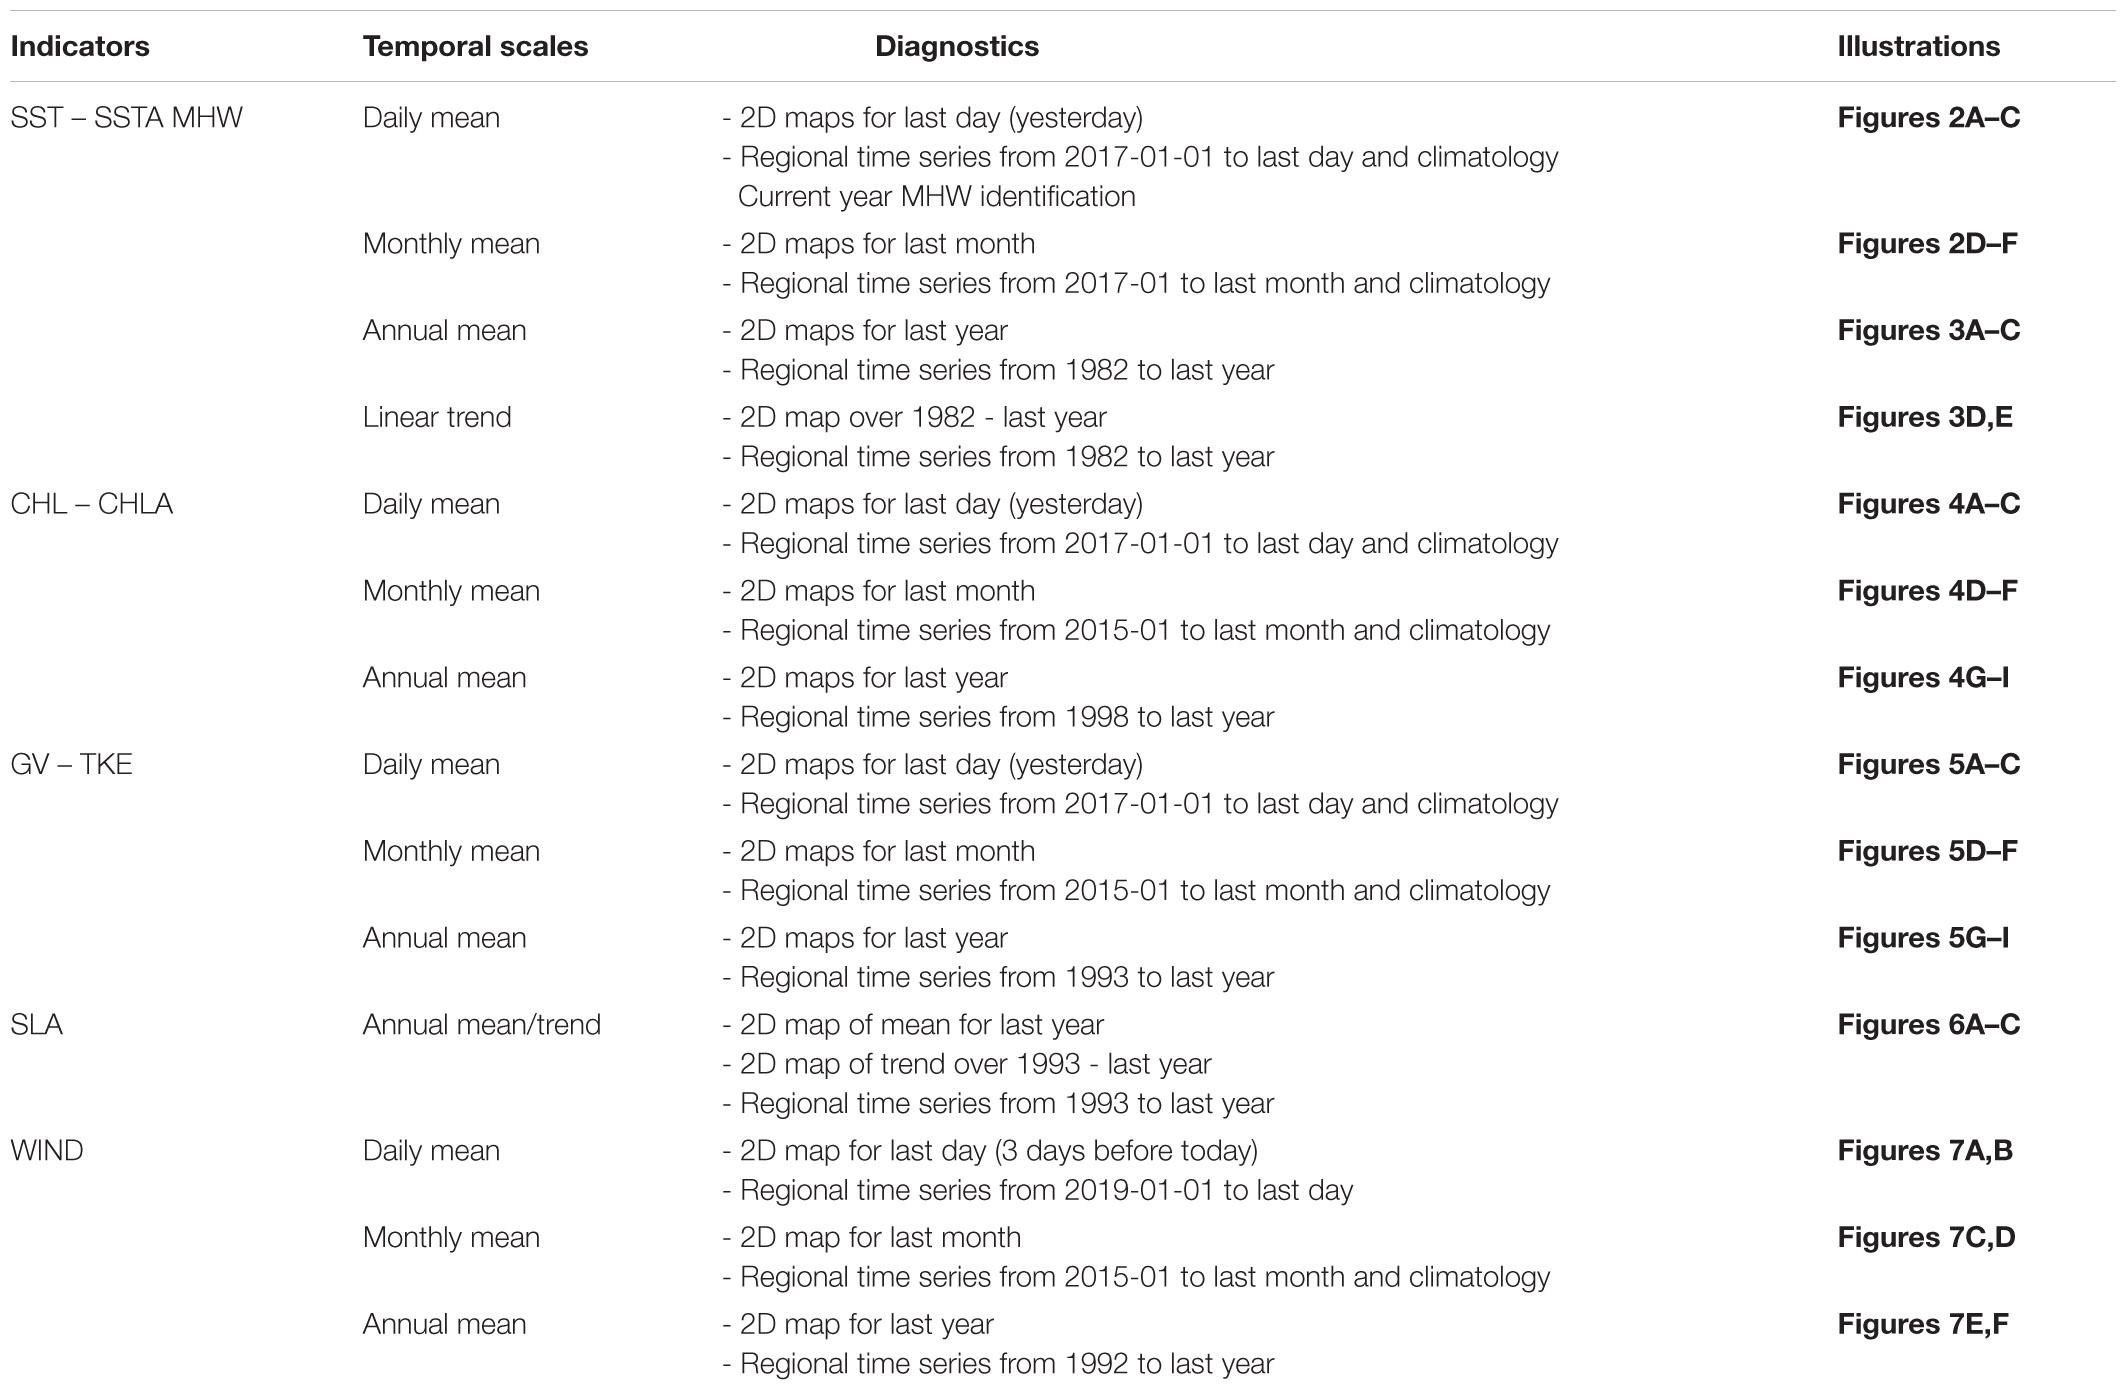
Table 3. Summary of the diagnostics and illustrations for the surface ocean indicators.
Chlorophyll-a Concentration
The chlorophyll-a concentration (CHL) is an indicator of algae abundance and primary productivity with essential applications for science - such as front detection, biological activity, marine ecosystem variability, vertical exchanges, deep convection, river discharges, water quality, or ocean response to climate change (Colella et al., 2016).
CHL is monitored using the CMEMS OC-TAC products in the Mediterranean Sea from multi-sensor data (Volpe et al., 2018, 2019). Both the REP and NRT products used are interpolated data into a 1km x 1km grid at daily and monthly resolutions over the 1998–2018 and 2019-present periods, respectively. The REP product, which is available only at monthly mean scale, is also used to establish the daily, monthly and annual climatologies over the reference period 1998–2015 (as explained in Section “Sea Surface Temperature, Marine Heat Wave”) and compute the chlorophyll-a concentration anomaly (CHLA). To respond to both science and society needs, as for SST and SSTA, the diagnostics for CHL and CHLA also deal with the daily, monthly and annual monitoring (Table 3).
Ocean Currents
The ocean current monitoring allows to address several ocean processes at different scales including climate and weather fluctuations, sea state, transports (e.g., mass, heat, salt, biogeochemical parameter, plankton), ocean circulation and variability, front detection, changes in marine ecosystem, vertical exchanges, and ocean response to climate change (von Schuckmann et al., 2018).
The surface ocean currents can be characterized by the geostrophic velocity (GV) field which is monitored using the CMEMS SL-TAC products in the Mediterranean Sea from satellite data processed by multi-mission altimeter data processing system (Ssalto/Duacs User Handbook, 2014). Both the REP and NRT products used are interpolated data into a 1/8° × 1/8° grid at daily resolution over the 1993-mid2019 and mid2019-present periods, respectively. The daily REP product is used to compute the daily and monthly climatologies over the reference period 1993–2015 (as explained in Section “Sea Surface Temperature, Marine Heat Wave”). The diagnostics are performed for GV as well as for their associated total kinetic energy (TKE) (Table 3). TKE is computed as follows: where Ug and Vg are the zonal and meridional components of the geostrophic currents. TKE represents the energy of the total (mean and fluctuations) surface geostrophic flow. Note that the satellite altimetry allows describing the general circulation and open ocean mesoscale but small and coastal mesoscale structures cannot be reliably detected due to the small deformation radius in the Mediterranean Sea, the resolution of gridded altimetry product and the inaccuracy of along-track velocity fields in coastal areas (Pascual et al., 2013).
Sea Level Anomaly
The sea level anomaly (SLA) also enables to address key scientific questions (e.g., ocean circulation and variability, sea level rise, extreme events, ocean response to climate change; IPCC, 2019).
SLA is monitored using the same products as in Section “Ocean Currents.” SLA is computed with respect to a twenty-year 1993–2012 mean (Ssalto/Duacs User Handbook, 2014). The diagnostics for SLA focus on annual means and linear trends since 1993 (Table 3) addressing the long-term variability.
Wind Speed and Direction
As surface ocean forcing, the sea surface wind stress is also a key ocean variable to monitor with numerous ocean science applications including changes in induced-wind ocean circulation (e.g., Ekman currents and coastal upwelling), ocean response to extreme events, ocean mixing, and air-sea fluxes (Belmonte Rivas et al., 2019).
The wind speed and direction (WIND) are monitored using the CMEMS OSI-TAC product for the global ocean, from blended ASCAT-SSM/I analysis processed by CERSAT (Bentamy et al., 2017; Desbiolles et al., 2017). Both the REP and NRT products used are interpolated data into a 1/4° × 1/4° grid with a 6-h resolution over the 1992–2018 and 2019-present periods, respectively. The REP product is used to build the monthly climatology over 1992–2015 (as explained in Section “Sea Surface Temperature, Marine Heat Wave”). The diagnostics for WIND are provided for daily, monthly and annual means (Table 3).
Time Series
The period considered for the time series is a compromise between the information to be communicated and the clarity for users. For the daily mean monitoring, the time series cover the last 3 years and the current year, allowing to distinguish clearly an event over a few days from the seasonal variability. Note that for WIND of which intensity has very strong temporal variability, the time series cover a shorter period starting the last year for clarity. For the monthly mean monitoring, the time series cover the last 5 years and the current year, allowing to identify clearly an anomalous month or season over the last years. The annual cycles of daily and monthly SST means are superimposed for direct comparison due to the general end-user request while continuous time series are provided for CHL, TKE, and WIND over the period for event identification and visibility, particularly at daily mean resolution. Finally, for the annual mean monitoring, all the available period is displayed for the surface ocean variables to better address the climate variability. The linear trends are estimated with 95% confidence level according to the methodology from Chelton (1983). The current diagnostics for the surface ocean variables are illustrated in Figures 2–7 (according to Table 3) and analyzed in Section “MEDITERRANEAN SPATIO-TEMPORAL VARIABILITY: RESULTS AND DISCUSSION.”
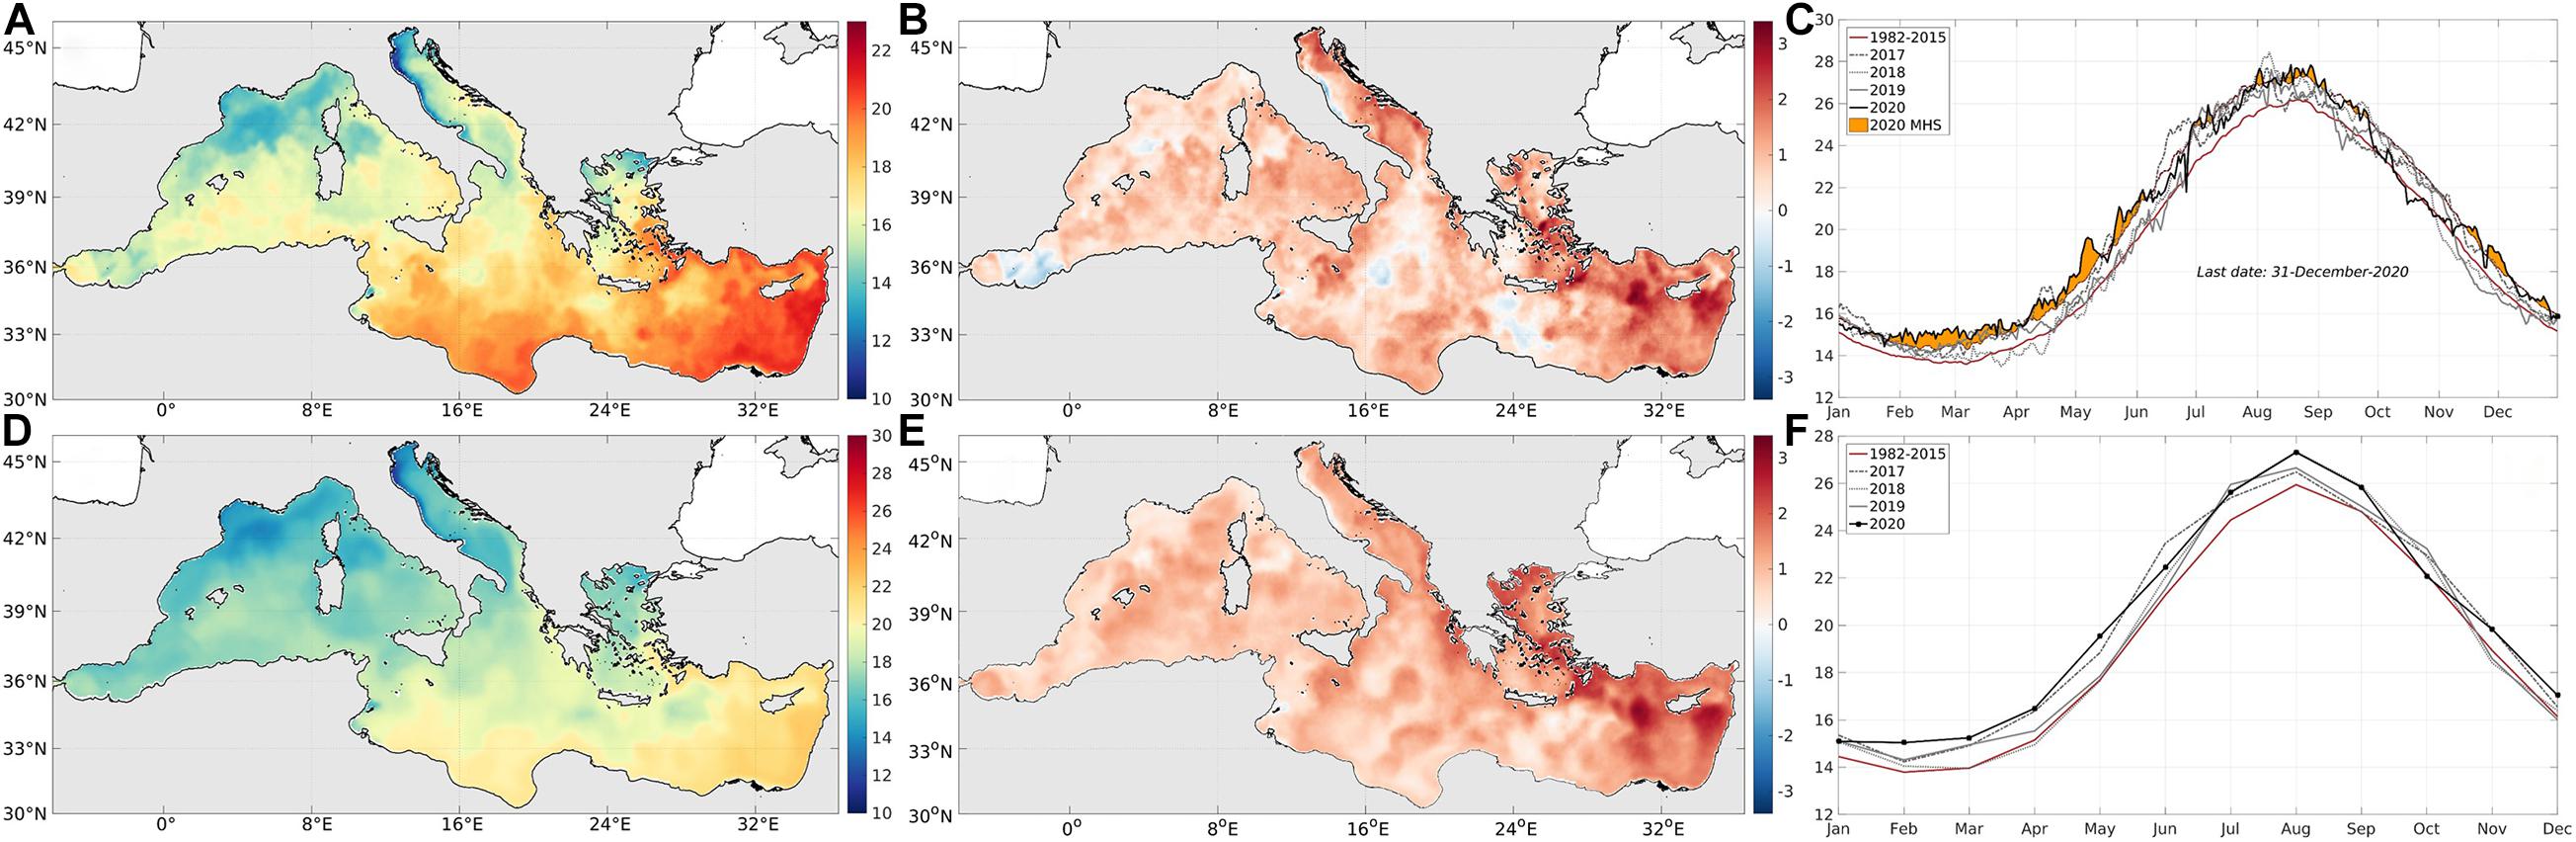
Figure 2. Illustrations for SST (in °C): daily means on 31-December-2020 (A–C) and monthly means in December 2020 (D–F): 2D maps of SST (A,D) and SSTA (B,E), and time series of SST averaged in the Balearic Islands since 2017 (C,F).
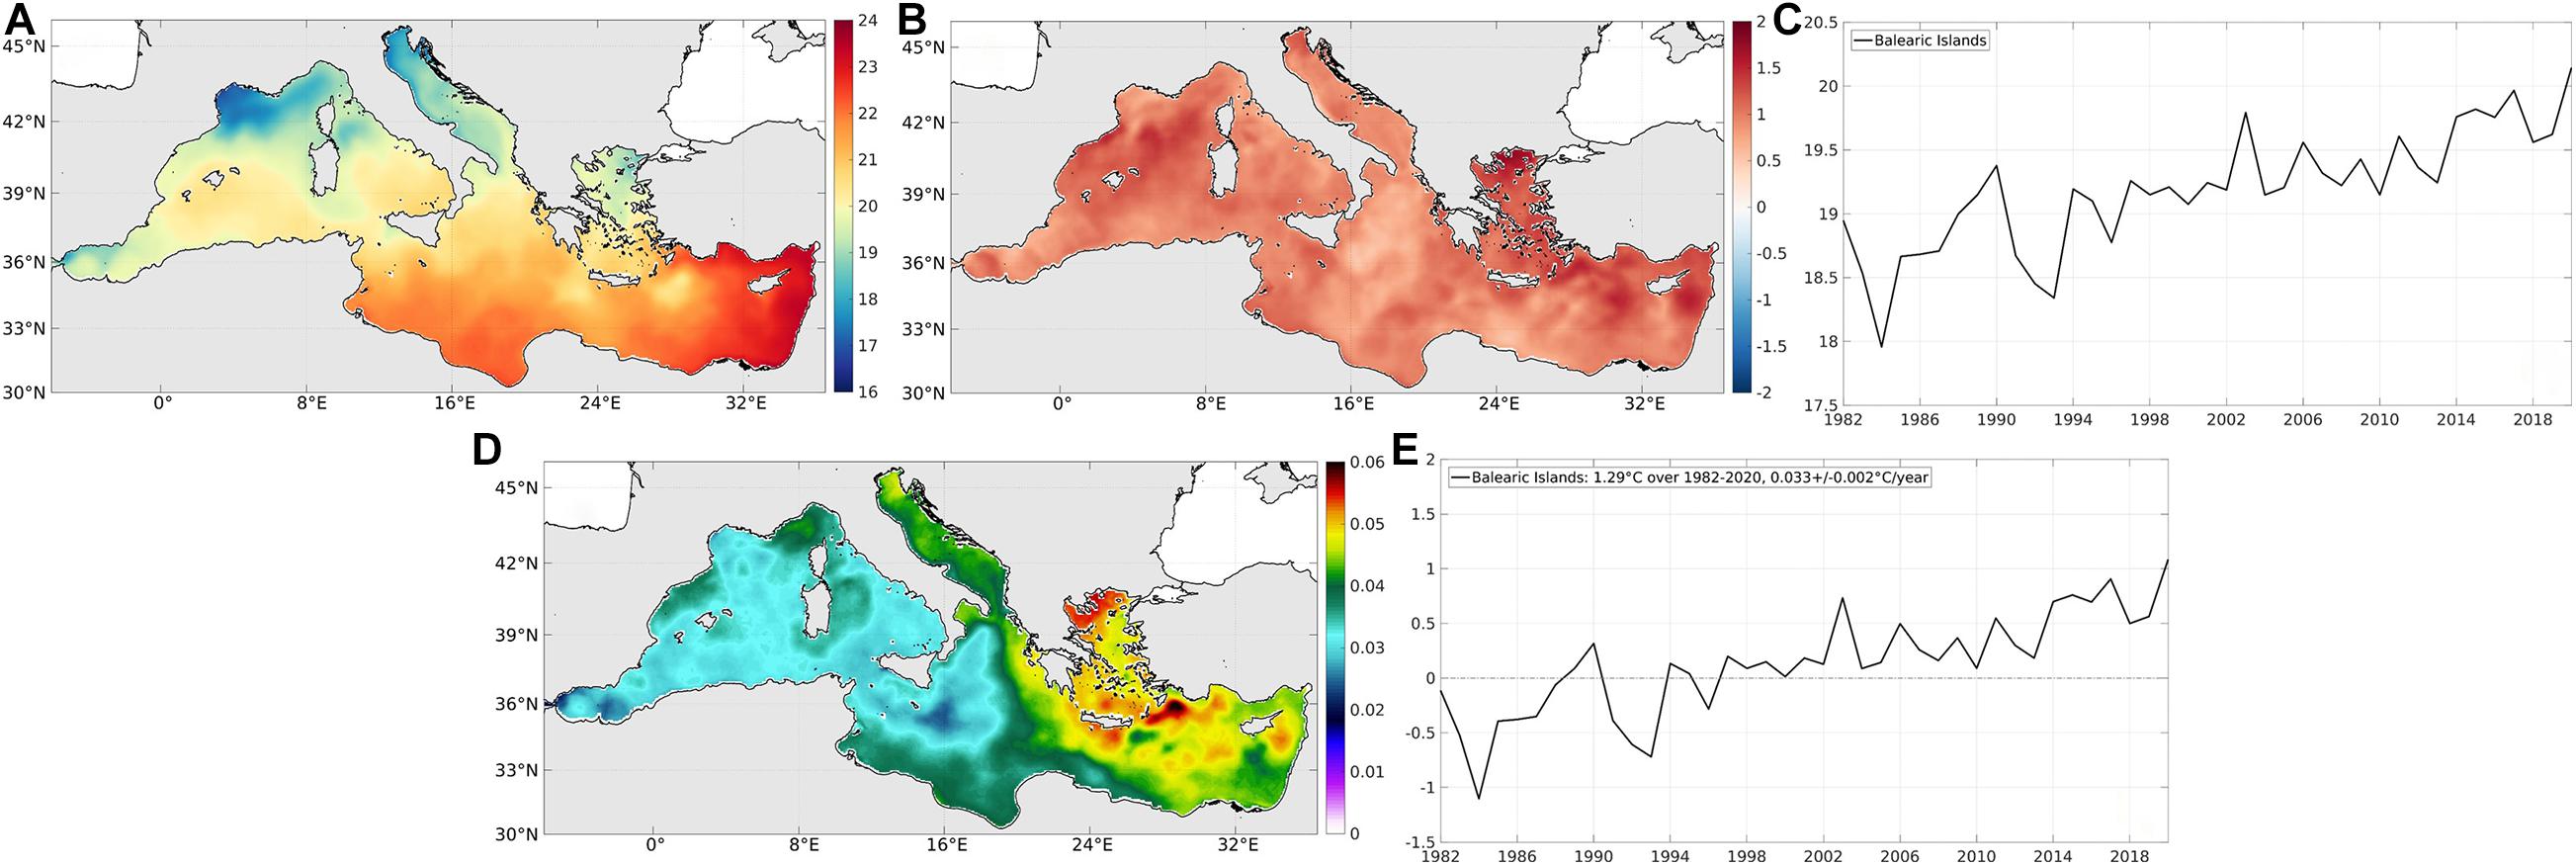
Figure 3. Illustrations for annual SST (in °C): annual mean in 2020 (A–C) and linear trend over 1982–2020 (C,D): 2D maps of mean SST (A), mean SSTA (B), and trend (D), and time series of SST and SSTA averaged in the Balearic Islands since 1982 (C,E).
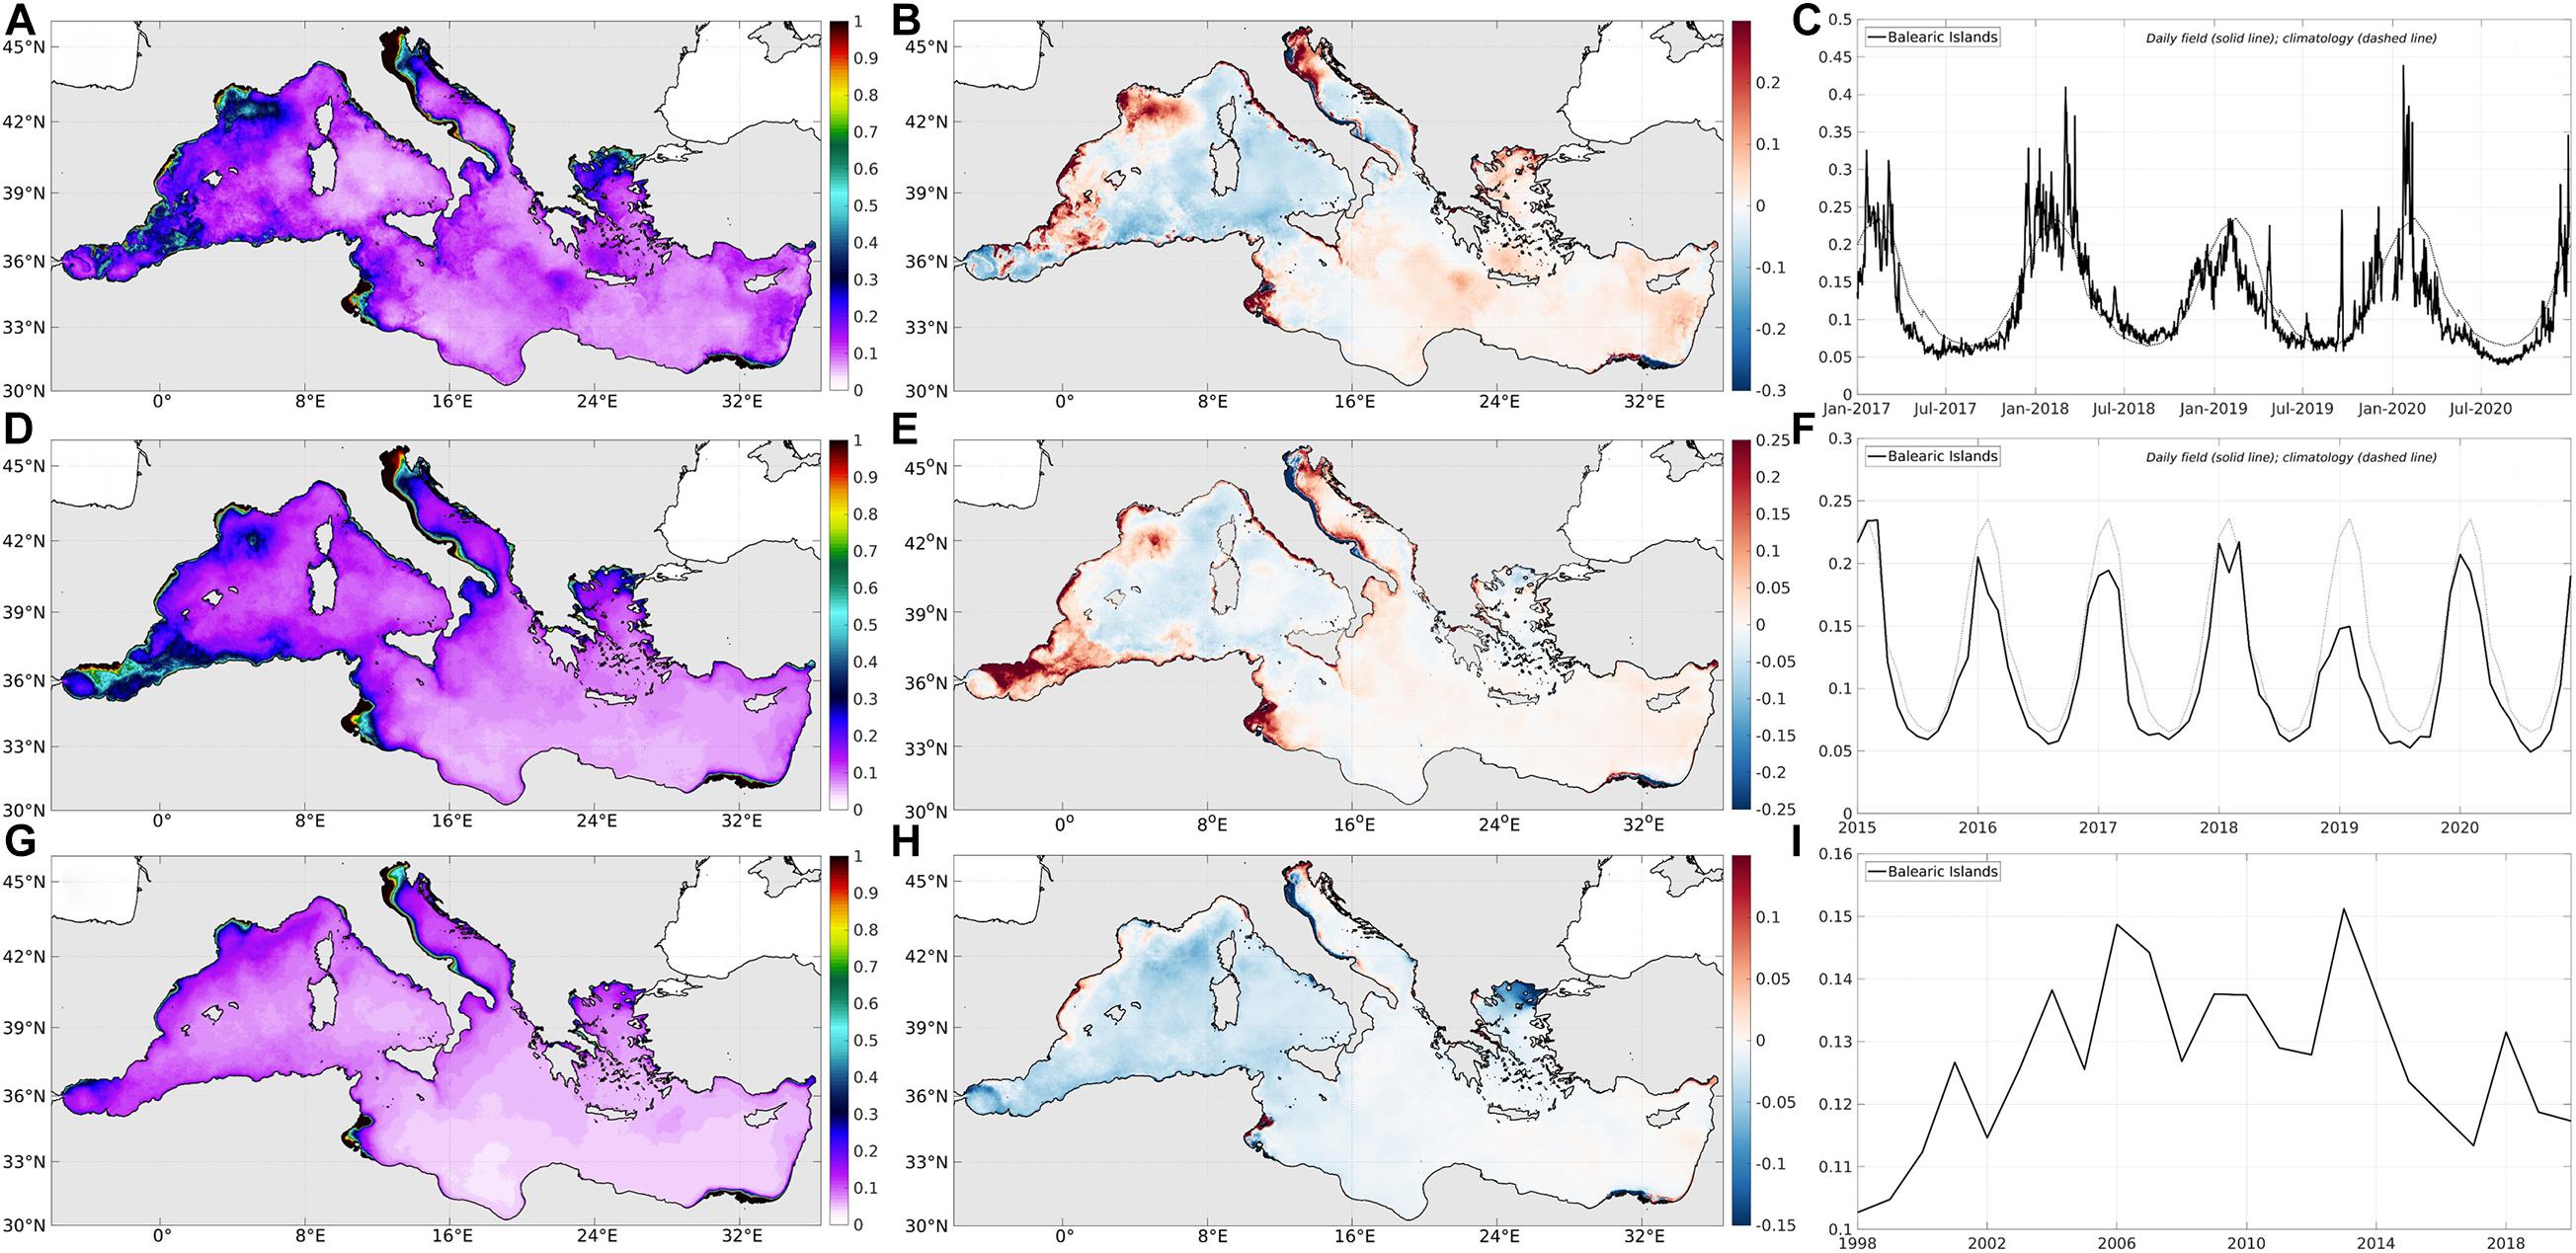
Figure 4. Illustrations for CHL (in mg/m3): daily means on 31-December-2020 (A–C), monthly means in December 2020 (D–F) and annual means in 2020 (G–I): 2D maps of CHL (A,D,G) and CHLA (B,E,H), and time series of CHL averaged in the Balearic Islands since 2017, 2015, and 1998, respectively (C,F,I).
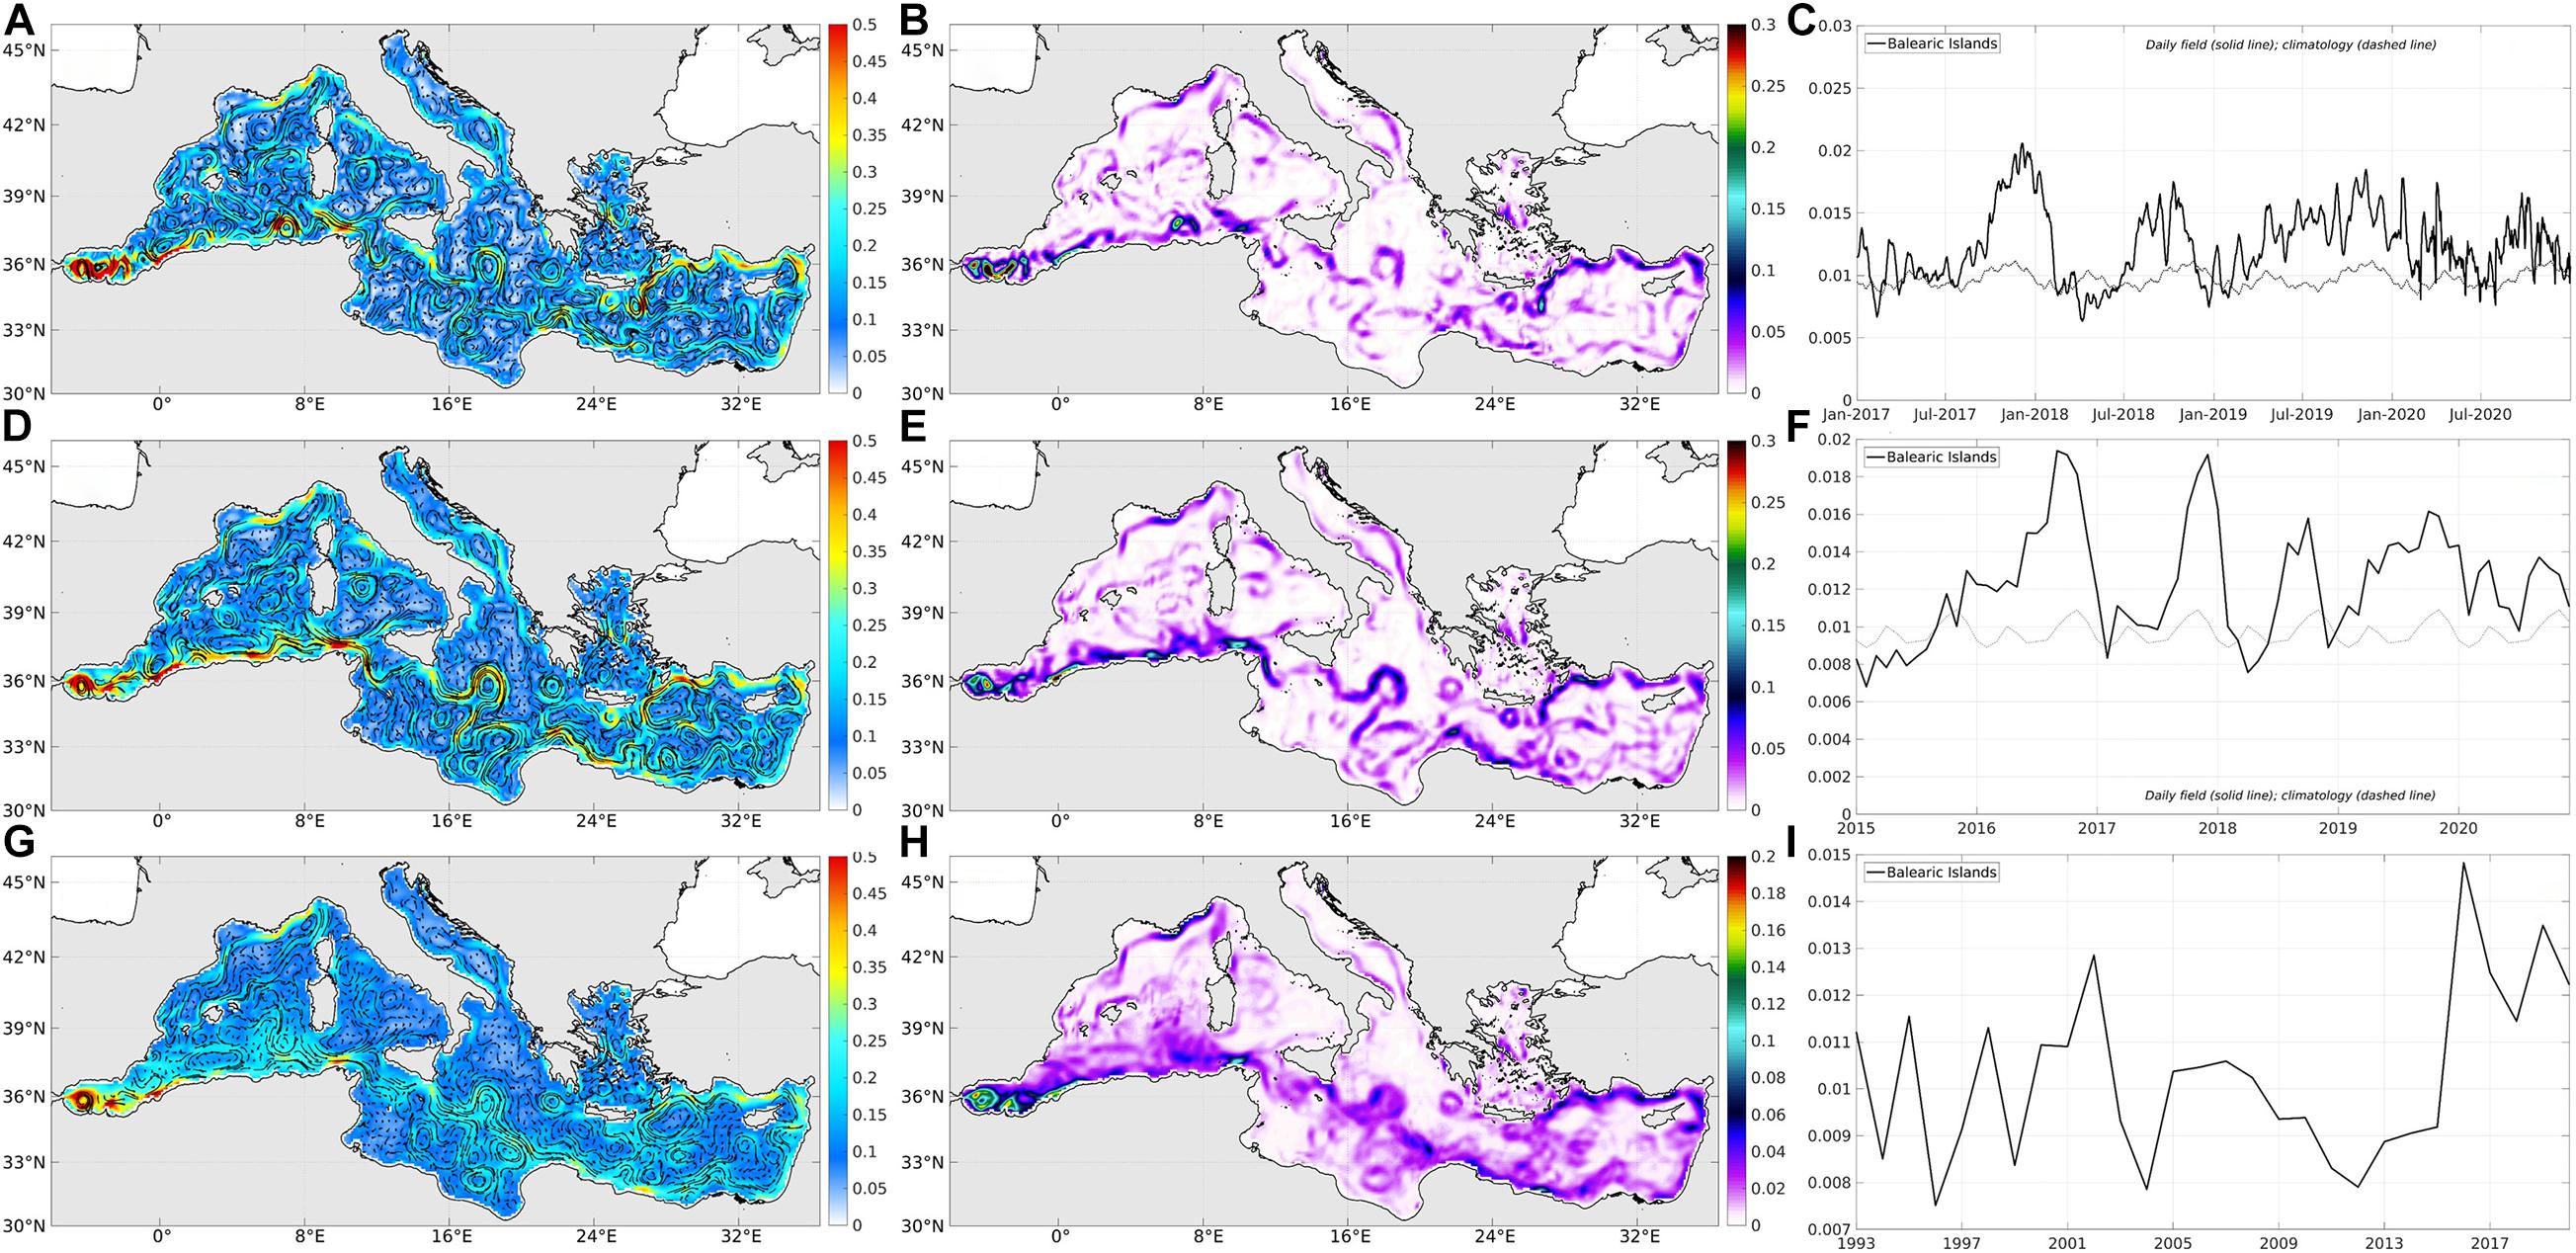
Figure 5. Illustrations for GV (in m/s) and TKE (in m2/s2): daily means on 31-December-2020 (A–C), monthly means in December 2020 (D–F) and annual means in 2020 (G–I): 2D maps of GV (A,D,G) and TKE (B,E,H), and time series of TKE averaged in the Balearic Islands since 2017, 2015, and 1993, respectively (C,F,I).
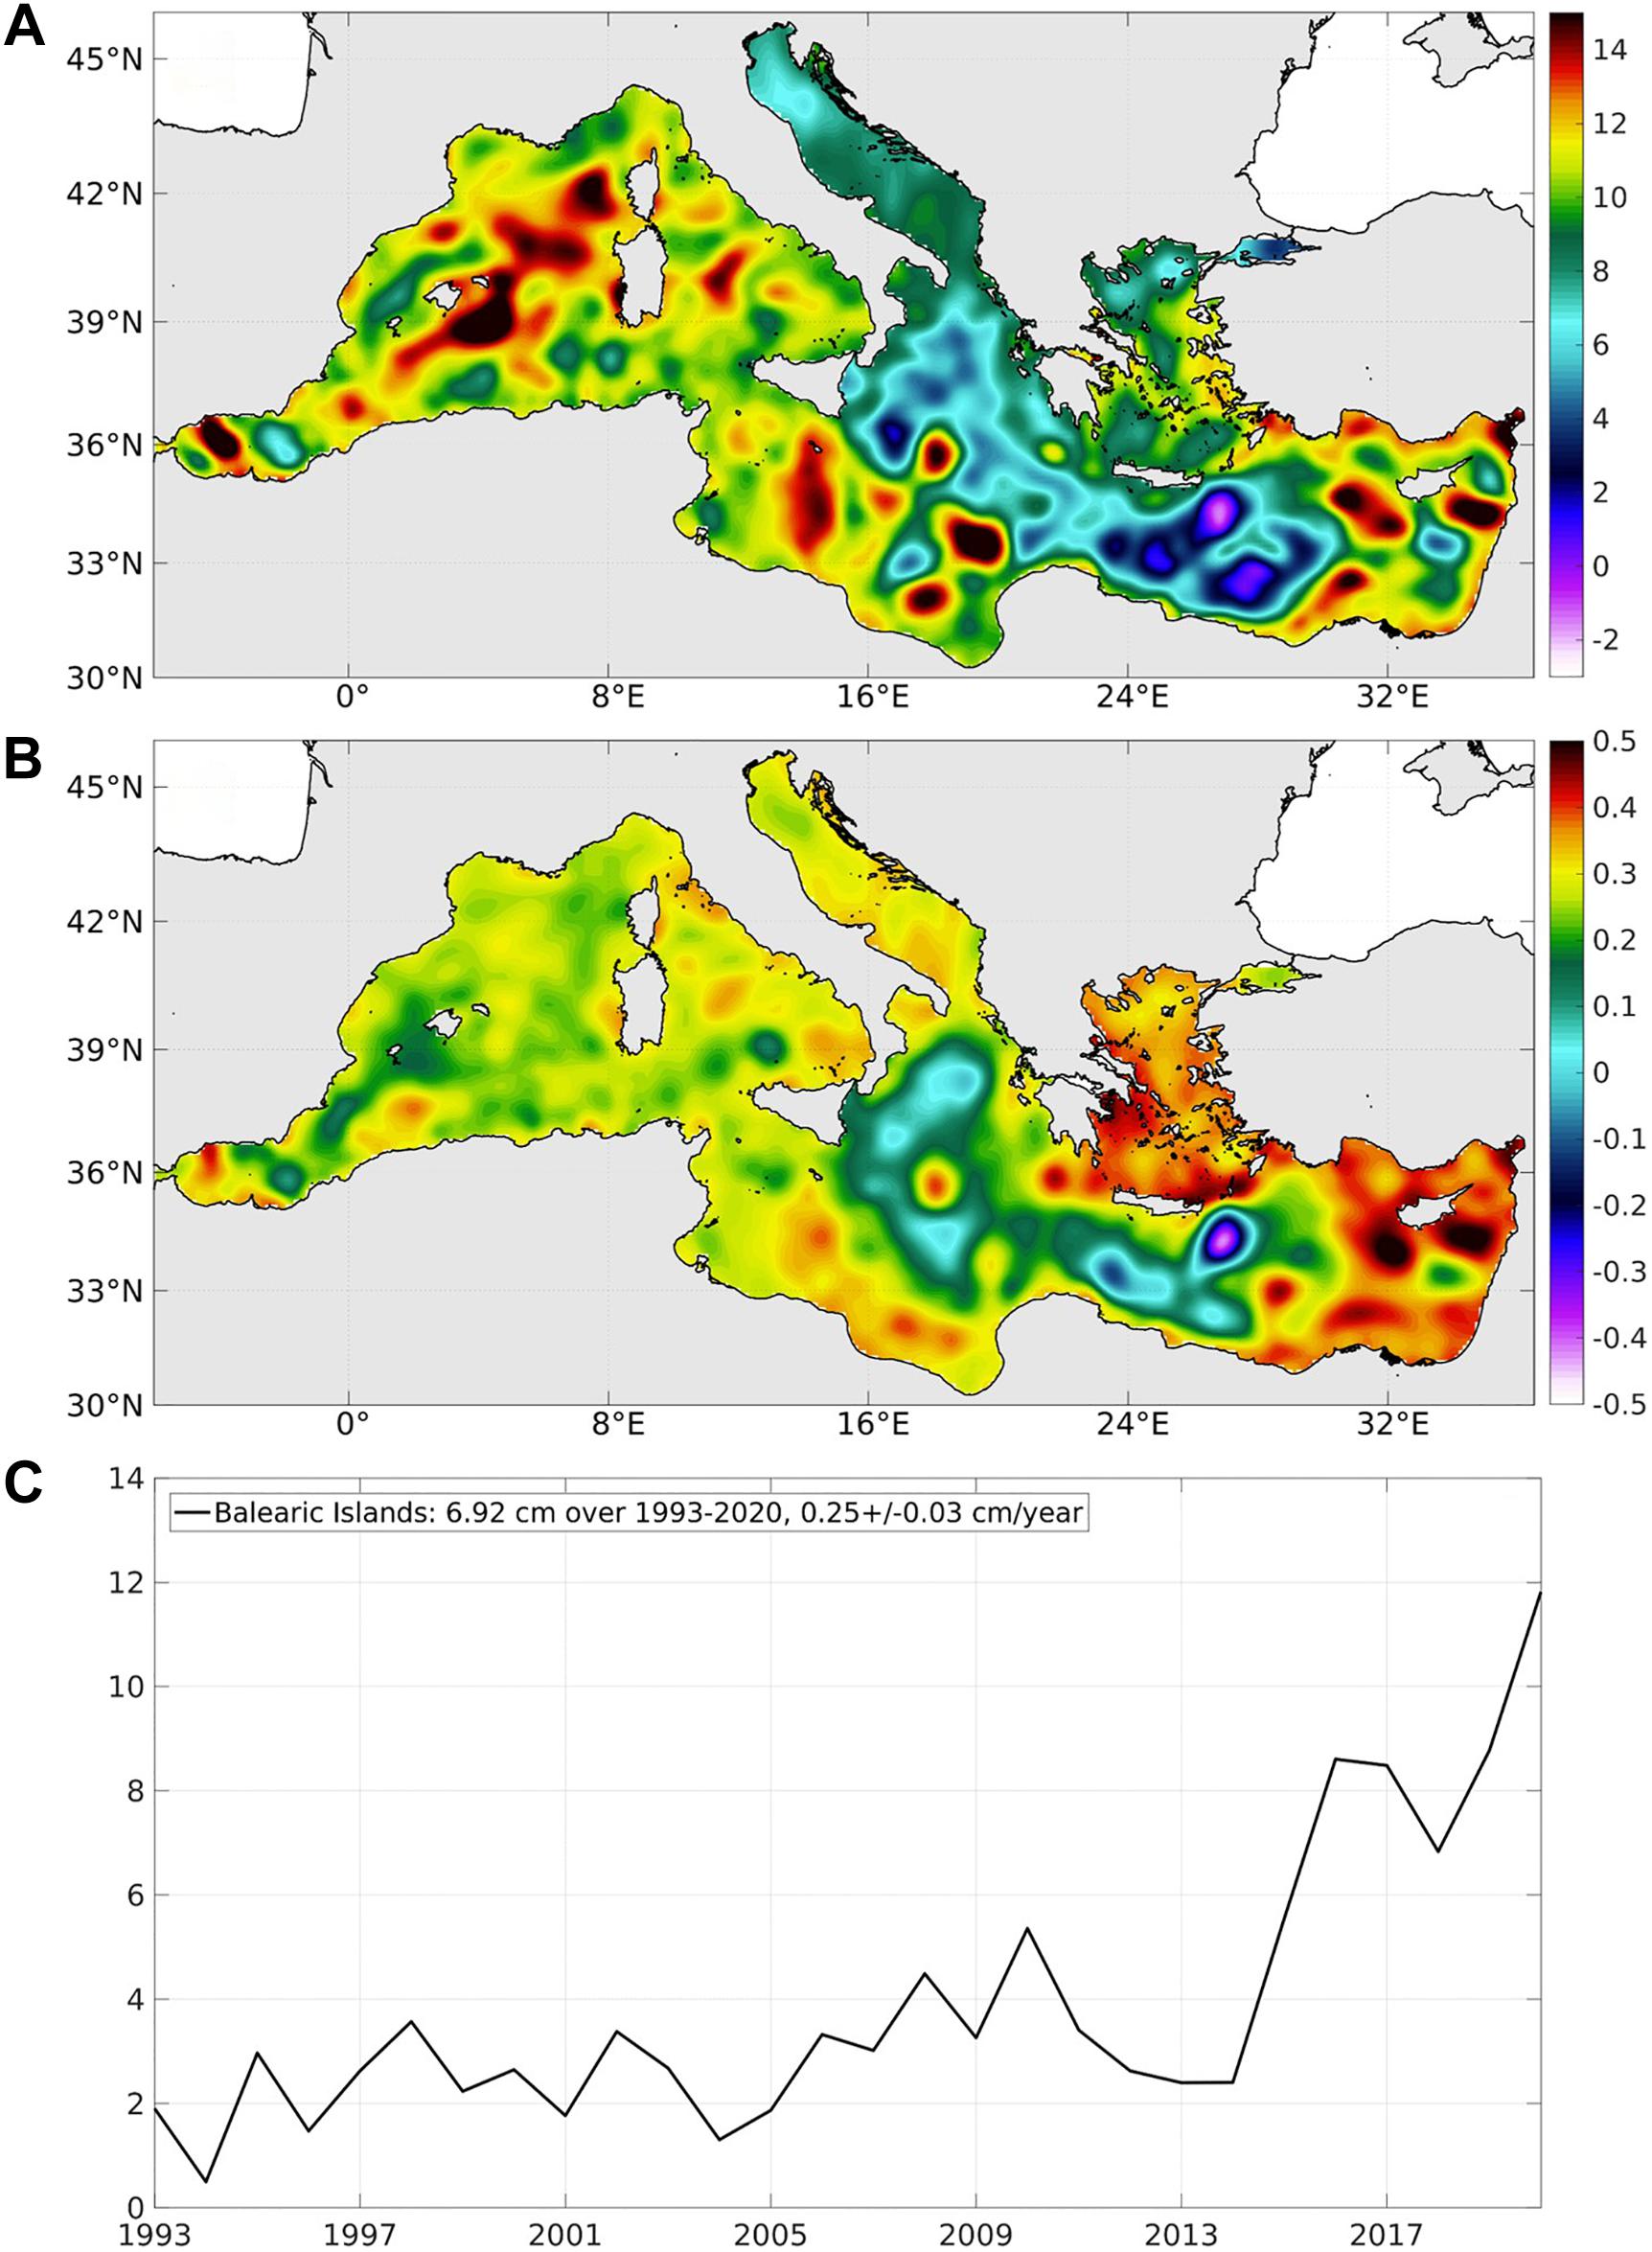
Figure 6. Illustrations for annual mean SLA (in m): 2D maps of mean in 2020 (A) and linear trend over 1993–2020 (B), and time series of SLA averaged in the Balearic Islands since 1993 (C).
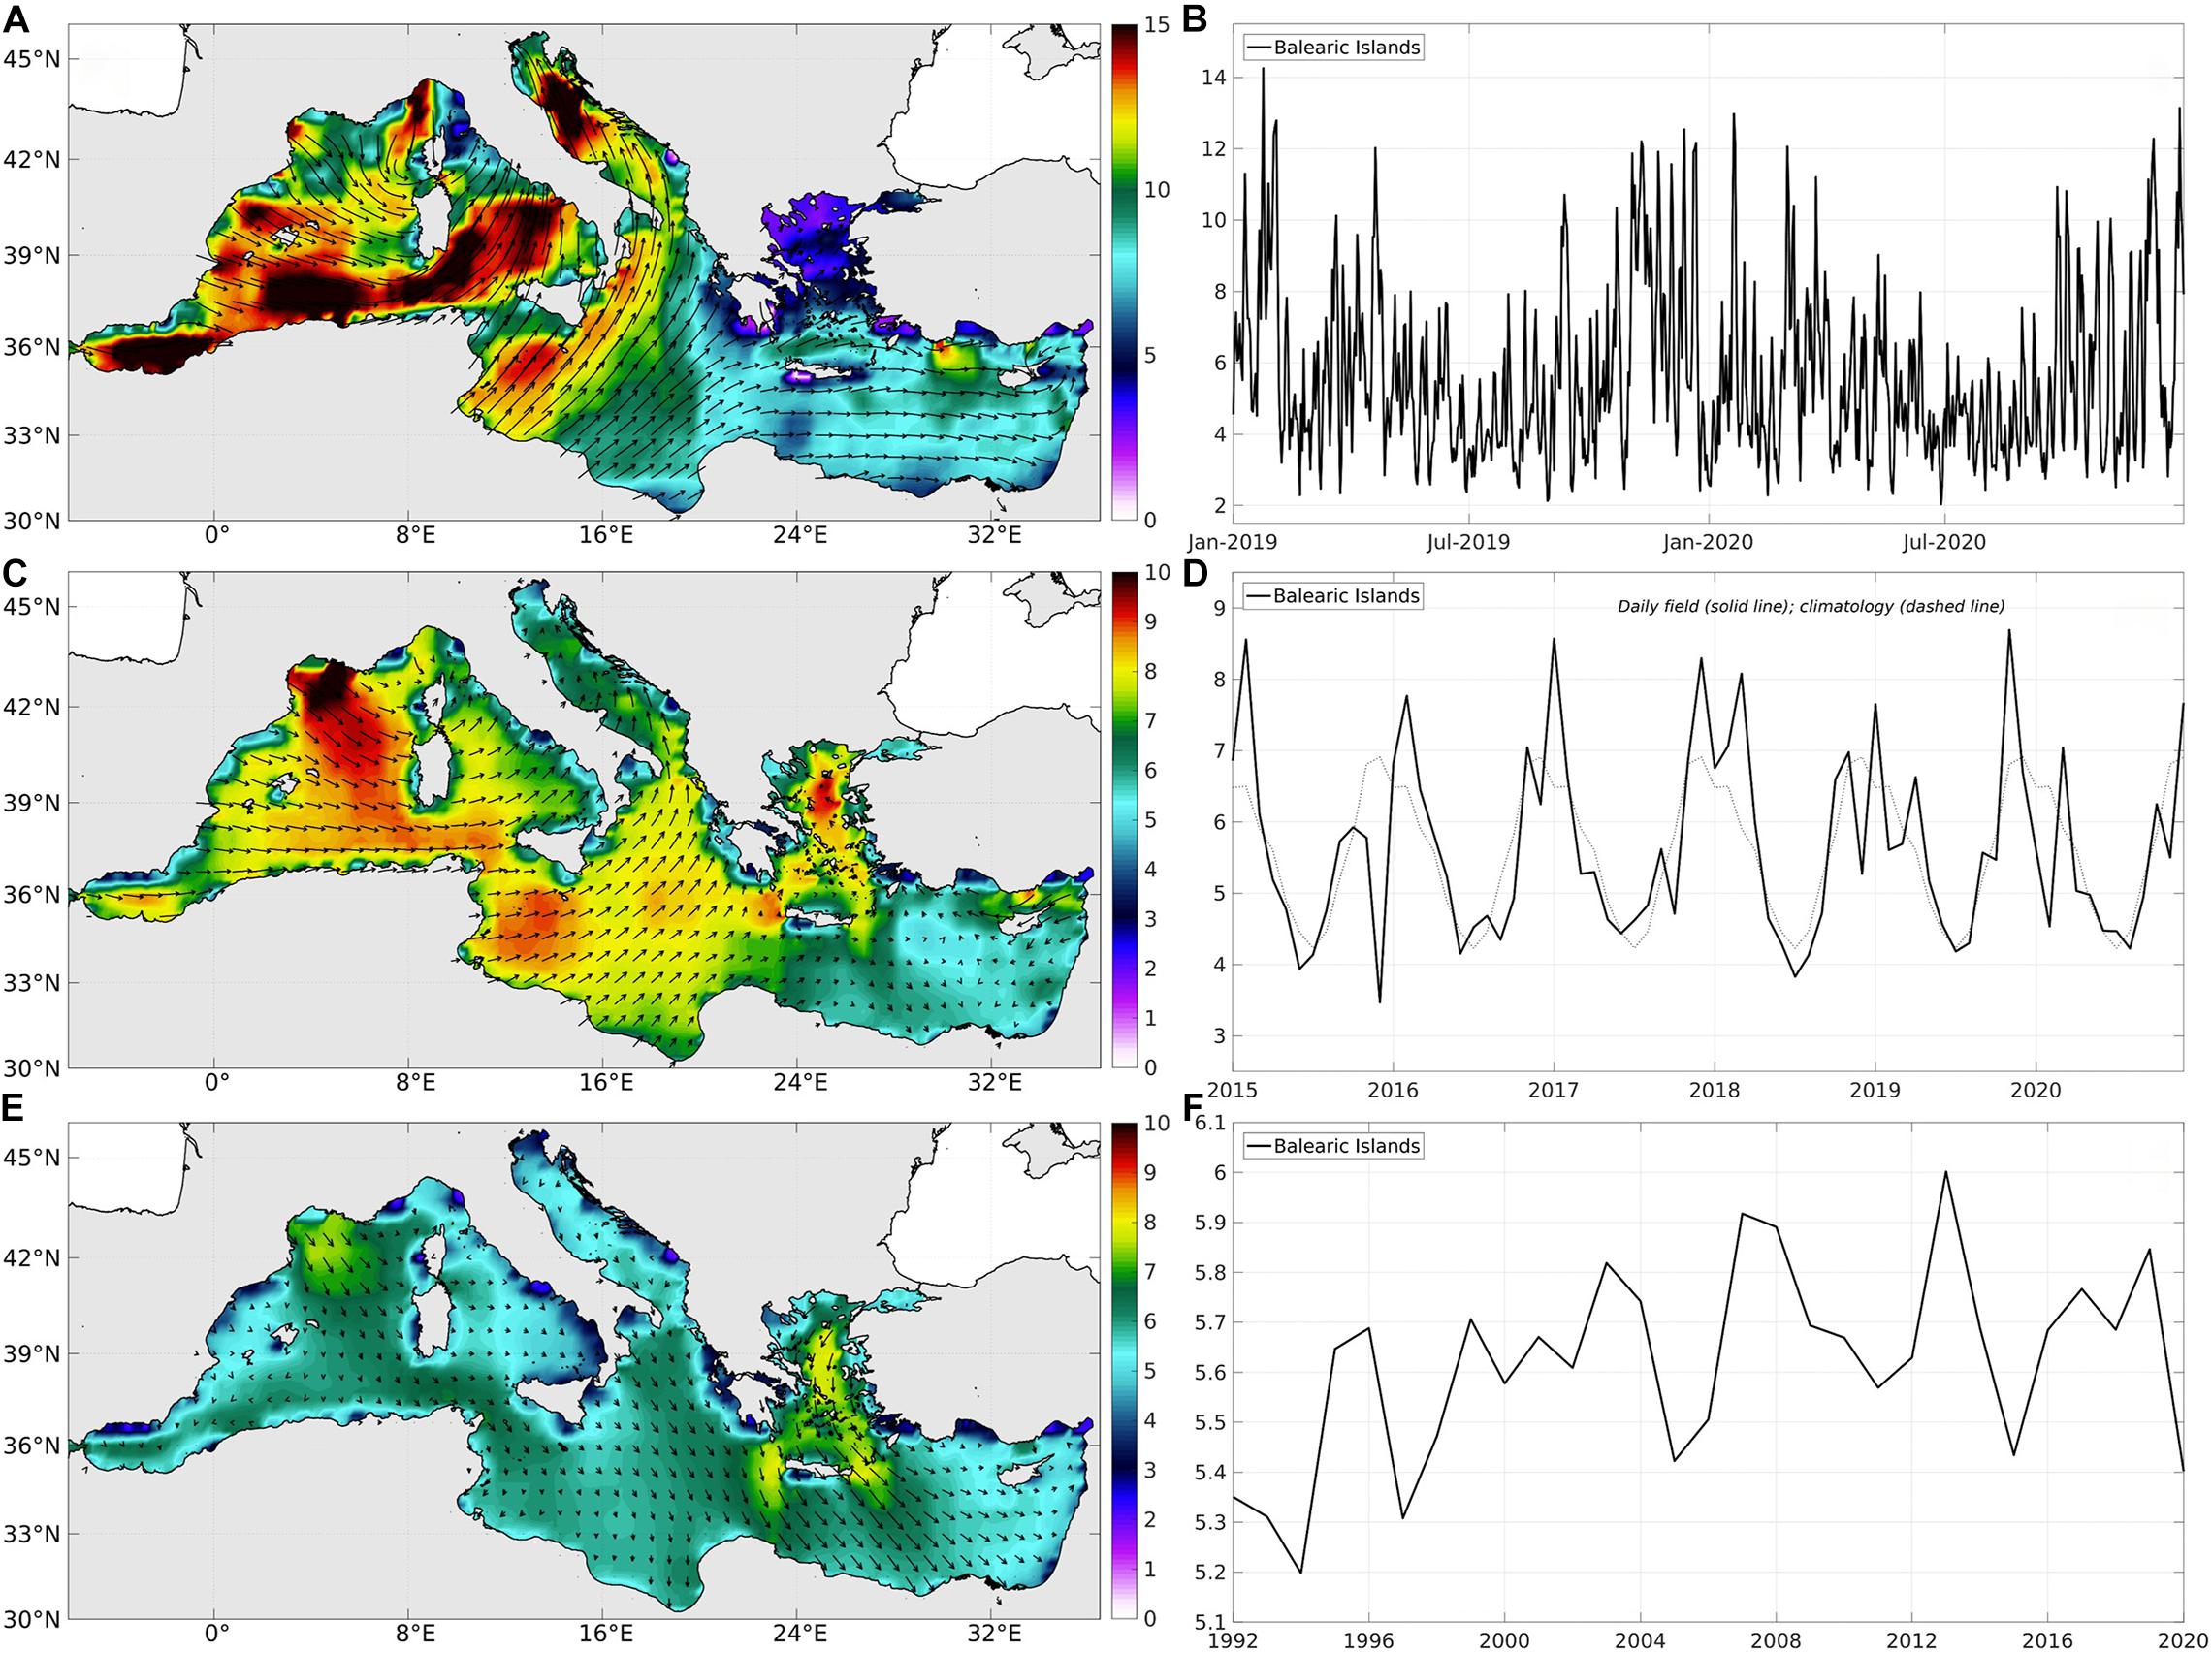
Figure 7. Illustrations for WIND (in m/s): daily mean on 31-December-2020 (A,B), monthly mean in December 2020 (C,D), and annual mean in 2020 (E,F): 2D maps (A,C,E) and time series averaged in the Balearic Islands since 2019, 2015, and 1992, respectively (B,D,F).
Integrated Ocean Variables
Ocean Heat and Salt Contents
The ocean heat and salt contents (OHC and OSC, respectively), derived from subsurface temperature and salinity, enable to address scientific studies including ocean response to climate variability, marine ecosystem activity, sea level change, ocean circulation and variability, global hydrological cycle (von Schuckmann et al., 2018).
OHC and OSC are integrated in a vertical profile as OHC = ∫CpρTdz (in GJ/m2) and OSC = ∫ρSdz (in Mg/m2), where Cp is the specific heat capacity of seawater at a constant pressure, ρ the seawater density, T the temperature, S the salinity and dz the vertical extent of the integration vertical. OHC and OSC are integrated within the upper 10–150 m vertical layer, which strongly and rapidly interacts with the atmosphere, providing a joint monitoring of the temperature and salinity properties in the surface layer. They are computed using the delayed-time quality-controlled temperature and salinity profiles from profiling floats of the EN4.2.1 dataset (Gouretski and Reseghetti, 2010; Good et al., 2013) which is freely available and distributed by Met-Office5. The surface reference depth chosen for these indicators is 10 m because of few available data at surface. Additionally, profiles with very low vertical resolution are rejected. Only the profiles containing data above 10 m and having a minimum resolution of 50 m throughout the vertical are retained. The time series display the medians of the seasonal distribution to exclude extreme values. This approach is more adapted that the use of mean since the distributions of the ocean hydrographic properties are not Gaussian (Vargas-Yáñez et al., 2020). Together with the median, the 17 and 83th percentiles provide complementary information about the width and asymmetry of the regional distribution.
Mixed Layer Properties
The mixed layer is the upper ocean layer where many oceanic processes occur such as ocean-atmosphere exchanges (e.g., mass, momentum, energy, freshwater, heat), biological and biogeochemical processes, deep convection, marine ecosystem activity, climate variability, ocean circulation and variability (D’Ortenzio et al., 2005).
Hydrographic vertical profiles from the same product as in Section “Ocean Heat and Salt Contents” are used to monitor the mixed layer depth, temperature and salinity (MLD, MLT, and MLS). The MLD is calculated using a density criterion with a threshold value Δσθ corresponding to a fixed ΔT = 0.2°C with respect to the 10 m reference depth, which has been shown to be a suitable criterion in the Mediterranean (D’Ortenzio et al., 2005). This criterion corresponds to Δσθ values oscillating around 0.05 kg/m3 in the different sub-regions of the study. As for OHC and OSC, the surface depth is fixed at 10 m, the distance between two successive data along one profile must not exceed 50 m, and the time series of MLT and MLS show the medians and the 17 and 83th percentiles of the distributions. For the MLD, the time series display the depth maxima which is preferred as indicator since it provides information on deep convection events.
Water Mass Transports
The Balearic Channels (Ibiza and Mallorca Channels, hereafter IC and MC, respectively) are of major interest since they control the meridional fluxes of the western Mediterranean. The water mass exchanges between the northern and southern sub-basins occur through these channels (Heslop et al., 2012; Juza et al., 2013, 2019; Barceló-Llull et al., 2019). The NC flows southwards along the Spanish coast. Approaching the north of the IC, this strong permanent current bifurcates into two branches, one following southward through the IC and the other flowing eastward to form the Balearic Current (BC) along the Balearic Islands shelf (Pinot et al., 1995). The fresh Atlantic Water (AW) entering at Gibraltar Strait may then flow through the IC and MC and join the BC. The monitoring of water mass transports allows addressing key science processes (e.g., water mass exchanges at choke point, coastal shelf-open sea water mass formation and variability, ocean circulation and variability, changes in marine ecosystem activity, ocean response to climate change; Heslop et al., 2012) and is made possible through the sustainable glider observing system at national and regional scales (Testor et al., 2019).
In the Balearic Channels, gliders operated by SOCIB following a semi-continuous endurance line are deployed since 2011 (Heslop et al., 2012; Tintoré et al., 2013). Slocum deep gliders provide high-resolution hydrographic data between depths of 20 and 950 m with a horizontal resolution of approximately 2 km. The delayed-time L1 product of temperature and salinity6 (Heslop et al., 2012; Troupin et al., 2015; Tintoré et al., 2019b) is used to compute the geostrophic velocity and to monitor the geostrophic transports in the IC and MC (Heslop et al., 2012), specifying the different water mass contributions. The typical water masses of the western Mediterranean are identified: the recent and modified AW, the Western Intermediate Water (WIW), the Levantine Intermediate Water (LIW) and the Western Mediterranean Deep Water (WMDW). The recently developed geometry-based criterion (Juza et al., 2019), which has been shown to detect more properly WIW than “classical” fixed-range method, is implemented and used for the WIW detection.
Time Series
The vertically integrated variables - OHC, OSC, MLD, MLT, and MLS –, are computed using the profiles from profiling floats in the Mediterranean. To have a reasonable amount of profiles in the different sub-regions, the diagnostics deal with seasonal distributions of profiles and the time series are displayed since 2011. The seasons are defined as follows: winter (January, February, March), spring (April, May, June), summer (July, August, September), and autumn (October, November, December). The time series of the northward and southward geostrophic transports of water masses in the Balearic Channels are initiated in January 2011, when the SOCIB endurance-line started. They are automatically updated once new delayed-time mission is available and distributed in the SOCIB thredds server. The diagnostics for the vertically integrated variables are shown in Figures 8–10 (Table 4) and analyzed in Section “MEDITERRANEAN SPATIO-TEMPORAL VARIABILITY: RESULTS AND DISCUSSION.”
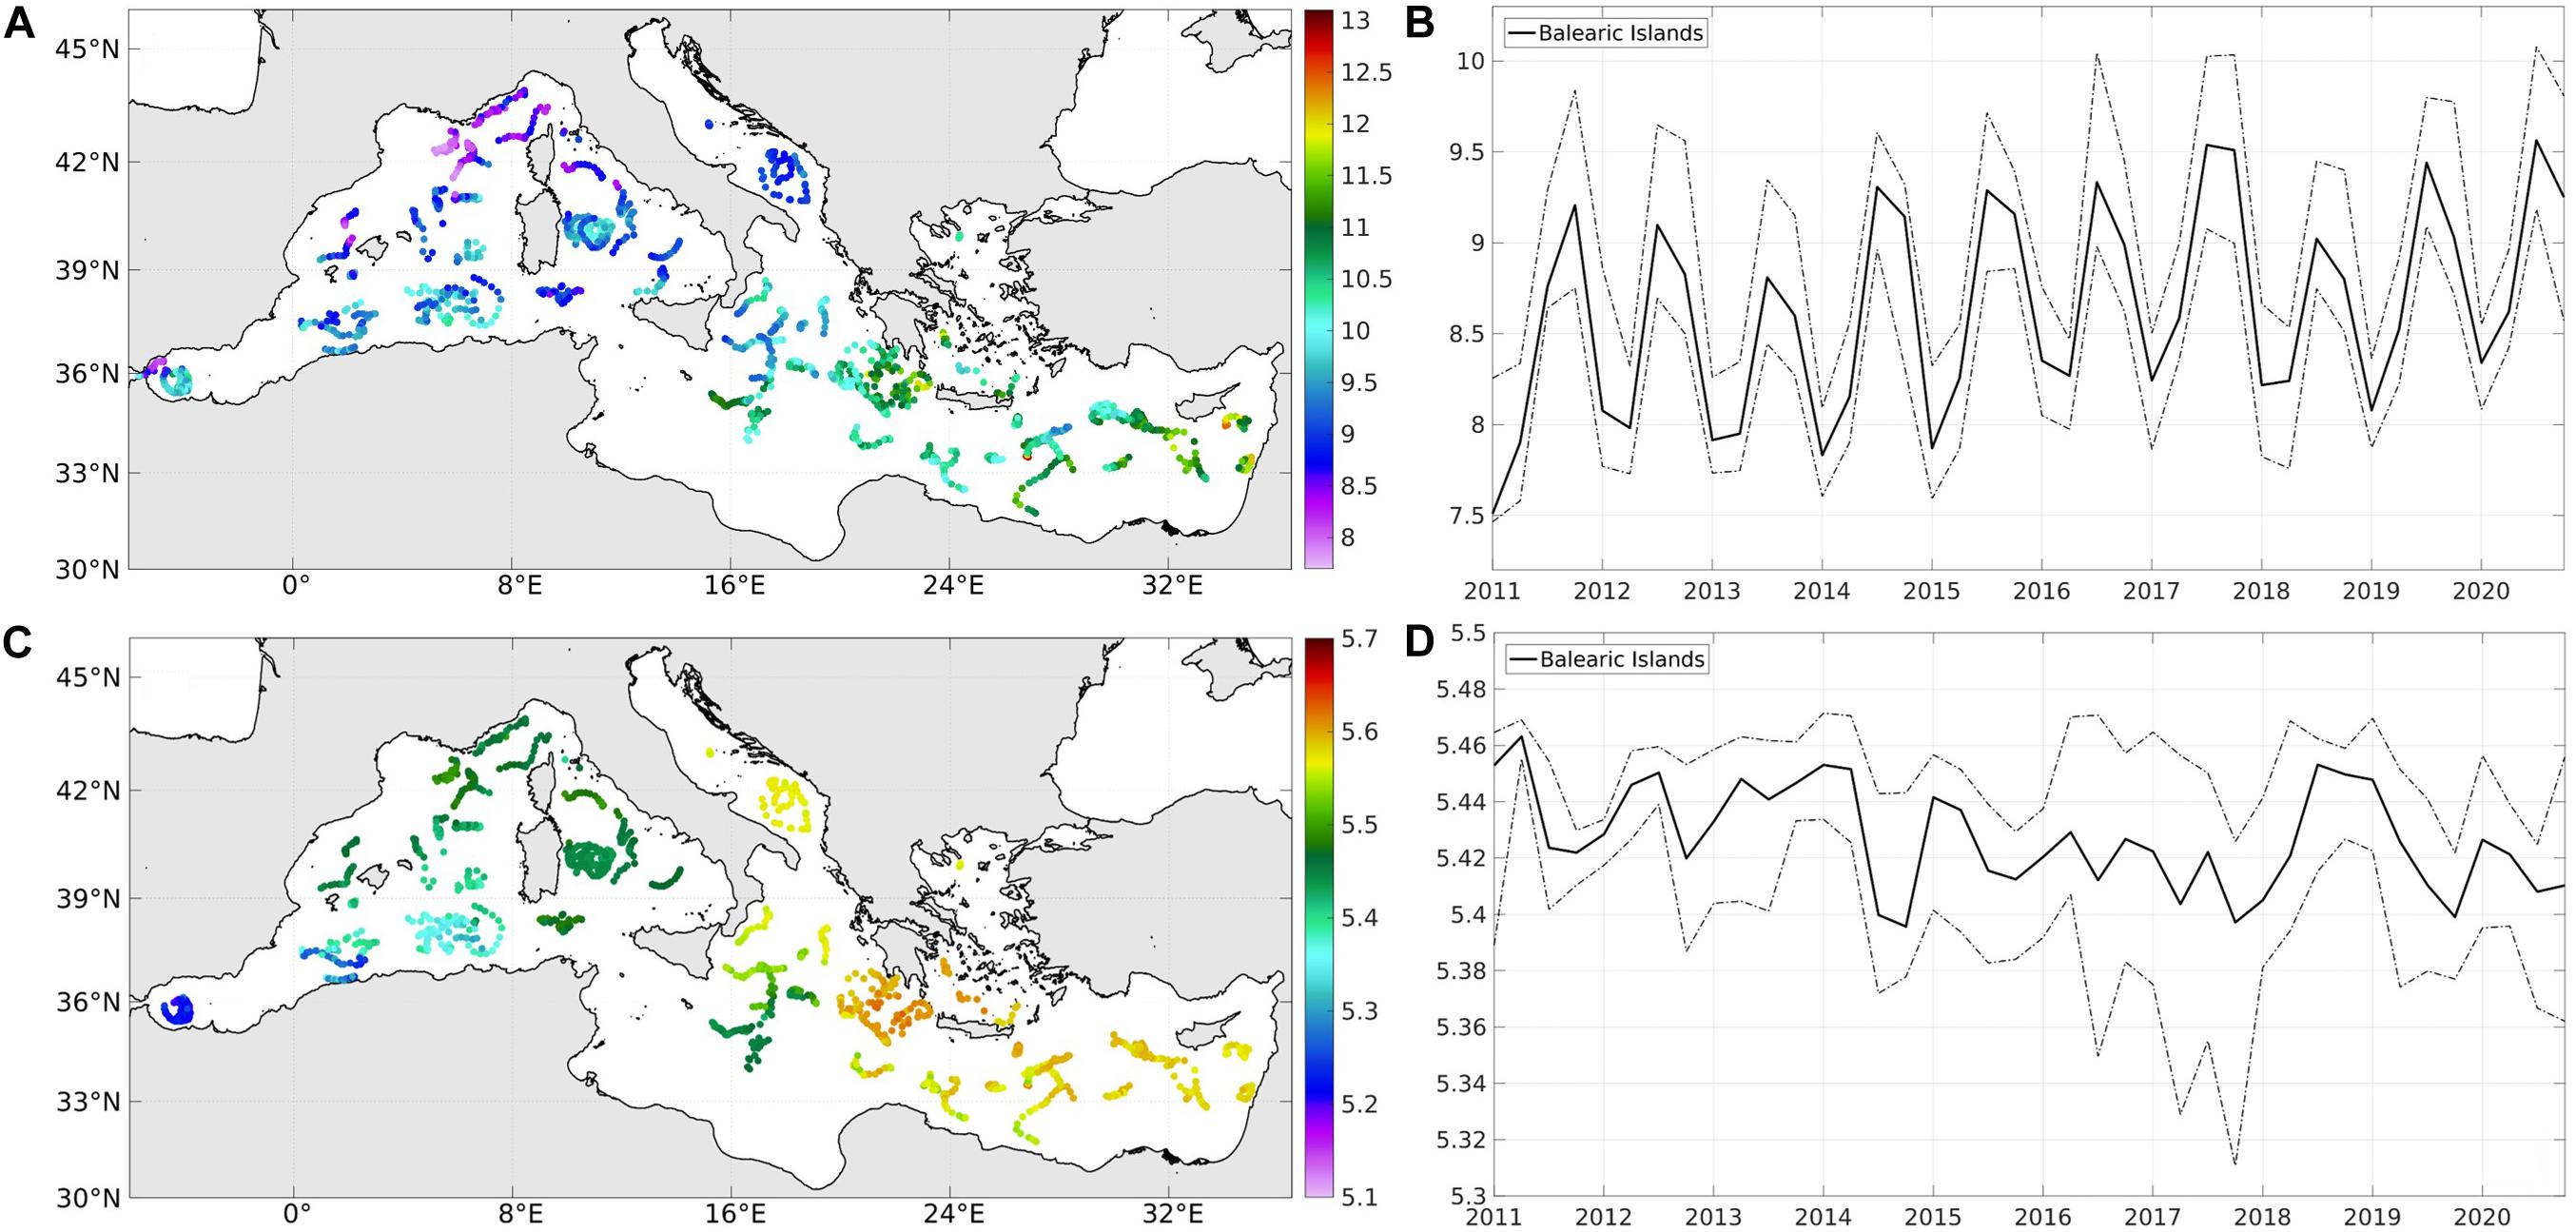
Figure 8. Illustrations for the seasonal OHC (in GJ/m2) (A,B) and OSC (in Mg/m2) (C,D) integrated within [10–150 m]: 2D maps of OHC (A) and OSC (C) in autumn 2020, time series of the medians (solid lines), 17 and 83th percentiles (dashed lines) of seasonal OHC (B) and OSC (D) in the Balearic Islands since 2011.
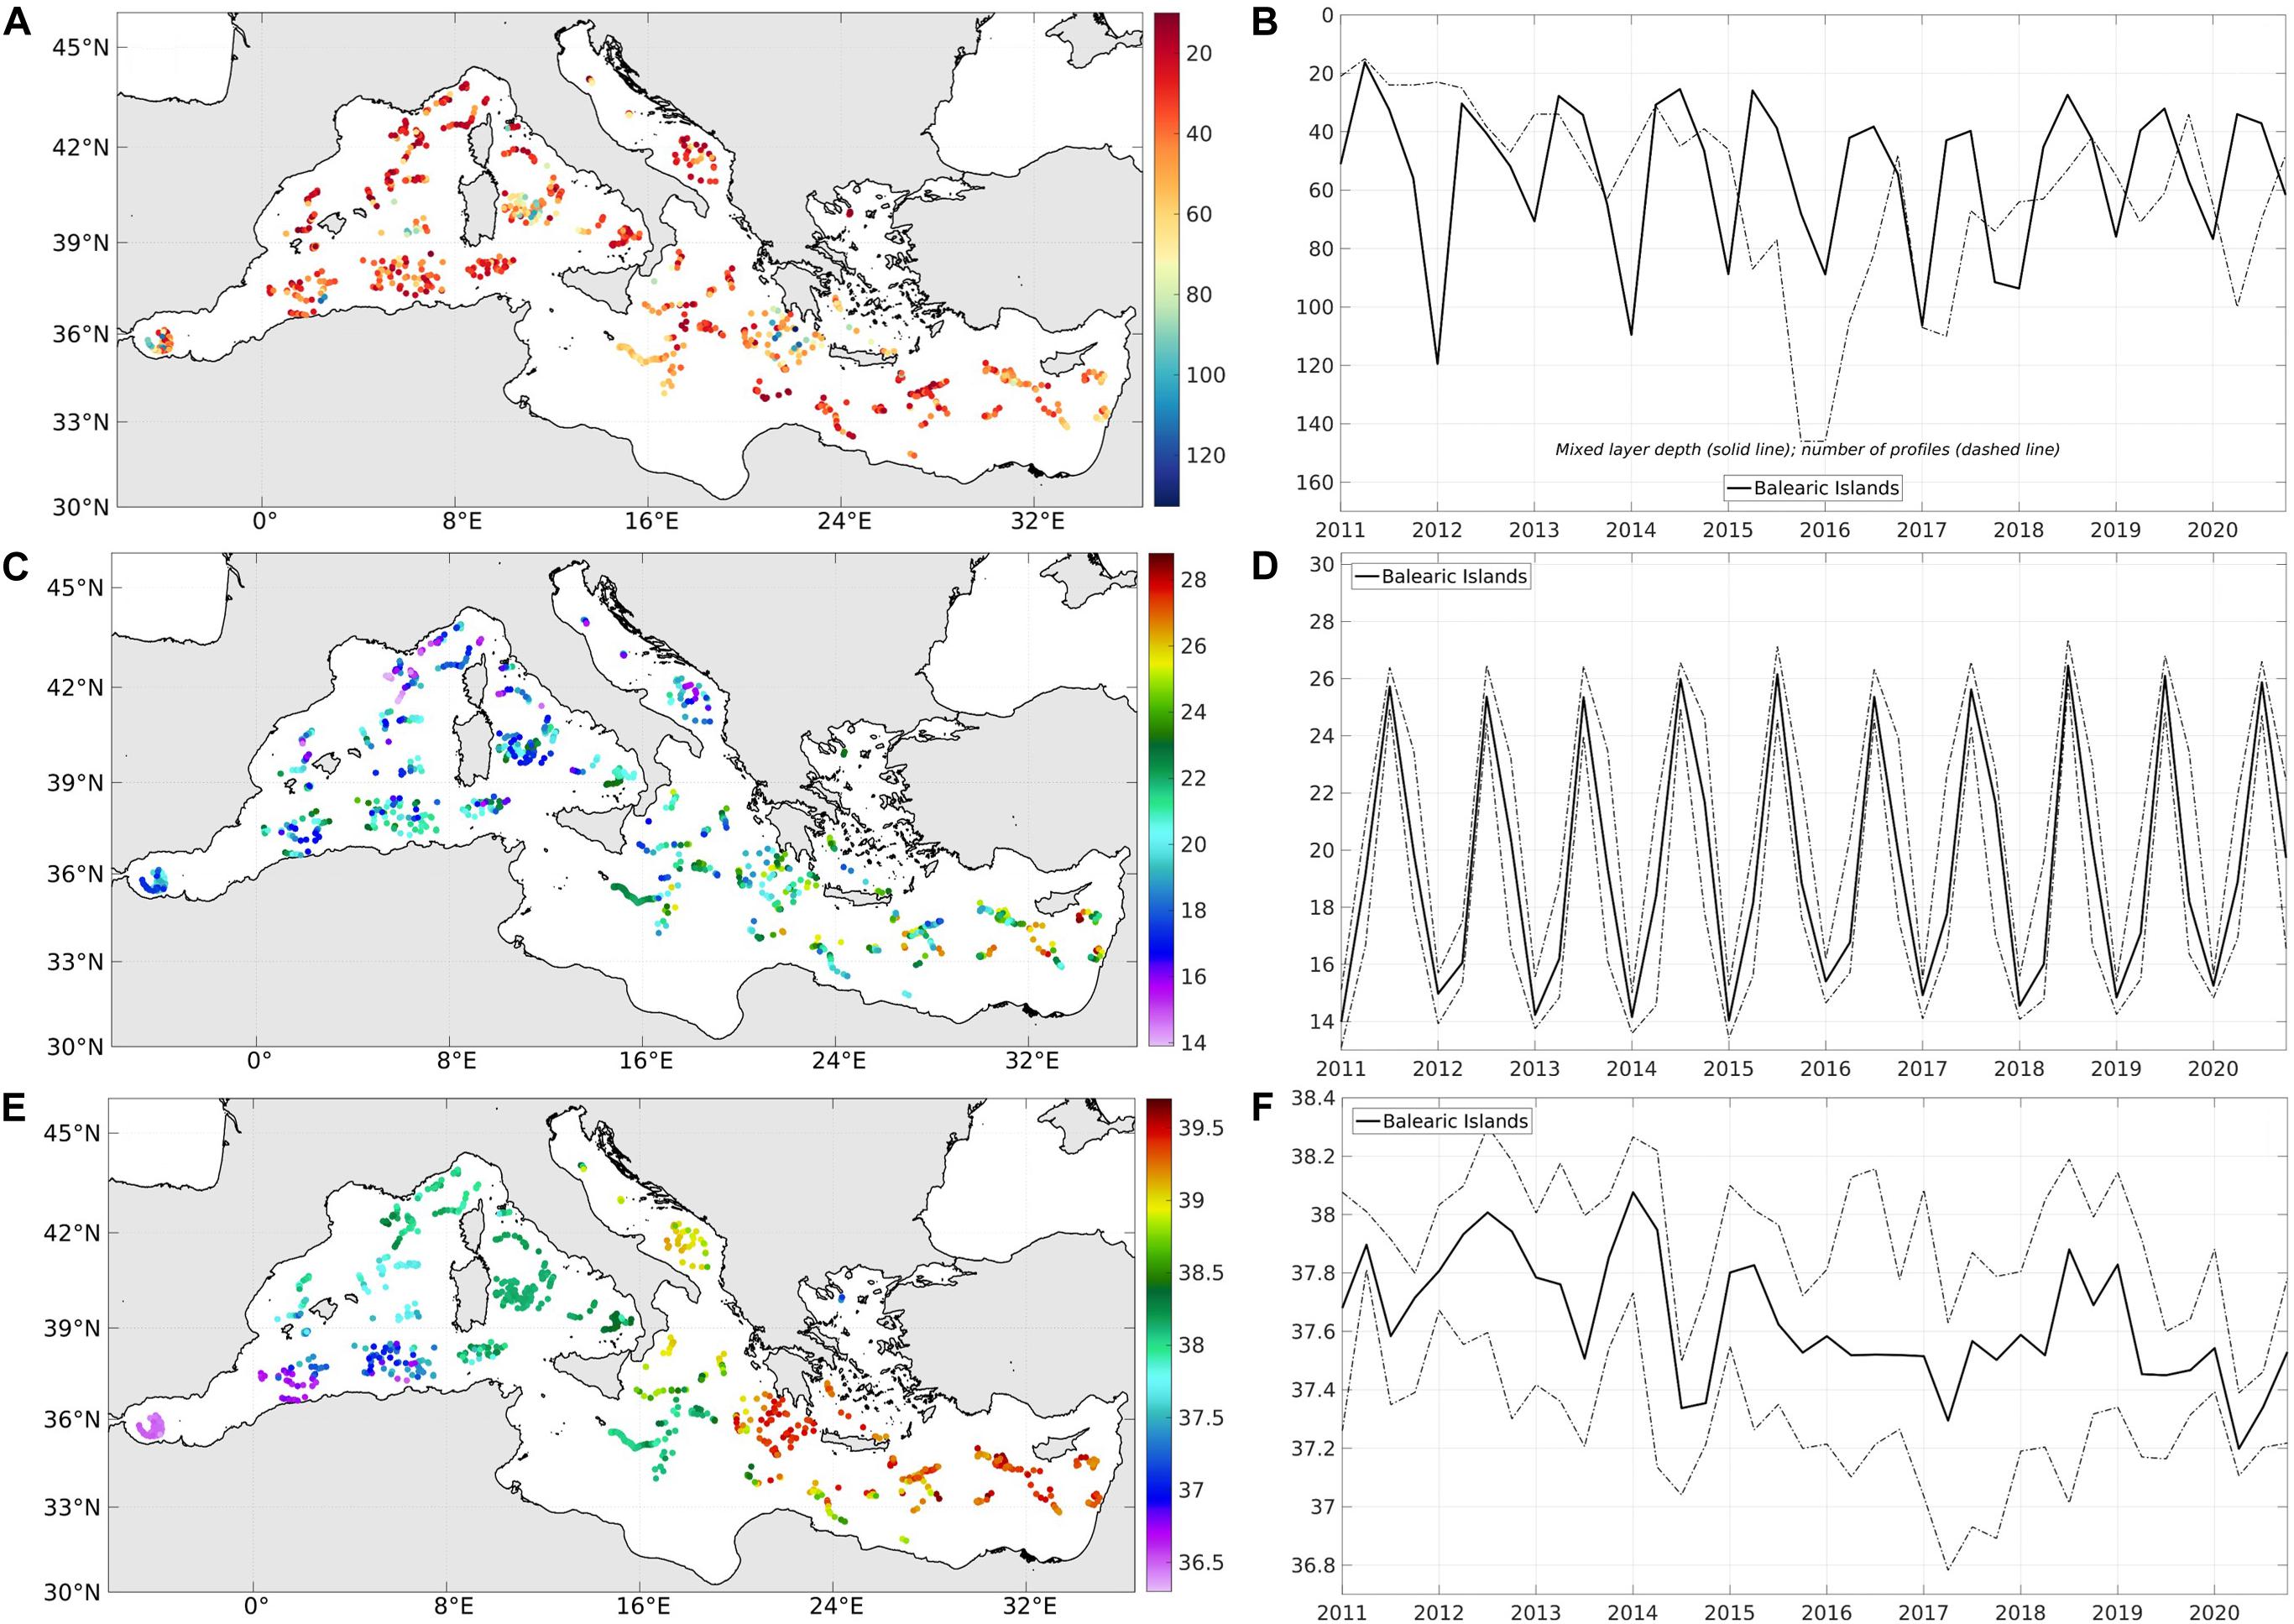
Figure 9. Illustrations for the seasonal MLD (in m) (A,B), MLT (in °C) (C,D), and MLS (E,F): 2D maps of MLD (A), MLT (C), and MLS (E) in autumn 2020, and time series of the MLD maxima (solid line) with associated number of profiles (dashed line) (B), and the MLT (D) and MLS (E) medians (solid lines), 17 and 83th percentiles (dashed lines) in the Balearic Islands since 2011.
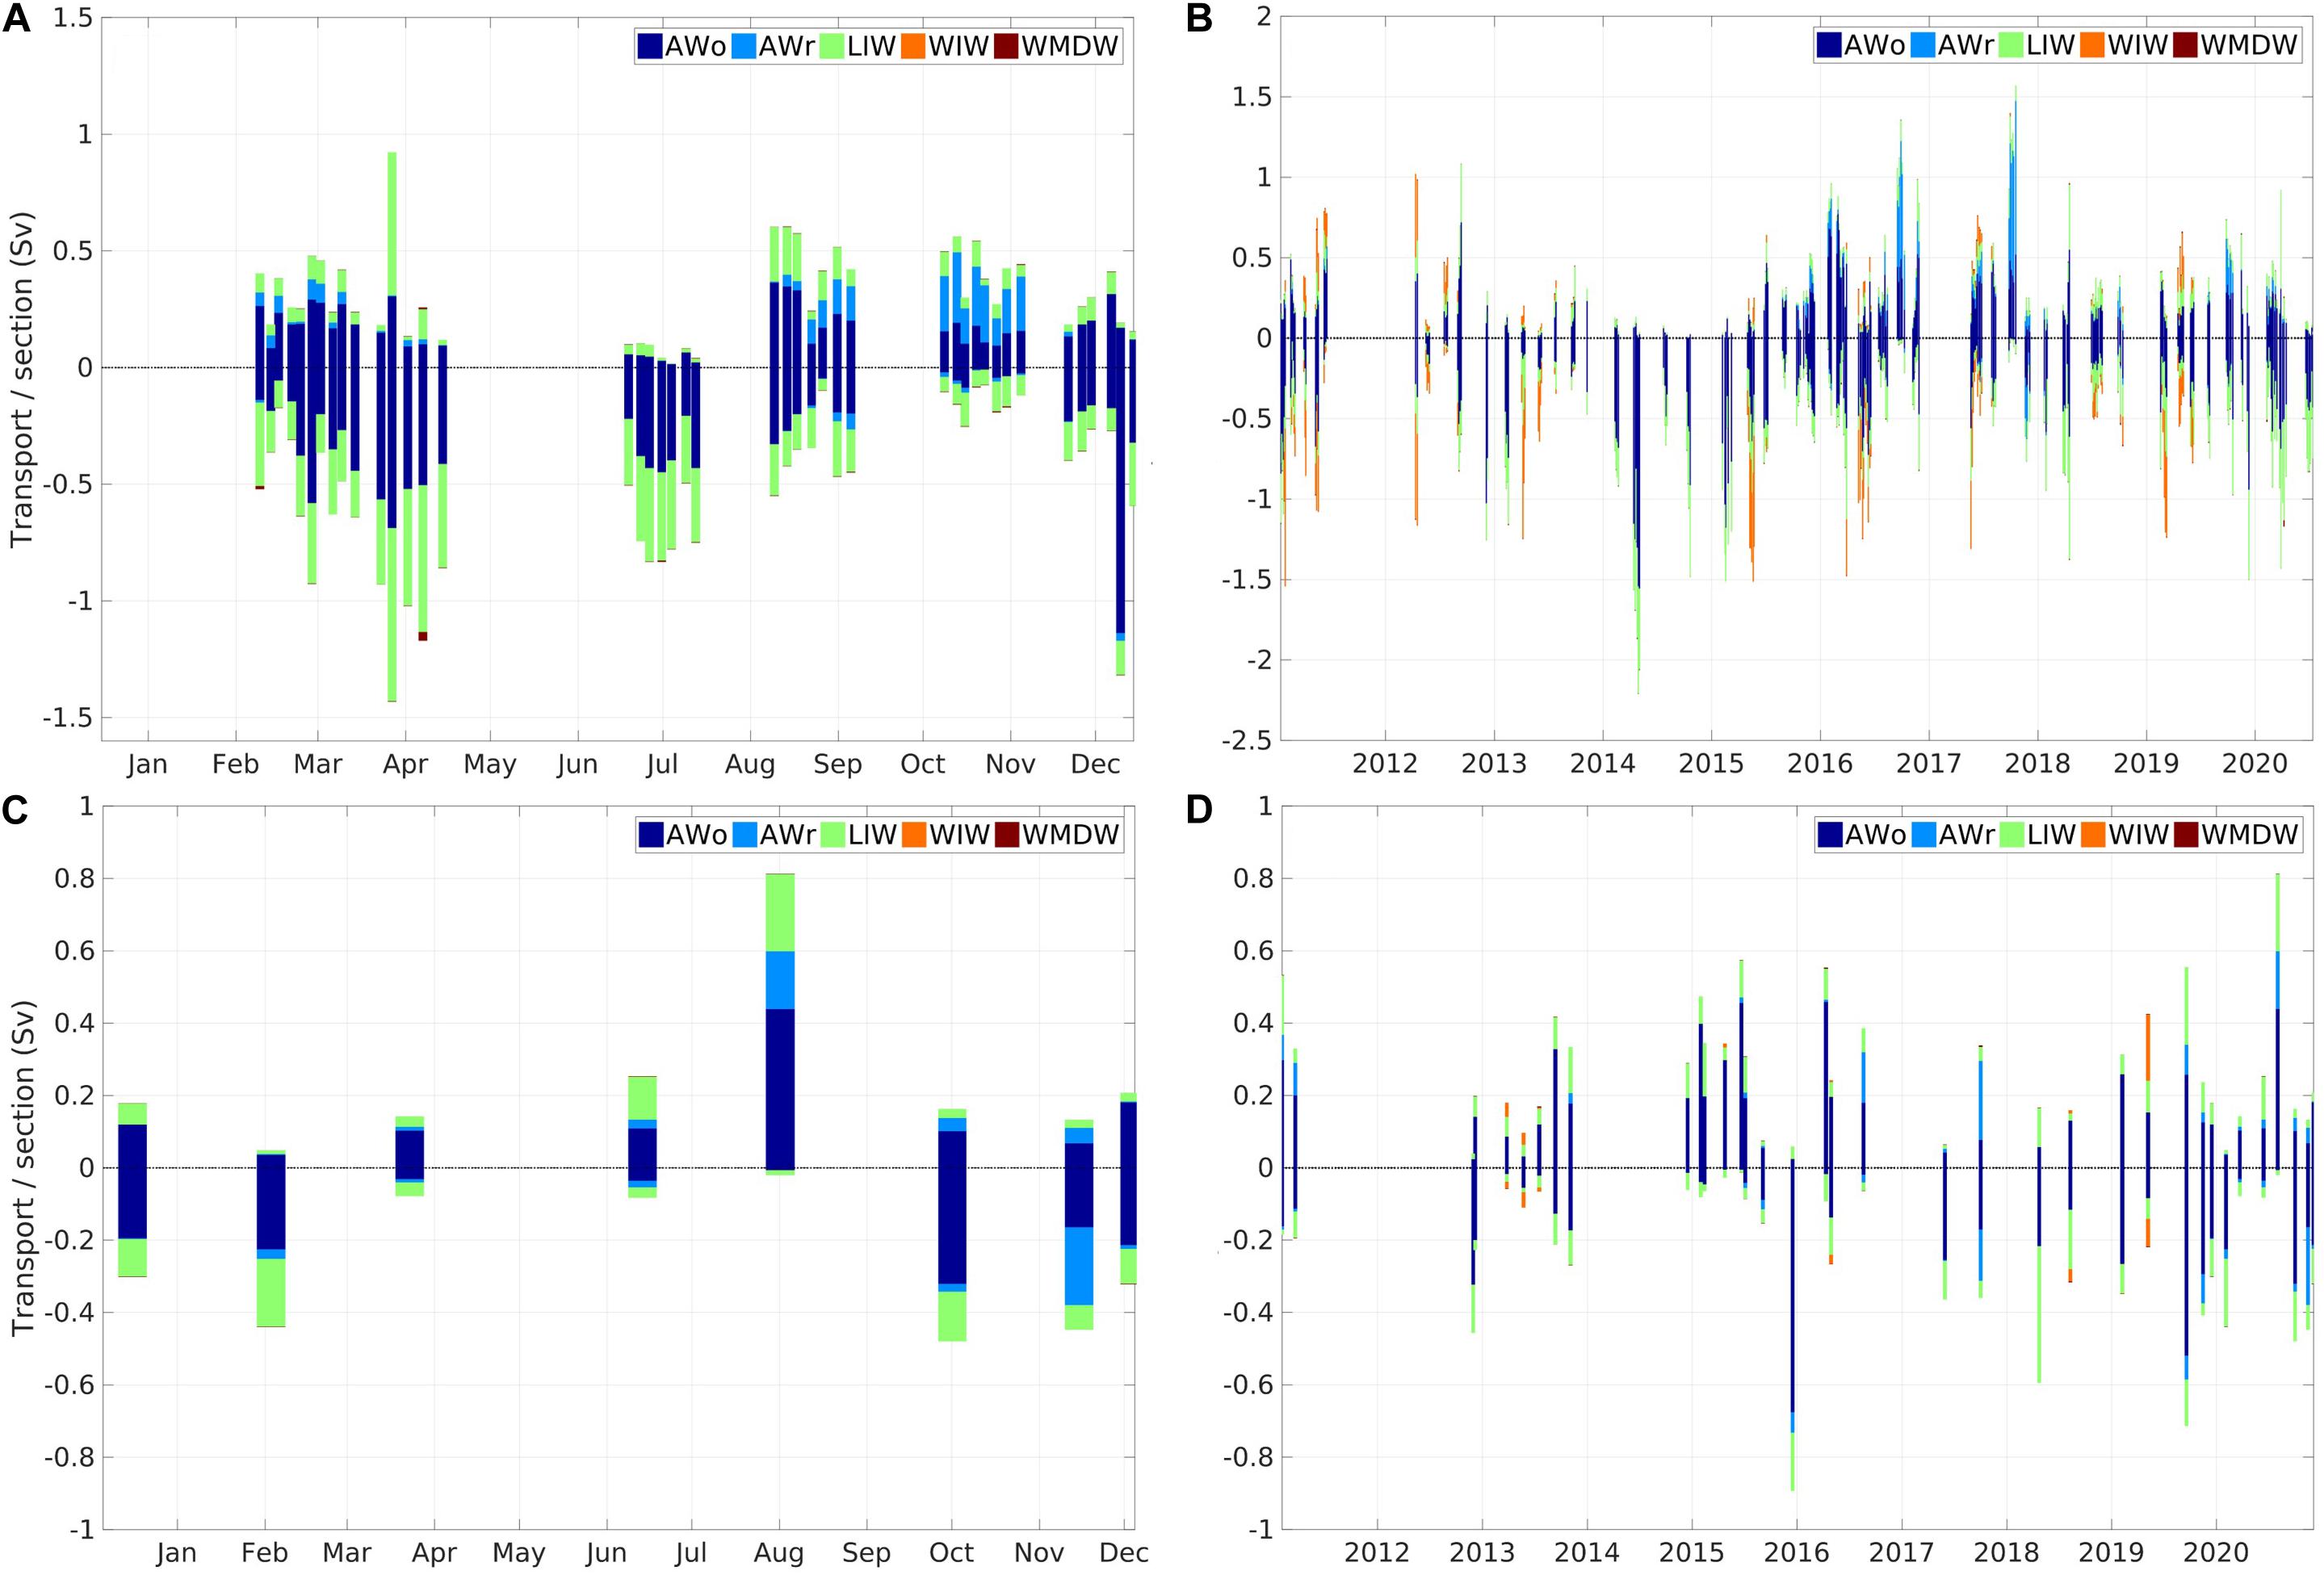
Figure 10. Water mass transports in the IC (A,B) and MC (C,D) for the last year (A,C) and over all the available period since 2011 (B,D). Each bar correspond to the transport integrated over one completed transect (around 3-day duration). Colors are associated with typical water masses of the WMED: recent and modified AW (light and dark blue, respectively), WIW (orange), LIW (green), and WMDW (red).
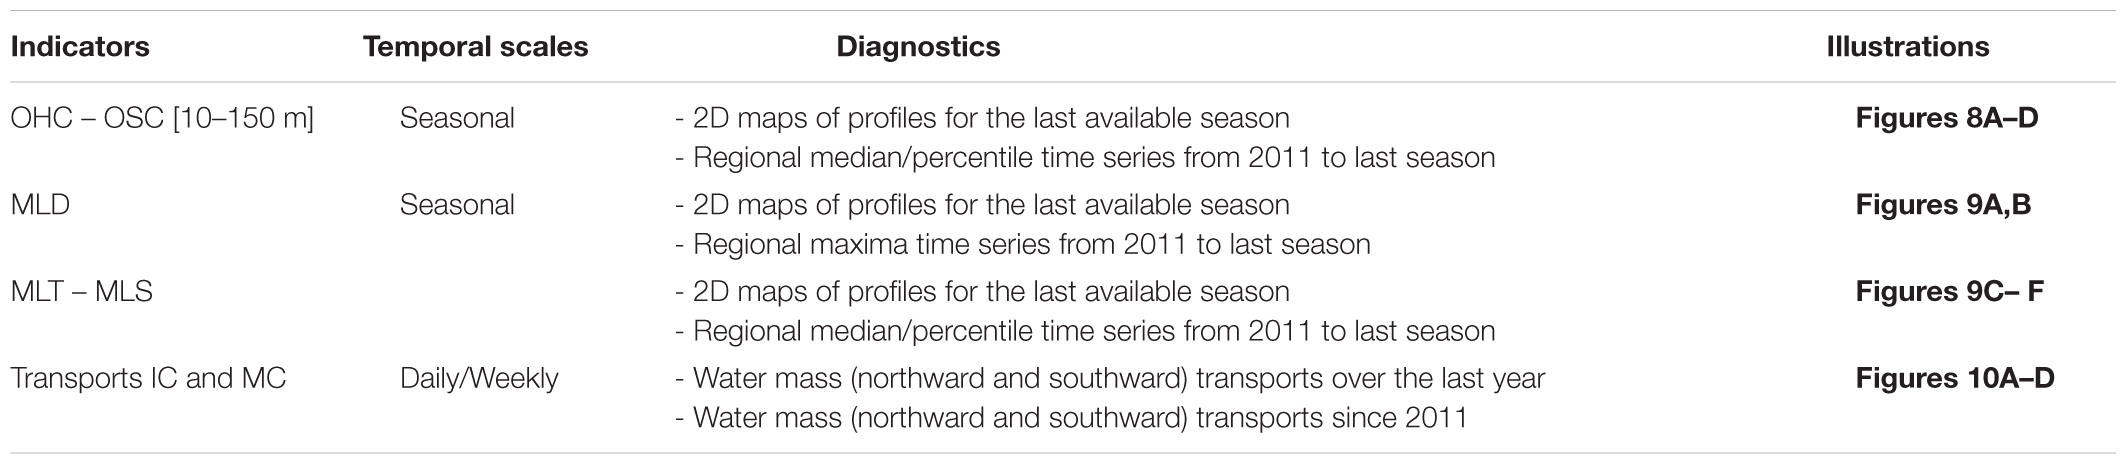
Table 4. Summary of the diagnostics and illustrations for the vertically integrated indicators.
Web-Based Visualization Tool
The ocean data and diagnostics have been selected attempting to follow the international strategy by monitoring EOVs (as defined by GOOS and IOC-UNESCO) and key derived variables, and providing added-value products for diverse stakeholders. They have also satisfied selection criteria (as described in Section “Criteria for Selection”) including the data product quality and availability. This latter has been largely enabled by CMEMS which provides full, free and open access to historical and near real-time data. Additionally, the current indicators are a compromise between the information and its clarity to be shared and the wide audience to be reached, from general public to scientific community.
The ‘‘Sub-regional Mediterranean Sea Indicators’’ visualization tool has been implemented to follow easily the evolution of the developed (sub-) regional ocean indicators by the marine scientists, environmental agencies, ocean managers and general public. This interactive website gives access to the user-friendly visualization of (sub-) regionally integrated near real-time and historical ocean variables that are classified into two categories: surface and vertically integrated ocean indicators (as presented along Sections ‘‘Surface Ocean Variables’’ and ‘‘Integrated Ocean Variables’’). It is automatically updated simultaneously with the figures that are produced and updated on a daily, monthly, seasonal and annual bases according to the temporal scale of the diagnostics. The sub-regional indicators portal is currently hosted in the SOCIB website7. The time series are produced in all (sub-) regions (Mediterranean, WMED, EMED, NWMED, Balearic Islands, Alboran Sea and Algerian basin) and analyzed in this section. Figures 2–9 provide illustrations only for the Balearic Islands but all the regional time series are available in the previously mentioned portal.
The present ocean indicators address the ocean variability from the short-term to long-term temporal variability (climate signals) at sub-regional scales. The daily monitoring also allows to detect and follow remarkable events in real time (e.g., MHWs, storms).
Mediterranean Spatio-Temporal Variability: Results and Discussion
Ocean Warming and Marine Heat Waves
The Mediterranean Sea is very sensitive and vulnerable to global warming (Lionello and Scarascia, 2018). In recent years, the number of periods with records in positive air temperature anomaly and heat wave events have increased worldwide (IPCC, 2014). As a recent example, the year 2020 is the second warmest year on record for the planet, with surface air temperature reaching 1.8 (2.6)°C above the global (European) average, as reported by the National Oceanic and Atmospheric Administration (NOAA global climate report, 2021). The European Service Copernicus has also warned about the climate change ranking the year 2020 as the warmest year on record8.
SST is a key climate variable through its contribution in regulating climate and its variability. The long-term variability, from interannual to decadal scales, informs about the slow variations (e.g., trend). The annual mean SST time series from 1982 to 2020 and the derived linear trends over the period 1982–2020 (illustrated in Figures 3C,E for the Balearic Islands) are consistent with the recent results from Pisano et al. (2020). Using the CMEMS satellite products from 1982 to 2018, the authors found a mean warming trend of 0.041+/−0.006°C/year over the whole Mediterranean Sea over their 37-year period of study. They also highlighted the uneven spatial pattern of the SST trend with values increasing from 0.036+/−0.006°C/year in the western basin to 0.048+/−0.006°C/year in the Levantine/Aegean basin. The CMEMS OMI also found a positive trend for the Mediterranean SST over the period 1993–2019 of approximately 0.037+/−0.003°C/year (Mulet et al., 2018; von Schuckmann et al., 2020). The recently updated indicators presented in this paper show positive trends in SST over the 39-year period around 0.038+/−0.002°C/year in the whole basin, with higher mean value of 0.044+/−0.002°C/year in the eastern Mediterranean (EMED) than in the western part (WMED) with mean value of 0.032+/−0.002°C/year. The associated 2D map of SST trend (Figure 3D) clearly highlights this longitudinal difference but also evidences the strong spatial variability of warning rate inside each sub-basin. The trends reach their maximum of 0.055–0.06°C/year in the EMED (in particular, near the Rhodes and Crete Islands, and in the northern Aegean Sea). In the WMED, the Alboran Sea has the lowest values with a regional mean of 0.028+/−0.002°C/year over 1982–2020 while the trends are around 0.033+/−0.003 and 0.035+/−0.003°C/year over the period in the Balearic Islands region and the NWMED, respectively. Note that the Mediterranean warming trends are approximately three or four times higher than the global ocean warming trend, which has been estimated at 0.011°C/year over 1980–2005 by Pachauri et al. (2014) (IPCC, 2014) and 0.015+/−0.001°C/year over 1993–2019 in the CMEMS reporting (von Schuckmann et al., 2020).
The observed changes in the Mediterranean also affect the amplitude of the seasonal signal with an increase of SST in summertime (but not only) in the recent years, in agreement with Pisano et al. (2020). The annual cycles of daily and monthly SST are displayed superimposing the current and last 3 years as well as the climatology established over 1982–2015, spatially averaged in all the (sub-) regions of the study (Figures 2C,F). Both daily and monthly monitoring show that the recent years, from 2017 to 2020, are warmer than the climatology in all regions, almost all months of the year. The year 2020 experienced very high SST throughout all the year, in both the WMED and EMED. Particularly, in the WMED (EMED), the monthly mean SSTA exceeded 1°C from February to May and from July to September 2020 (in May and from August to December 2020) with maximum anomaly reached in May (October) with mean value of 1.61 (1.69)°C (Figure 2F). The daily monitoring highlights extreme events at regional scale, in particular MHW (Hobday et al., 2016; Bensoussan et al., 2019a). The MHWs detected for the year 2017 in the Mediterranean Sea are in agreement with Bensoussan et al. (2019a). The MHWs that are detected for the current year are explicitly displayed (illustration in 2020 in Figure 2C). Averaged over the Mediterranean Sea, the daily SST time series show continuous MHWs from February to mid-March, as well as MHWs in April, May, end-July/early August, September and November-December. The strongest event is found mid-May lasting more than 1 week and reaching more than 1°C from the threshold value. The EMED experienced this very strong event in mid-May with maximum reaching 2°C above the threshold value for MHW definition, or 3°C above the 34-year climatology. A quasi-continuous 4-month duration MHW occurred in the EMED during the last third of the year 2020, starting in end-August until the end of the year, and reaching the highest averaged temperatures recorded in this region in early September. The MHWs which have been detected the second semester of the year in the EMED are representative of very intense MHWs in the Levantine basin (not shown). In the WMED, MHWs with high intensity (1 and 2°C higher than threshold value and climatology, respectively) and frequency, but also lasting several weeks (months) have been detected, in particular during the entire months of February and March, from early April to early May, and in end-May. Additional intense MHWs occurred in late-July and early August, and mid-September. These results in the WMED reflect MHWs that occurred in the different sub-regions of this sub-basin. Note that the NWMED and the Balearic Islands region (including the Cabrera Island National Park) experienced a quasi-continuous MHW from January to end of May making the year 2020 particularly remarkable. Finally, the southern regions of the WMED also experienced MHWs during the two last months of the year 2020. MHWs are increasing in frequency, duration and magnitude in the Mediterranean Sea in the last years and particularly for the last year 2020, impacting marine ecosystems and human activities and contributing to the rapid sea surface warming trend. Warm waters also deliver more humidity to the atmosphere, amplifying atmospheric instability and meteorological phenomena, such as upper-level lows that are also called cold drops (Porcù et al., 2007). This very cold polar air advances slowly in the Western Europe at high altitude and is associated with violent storms and significant rainfall in autumn along the Spanish Mediterranean coast (as recently occurred in the Balearic Islands in early September 2020 and anticipated by AEMET).
The daily and monthly monitoring, combining various ocean variables, is primordial to properly analyze the ocean variability and its local/regional impacts. For instance, the positive SSTA in the Balearic Sea from October to December 2017 was associated with the strong anticyclonic eddy at the north of Mallorca (described in Aguiar et al., 2019) rather than a warming period over the region.
Ecosystem Activity Variations
CHL, as a proxy for phytoplankton biomass which is considered as primary producers of the sea, responds rapidly to environmental changes (e.g., light, temperature, nutrients and mixing, Colella et al., 2016) and varies from short-term to long-term in response to climate indices (e.g., North Atlantic Oscillation (NAO) and El Niño Southern Oscillation (ENSO), Basterretxea et al., 2018). The NAO has more influence in CHL variations in the WMED whereas ENSO mainly impacts on the EMED. The Mediterranean Sea also exhibits a strong spatial variability of CHL and has been divided into bioregions characterized by their trophic regimes (D’Ortenzio and Ribera d’Alcalá, 2009; Mayot et al., 2016). The CHL concentration (or phytoplankton biomass) increase is strongly coupled to physical forcing. The main drivers of these variations at regional and sub-regional scales are the river discharges in coastal area (e.g., Ebro in the Balearic Sea, Rhône in the NMWED, Adige-Po-Reno in the northern Adriatic Sea, Nile in Egypt), the coastal upwelling or tidal mixing (e.g., along the Spanish coast in the Alboran Sea), the cyclonic circulation (e.g., in the NWMED), the mesoscale frontal dynamics (e.g., in the Balearic and Alboran Seas), the winter mixing and winds in open sea (as in the NMWED where deep convection occur) (D’Ortenzio and Ribera d’Alcalá, 2009; Mayot et al., 2016; Basterretxea et al., 2018).
The sub-regional indicators show that the CHL variations differ in the EMED and WMED (not shown), with the extremely oligotrophic EMED and the more productive WMED (D’Ortenzio and Ribera d’Alcalá, 2009). The annual mean CHL from 1998 to 2020 are higher in the WMED with values oscillating between 0.15 and 0.21 mg/m3 than in the EMED with values ranging from 0.08 to 0.11 mg/m3 (not shown). Additionally, the 2D map of mean CHLA in 2020 (Figure 4H) shows generally negative (positive) values in the WMED (EMED). This follows the results from Sathyendranath et al. (2018) that showed negative (positive) trend in the WMED (EMED). The annual mean CHL time series from 1998 to 2020 show a positive trend until 2013–2014 in all regions (illustration in Figure 4I for the Balearic Islands). In the WMED, a strong decrease is initiated in 2014 reaching its minimum of 0.15 mg/m3 in 2017. In the EMED, minima around 0.08–0.09 mg/m3 are reached in the recent years (2014, 2016, 2017, and 2018). Following the hypothesis from Basterretxea et al. (2018), these interannual variations may result from the impacts of the NAO which is positive since 2014 and the strong El Niño event in 2015–2016. These results are also consistent with those of the CMEMS OMI catalog in the whole Mediterranean (Sathyendranath et al., 2018). The interannual variability of ocean processes, in particular the intensity of winter deep convection events in the NWMED, also contributes to the interannual variability in the biological response (Mayot et al., 2016).
At short time scale, the daily and monthly time series over the last years of regionally integrated CHL show a clear seasonal signal in all the regions with maxima generally reached in winter or early spring (illustrations in Figures 4C,F). In the open sea, the high CHL values are likely caused by the front instabilities (e.g., eddy, front, filaments) as along the Balearic Front exporting phytoplankton-rich waters from North in the southern oligotrophic waters (Mayot et al., 2016), or by the permanent cyclonic circulation and/or the winter deep convection as in the NWMED which induce phytoplankton blooms through intense nutrient uptakes. Note that a delay of a few weeks has been observed between a winter deep convection event and the “spring bloom” that generally occurs in April in NWMED (Mayot et al., 2016). The high values of sub-regional CHL concentrations can be also due to the river discharges in coastal areas, such as in the NWMED and Balearic Sea. Moreover, the daily monitoring of CHL is an indicator enabling to detect extreme events and impacts at regional and local scales. As a relevant and recent example, in Spain, following the storm Gloria which occurred on 19–24 January 2020 (Berdalet et al., 2020) and during the heat wave on February 1–5, 2020 (reported by several meteorological agencies), very high CHL values have been detected in a very large area in the Balearic Sea and further north (not shown). The injection of nutrients by the Ebro river and the warm context have probably caused a strong increase in the abundance of phytoplankton that has been captured and identified by the daily monitoring (illustrated in Figures 4A–C). Finally, the CHL monitoring could also be an indicator of water quality and ocean pollution in the coastal areas through the river inputs and human activities (e.g., sewage, industry, agriculture). As recent and striking example, negative CHLA values in the North Adriatic highlighted by the daily and monthly 2D maps in April and May 2020 (not shown) are likely due to the decrease of nutrient inputs of terrestrial/anthropogenic origin (e.g., urban and industrial wastewaters; Colella et al., 2016) related to the decrease of the Italian and European citizen activities during the Covid19 lockdown period.
Sea Level Rise
Climate change contributes to sea level variations, through the increase of ocean volume caused by thermal expansion of ocean water and the increase of ocean water mass caused by land ice melting, that directly impact the coastal areas and the population living there. The trends obtained from the SLA annual mean time series from 1993 to 2020 (Figures 6B,C) are consistent with the values found for the Mediterranean Sea in the CMEMS OMIs catalog (Legeais et al., 2018). Although the SLA trend estimations averaged in the Mediterranean (0.29+/−0.02 cm/year over 1993–2020 in this paper, 0.25 +/−0.22 cm/year over 1993–2019 in the CMEMS reporting) are smaller than for the global ocean (0.33 +/−0.04 cm/year over 1993–2019 in CMEMS), these values are high and alarming in such a regional and coastal sea. Additionally, the 2D map of SLA trends shows a very strong spatial variability in the Mediterranean. The SLA trends are higher in the EMED than in the WMED (0.31+/−0.03 and 0.29+/−0.02 cm/year, respectively). While the SLA trends are positive in the whole WMED oscillating between 0.15 and 0.4 cm/year, positive and negative values are detected in the EMED ranging from −0.4 to 0.5 cm/year, reaching both the maxima and minima found in the Mediterranean. The maxima with values higher than 0.5 cm/year are reached in the Levantine basin and in the Aegean Sea, where many islands are located. Negative trends are detected south of the Crete Islands and in the Ionian Sea associated with the large scale circulation change.
Ocean Circulation Variability
The geostrophic currents enable the characterization of the general surface circulation in the whole Mediterranean Sea and the detection of mesoscale features (e.g., eddies, fronts). The derived TKE represents the energy of the total geostrophic velocities. The mean TKE is stronger in the WMED (with averaged value of 0.023 m2/s2 over 1993–2020), where are the highest dynamical areas of the Mediterranean (Alboran gyres, AC), than in the EMED (with averaged value of 0.013 m2/s2 over the period).
The annual mean TKE time series from 1993 to 2020 show an increasing energy in all regions (illustration in Figure 5). The trends over the total period are approximately 0.0056+/−0.0004 (0.0035+/−0.0007) m2/s2 from 1993 to 2020 in the WMED (EMED) corresponding to a significant increase of current intensity of 13 (30) %. This is related to the increase of satellites that has improved the representation of mesoscale features and of the coastal area dynamics. This probably also explains the significant differences between the daily/monthly TKE values in recent years and the climatologies established over 1993–2015, in particular, in autumn in NMWED (not shown) where the NC may be better captured by the altimetry and in the Balearic Islands region which also combines permanent currents (NC and BC) and high mesoscale activities (Figures 5C,F). The intensification of the wind-induced current component also contributes to this increase over the last three decades. The annual mean WIND time series from 1992 to 2020 show an increase of intensity in all regions over the period (illustation in Figure 7), of around 6.3 and 6.6% in the WMED and EMED, respectively. This wind intensification may contribute to the increase of observed surface ocean currents.
At shorter time scales, the TKE seasonal signal is well-marked in the NWMED in relation to the intensification of the NC over all the sub-region (Birol et al., 2010). The same feature is observed in the Balearic Islands region with less amplitude. The Algerian sub-basin shows high TKE values with maxima in autumn-winter linked to the AC. Strong events, such as the high TKE at the end of the year 2019, are detected reflecting the intensification of the AC or the presence of strong Algerian meanders and eddies. Finally, in the highly energetic Alboran Sea, the TKE variability is related to the variability of the Alboran gyres.
Hydrographic Property and Water Mass Variability
The OHC and OSC integrated in the surface layer down to 150 m are interesting ocean and climate indicators to monitor the air-sea heat and freshwater exchanges (illustrations in Figure 8). The seasonal cycle of the OHC is well represented and a positive trend over 2011–2020 appears in all regions. The OSC time series do not show a seasonal cycle. In the EMED, the trend in OSC is positive while no clear trend appears in the WMED, maybe due to different trends between the southern and northern parts (negative and positive, respectively). Quantitative estimations of trends are preferred not to be provided at this stage due to the too short time series for the moment.
The ocean mixed layer is the place where the ocean-atmosphere exchanges and most of biogeochemical processes occur. In particular, the maxima MLD time series highlight intermediate and deep convection events. In the EMED, maxima around 600, 800, and 700 m are found in the South Adriatic in winters 2013, 2018, and 2019, respectively. In the NWMED, deep convection events are detected with MLD values between 1500 and 2000 m in winters 2012, 2013, and 2018 in the Gulf of Lion (Figure 9). The deep convections that occurred in the NWMED during these years have been largely reported (e.g., Houpert et al., 2016; Testor et al., 2018; Margirier et al., 2020). The profiling float network also detected the large spatial and temporal extent of the winter 2013 event, where the MLD maxima reached 2000 m in many profiles (not shown). However, the profiling floats diving to 2000 m as maximal depth are not able to detect deep convection reaching the bottom as it occurred in winter 2013. Although the profiling float network benefits from the basin-scale coverage, its accuracy in characterizing deep convection event is limited by its vertical, horizontal and temporal sampling. For further analysis, it has to be complemented by additional observational platforms, in particular the fixed mooring located in the Gulf of Lion (Testor et al., 2020). Concerning the MLT and MLS, their variability is quite similar to the OHC and OSC variability, respectively, although some differences are found since in summer the MLD is shallower than 150 m and in winter MLD can exceed 150 m.
In the Balearic Channels, the transport volumes of water show variations from high frequency (daily weekly) to seasonal and interannual time scales (Figure 10), as reported in Heslop et al. (2012). This wide-range variability is related to the presence of the typical water masses and the ocean circulation in the channels (Heslop et al., 2012; Juza et al., 2013, 2019). In the IC, the southward flow is generally higher (with values up to 1.5 Sv) than the northward flow (with values up to 1 Sv), in particular in winter when the NC is stronger. Strong northward flow is generally related to the intrusion and amount of recent AW (e.g., in autumns 2016 and 2017). In winter-spring, WIW is formed in the Gulf of Lion and in the Balearic Sea and may cross the IC flowing southwards. Northward transport may be also composed of WIW, which has recirculated in the region. In the MC, the transports are smaller than in the IC. Although the monitoring is less intense, high variability appears with generally higher northward flow than southward flow.
Conclusion and Perspectives
Giving access to relevant information on ocean state, variability, health and climate change at regional scale through environmental monitoring tools will benefit diverse ocean stakeholders, strengthen their engagement, increase the knowledge, raise the public awareness, support the management and policy at national level, thus supporting the achievement of international directives (e.g., UN SDG14, UN Decade of Ocean Science for Sustainable Development). In particular, the sub-regional ocean indicators developed at SOCIB aim at complementing in the Mediterranean Sea the IPCC reporting and the CMEMS Ocean Monitoring Indicators. While these latters provide regularly updated (yearly or half-yearly) monitoring to inform on the status and health of the marine environment of the global ocean and European regional Seas (including the Mediterranean Sea) from the past to present, the proposed monitoring tool focuses on regional and sub-regional indicators in the Mediterranean Sea (whole Mediterranean Sea, western and eastern parts, North-western Mediterranean, Balearic Islands, Alboran Sea and Algerian sub-basin). This value-added product informs on the ocean state and variability from daily to interannual/decadal scales with associated updates from daily to annual frequencies, processing both near real-time and historical data. An interactive portal has been implemented to visualize a variety of ocean information from past (four decades) to present (today). Key surface ocean variables (sea surface temperature, chlorophyll-a concentration, geostrophic current and associated total kinetic energy, sea level anomaly, wind direction and intensity) are addressed at various time scales using satellite products distributed by CMEMS. Vertically integrated ocean variables (ocean heat and salt contents, mixed layer properties and water mass transports in key sections) are also monitored using hydrographic profiles from profiling floats distributed by Met-Office and from gliders operated and distributed by SOCIB.
The operational implementation of this monitoring system enables the daily monitoring in real time, allowing the quasi-automatic detection of oceanic events, and the monthly/seasonal variability reporting. Beside the short-term variability, the interannual variability analyses and linear trends over several decades allow to address the climate change and its impact (e.g., sea level rise, increased temperature at surface and depth, oxygen decrease and acidification) at local and (sub-) regional scales. For example, the Balearic Islands, where SOCIB is located and has major interests, are a hot spot of biodiversity of the western Mediterranean Sea and are very sensitive to and strongly impacted by climate change and human pressure. Marine habitats, ecosystem and marine resources are directed affected in such a place.
The current sub-regional ocean indicators could be easily extended, adapted or refined according to the user needs. Additional sub-regions could be defined and added, extending the sub-regional division to the whole Mediterranean (central and eastern Mediterranean) or focusing on smaller sub-regions of particular interest (e.g., Marine Protected Areas, Bensoussan et al., 2019b; Bluefin Tuna spawning areas, Alemany et al., 2010; Reglero et al., 2012). In case of the vertically integrated variables that use the profiling floats, the results may depend on the regional distribution of the profiles. A minimum of profiles is required in a selected region preventing from reducing too drastically the size of the sub-regions. Diagnostics using other in situ platforms at local scale such as fixed moorings (e.g., SEANOE observatory9) and gliders (e.g., MOOSE and SOCIB endurance lines10,11) could be performed to overcome this issue for specific purpose.
The sub-regional ocean indicators could be applied to regional and coastal numerical models of the Mediterranean Sea (e.g., CMEMS MED-MFC in the Mediterranean, Clementi et al., 2019; Simoncelli et al., 2019; CMEMS IBI-MFC in the Iberian-Biscay-Irish region, Sotillo et al., 2015; WMOP in the western Mediterranean, Juza et al., 2016b; Mourre et al., 2018). The model behavior can be monitored following in real time the temporal evolution of specific indicators at basin and sub-basin scales (Juza et al., 2016b). The direct comparisons with available observations would allow to quantitatively assess the model. Then, ocean forecasts could complete the time series.
The global coastal ocean is a crucial area connecting with the open ocean and will be of major interest in the next decade (e.g., Coastal Working Group of EuroGOOS, El Serafy, 2020; European project JERICO-S312; CoastPredict programme13 as a contribution to the UN Decade of Oceans). New on-going data products will offer the possibility to extend and/or refine the ocean monitoring in coastal areas to support the sustainable use of coastal resources. In particular, high-resolution ocean color products using the satellite Sentinel-2 will enable to accurately monitor the land and river discharges, water quality and water transparency that strongly impact on marine ecosystems in the coastal domain. Moreover, coastal ocean indicators could be also implemented benefiting from the coastal fixed moorings (e.g., the network operated by Puertos del Estado14) and the RADMED monitoring program sampling stations15 along the Iberian coast that provide long-term time series allowing to obtain relevant estimations of linear trends in the coastal area.
Sub-mesoscale and mesoscale ocean processes and dynamics could also be integrated (e.g., characterization of cyclonic and anticyclonic eddies, identification of convergence and divergence areas, or detection of fronts), in order to respond to specific topics such as marine debris pollution, contamination, or marine ecosystem activity (e.g., Bluefin tuna, Álvarez-Berastegui et al., 2016).
To achieve the sustainable development goals and respond to both science and society needs, it is fundamental to raise general public awareness about the marine environment, to strengthen the link between the scientific community and society (environmental agencies, private sectors, general public) and to better transfer the knowledge and information to end-users. In the Mediterranean, efforts are being engaged to create or enhance the link from the sub-regional indicators implemented at SOCIB to the regional end-users such as the scientists, the government (national governments, funding agencies, European Commission), and the society (students at any level, general public). This list of end-users could be also extended to reach the private sector (industry, small and medium enterprises).
To strengthen the influence of the science in policy and environmental decision-makings, the approach should be cross-sectorial and interdisciplinary: it is now essential to better engage the different ocean stakeholders (marine scientists, policymakers, managers, and resource users), to consider the requests from different communities and sectors, to improve the interdisciplinary collaborations, to reinforce the coproduction and/or the transfer of knowledge to the sectors concerned. The progress toward a two-way science-society concertation and cooperation is being made possible through (1) the access to common tools that are scientifically reliable and sufficiently simple to be understandable by transdisciplinary communities, (2) the development and evolution of ocean products, considering inputs and feedbacks from end-users, (3) international high-level directives and actions (e.g., UN SDGs, UNESCO) and international initiatives from science organizations (e.g., OceanObs’19, European Ocean Observing System16, CMEMS) that are establishing better interaction and partnership between the science community and stakeholders, and (4) research institutes at sub-regional level (e.g., SOCIB) that support a responsible research innovation approach assuring society engagement and ethics in science.
Glossary
AC, Algerian Current; AWo, “Modified” Atlantic Water; AWr, “Recent” Atlantic Water; BC, Balearic Current; CHL, Chlorophyll-a concentration; CHLA, Chlorophyll-a concentration Anomaly; CMEMS, Copernicus Marine Environment Monitoring Service; EMED, Eastern Mediterranean Sea; ENSO, El Niño Southern Oscillation; EOV, Essential Ocean Variable; EEZ, Exclusive Economic Zone; GOOS, Global Ocean Observing System; GV, Geostrophic Velocity; IC, Ibiza Channel; IOC-UNESCO, Intergovernmental Oceanographic Commission of UNESCO; IPCC, Intergovernmental Panel on Climate Change; LIW, Levantine Intermediate Water; MC, Mallorca Channel; MHS, Marine Heat Spike; MHW, Marine Heat Wave; MLD, Mixed Layer Depth; MLS, Mixed Layer Salinity; MLT, Mixed Layer Temperature; MPA, Marine Protected Area; NAO, North Atlantic Oscillation; NC, Northern Current; NRT, Near Real-Time; NWMED, North-western Mediterranean; OHC, Ocean Heat Content; OMI, Ocean Monitoring Indicator; OSC, Ocean Salt Content; OSR, Ocean State Report; REP, Reprocessed; SDG, Sustainable Development Goals; SLA, Sea Level Anomaly; SOCIB, Balearic Islands Coastal Observing and Forecasting System; SST, Sea Surface Temperature; SSTA, Sea Surface Temperature Anomaly; TKE, Total Kinetic Energy; UN, United Nations; WIW, Western Intermediate Water; WMDW, Western Mediterranean Deep Water; WMED, Western Mediterranean Sea.
Data Availability Statement
The datasets presented in this study can be found in online repositories. The names of the repository/repositories and accession number(s) can be found in the article/supplementary material.
Author Contributions
MJ contributed to data processing, interpretation of the data, scientific discussion, and writing of the manuscript. JT contributed to scientific interpretation and discussion, critical revision of the manuscript. Both authors contributed to the article and approved the submitted version.
Conflict of Interest
The authors declare that the research was conducted in the absence of any commercial or financial relationships that could be construed as a potential conflict of interest.
The reviewer KvS declared a past co-authorship with the authors MJ and JT to the handling editor.
Acknowledgments
We gratefully acknowledge the two reviewers for their careful reading and relevant comments. The sub-regional ocean indicators of this study are produced using (1) the free and open access data distributed by CMEMS (www.marine.copernicus.eu) in near real-time and delayed mode, (2) the corrected in situ hydrographic profiles from the EN4.2.1 dataset distributed by Met-Office (www.metoffice.gov/hadobs/en4), and (3) the SOCIB glider data (www.socib.es) which are post-processed and distributed by the SOCIB Data Centre. Part of this work was supported by the JERICO-S3 and EuroSea projects. These projects have received funding from the European Union’s Horizon 2020 Research and Innovation Programme under grant agreement Nos. 871153 and 862626, respectively.
Footnotes
- ^ https://un.org/sustainabledevelopment/sustainable-development-goals
- ^ www.goosocean.org/eov
- ^ https://marine.copernicus.eu/services/markets
- ^ https://marine.copernicus.eu/services-portfolio/access-to-products
- ^ www.metoffice.gov.uk/hadobs/en4
- ^ https://thredds.socib.es/thredds/catalog/auv/glider/catalog.html
- ^ https://apps.socib.es/subregmed-indicators
- ^ https://climate.copernicus.eu
- ^ www.seanoe.org/
- ^ www.moose-network.fr/gliders/
- ^ https://www.socib.eu/?seccion=observingFacilities&facility=glider
- ^ www.jerico-ri.eu
- ^ www.coastspredict.org
- ^ www.puertos.es
- ^ www.ieo.es
- ^ https://www.eoos-ocean.eu
References
Abram, N., Gattuso, J.-P., Prakash, A., Cheng, L., Chidichimo, M. P., Crate, S., et al. (2019). “Framing and context of the report,” in IPCC Special Report on the Ocean and Cryosphere in a Changing Climate, eds H. O. Pörtner, D. C. Roberts, V. Masson-Delmotte, P. Zhai, M. Tignor, E. Poloczanska, et al. 73–129. Available online at: https://www.ipcc.ch/srocc/ (accessed March 3, 2021).
Aguiar, E., Juza, M., Mourre, B., Pascual, A., Mason, E., Alvera Azcarate, A., et al. (2019). Anticyclonic Eddy anomaly: impact on the boundary current and circulation in the western Mediterranean Sea. J. Operat. Oceanogr. 12, S1–S123. doi: 10.1080/1755876X.2019.1633075
Alemany, F., Quintanilla, L., Velez-Belchi, P., Garcia, A., Cortés, D., and Rodriguez (2010). Characterization of the spawning habitat of Atlantic bluefin tuna and related species in the Balearic Sea (western Mediterranean). Prog. Oceanogr. 86, 21–38. doi: 10.1016/j.pocean.2010.04.014
Álvarez-Berastegui, D., Hidalgo, M., Tugores, M. P., Reglero, P., Aparicio-González, A., Ciannelli, L., et al. (2016). Pelagic seascape ecology for operational fisheries oceanography: modelling and predicting spawning distribution of Atlantic bluefin tuna in Western Mediterranean. ICES J. Mar. Sci. 73, 1851–1862. doi: 10.1093/icesjms/fsw041
Álvarez-Berastegui, D., Saber, S., Ingram, W. G. Jr., Díaz-Barroso, L., Reglero, P., Macías, D., et al. (2018). Integrating reproductive ecology, early life dynamics and mesoscale oceanography to improve albacore tuna assessment in the Western Mediterranean. Fish. Res. 208C, 329–338. doi: 10.1016/j.fishres.2018.08.014
Ssalto/Duacs User Handbook (2014). Ssalto/Duacs User Handbook: M(SLA) and M(ADT) Near-Real Time and Delayed-Time. SALP-MU-P-EA-21065-CLS, 4, 1 Edn. Available online at: http://www.aviso.altimetry.fr/fileadmin/documents/data/tools/hdbk_duacs.pdf (last access 07.12.15)
Barceló-Llull, B., Pascual, A., Ruiz, S., Escudier, R., Torner, M., and Tintoré, J. (2019). Temporal and spatial hydrodynamic variability in the Mallorca channel (western Mediterranean Sea) from 8 years of underwater glider data. J. Geophys. Res 124, 2769–2786. doi: 10.1029/2018JC014636
Basterretxea, G., Font-Muñoz, J. S., Salgado-Hernanz, P. M., Arrieta, J., and Hernández-Carrasco, I. (2018). Patterns of chlorophyll interannual variability in Mediterranean biogeographical regions. Remote Sens. Environ. 215, 7–17. doi: 10.1016/j.rse.2018.05.027
Bax, N. J., Appeltans, W., Brainard, R., Duffy, J. E., Dunstan, P., Hanich, Q., et al. (2018). Linking capacity development to GOOS monitoring networks to achieve sustained ocean observation. Front. Mar. Sci. 5:346.
Belmonte Rivas, M., Stoffelen, A., and Bentamy, A. (2019). Sea surface winds and Ekman pumping. J. Operat. Oceanogr. 12, S1–S123.
Bensoussan, N., Cebrian, E., Dominici, J. M., Kersting, D. K., Kipson, S., Kizilkaya, Z., et al. (2019b). Using CMEMS and the Mediterranean Marine Protected Areas sentinel network to track ocean warming effects in coastal areas. J. Operat. Oceanogr. 12, S1–S123.
Bensoussan, N., Chiggiato, J., Buongiorno Nardelli, B., Pisano, A., and Garrabou, J. (2019a). Insights on 2017 marine heat waves in the Mediterranean Sea. J. Operat. Oceanogr. 12, S1–S123.
Bentamy, A., Grodsky, S. A., Elyouncha, A., Chapron, B., and Desbiolles, F. (2017). Homogenization of scatterometer wind retrievals. Int. J. Climatol. 37, 870–889. doi: 10.1002/joc.4746
Berdalet, E., Marrasé, C., and Pelegrí, J. L. (2020). La Borrasca Gloria (19-24 Enero 2020). Barcelona: CSIC-Institut de Ciències del Mar (ICM), 38. doi: 10.20350/digitalCSIC/12496
Bethoux, J. P., Gentili, B., Morin, P., Nicolas, E., Pierre, C., and Ruiz-Pino, D. (1999). The Mediterranean Sea: a miniature ocean for climatic and environmental studies and a key for the climatic functioning of the North Atlantic. Prog. Oceanogr. 44, 131–146. doi: 10.1016/s0079-6611(99)00023-3
Birol, F., Cancet, M., and Estournel, C. (2010). Aspects of the seasonal variability of the Northern Current (NW Mediterranean Sea) observed by altimetry. J. Mar. Syst. 81, 297–311. doi: 10.1016/j.jmarsys.2010.01.005
Buongiorno, N. B., Tronconi, C., Pisano, A., and Santoleri, R. (2013). High and ultra-high resolution processing of satellite sea surface temperature data over southern european seas in the framework of myocean PROJECT. Remote Sens. Environ. 129, 1–16. doi: 10.1016/j.rse.2012.10.012
Chelton, D. B. (1983). Effects of sampling errors in statistical estimation. Deep Sea Res. Part A. Oceanogr. Res. Pap. 30, 1083–1103. doi: 10.1016/0198-0149(83)90062-6
Clementi, E., Pistoia, J., Escudier, R., Delrosso, D., Drudi, M., Grandi, A., et al. (2019). Mediterranean Sea Analysis and Forecast (CMEMS MED-Currents, EAS5 System). Copernicus Monitoring Environment Marine Service (CMEMS). Available online at: https://doi.org/10.25423/CMCC/MEDSEA_ANALYSIS_FORECAST_PHY_006_013_EAS5 (accessed March 3, 2021).
Colella, S., Falcini, F., Rinaldi, E., Sammartino, M., and Santoleri, R. (2016). Mediterranean ocean colour chlorophyll trends. PLoS One 11:e0155756. doi: 10.1371/journal.pone.0155756
Coll, M., Piroddi, C., Steenbeek, J., Kaschner, K., Lasram, F. B. R., Aguzzi, J., et al. (2010). The biodiversity of the Mediterranean Sea: estimates, patterns, and threats. PLoS One 5:e11842.
Desbiolles, F., Bentamy, A., Blanke, B., Roy, C., Mestas-Nuñez, A. M., Grodsky, S. A., et al. (2017). Two decades [1992–2012] of surface wind analyses based on satellite scatterometer observations. J. Mar. Syst. 168, 38–56. doi: 10.1016/j.jmarsys.2017.01.003
D’Ortenzio, F., and Ribera d’Alcalá, M. R. (2009). On the trophic regimes of the Mediterranean Sea: a satellite analysis. Biogeosciences 6, 139–148. doi: 10.5194/bg-6-139-2009
D’Ortenzio, F., Iudicone, D., de Boyer Montegut, C., Testor, P., Antoine, P., Marullo, S., et al. (2005). Seasonal variability of the mixed layer depth in the Mediterranean Sea as derived from in situ profiles. Geophys. Res. Lett. 32:L12605. doi: 10.1029/2005GL022463
Duarte, C. M., Poiner, I., and Gunn, J. (2018). Perspectives on a global observing system to assess ocean health. Front. Mar. Sci. 5:9. doi: 10.3389/fmars.2018.00009
Duncan, B., Johnson, K. D., Suchanek, T. H., Brown, M., and Largier, J. L. (2019). Developing ocean climate change indicators for the north-central California coast and ocean. J. Environ, Manage. 252, 109343. doi: 10.1016/j.jenvman.2019.109343
El Serafy, G. (2020). “Aim, activities and early outcomes of the coastal working group of the european global ocean observing system (EuroGOOS),” in Proceedings of the EGU General Assembly Conference Abstracts, 22401. doi: 10.5194/egusphere-egu2020-22401
Escudier, R., Mourre, B., Juza, M., and Tintoré, J. (2016). Subsurface circulation and mesoscale variability in the Algerian sub-basin from altimeter−derived eddy trajectories. J. Geophys. Res. Oceans 121, 6310–6322. doi: 10.1002/2016jc011760
Good, S. A., Martin, M. J., and Rayner, N. A. (2013). EN4: quality controlled ocean temperature and salinity profiles and monthly objective analyses with uncertainty estimates. J. Geophys. Res. 118, 6704–6716. doi: 10.1002/2013JC009067
Gouretski, V., and Reseghetti, F. (2010). On depth and temperature biases in bathythermograph data: development of a new correction scheme based on analysis of a global ocean database. Deep Sea Res. I 57, 812–833. doi: 10.1016/j.dsr.2010.03.011
Hayes, K. R., Dambacher, J. M., Hosack, G. R., Bax, N. J., Dunstan, P. K., Fulton, E. A., et al. (2015). Identifying indicators and essential variables for marine ecosystems. Ecol. Indic. 57, 409–419. doi: 10.1016/j.ecolind.2015.05.006
Heslop, E., Tintoré, J., Rotllan, P., Álvarez-Berastegui, D., Fontera, B., Mourre, B., et al. (2019). SOCIB integrated multi-platform ocean observing and forecasting: from ocean data to sector-focused delivery of products and services. J. Operat. Oceanogr. 12(Suppl. 2), S67–S79.
Heslop, E. E., Ruiz, S., Allen, J., López−Jurado, J. L., Renault, L., and Tintoré, J. (2012). Autonomous underwater gliders monitoring variability at “choke points” in our ocean system: a case study in the Western Mediterranean Sea. Geophys. Res. Lett. 39:L20604.
Hobday, A. J., Alexander, L. V., Perkins, S. E., Smale, D. A., Straub, S. C., Oliver, E. C. J., et al. (2016). A hierarchical approach to defining marine heatwaves. Prog. Oceanogr 141, 227–238. doi: 10.1016/j.pocean.2015.12.014
Houpert, L., Durrieu, de Madron, X., Testor, P., Bosse, A., d’Ortenzio, F., et al. (2016). Observations of open−ocean deep convection in the northwestern Mediterranean Sea: seasonal and interannual variability of mixing and deep water masses for the 2007−2013 Period. J. Geophys. Res. Oceans 121, 8139–8171. doi: 10.1002/2016jc011857
IPCC (2013). Climate Change 2013: The Physical Science Basis. Contribution of Working Group I to the Fifth Assessment Report of the Intergovernmental Panel on Climate Change, eds T. F. Stocker, D. Qin, G.-K. Plattner, M. Tignor, S. K. Allen, J. Boschung, et al. (Cambridge: Cambridge University Press), 1535.
IPCC (2014). “Summary for policymakers,” in Climate change 2014: impacts, adaptation, and vulnerability. Part A: global and sectorial aspects. Contribution of Working Group II to the Fifth Assessment Report of the Intergovernmental Panel on Climate Change, eds C. B. Field, V. R. Barros, D. J. Dokken, K. J. Mach, M. D. Mastrandrea, T. E. Bilir, et al. (Cambridge: Cambridge University Press), 1–32. doi: 10.18772/22008034792.11
IPCC (2019). IPCC Special Report on the Ocean and Cryosphere in a Changing Climate, eds H.-O. Pörtner, D. C. Roberts, V. Masson-Delmotte, P. Zhai, M. Tignor, E. Poloczanska, et al. Available online at: https://www.ipcc.ch/srocc/ (accessed March 3, 2021).
Juza, M., Escudier, R., Pascual, A., Pujol, M. I., Taburet, G., Troupin, C., et al. (2016a). Impacts of reprocessed altimetry on the surface circulation and variability of the Western Alboran Gyre. Adv. Space Res. 58, 277–288. doi: 10.1016/j.asr.2016.05.026
Juza, M., Escudier, R., Vargas-Yáñez, M., Mourre, B., Heslop, E., Allen, J., et al. (2019). Characterization of changes in Western Intermediate Water properties enabled by an innovative geometry-based detection approach. J. Mar. Syst. 191, 1–12. doi: 10.1016/j.jmarsys.2018.11.003
Juza, M., Mourre, B., Lellouche, J. M., Tonani, M., and Tintoré, J. (2015). From basin to sub-basin scale assessment and intercomparison of numerical simulations in the Western Mediterranean Sea. J. Mar. Syst. 149, 36–49. doi: 10.1016/j.jmarsys.2015.04.010
Juza, M., Mourre, B., Renault, L., Gómara, S., Sebastián, K., Lora, S., et al. (2016b). SOCIB operational ocean forecasting system and multi-platform validation in the Western Mediterranean Sea. J. Operat. Oceanogr. 9(Supp1.), s155–s166.
Juza, M., Renault, L., Ruiz, S., and Tintoré, J. (2013). Origin and pathway of winter intermediate water in the Northwestern Mediterranean Sea using observations and numerical simulation. J. Geophys. Res 118, 1–13. doi: 10.1002/2013JC009231
Kummu, M., De Moel, H., Salvucci, G., Viviroli, D., Ward, P. J., and Varis, O. (2016). Over the hills and further away from coast: global geospatial patterns of human and environment over the 20th-21st centuries. Environ. Res. Lett. 11:034010. doi: 10.1088/1748-9326/11/3/034010
Legeais, J.-F., von Schuckmann, K., Melet, A., Storto, A., and Meyssignac, B. (2018). Copernicus Marine Service Ocean State Report, Issue 2. J. Operat. Oceanogr. 11, s13–s16.
Lindstrom, E., Gunn, J., Fischer, A., McCurdy, L. K., and Glover, A. (2012). A Framework for Ocean Observing. IOC Information Document. Paris: UNESCO. doi: 10.5270/OceanObs09-FOO
Lionello, P., and Scarascia, L. (2018). The relation between climate change in the Mediterranean region and global warming. Reg. Environ. Change 18, 1481–1493. doi: 10.1007/s10113-018-1290-1
Malanotte-Rizzoli, P., Artale, V., Borzelli-Eusebi, G. L., Brenner, S., Crise, A., Gacic, M., et al. (2014). Physical forcing and physical/biochemical variability of the Mediterranean Sea: a review of unresolved issues and directions for future research. Ocean Sci. 10, 281–322. doi: 10.5194/os-10-281-2014
Margirier, F., Testor, P., Heslop, E., Mallil, K., Bosse, A., Houpert, L., et al. (2020). Abrupt warming and salinification of intermediate waters interplays with decline of deep convection in the Northwestern Mediterranean Sea. Sci. Rep. 10, 1–11.
Mayot, N., D’Ortenzio, F., d’Alcala, M. R., Lavigne, H., and Claustre, H. (2016). Interannual variability of the Mediterranean trophic regimes from ocean color satellites. Biogeosciences 13, 1901–1917. doi: 10.5194/bg-13-1901-2016
Millot, C. (1999). Circulation in the Western Mediterranean Sea. J. Mar. Syst. 20, 423–442. doi: 10.1016/s0924-7963(98)00078-5
Miloslavich, P., Bax, N., Simmons, S., Klein, E., Appeltans, W., Aburto-Oropeza, O., et al. (2018). Essential ocean variables for sustained observations of marine biodiversity and ecosystems. Glob. Change Biol. 24, 2416–2433. doi: 10.1111/gcb.14108
Mourre, B., Aguiar, E., Juza, M., Hernandez-Lasheras, J., Reyes, E., Heslop, E., et al. (2018). Assessment of high−resolution regional ocean prediction systems using multi−platform observations: illustrations in the western Mediterranean Sea. New Front. Operat. Oceanogr. 10, 663–694.
Mulet, S., Buongiorno Nardelli, B., Good, S., Pisano, A., Greiner, E., Monier, M., et al. (2018). Copernicus Marine Service Ocean State Report, Issue 2. Operat. Oceanogr 11(Supp1.), s5–s13.
Pachauri, R. K., Allen, M. R., Barros, V. R., Broome, J., Cramer, W., Christ, R., et al. (2014). Climate Change 2014: Synthesis Report. Contribution of Working Groups I, II and III to the Fifth Assessment Report of the Intergovernmental Panel on Climate Change. Geneva: IPCC, 2014.
Pascual, A., Bouffard, J., Ruiz, S., Buongiorno Nardelli, B., Vidal-Vijande, E., Escudier, R., et al. (2013). Recent improvements in mesoscale characterization of the western Mediterranean Sea: synergy between satellite altimetry and other observational approaches. Sci. Mar. 77, 19–36. doi: 10.3989/scimar.03740.15A
Pinot, J. M., Tintoré, J., and Gomis, D. (1995). Multivariate analysis of the surface circulation in the Balearic Sea. Prog. Oceanogr. 36, 343–376. doi: 10.1016/0079-6611(96)00003-1
Pisano, A., Marullo, S., Artale, V., Falcini, F., Yang, C., Leonelli, F. E., et al. (2020). New evidence of mediterranean climate change and variability from sea surface temperature observations. Remote Sens. 12:132. doi: 10.3390/rs12010132
Pisano, A., Nardelli, B. B., Tronconi, C., and Santoleri, R. (2016). The new Mediterranean optimally interpolated pathfinder AVHRR SST Dataset (1982–2012). Remote Sens. Environ. 176, 107–116. doi: 10.1016/j.rse.2016.01.019
Porcù, F., Carrassi, A., Medaglia, C. M., Prodi, F., and Mugnai, A. (2007). A study on cut-off low vertical structure and precipitation in the Mediterranean region. Meteorol. Atmospheric Phys. 96, 121–140. doi: 10.1007/s00703-006-0224-5
Reglero, P., Ciannelli, L., Álvarez-Berastegui, D., Balbín, R., López-Jurado, J. L., and Alemany, F. (2012). Geographically and environmentally driven spawning distributions of tuna species in the western Mediterranean Sea. Mar. Ecol. Prog. Ser. 463, 273–284. doi: 10.3354/meps09800
Reid, J. L. (1979). On the contribution of the Mediterranean Sea outflow to the Norwegian-Greenland Sea. Deep Sea Research Part A. Oceanogr. Res. Pap. 26, 1199–1223. doi: 10.1016/0198-0149(79)90064-5
Reyers, B., Stafford-Smith, M., Erb, K.-H., Scholes, R. J., and Selomane, O. (2017). Essential variables help to focus sustainable development goals monitoring. Curr. Opin. Environ. Sustain. 26, 97–105. doi: 10.1016/j.cosust.2017.05.003
Robinson, A. R., Leslie, W. G., Theocharis, A., and Lascaratos, A. (2001). Mediterranean Sea circulation. Ocean Currents 1:19.
Roquet, H., Pisano, A., Embury, O., Good, S., Reid, R., Kennedy, J., et al. (2016). The copernicus marine environment monitoring service ocean state report. J. Operat. Oceanogr. 9(Suppl. 2), s235–s320.
Ryabinin, V., Barbière, J., Haugan, P., Kullenberg, G., Smith, N., McLean, C., et al. (2019). The UN Decade of ocean science for sustainable development. Front. Mar. Sci. 6:470. doi: 10.3389/fmars.2019.00470
Sathyendranath, S., Pardo, S., Benincasa, M., Brando, V. E., Brewin, R. J. W., Mélin, F., et al. (2018). 1.5. Essential variables: ocean colour in copernicus marine service ocean state report – Issue 2. J. Operat. Oceanogr. 11(Supp1.), 1–142.
Simoncelli, S., Fratianni, C., Pinardi, N., Grandi, A., Drudi, M., Oddo, P., et al. (2019). Mediterranean Sea Physical Reanalysis (CMEMS MED-Physics). Copernicus Monitoring Environment Marine Service (CMEMS). Available online at: https://doi.org/10.25423/MEDSEA_REANALYSIS_PHYS_006_004 (accessed March 3, 2021).
Sotillo, M. G., Cailleau, S., Lorente, P., Levier, B., Aznar, R., Reffray, G., et al. (2015). The MyOcean IBI ocean forecast and reanalysis systems: operational products and roadmap to the future copernicus service. J. Operat. Oceanogr. 1, 63–79. doi: 10.1080/1755876X.2015.1014663
Speich, S., Lee, T., Muller-Karger, F., Lorenzoni, L., Pascual, A., Jin, D., et al. (2019). Editorial: oceanobs’19: an ocean of opportunity. Front. Mar. Sci. 6:570. doi: 10.3389/fmars.2019.00570
Tanhua, T., McCurdy, A., Fischer, A., Appeltans, W., Bax, N., Currie, K., et al. (2019). What we have learned from the framework for ocean observing: evolution of the global ocean observing system. Front. Mar. Sci. 6:471. doi: 10.3389/fmars.2019.00471
Testor, P., Bosse, A., Houpert, L., Margirier, F., Mortier, L., Legoff, H., et al. (2018). Multiscale observations of deep convection in the northwestern Mediterranean Sea during winter 2012–2013 using multiple platforms. J. Geophys. Res. Oceans 123, 1745–1776. doi: 10.1002/2016jc012671
Testor, P., de Young, B., Rudnick, D. L., Glenn, S., Hayes, D., Lee, C. M., et al. (2019). OceanGliders: a component of the integrated GOOS. Front. Mar. Sci. 6:422.
Testor, P., Durrieu De Madron, X., Mortier, L., D’ortenzio, F., Legoff, H., Dausse, D., et al. (2020). LION Observatory Data. SEANOE. Available online at: https://doi.org/10.17882/44411 (accessed March 3, 2021).
Tintoré, J., Heslop, E., Ruiz, S., Muñoz, C., and Allen, J. (2019b). SOCIB Glider - Canales Endurance Line (Version 1.0) [Data set]. Balearic Islands Coastal Observing and Forecasting System, SOCIB. doi: 10.25704/JD07-SV9 (accessed March 3, 2021).
Tintoré, J., Pinardi, N., Alvarez Fanjul, E., Balbin, R., Bozzano, R., Ferrarin, C., et al. (2019a). Challenges for sustained observing and forecasting systems in the Mediterranean Sea. Front. Mar. Sci. 6:568.
Tintoré, J., Vizoso, G., Casas, B., Heslop, E., Pascual, A., Orfila, A., et al. (2013). SOCIB: the Balearic Islands coastal ocean observing and forecasting system responding to science, technology and society needs. Mar. Technol. Soc. J. 47, 101–117. doi: 10.4031/mtsj.47.1.10
Trewin, B., Cazenave, A., Howell, S., Huss, M., Isensee, K., Palmer, M. D., et al. (2021). Headline indicators for global climate monitoring. Bull. Am. Meteorol. Soc. 102, E20–E37.
Troupin, C., Beltran, J. P., Heslop, E., Torner, M., Garau, B., Allen, J., et al. (2015). A toolbox for glider data processing and management. Methods Oceanogr. 13, 13–23. doi: 10.1016/j.mio.2016.01.001
UN (2015). Transforming our World: The 2030 Agenda for Sustainable Development, A/RES/70/1, United Nations. Available online at: https://sdgs.un.org/sites/default/files/publications/21252030%20Agenda%20for%20Sustainable%20Development%20web.pdf (accessed March 3, 2021).
UNEP/MAP (2017). Barcelona Convention – Mediterranean 2017 Quality Status Report. Available online at: https://medqsr.org (accessed January 26, 2021).
UNESCO (2020). Available online at: https://en.unesco.org/ocean-decade (accessed January 15, 2020).
Vargas-Yáñez, M., Juza, M., Balbín, R., Vélez Belchí, P., García-Martínez, M. C., Moya, F., et al. (2020). Climatological hydrographic properties and water mass transports in the balearic channels from repeated observations Over 1996–2019. Front. Mar. Sci. 7:568602. doi: 10.3389/fmars.2020.568602
Virto, L. R. (2018). A preliminary assessment of the indicators for Sustainable Development Goal (SDG) 14 “Conserve and sustainably use the oceans, seas and marine resources for sustainable development”. Mar. Policy 98, 47–57. doi: 10.1016/j.marpol.2018.08.036
Visbeck, M. (2018). Ocean science research is key for a sustainable future. Nat. Commun. 9:690. doi: 10.1038/s41467-018-03158-3
Visbeck, M., Kronfeld-Goharani, U., Neumann, B., Rickels, W., Schmidt, J., Van Doorn, E., et al. (2014). Securing blue wealth: the need for a special sustainable development goal for the ocean and coasts. Mar. Policy 48, 184–191. doi: 10.1016/j.marpol.2014.03.005
Viúdez, A., Tintoré, J., and Haney, R. (1996). Circulation in the Alborán Sea as determined by quasi-synoptic hydrographic observations. Part 1:Three-dimensional structure of the two anticyclonic. gyres. J. Phys. Oceanogr. 26, 684–705.1996.
Volpe, G., Buongiorno Nardelli, B., Colella, S., Pisano, A., and Santoleri, R. (2018). “An operational interpolated ocean colour product in the mediterranean sea,” in New Frontiers in Operational Oceanography, eds E. P. Chassignet, A. Pascual, J. Tintorè, and J. Verron (GODAE OceanView), 227–244. doi: 10.17125/gov2018.ch09
Volpe, G., Colella, S., Brando, V. E., Forneris, V., Padula, F. L., Cicco, A. D., et al. (2019). Mediterranean ocean colour Level 3 operational multi-sensor processing. Ocean Sci. 15, 127–146. doi: 10.5194/os-15-127-2019
von Schuckmann, K., Le Traon, P. Y., Alvarez-Fanjul, E., Axell, L., Balmaseda, M., Breivik, L. A., et al. (2016). The Copernicus marine environment monitoring service ocean state report. J. Operat. Oceanogr. 9(Suppl. 2), s235–s320.
von Schuckmann, K., Le Traon, P. Y., Smith, N., Pascual, A., Brasseur, P., Fennel, K., et al. (2018). Copernicus marine service ocean state report, Issue 2. J. Operat. Oceanogr. 11(Suppl. 1), S1–S142.
von Schuckmann, K., Le Traon, P. Y., Smith, N., Pascual, A., Djavidnia, S., Gattuso, J. P., et al. (2019). Copernicus marine service ocean state report, Issue 3. J. Operat. Oceanogr. 12(Suppl. 1), S1–S123.
Keywords: sub-regional ocean indicators, systematic ocean monitoring, Mediterranean Sea and Balearic Islands, extreme event, marine heat wave, climate change, visualization tool
Citation: Juza M and Tintoré J (2021) Multivariate Sub-Regional Ocean Indicators in the Mediterranean Sea: From Event Detection to Climate Change Estimations. Front. Mar. Sci. 8:610589. doi: 10.3389/fmars.2021.610589
Received: 26 September 2020; Accepted: 22 February 2021;
Published: 26 March 2021.
Edited by:
Gilles Reverdin, Centre National de la Recherche Scientifique (CNRS), FranceReviewed by:
Anthony Bosse, Aix-Marseille Université, FranceKarina von Schuckmann, Mercator Ocean, France
Copyright © 2021 Juza and Tintoré. This is an open-access article distributed under the terms of the Creative Commons Attribution License (CC BY). The use, distribution or reproduction in other forums is permitted, provided the original author(s) and the copyright owner(s) are credited and that the original publication in this journal is cited, in accordance with accepted academic practice. No use, distribution or reproduction is permitted which does not comply with these terms.
*Correspondence: Mélanie Juza, mjuza@socib.es