Drones Minimize Antarctic Predator Responses Relative to Ground Survey Methods: An Appeal for Context in Policy Advice
 Douglas J. Krause
 Jefferson T. Hinke
 Michael E. Goebel
 Wayne L. Perryman2
- 1Antarctic Ecosystem Research Division, Southwest Fisheries Science Center, National Marine Fisheries Service, San Diego, CA, United States
- 2Marine Mammal and Turtle Division, Southwest Fisheries Science Center, National Marine Fisheries Service, San Diego, CA, United States
Unoccupied aerial systems (UAS) have become common tools for ecological monitoring and management. However, UAS use has the potential to negatively affect wildlife. Both policy makers and practitioners require data about the potential impacts of UAS on natural biota, but few studies exist and some of the published results conflict. We conducted two experiments to assess the responses of chinstrap penguins (Pygoscelis antarcticus), Antarctic fur seals (Arctocephalus gazella), and leopard seals (Hydrurga leptonyx) to UAS overflights. First, to provide a baseline for assessing disturbance from UAS operations, we compare behavioral responses from UAS flights to those from traditional, ground surveys. Second, to inform users and policy makers about preferred flight methods, we assess behavioral and physiological responses to UAS flown at specific altitudes, during different stages of breeding chronology, and with other site factors. Between January 2017 and March 2018 we conducted 268 UAS flight approaches and 36 ground-based surveys at Cape Shirreff, Antarctic Peninsula. We applied generalized linear mixed effects models and Kruskal-Wallis tests to 10,164 behavioral scores obtained from three independent observers. When directly compared, behavioral responses by all species to UAS overflights at 30 m were not different from control periods, while responses to ground surveys were significantly more intense. Behavioral responses generally increased as UAS flew lower, and for penguins those increases intensified as the breeding season progressed (i.e., guard and molt stages). We argue that results from UAS wildlife response studies need to be assessed relative to the impacts of alternative methods, and within the ecological context of the target species. Finally, we suggest data-driven best practices for both UAS use and for the design of future UAS-wildlife response studies.
Introduction
The use of unoccupied aerial systems (UAS), or drones, for recreational, educational, and commercial purposes has expanded rapidly in recent years (King, 2014; Crutsinger et al., 2016; Johnston, 2019). Concurrently, they have become common, often indispensable, tools for ecological monitoring and management (Goebel et al., 2015; Sweeney et al., 2015; Christie et al., 2016; Durban et al., 2016). UAS-based scientific surveys frequently obtain data that is as-or-more accurate than traditional ground-based methods (e.g., Hodgson et al., 2018; Krause et al., 2017; Torres et al., 2018). However, UAS use creates potential for negative interactions with wildlife (Lambertucci et al., 2015; Mulero-Pázmány et al., 2017; Bennitt et al., 2019). Managers and policy makers have created a patchwork of regulations to mitigate potential impacts, but policy creation and effectiveness is limited by a lack of objective data on the effects of UAS on wildlife (Linchant et al., 2015; Gomez et al., 2016; Wallace et al., 2017). Resultant appeals to ecological monitoring programs to systematically collect UAS-wildlife response data to better inform UAS guidelines (e.g., Smith et al., 2016; Mustafa et al., 2018) have produced varied results.
A major challenge to reconciling disparate wildlife-UAS interaction results is the large number of variables that may affect animal behavior in such studies (Raoult et al., 2020). Wildlife response may differ depending on: type and size of UAS (McEvoy et al., 2016), method of operation (Vas et al., 2015), amplitude and frequency of noise (Scobie and Hugenholtz, 2016; Arona et al., 2018), age, sex, breeding chronology (Weimerskirch et al., 2018), species (Ramos et al., 2018), and even by individual (Pomeroy et al., 2015, this study), among other variables (Mustafa et al., 2018). Some of this complexity will resolve with a dramatic increase in UAS wildlife response studies. However, even among studies using similar parameters some results conflict. For example, horizontal overflights by small UAS (<5 kg) at altitudes of 25–40 m were reported to cause disturbance to penguins (Ratcliffe et al., 2015; Rümmler et al., 2016, 2018), dolphins and manatees (Ramos et al., 2018), albatross and petrels (Weimerskirch et al., 2018). Yet other studies reported little to no effect of UAS use under similar conditions for whales (Domínguez-Sánchez et al., 2018; Torres et al., 2018), fur seals (McIntosh et al., 2018), and various species of birds (Vas et al., 2015; McEvoy et al., 2016), even when comparing congeneric penguins in similar field conditions (Goebel et al., 2015; Weimerskirch et al., 2018; this study).
Ultimately, different conclusions about UAS impacts on wildlife may arise from differences in the baseline conditions against which UAS impacts are assessed. With so many potential variables it is crucial that behavioral impacts are evaluated relative to the same standards. For example, in a given system UAS may elicit a behavioral response, but that result does not provide a framework to decide if the UAS is better or worse than another method. We argue that wildlife response to UAS should be assessed by researchers, and interpreted by policy makers, relative to alternative methods (e.g., Moreland et al., 2015; Barnas et al., 2018). Wildlife researchers should design their studies in comparison to commonly used and accepted methods for wildlife study (e.g., ground or manned aerial surveys). Other users should assess UAS impact in concert with the alternate case. Such context is required to reduce confusion and truly inform regulation of UAS activities to benefit wildlife.
Accurate population counts and body condition measurements of upper trophic-level predators are fundamental to ecosystem management in the Antarctic (Agnew, 1997; Boyd et al., 2006). While UAS facilitate such population counts (Goebel et al., 2015; Pfeifer et al., 2019) and body condition measurements (Krause et al., 2017), a comparison of wildlife behavioral response to UAS vs. alternative observational methods has not been done. To evaluate the behavioral effects of UAS overflights on Antarctic megafauna, we use three target species and conduct two separate experiments. First, we directly compared the behavioral effects of UAS flights at a standard flight altitude (30 m) to those from traditional, ground survey methodologies used to census colonial chinstrap penguins (Pygoscelis antarcticus, CHPE) and Antarctic fur seals (Arctocephalus gazella, AFS), or measure solitary leopard seals (Hydrurga leptonyx, LS). Results from the survey comparison provide context for outcomes of the second experiment, an altitude comparison, to assess behavioral and physiological responses to UAS flown at specific altitudes and during different stages of breeding chronology. The altitude comparison study was done to inform users and policy makers about preferred flight altitudes and methods. Each target species in our study present unique challenges and opportunities for study in the field. Therefore, while we applied the same general experimental design to all species, we tuned our data collection, when possible, to address specific covariates relevant to the behavioral responses of each species. For example, during the altitude comparison study over AFS, we assessed the influence of sex, level of human exposure, ambient wind speed, and UAS approach direction (upwind or downwind) on behavioral responses. For LS, we observed both behavioral and physiological (respiration rate) responses and considered molt phase as a potential factor that may affect their response to UAS overflight.
Materials and Methods
Field studies were done at the National Oceanic and Atmospheric Administration (NOAA) research facility on Cape Shirreff (62.47° S, 60.77° W), Livingston Island, Antarctic Peninsula. NOAA’s United States Antarctic Marine Living Resources (U.S. AMLR) Program conducts long-term monitoring of Antarctic krill (Euphausia superba) and dependent penguin, seal, and fur seal populations at Cape Shirreff. The breeding season for CHPE and AFS falls between November and March annually (Hinke et al., 2007). LS do not breed at Cape Shirreff, but seasonally resident animals haul-out there each year from December through May (Krause et al., 2016). All ground and aerial surveys were conducted between December and March of the 2016/17 and 2017/18 seasons.
UAS Platform
All survey flights used an APH-22 hexacopter (Aerial Imaging Solutions LLC, Old Lyme, CT). The APH-22 is a small (1.2 kg, payload capacity: 1 kg, diameter < 60 cm) UAS configured with a downward facing Olympus E-PM2 digital camera and a single battery (QuadroPower 6200 mAh Li-PO) as payload. This platform was selected because it is robust to prevailing Antarctic temperature and wind conditions and is small, portable over rough terrain, and relatively quiet for a small UAS (31.3–57.8 decibels at 0–90 m distance, Goebel et al., 2015). The APH-22 and associated flight protocols have been well described in previous studies (Durban et al., 2015; Krause et al., 2017).
To limit disturbance during UAS setup, take-offs, and landings, all flight operations were staged, and all mid-flight altitude changes were made, ≥50 m (range: 55–120 m) horizontally from focal animal groups (Figure 1). All reported flight altitudes were Above Ground Level.
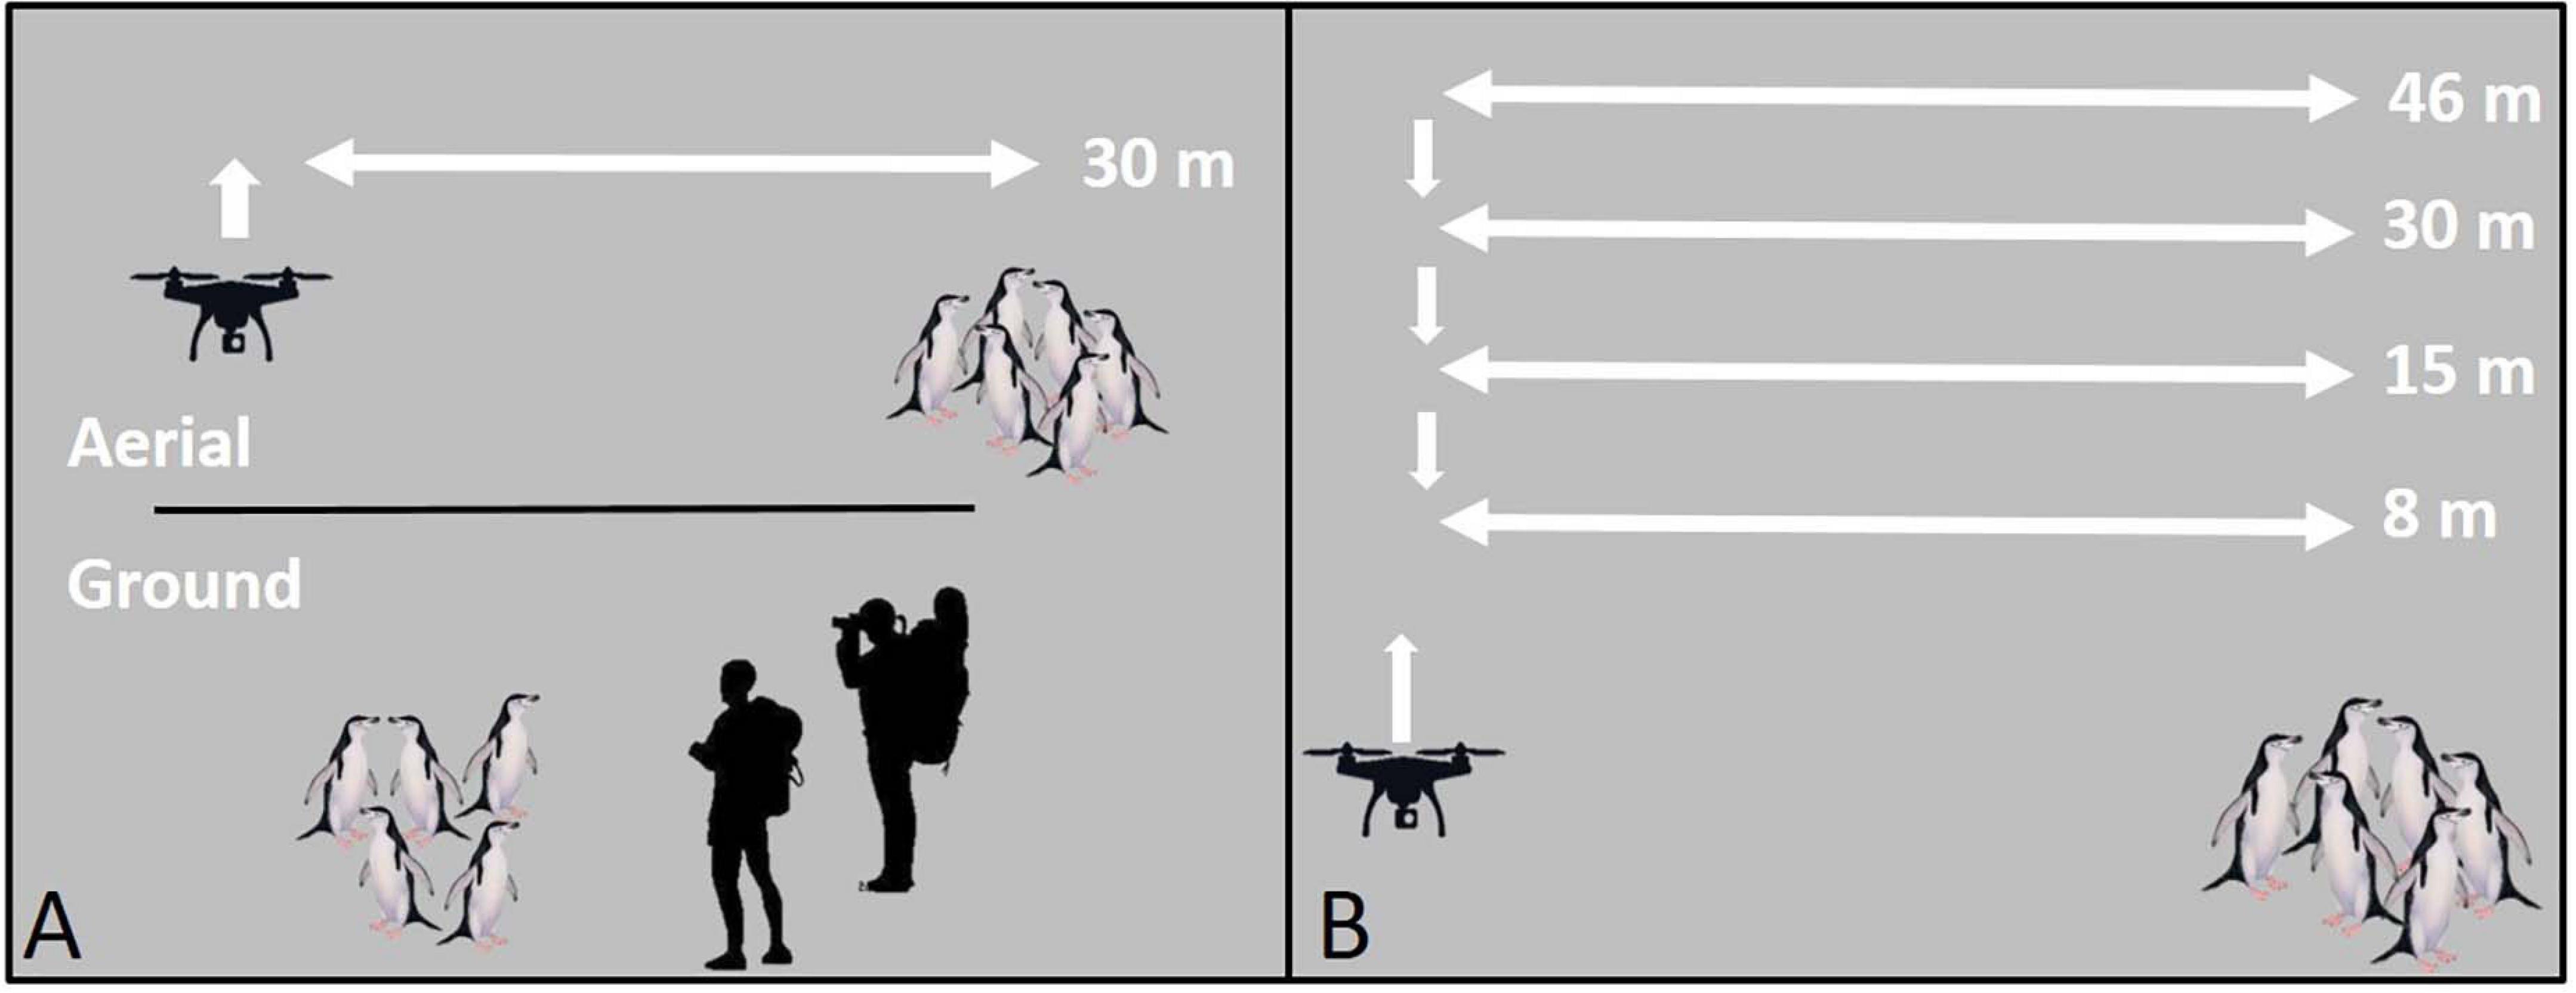
Figure 1. A schematic of unoccupied aerial systems (UAS) flight patterns for the (A) survey comparison study, and (B) altitude comparison study using penguins as an example species. All take-offs, landings, and mid-flight altitude changes were conducted ≥50 m from target animals.
Data Collection
During each field season we identified healthy (i.e., uninjured, good body condition) groups of CHPE and AFS, or individual LS, during each of our target breeding stages (Table 1). We selected sections of CHPE colonies of similar size to control for potentially stronger reactions from birds in smaller groups (e.g., Rush et al., 2018) that provided clear view of both peripheral and interior nests (typically ∼ 30 individuals) We selected harems of AFS, generally containing a single male and several females (typically ∼ 10 individuals). We sampled LS individually because they are typically encountered ashore as solitary animals.
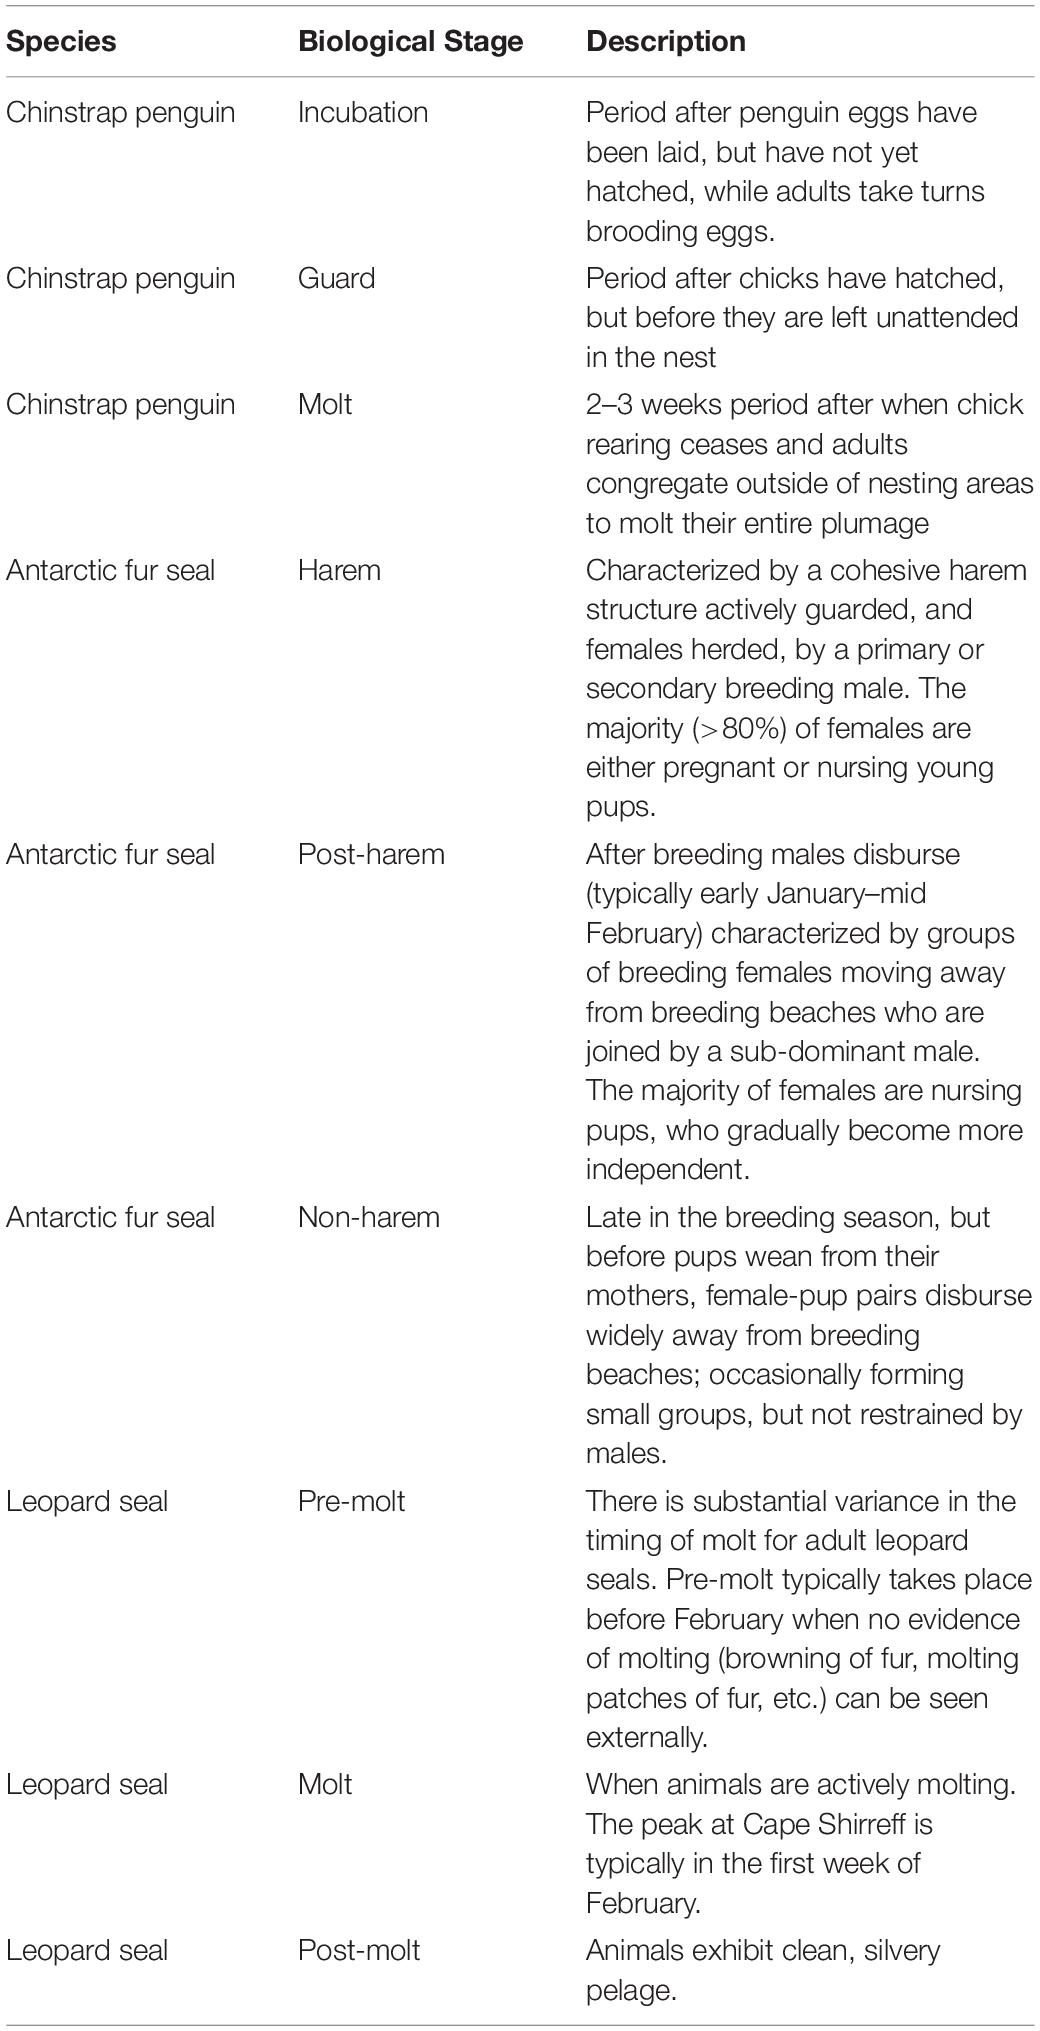
Table 1. Names and descriptions of the three breeding chronology or biology stages targeted during ground and aerial surveys for all three study species.
For all three species, and for all ground and aerial surveys, we placed automated horizontal-facing cameras (Reconyx PC800, 6.1 MP) ∼15 m from the focal group (Figure 2). In order to limit and control for potential disturbance, cameras were transported carefully by a single, experienced researcher ≥5 min prior to commencing flight operations or grounds surveys. Visible reactions from target individuals due to camera set-up were minor (e.g., sleeping animals opening their eyes, no movement or locomotion), and subsided immediately. The Reconyx camera recorded one photo per second before, during, and after all flights and ground surveys.
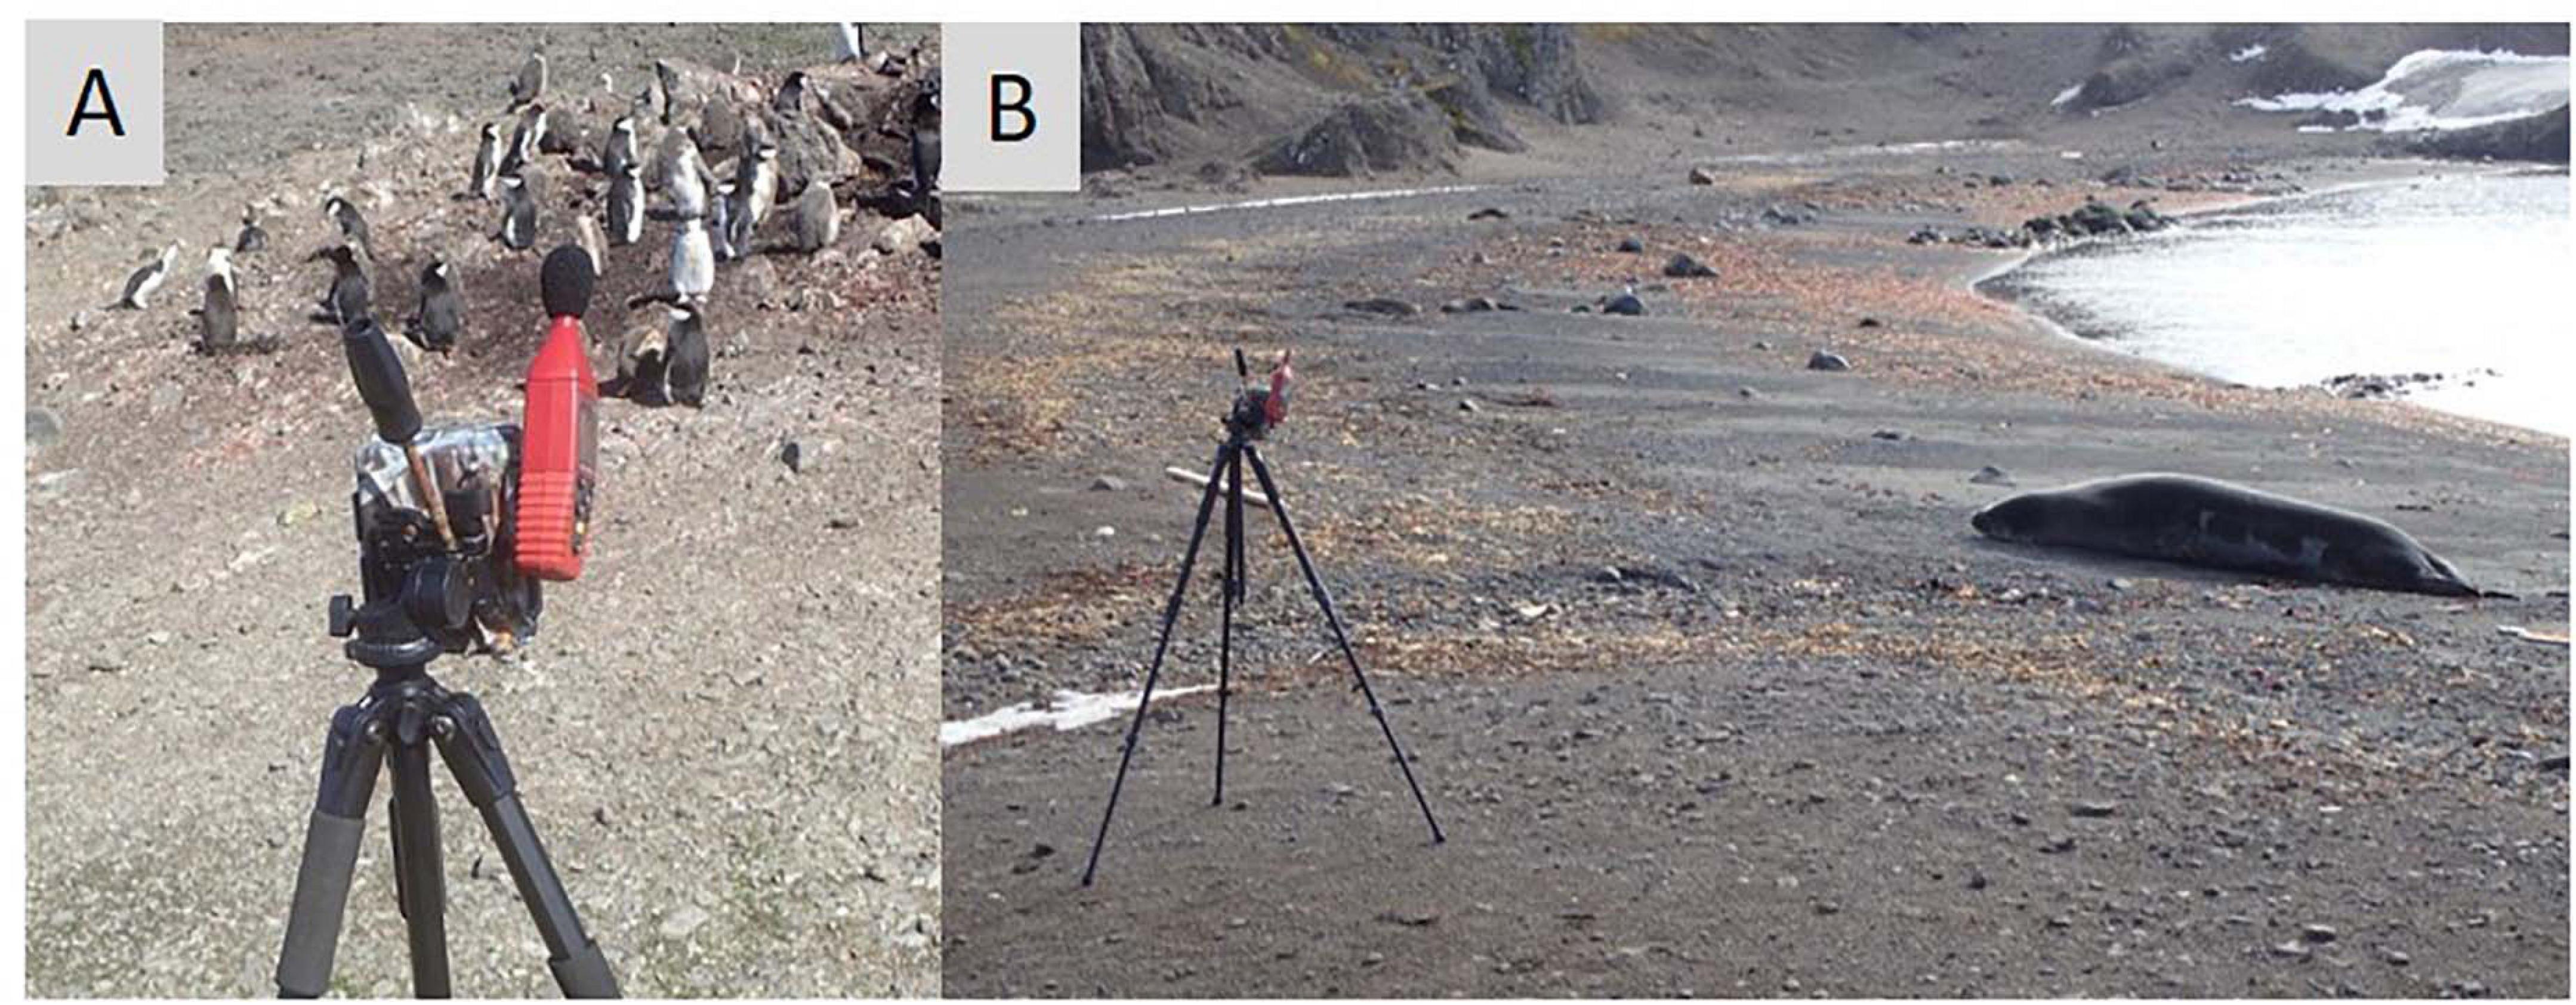
Figure 2. Examples of automated digital camera (Reconyx) placement. Each recorded horizontal-facing photographs of study animals, including: (A) chinstrap penguins and (B) a leopard seals.
Survey Comparison Study
For comparisons of behavioral response between UAS flights and traditional ground survey methodologies we selected ongoing studies where UAS methods are comparably accurate to ground methods: CHPE nest and chick census, AFS pup census (Goebel et al., 2015), and LS body mass, and condition measurements (Krause et al., 2017). We flew the UAS missions at an altitude of 30 m (Figure 1A) because this altitude is commonly used in UAS operations over wildlife (Ratcliffe et al., 2015; Krause et al., 2017; Weimerskirch et al., 2018; Raoult et al., 2020) and within the range where reported animal responses differ across studies. The length of each flight was set by the length of time needed to collect the required data (e.g., census counts, or body measurements), or a minimum of 60 s. During ground surveys, for CHPE, two field technicians using binoculars and hand-counters approached colonies annually to census nests (December) and, later, chicks (February). Every effort was made to reduce animal disturbance, however, ground surveys typically required close approach (≤5 m) or entrance into the colony on foot for accurate counting of dense aggregations. AFS pups were counted from the entire Cape Shirreff population in late December annually. Each breeding group was censused systematically by a single observer using a hand counter and walking within ∼ 5 m of animal groups. Finally, the U.S. AMLR program estimates the body condition of leopard seals annually at Cape Shirreff. Before UAS techniques were instituted in 2017 (Krause et al., 2017), measuring the size and mass of LS necessitated sedation captures undertaken by teams of ≥5 researchers (Krause et al., 2017).
In order to maintain independence for the survey comparison study we monitored separate target groups for each species during UAS overflights, ground surveys, and control periods. UAS overflights were conducted on the same breeding beach and within 4–48 h of ground surveys to ensure environmental conditions were a similar as possible.
Altitude Comparison Study
The altitude comparison study required repeated occupation of positions over target animals at successively lower altitudes (Figure 1B). We controlled for particularly disruptive, high-engine-noise UAS flight maneuvers by conducting in-flight altitude changes ≥50 m horizontally from target animal groups (Figure 1B). Pilots flew missions manually. During approach to the target groups they did not vary the aircraft altitude and used consistent flight speeds (range: 3–4 m/s). Once overhead, the UAS hovered over the group for 60 s at each altitude starting at 46 m to the lowest altitude at 8 m. Because we flew over target groups repeatedly (Figure 1B), observed reactions may be caused by repeated or prolonged exposure rather than detection of the UAS at a specific altitude. However, previous studies indicate that animals typically react upon first detection of the UAS even on repeated flights (Pomeroy et al., 2015; Vas et al., 2015; Rümmler et al., 2016; Mulero-Pázmány et al., 2017), suggesting that any bias for cumulative impacts of repeated overflight should be minimal (Bennitt et al., 2019). For AFS sampling flights we also collected data on wind speed (knots, measured 2 m above the ground during UAS setup with hand-held, Kestrel 3000, anemometer) and UAS approach direction (upwind or downwind). Further, to address questions about the effects of habituation of AFS to human presence, we included harem groups that routinely experience daily or weekly exposure to humans (“high exposure”) and harem groups with limited exposure (0–2 times per year) to humans (“low exposure”). Additionally, for all AFS and LS flights, ground-based observers hid behind natural obstructions 20–30 m from target animals and scored behavioral responses, and respiration rates (LS only), in real-time aided by 10 × 40 binoculars.
The altitude comparison study featured a repeat measures design, therefore the same target groups were used for each flight mission [all altitudes, and the control period (see section “Control Groups”)].
Behavioral Scoring From Photographs
We aligned time and date stamps (resolution = 1 s) between each Reconyx and UAS photographs taken when the UAS was above target animals. Three, independent observers identified clearly visible individual animals within each photograph (e.g., Figure 3) and scored their behavior using a five-point scale. The CHPE scale was taken from Weimerskirch et al. (2018) derived from previous reaction studies on penguins (Rümmler et al., 2016, 2018 and references therein; Table 2). We developed a similar, five-point behavioral reaction scale for AFS and LS (Table 3) based on the definition of minor and transitory (Level B) harassment provided by the NOAA Office of Protected Resources pursuant to the provisions of the U.S. Marine Mammal Protection Act of 1972 as amended (MMPA; 16 U.S.C. 1361 et seq.) and the regulations governing the taking and importing of marine mammals (50 CFR Part 216). This U.S. law provided a standardized definition of the behavioral reaction of a pinniped to external stimulus other than direct contact, capture, or death. During each observation period we used the highest number score for each animal in each treatment group for statistical analysis.
Figure 3. An example of Reconyx photographs with study animals labeled from: (A) a chinstrap penguin colony, and (B) an Antarctic fur seal Post-harem group.
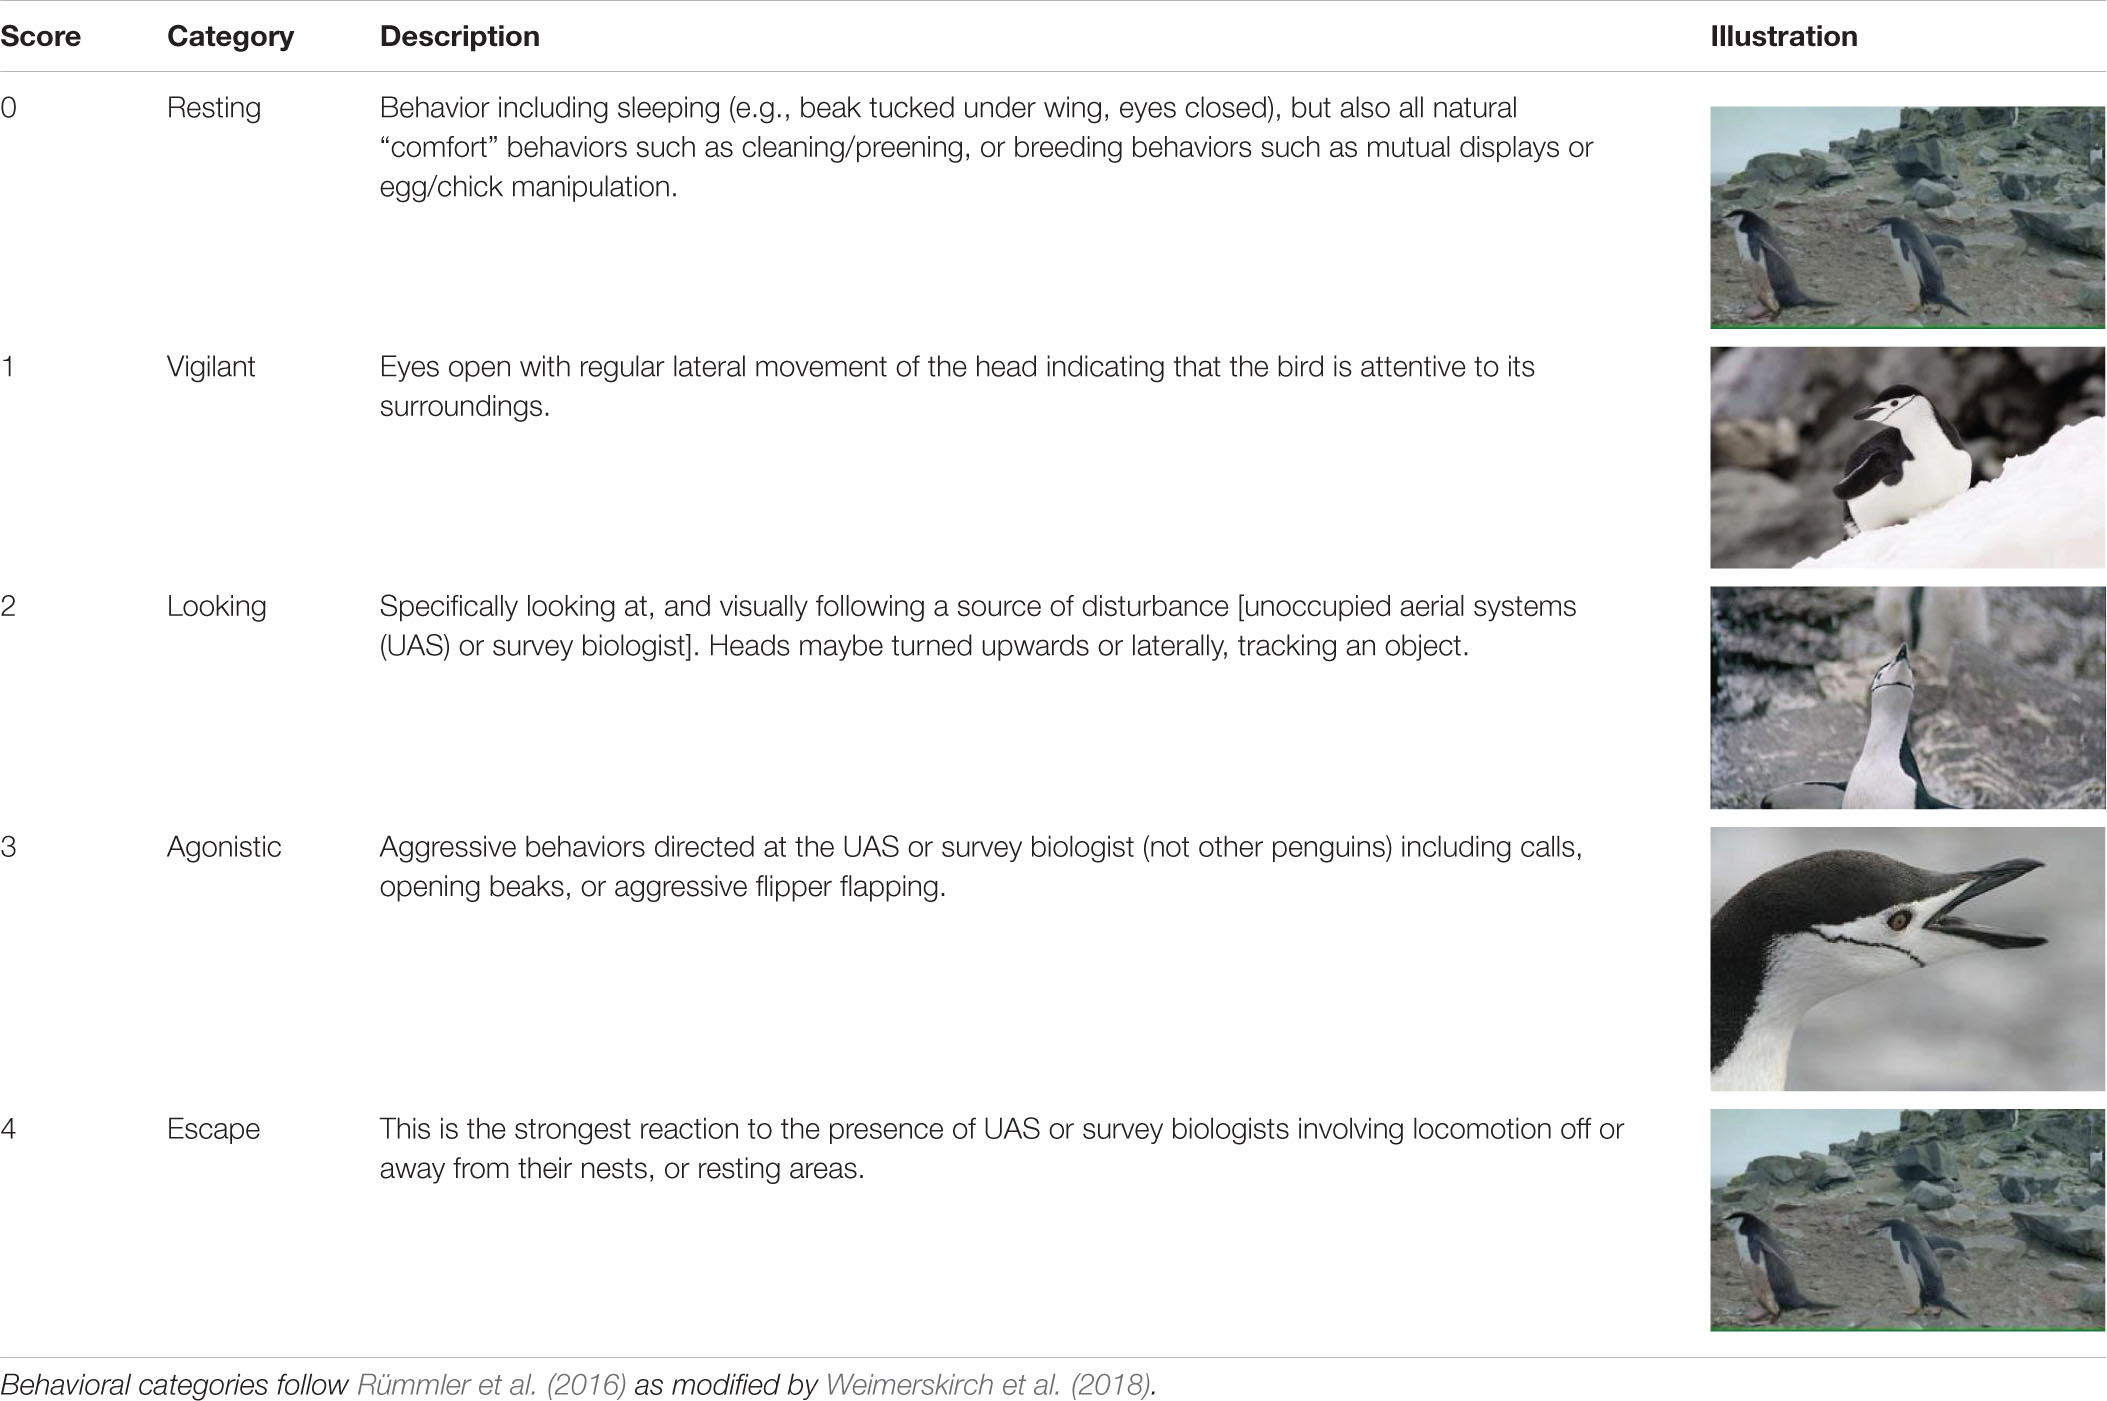
Table 2. Ethogram describing the five levels of behavioral response scores (n = 4,809) assigned by independent observers based on photographs of chinstrap penguins.
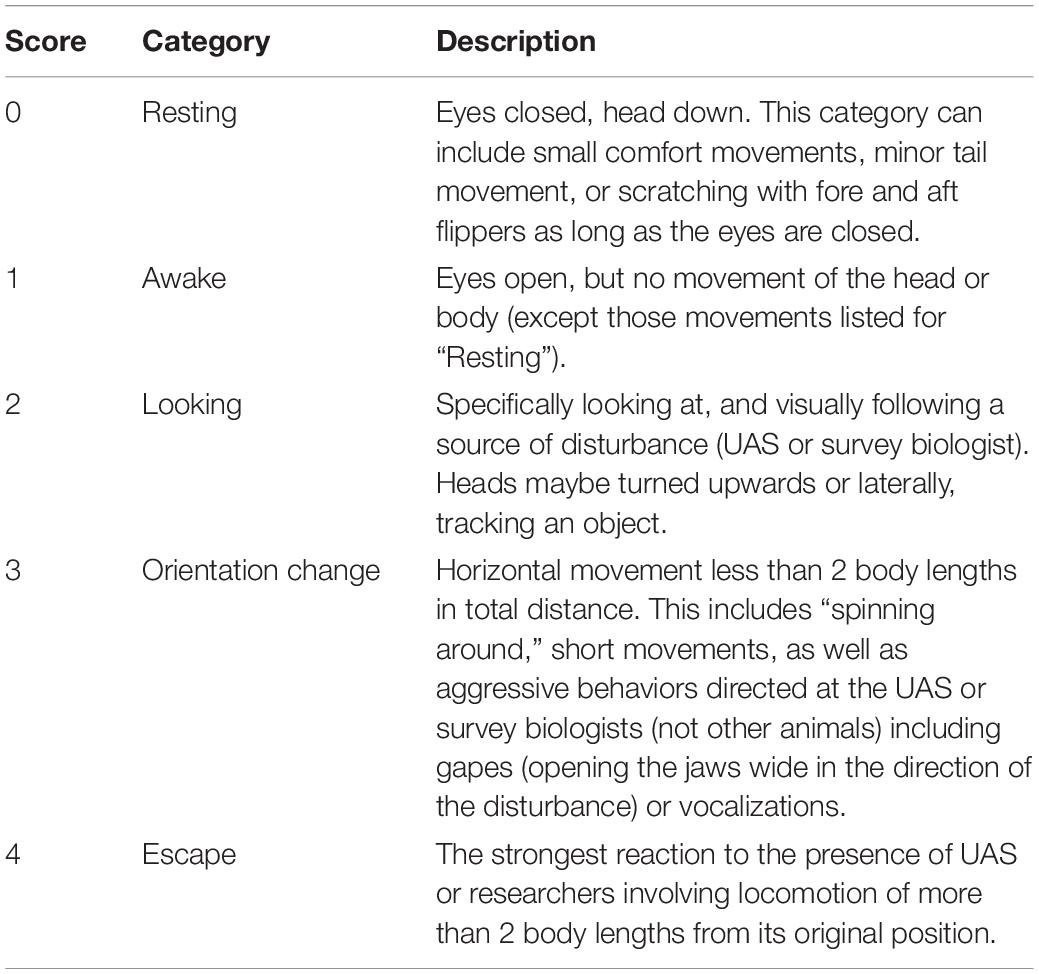
Table 3. Ethogram describing the five levels of behavioral response scores assigned by independent observers based on photographs of Antarctic fur seals (n = 4,734) or leopard seals (n = 621).
Study and altitude information was removed from photos and data sheets to prevent subconscious bias amongst observers. Only in rare instances (4 of 31 fur seal groups), when the Reconyx camera failed due to wind or user error, we used the scores recorded by dedicated, in situ observers.
Control Groups
For both the survey comparison and the altitude comparison experiments our observers scored a set of 60 consecutive photographs (1 min) from each target group, taken ≥2 min before the initiation of UAS flights, or independently from ground surveys. We used these behavior observations as behavioral controls (hereafter: “control”).
Observing Respirations
Physiological metrics, like respiration rates, can be used to detect stress responses in wild animals (Mortola, 2015; Weimerskirch et al., 2018). Visual observers positioned themselves with a clear view of the target LS nose in order to record the respiration rate (breaths/min). Observers counted respirations for 60 s during control periods and specific UAS overflight altitudes (hereafter: “physiological response”).
Data Analysis
The null hypothesis for our study questions was that no difference in behavioral scores (all species) or respiration rates (LS) existed when grouped by specific UAS flight altitudes or survey techniques compared to our controls. We used three modeling frameworks to test for differences between: (1) behavioral scores taken from independent target groups during control, ground, and aerial surveys (hereafter: “survey comparison study”), (2) behavioral scores taken repeatedly from one target group at specific altitudes (hereafter: “altitude comparison study”), and (3) LS respiration rates taken repeatedly from one individual at specific altitudes (part of: “altitude comparison study”). Further, three independent observers (“observer”) scored each animal in each treatment group. We conducted all analyses using R 3.5.3 (R-Core-Team, 2019).
Survey Comparison Study
Our aerial-ground survey comparison data had no pertinent covariates and scores between surveys were independent. Therefore, we tested for differences in Antarctic predator behavioral responses grouped by survey type (levels = Ground, Aerial, Control) using Kruskal-Wallis and multiple-comparison Dunn tests (Dunn, 1964). To account for multiple statistical tests, p-values were adjusted using the Benjamini-Hochberg method (Ogle, 2016).
Altitude Comparison Study
The behavioral scores at specific altitudes are categorical, ordinal (there is a specific order to the scores that is sequential), and non-normally distributed. We applied generalized ordinal logistic mixed effects models (a.k.a., proportional odds models or cumulative link mixed models) implemented with the R package ordinal (Christensen, 2018) with behavioral response as the dependent variable.
For all species in all models we assigned flight altitude (levels = Control, 46 m, 30 m, 15 m, 8 m) as a fixed effect and observer (levels = Obs1, Obs2, Obs3) as a random effect. We also evaluated the potential importance of a suite of covariate effects when that data was available for a given species. For CHPE we tested breeding stage as a fixed effect (“stage,” levels = Incubation, Guard, Molt). For AFS we evaluated breeding stage (“stage,” levels = Harem, Post-harem, Non-harem), sex (levels = Male, Female), level of human exposure (“exposure,” levels = High, Low), wind speed (range = 4–16 knots), and UAS approach direction (“approach,” levels = Up-wind, Down-wind) as fixed effects. For LS we tested molt stage (“molt stage,” levels = Pre-molt, Molt, Post-molt) as a fixed effect and Seal ID (unique identity of each leopard seal, levels = 25 × seal ID’s) as a random effect.
Finally, for the physiological response portion of the altitude response study we used respiration rate (breaths/minute) as a marker of physiological change in response to UAS presence. These data are numerical counts (range: 3–16) that are not normally distributed. We applied generalized linear mixed effects models with a Poisson (link = “log”) distribution implemented with the R package lme4 (Bates et al., 2015) with respiration rate as the dependent variable, and altitude and molt stage as fixed effects. Seal ID was included as a random effect to account for the fact that mammalian resting respiration rates vary individually based on mass, age, cardiovascular health, and other factors (Mortola, 2015 and references therein). Finally, we calculated a semi-partial R2 (RΣ2) to evaluate the generalized variance explained by our fixed effects (Jaeger et al., 2017).
Candidate model effects were tested individually using paired likelihood ratio tests (Pinheiro and Bates, 2000; Bolker et al., 2009) compared with the base model (intercept and observer as a random effect only). All significant effects were included in a forward stepwise model selection process informed both by comparing model AIC (Akaike, 1973) and paired likelihood ratio tests.
Model Assumption Evaluations
We verified that each of our generalized linear mixed effects models met relevant assumptions (linearity, absence of collinearity, homoscedasticity, normality of residuals, and absence of influential data points). We also evaluated all linear mixed effects models for overdispersion (Bolker et al., 2009). Finally, the Condition number of Hessian provides a measure of goodness of model fit for ordinal logistic models; values below 10^4 indicate a good fit (Christensen, 2018).
Results
Between January 2017 and March 2018 we flew 74 UAS flight missions (including 268 target group approaches) and 36 ground-based surveys of 14 colonies of CHPE, 31 harem groups of fur seals, and 25 individual leopard seals (Supplementary Table 1). The average focal group sizes were 27.7 (s.d. 12.7) for penguins, 11.1 (s.d. 4.8) for fur seals, and leopard seals were solitary. The total sample sizes and number of behavioral scores assigned are listed in Table 4.
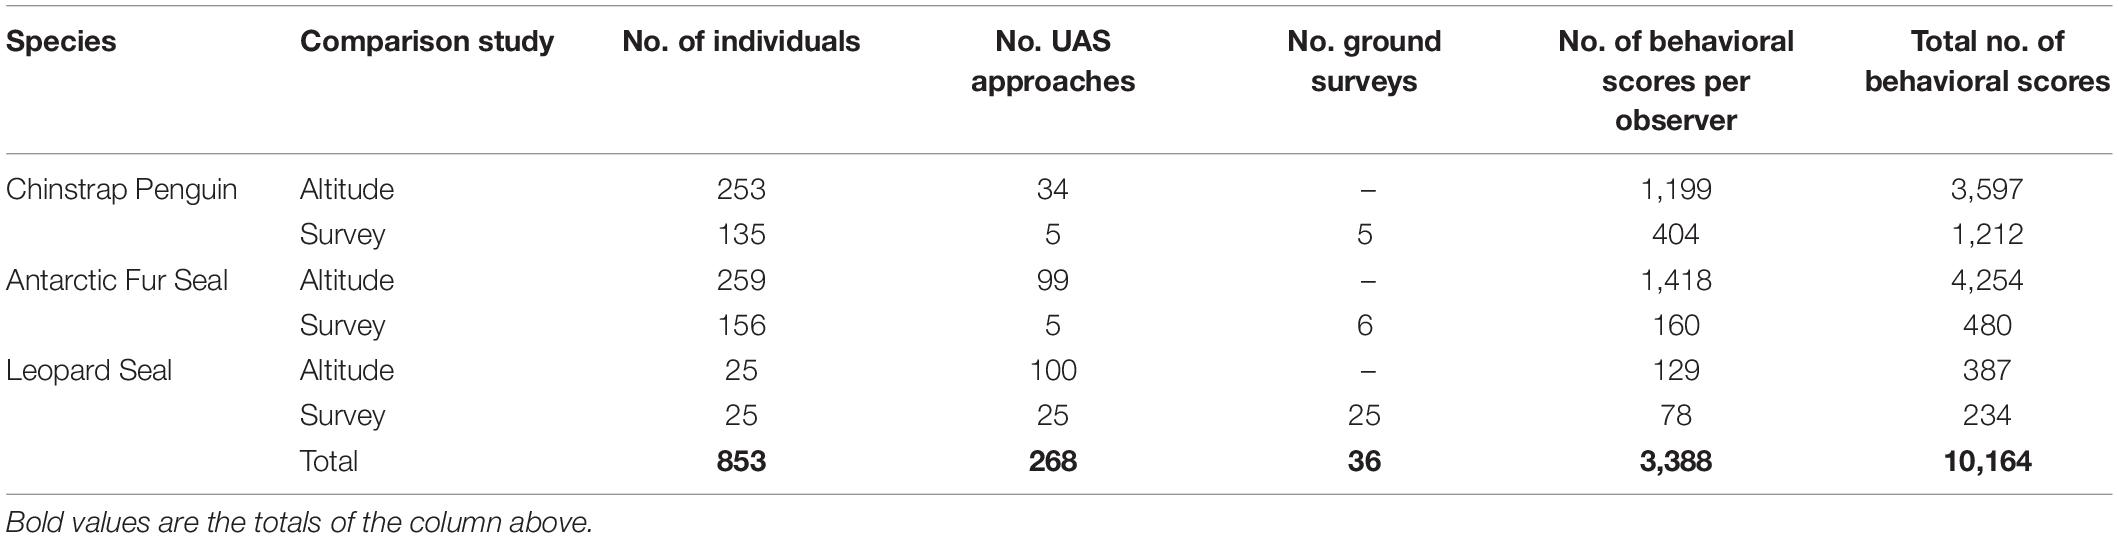
Table 4. Numbers of flights, ground surveys, and individual animals scored by independent observers for behavioral reaction to unoccupied aerial systems (UAS) approach listed by species and study.
Survey Comparison Study
For all three species behavioral response scores did not differ significantly between UAS aerial surveys (30 m altitude) and control observations. In contrast, the behavioral responses to ground surveys were significantly higher than during aerial surveys and control periods (Table 5 and Figure 4). However, even during ground surveys escape responses were rare for CHPE (6.2% of scores) and AFS (1.3% of scores). Leopard seals reacted to manual sedation captures by moving to the water post-capture 100% of the time (Supplementary Figure 1).
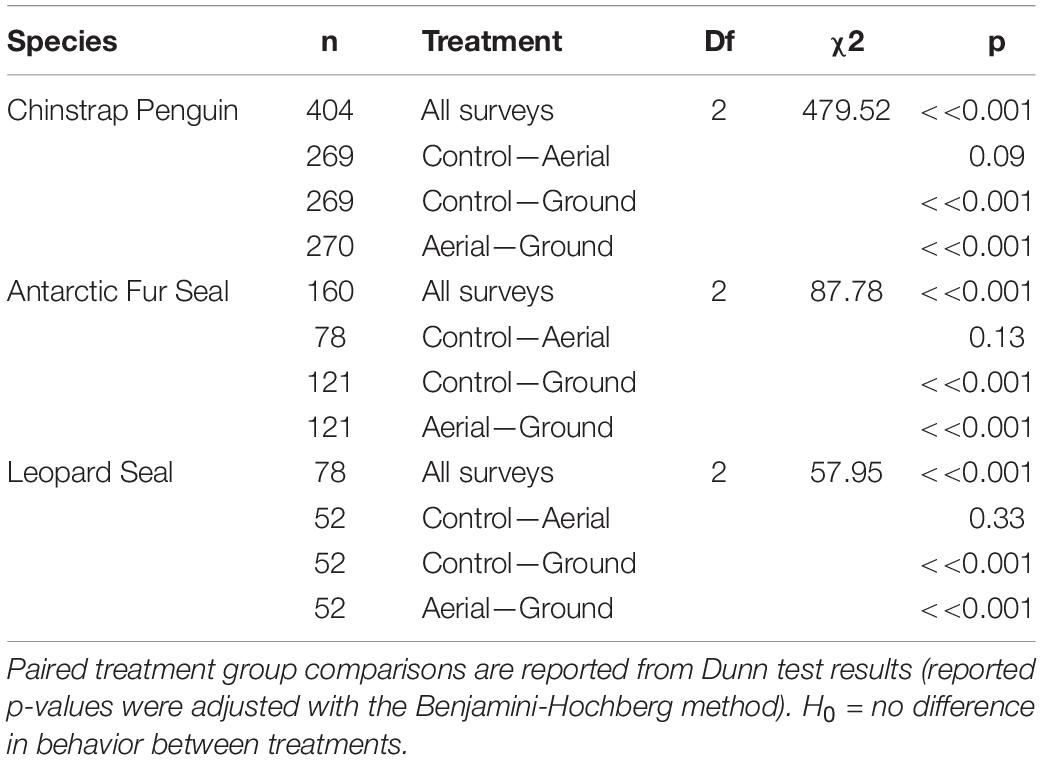
Table 5. Kruskal-Wallis test results comparing Antarctic predator behavioral responses grouped by survey type (levels = Ground, Aerial, Control).
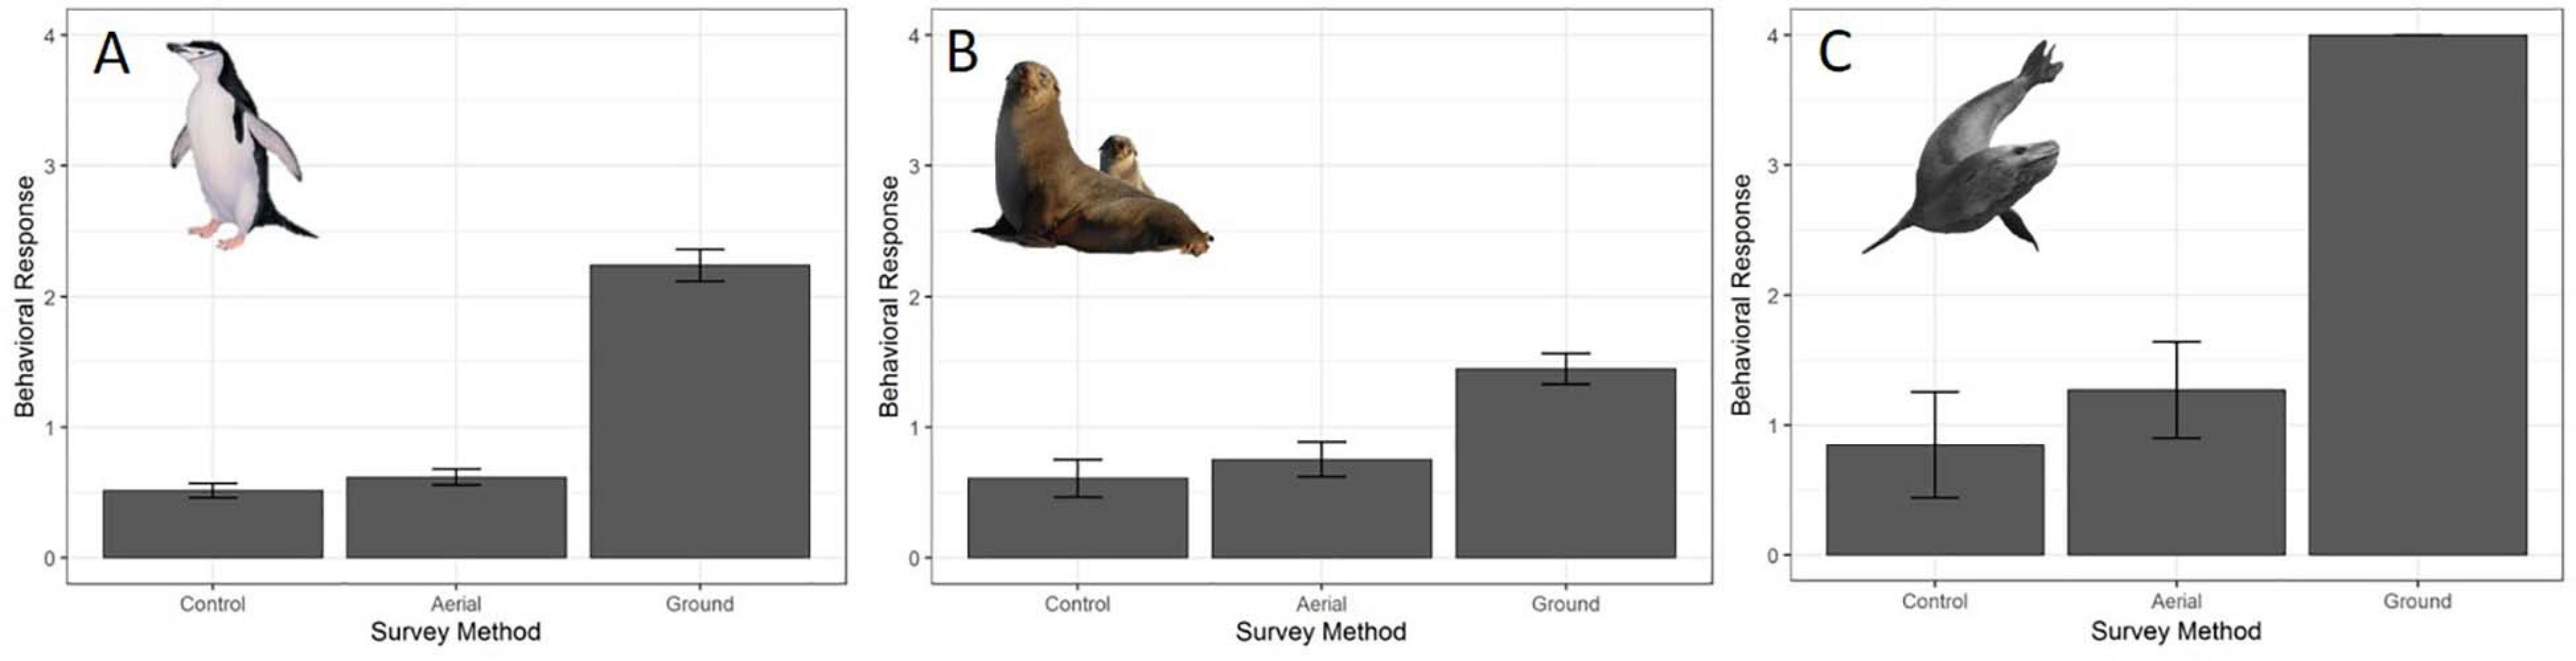
Figure 4. Average behavioral responses (plotted with standard deviation error bars) (A) of adult chinstrap penguins (CHPE, n = 1212 scores), (B) Antarctic fur seals (AFS, n = 480 scores) and (C) leopard seals (LS, n = 234 scores) to UAS overflights at 30 m versus ground-based surveys. The behavioral reaction of LS to ground-based capture/measurement was “escape” (level 4) 100% of the time.
Altitude Comparison Study
Chinstrap Penguins
The behavioral response scores of chinstrap penguins when UAS hovered at 46 and 30 m were indistinguishable from those recorded during the control period, but then increased at 15 and 8 m (Figure 5A). The most common behavioral scores were resting (“0”) and vigilant (“1”) for all flights above 30 m, and escape (“4”) only occurred during low altitude molt-stage flights and ground-based chick counts (Supplementary Figure 2). Ordinal logistic models fit the data well (Condition number of Hess < 10∧3), and the most informative model included effects for altitude, stage, and the interaction between altitude and stage (Table 6).
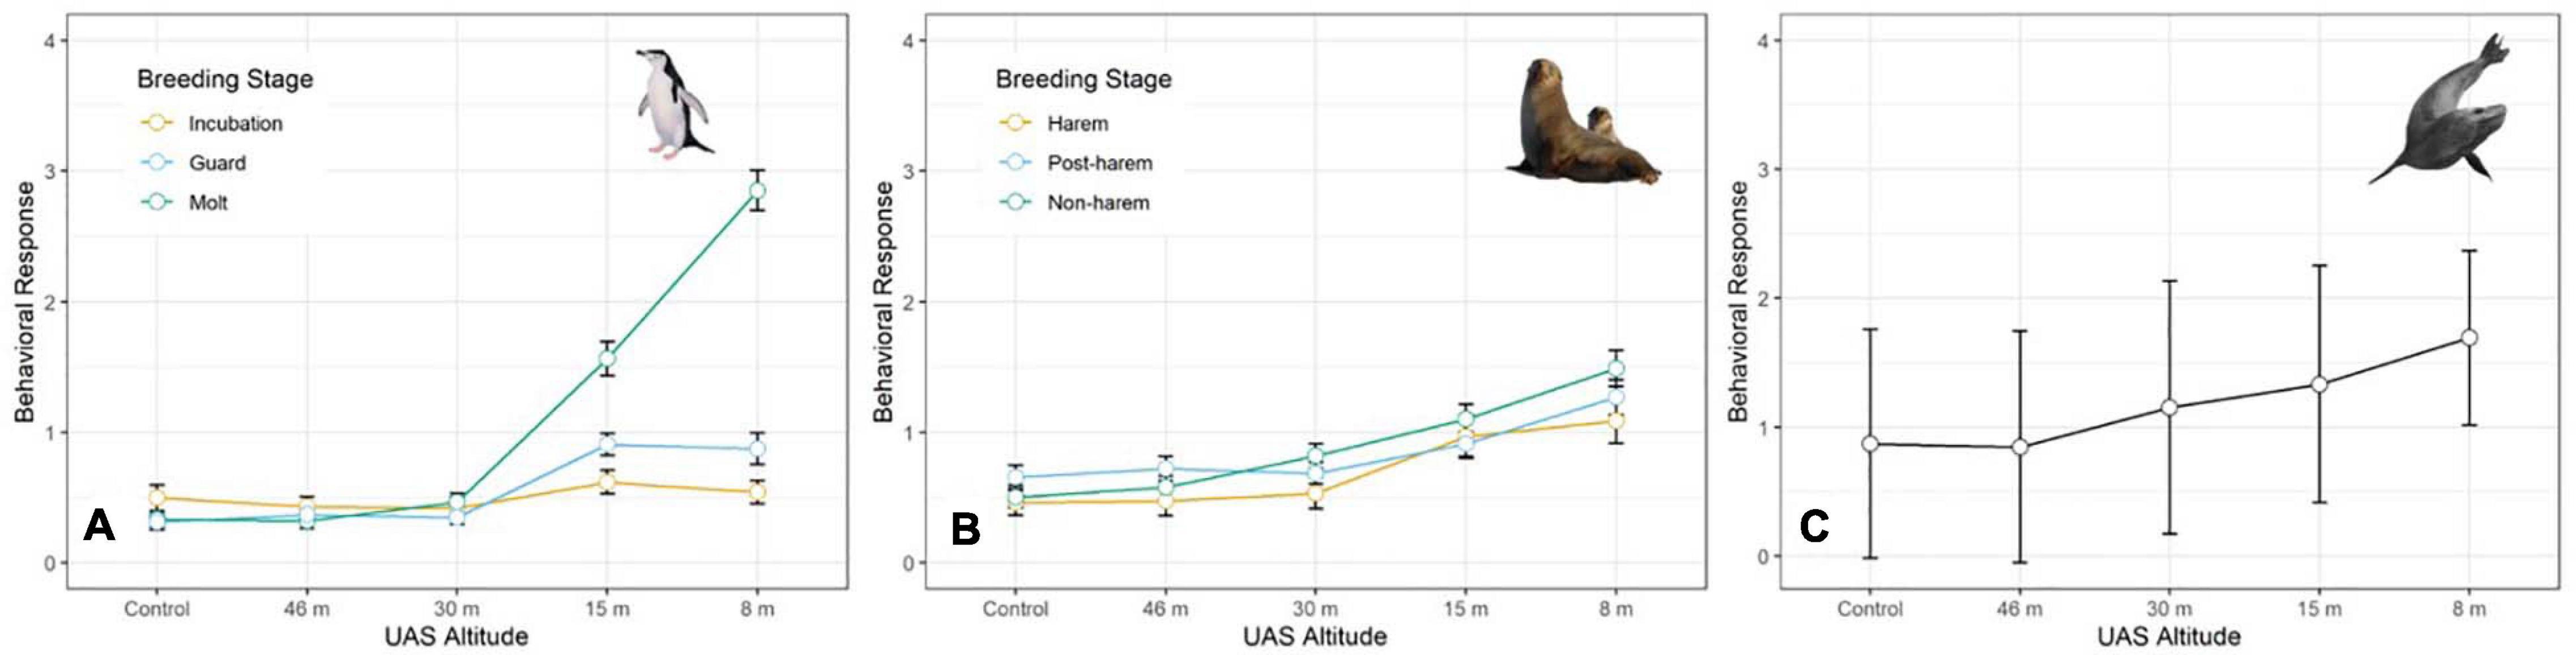
Figure 5. Average behavioral responses (plotted with standard deviation error bars) of (A) adult chinstrap penguins (CHPE, n = 3,597 scores), (B) Antarctic fur seals (AFS, n = 4,254 scores) during early, mid-, and late stages of their summer breeding chronologies, and (C) and leopard seals (LS, n = 387 scores) to unoccupied aerial systems (UAS) overflights at specific altitudes.
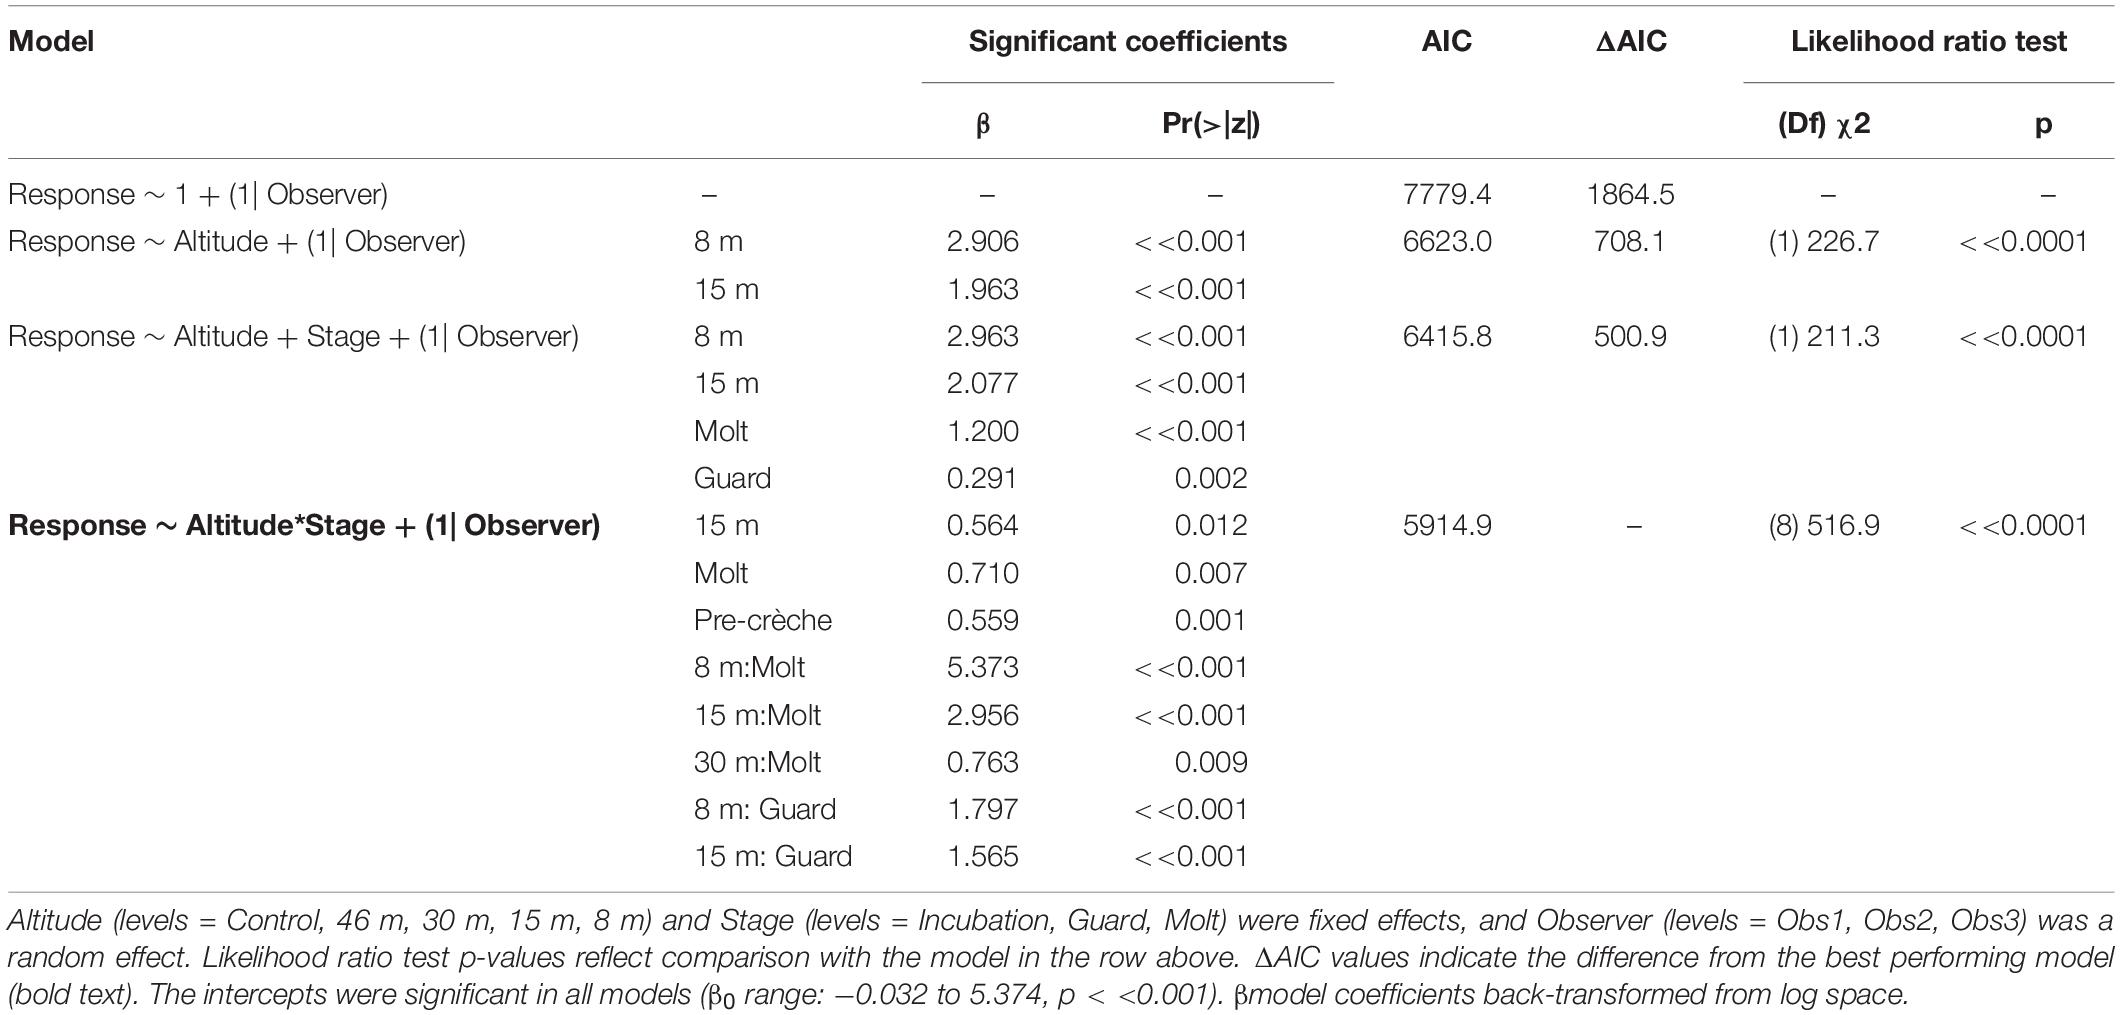
Table 6. Generalized ordinal logistic mixed effects model results of behavioral response scores (n = 3,597) from chinstrap penguins at Cape Shirreff, Livingston Island in 2017 and 2018.
The behavioral responses of chinstrap penguins were significantly higher during UAS overflights at 15 and 8 m [χ2(1) = 226.7, p << 0.0001). The coefficients for 15 and 8 m were positive, indicating that lower altitudes are likely to increase behavioral scores. Behavioral reactions at altitudes 46 or 30 m did not inform any model suggesting they could not be distinguished from behaviors during controls (Table 6). In combination with altitude effects, behavioral reaction scores increased when birds were guarding chicks and molting [χ2(8) = 516.9, p << 0.0001].
Antarctic Fur Seals
Fur seal behavioral responses at 46 m were not different from the control; however, responses were progressively higher for 30, 15, and 8 m flights (Figure 5B). The most common behaviors were resting (“0”) and awake (“1”) for all flights ≥30 m, and escape (“4”) reactions at all altitudes were rare [observer mean = 21.0 (s.d. 19.1) of 1,418 scored reactions, Supplementary Figure 3]. The coefficients for 30, 15, and 8 m flights had positive slopes [χ2(4) = 334.2, p << 0.0001, Table 7] indicating that reactions were stronger at lower altitudes. Ordinal logistic models fit the data well (Condition number of Hess < 10^3). The most informative model included effects for altitude, approach direction, sex, and human exposure level. Males and animals with low previous exposure to humans were more likely to have higher scores than females [χ2(1) = 18.0, p << 0.0001] and high exposure animals [χ2(1) = 79.9, p << 0.0001], respectively (Supplementary Figure 4). When the effect of wind speed was tested, the model did not converge, but flights that approached target fur seals from downwind had reduced behavioral reactions compared to flights that approached from upwind [χ2(1) = 24.0, p << 0.0001, Supplementary Figure 4B]. Model comparison indicated that later season breeding stages induce higher behavioral scores [χ2(2) = 20.0, p < 0.0001]. However, when other factors were accounted for, stage did not inform the model [χ2(2) = 1.8, p = 0.4141].
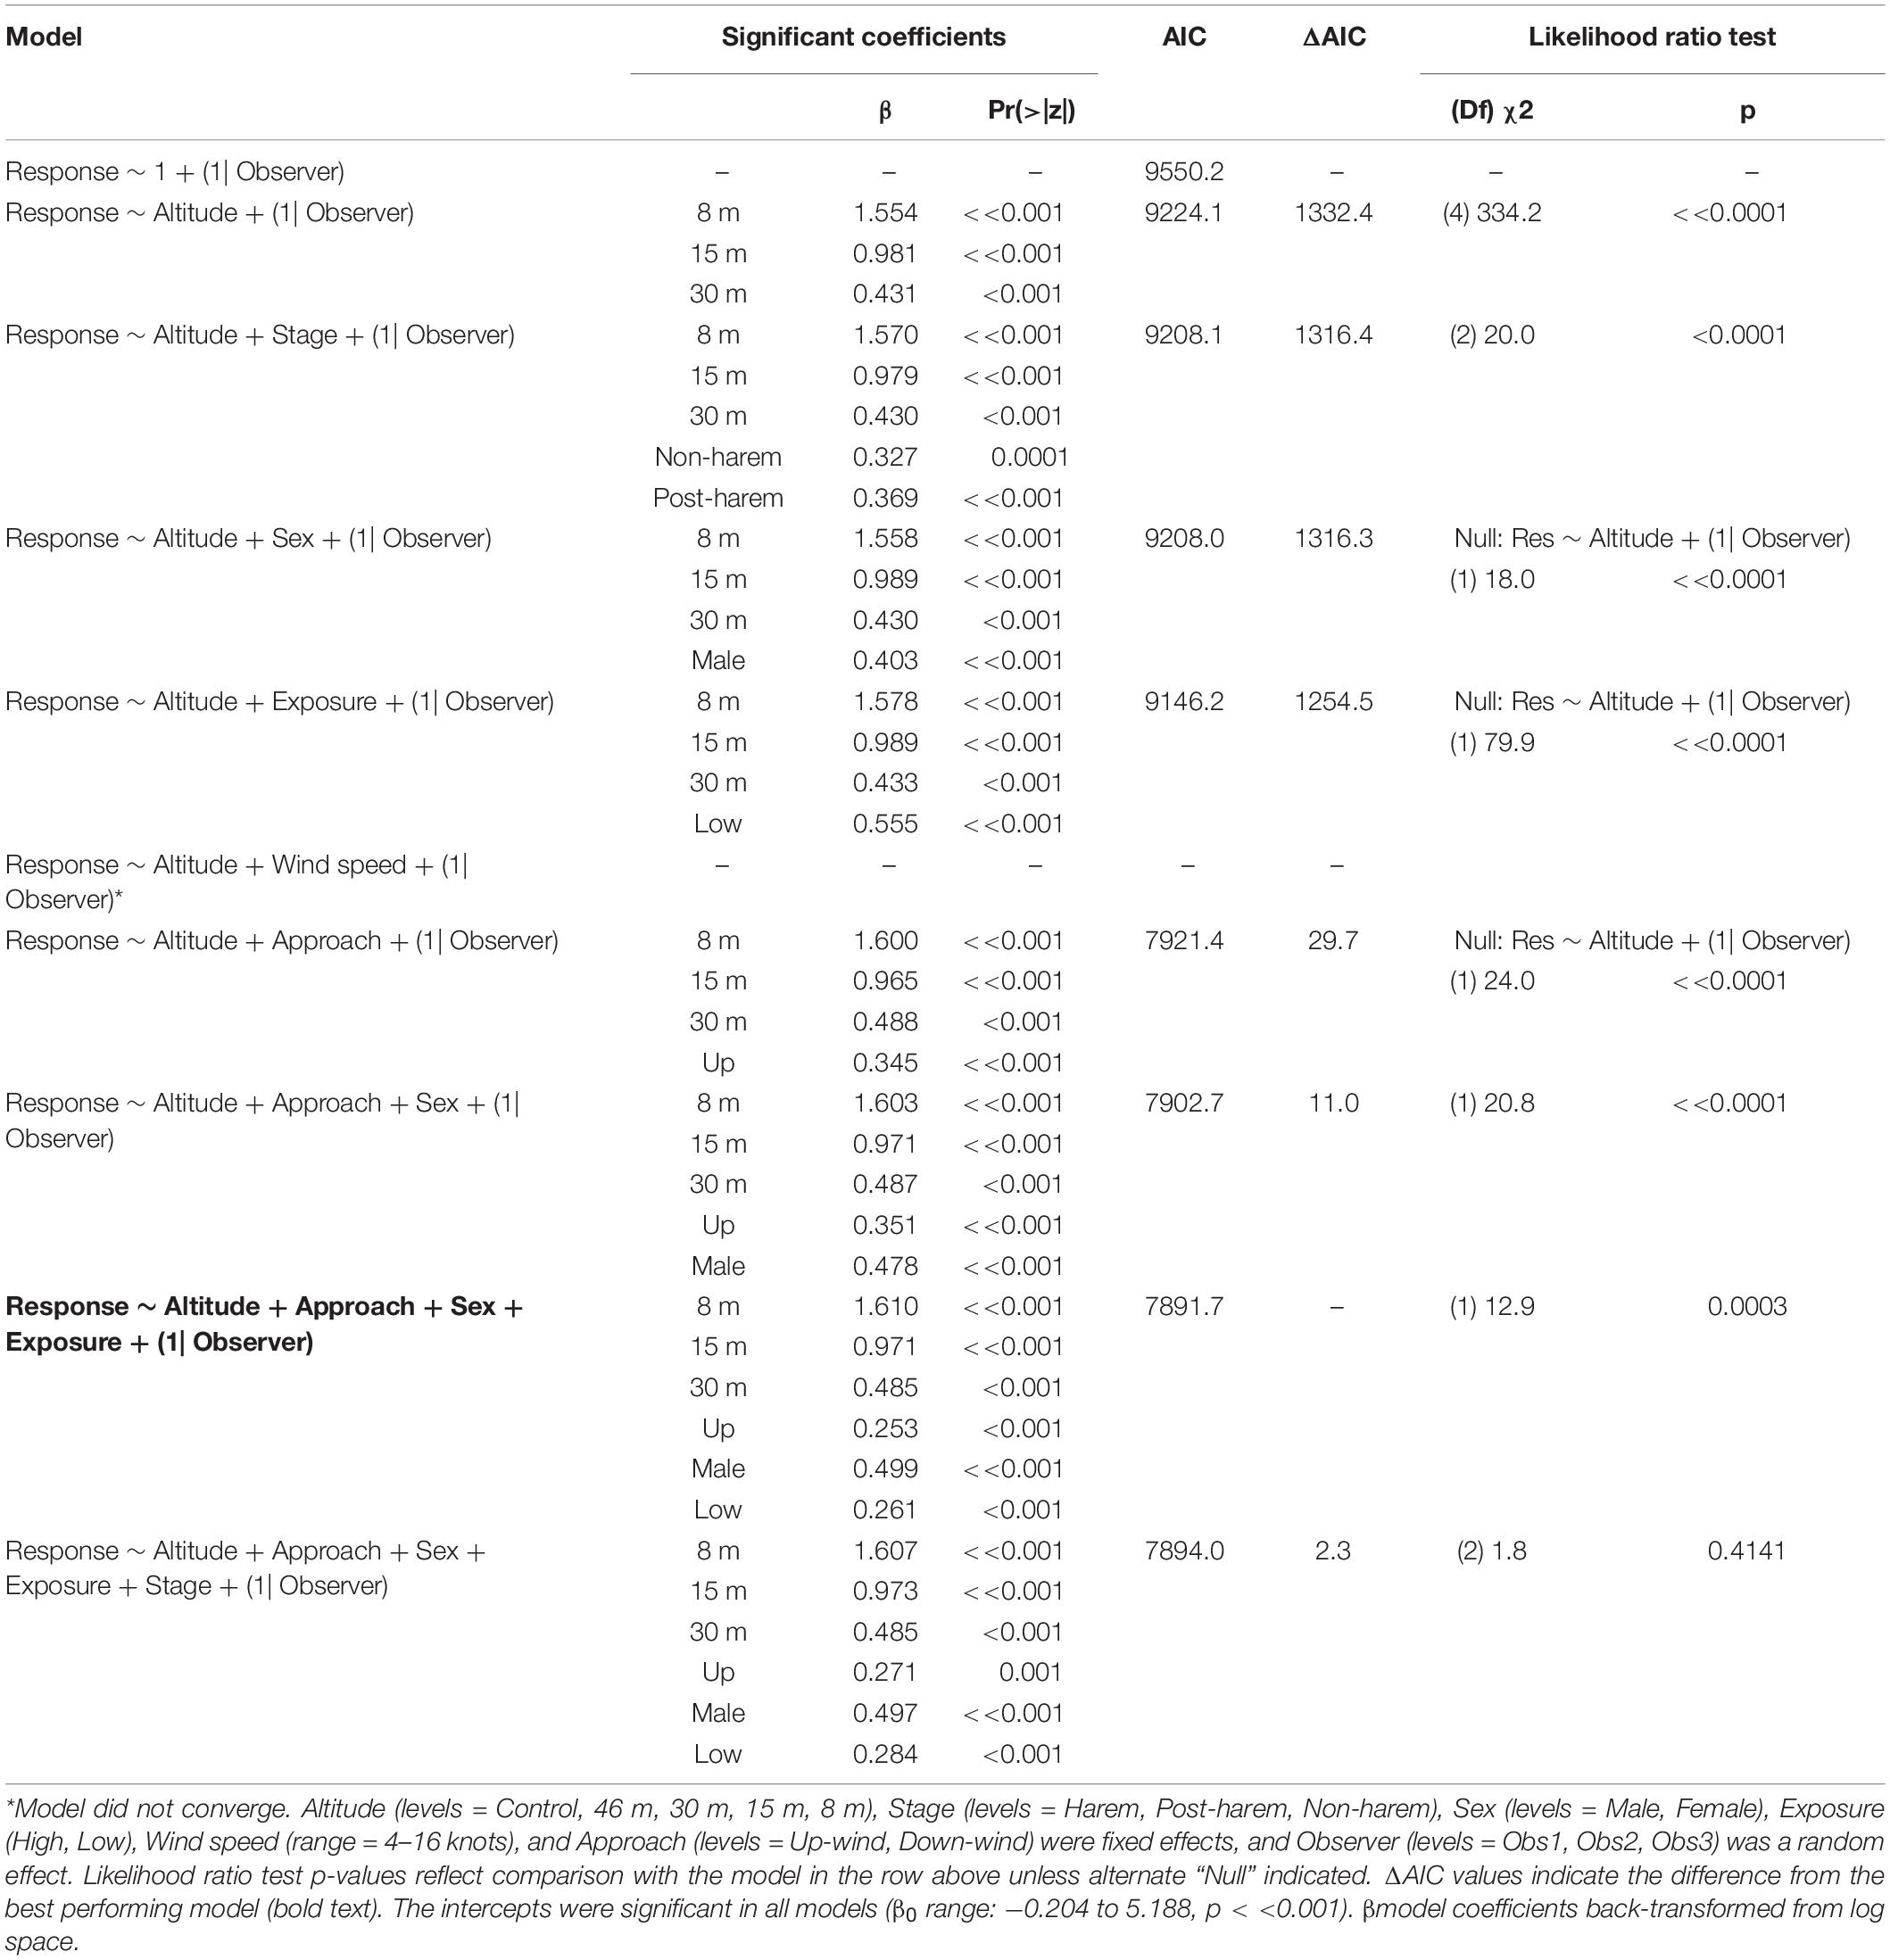
Table 7. Generalized ordinal logistic mixed effects model results of behavioral response scores (n = 4,254) from Antarctic fur seals at Cape Shirreff, Livingston Island in 2017 and 2018.
Leopard Seals
Like CHPE and AFS the behavioral reaction scores of leopard seals increased with decreasing UAS altitude, particularly below 30 m (Figure 5C); and ordinal logistic mixed models fit the data well (Condition number of Hess < 10^3). The most informative model included altitude as a significant effect [χ2(4) = 54.44, p << 0.0001], but did not include molt stage [χ2(2) = 1.29, p = 0.524, Table 8]. Leopard seals were the only species in this study that could be identified consistently at the individual level, and model results indicate that 8 of 25 seals were significantly less likely (coefficient slopes were negative) to have their behavior affected by UAS presence [χ2(18) = 99.28, p << 0.0001]. Therefore, Seal ID was included as a random effect which explained a significant amount of variation in the model [χ2(1) = 35.43, p << 0.0001]. And, as with AFS, coefficients for 8, 15, and 30 m informed the model, indicating likelihood of higher behavioral scores with altitudes at or below 30 m (Table 8). While behavioral reactions of looking (“2”) were more common for leopard seals than other species, there was never an escape (“4”) reaction to UAS flights at any altitude (Supplementary Figure 5).
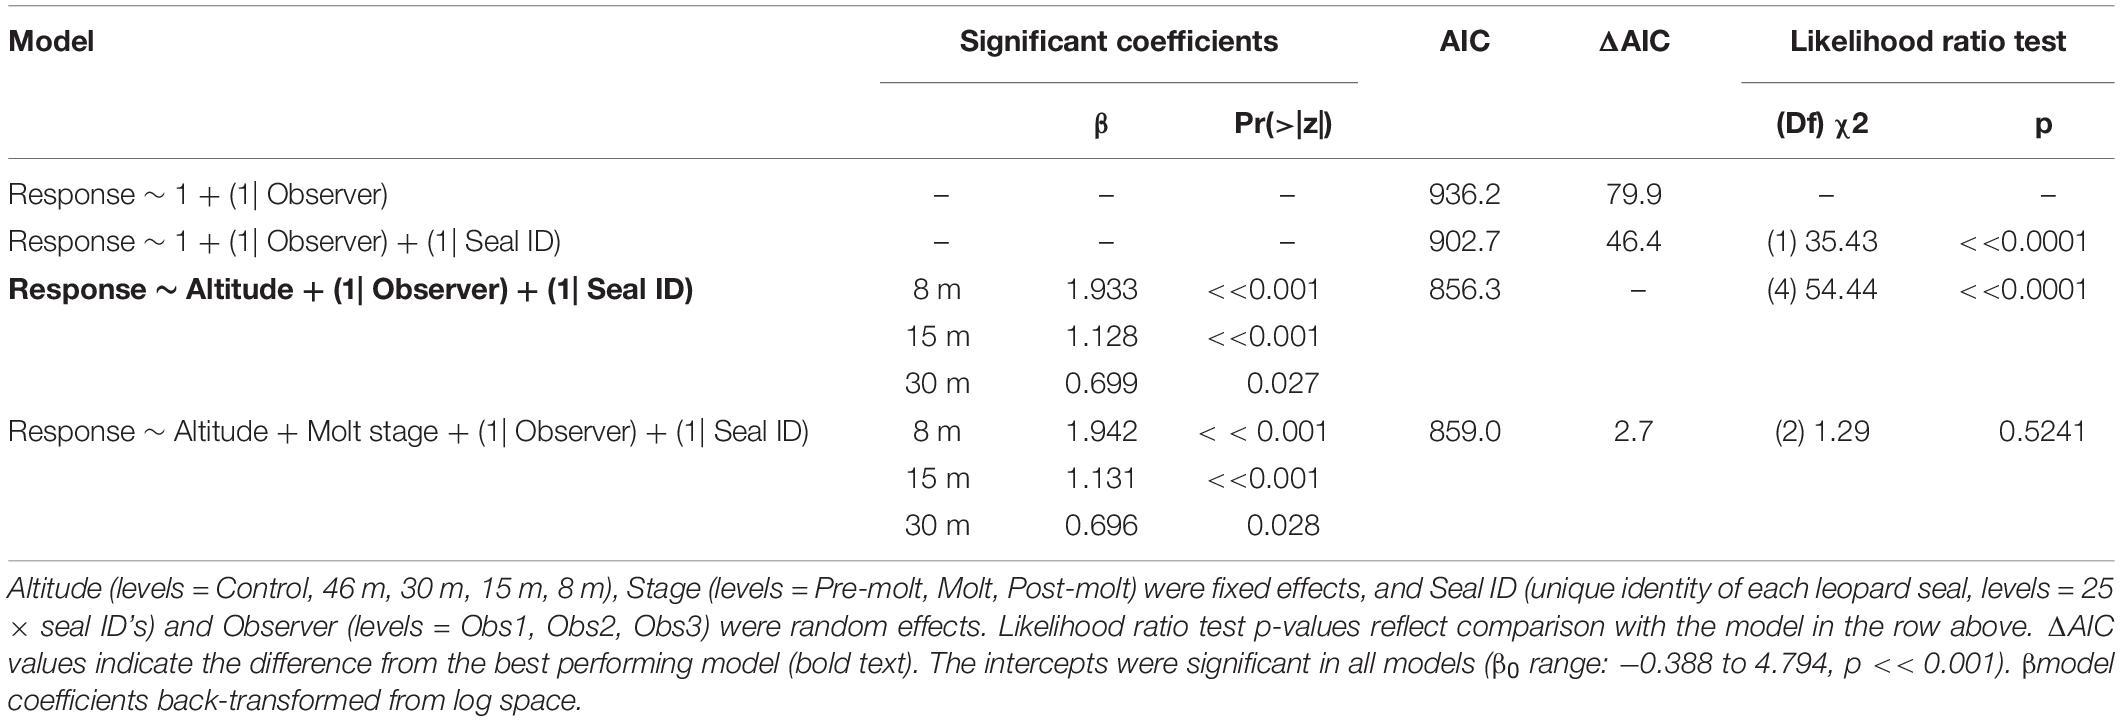
Table 8. Generalized ordinal logistic mixed effects model results of behavioral response scores (n = 387) from leopard seals at Cape Shirreff, Livingston Island in 2017 and 2018.
Leopard seal respiration rates were highest for control animals, measured well before UAS were launched, and the lowest rates were recorded while the UAS was flying at 46 m and 30 m overhead (Figure 6). The generalized linear mixed effects model fit the respiration data well, and met all tested assumptions. Model comparison indicated that seal ID [χ2(1) = 45.76, p << 0.0001] as a random effect, and altitude [χ2(4) = 10.26, p = 0.0363] and stage [χ2(2) = 8.93, p = 0.0115] as fixed effects, significantly informed the model (Table 9). Observer was not included as a random effect because respiration rates were recorded only by a single observer. The informative coefficients for altitude (46 and 30 m) both had negative slopes (Table 9) indicating that flights at those altitudes predicted lower respiration rates.
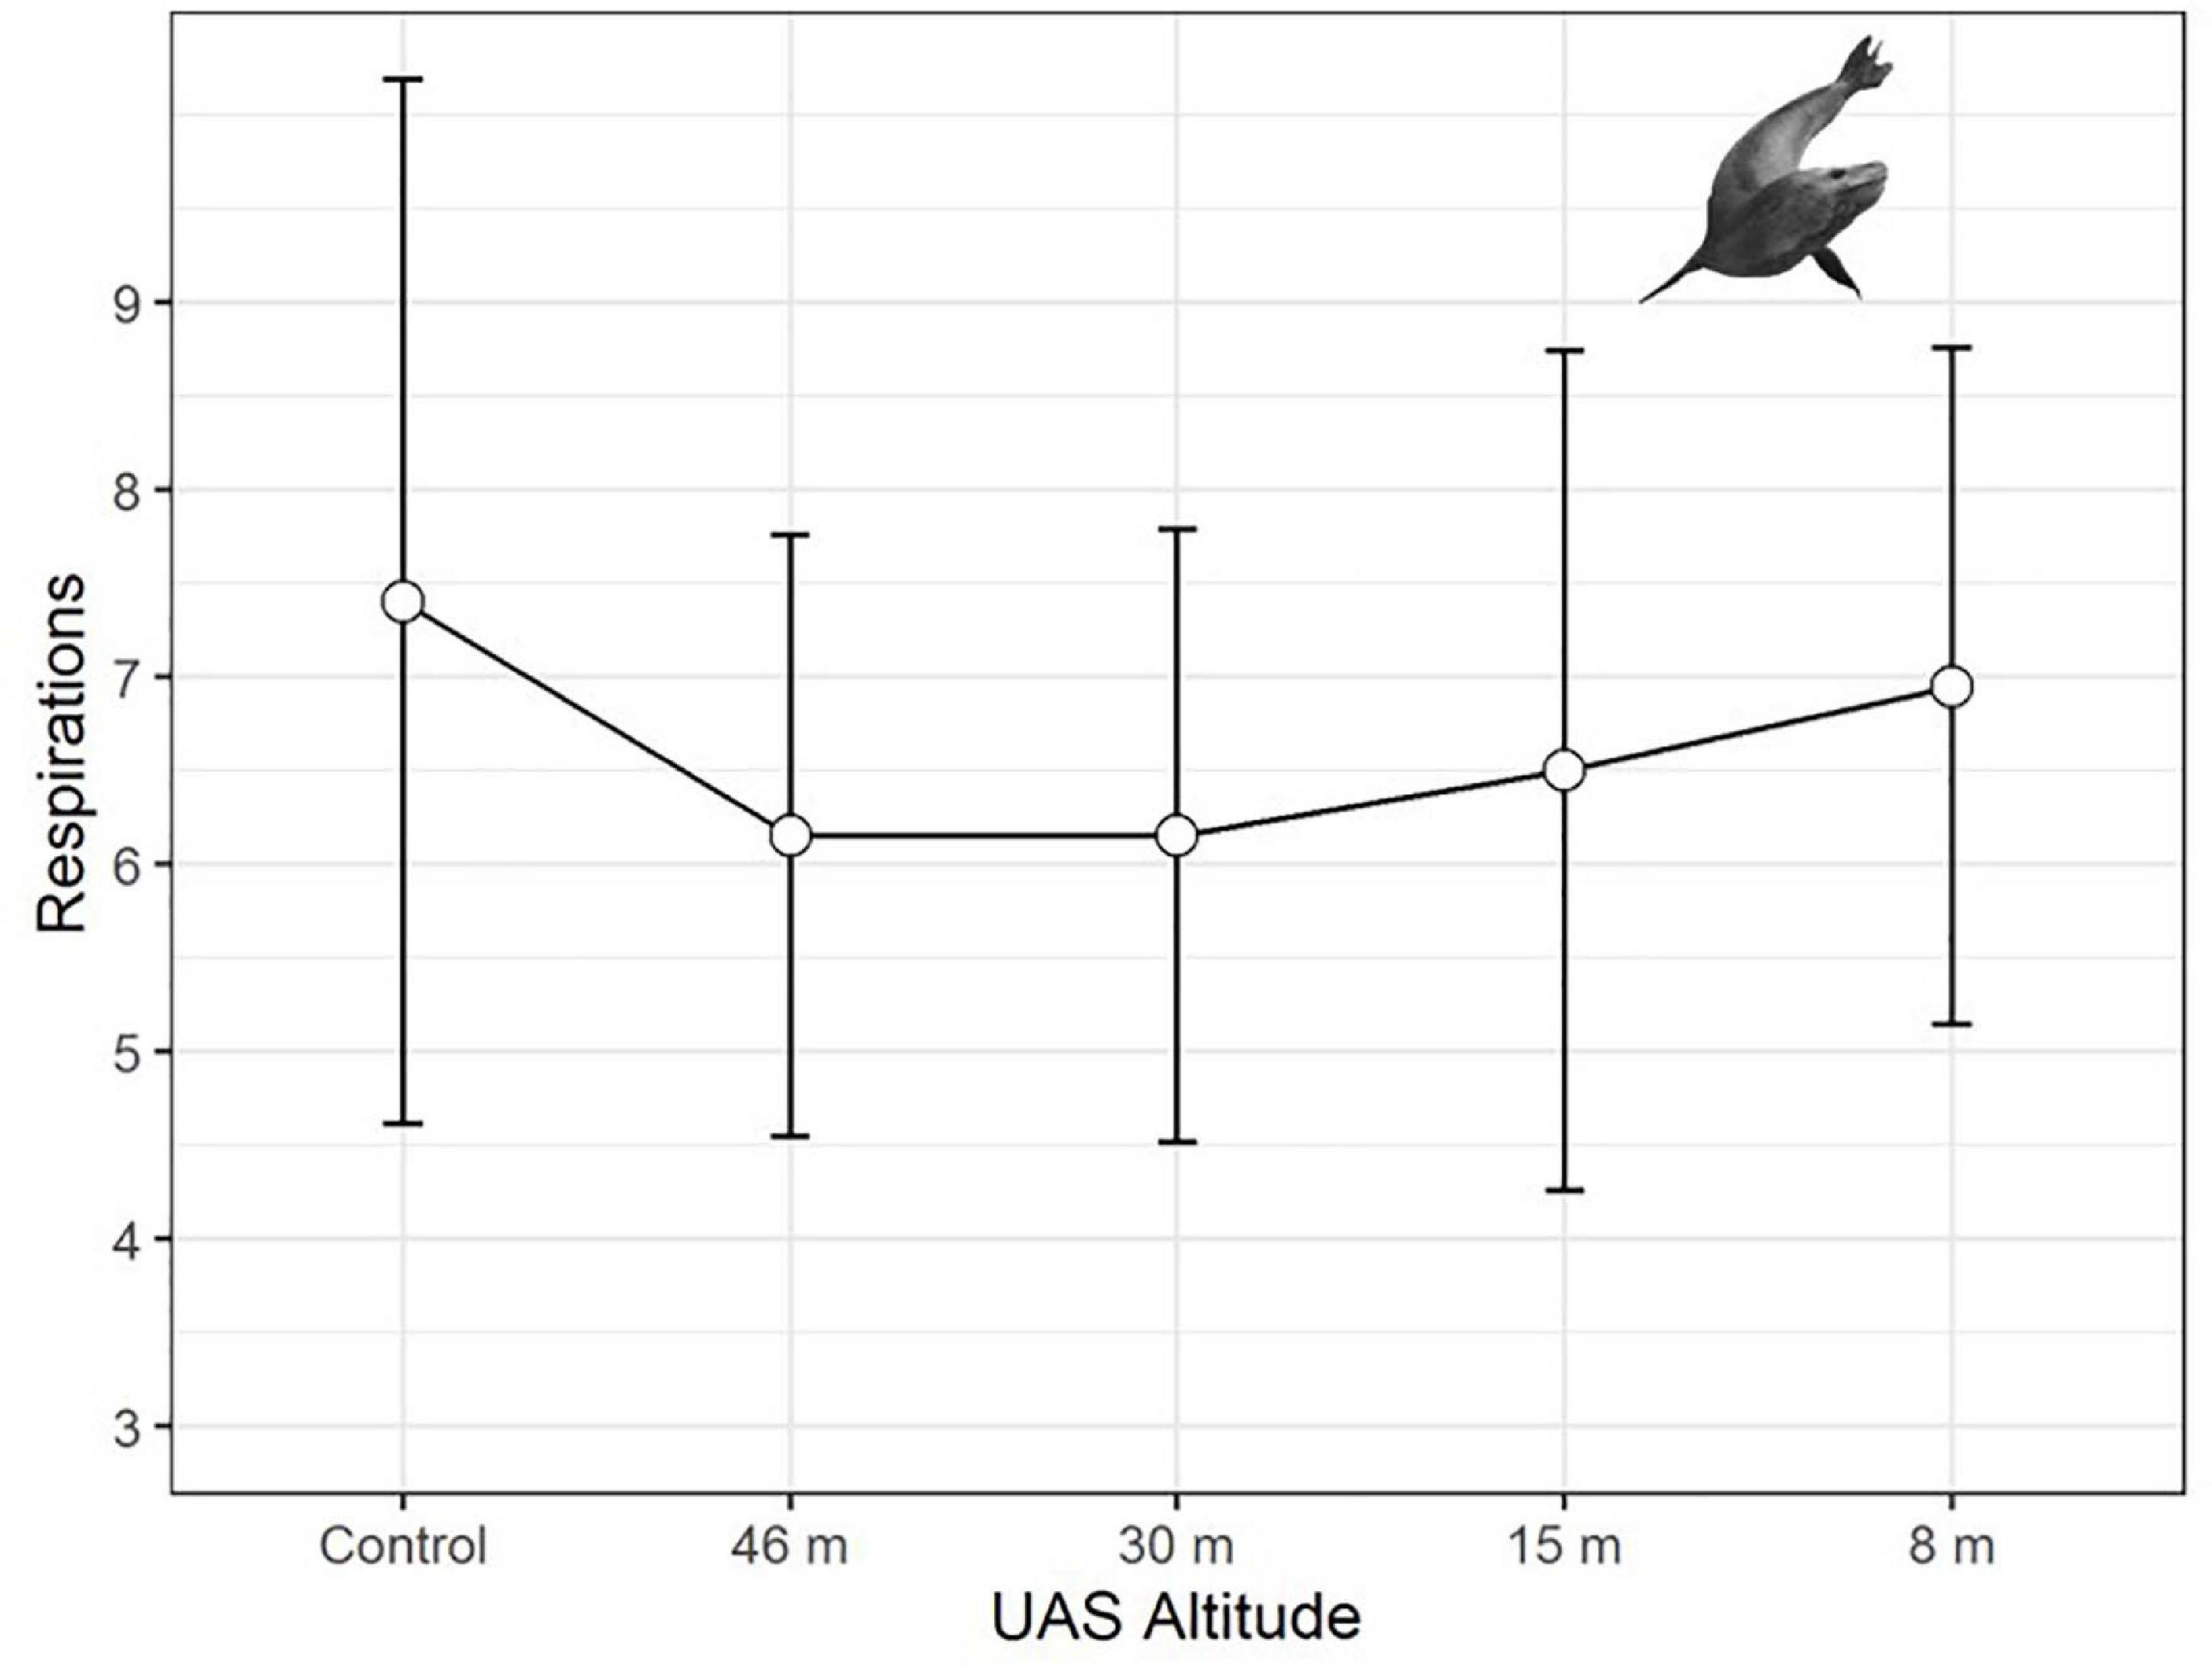
Figure 6. Average respiration rates (measured in breaths per minute, plotted with standard deviation error bars) of adult leopard seals (LS, n = 297 observations) during unoccupied aerial systems (UAS) overflights at specific altitudes.
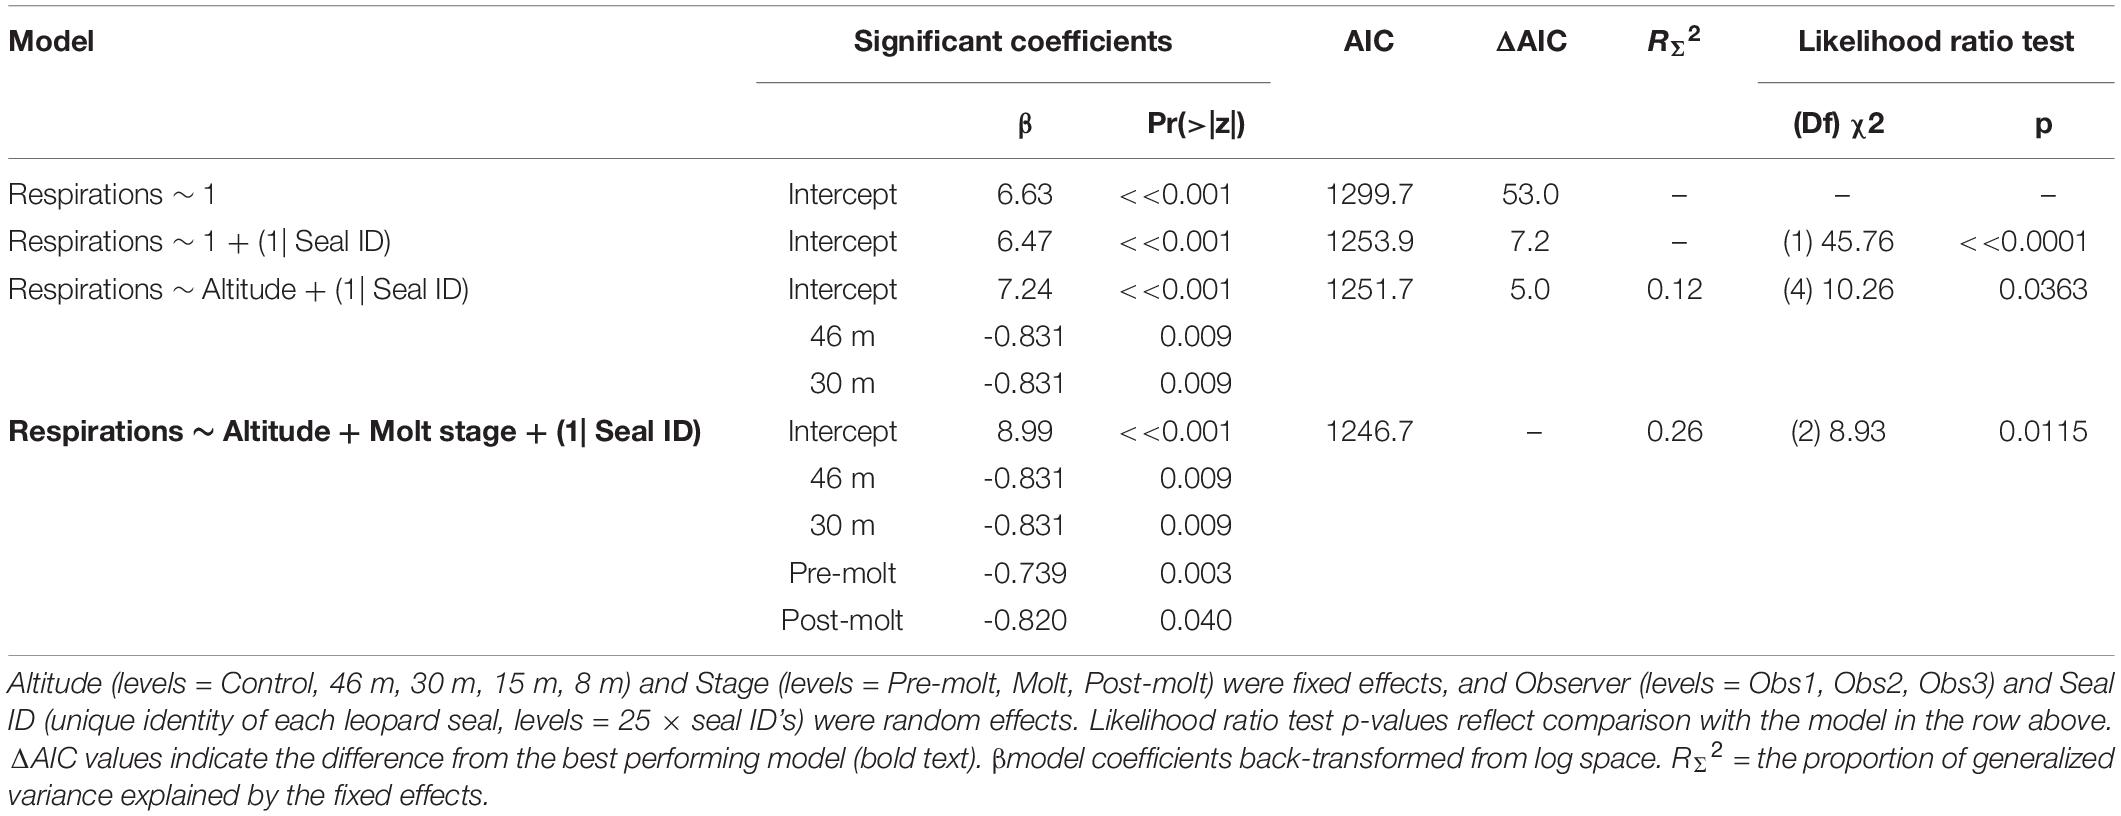
Table 9. Generalized linear mixed effects model results (Poisson, link = “log”) of respiration rates (n = 297) from leopard seals at Cape Shirreff, Livingston Island in 2017 and 2018.
Observer Differences
Assigned behavioral scores from all three observers showed similar patterns, but were systematically offset (e.g., Supplementary Figure 6). Observer as a random effect was significantly informative to every model framework in which it was tested (paired likelihood ratio test p < 0.05, Tables 6–8).
Discussion
On the Importance of Context
It is clear from this and other studies that even small battery-powered drones can affect natural biota. The interpretation of such effects, however, requires context for both UAS use objectives and the ecology of target species. For example, behavioral reactions during 30 m survey overflights for all species were indistinguishable from the control while responses to ground surveys were significantly more intense (Table 5 and Figure 4). However, even if UAS-induced effects at 30 m had been detected, results like these need to be assessed and interpreted relative to the impacts of alternative methods. Moreover, even these ground-survey effects require additional context. The ground-based techniques used in this study have been refined over decades to limit disturbance, and are widely accepted by practitioners and regulators as appropriate for long-term monitoring (e.g., Hinke et al., 2007; Goebel et al., 2009; Krause et al., 2020). Further, UAS use may be impractical for some field surveys for a variety of factors (e.g., environment, weather); therefore, established ground-based methodologies like these may be the best option in some cases.
All three species of Antarctic predators in this study reacted to the presence of the UAS, however, in context those reactions were likely not harmful. Mean behavioral reactions for both pinniped species at all UAS flight altitudes never met the minimum threshold for minor, transitory (Level B) harassment, as defined by the U.S. Marine Mammal Protection Act. In fact, even at the individual level, escape reactions were rare (LS = 0%, AFS = 1.5%). And, while it was common for CHPE to briefly look at UAS overhead (Supplementary Figure 2), such behavior is natural during their breeding season. Chinstrap penguins and their congeners are evolutionarily adapted to disturbance from predatory birds [e.g., brown skuas (Stercorarius antarcticus), kelp gulls (Larus dominicanus), giant petrels (Macronectes giganteus)]. Short term overflights by drones induce as-much-or-less disturbance (i.e., drones never steal eggs or chicks) than overflights by predators that occur multiple times per hour, all day, throughout the breeding season (Emslie et al., 1995).
Behavioral Response
Despite substantial differences in life history, size, social behavior, and ecology all three focal species in this study demonstrated similar patterns in their behavioral response to the presence of small UAS flying at specific altitudes. Behavioral responses to flights at higher altitudes were limited, but increased for flights below 30 m. For CHPE, behavioral responses also intensified over the course of the breeding season. The influence of breeding stage on behavioral response supports earlier findings (e.g., Mulero-Pázmány et al., 2017; Weimerskirch et al., 2018). While we were not able to test leopard seals during their pup rearing stages, differences in molt stage apparently did not affect their reaction to the presence of UAS (Table 8).
Antarctic fur seals were more sensitive to 30 m overflights than CHPE, and males were more likely to react than females. Both emphasize a key aspect of AFS response to observational stimuli. Otariids have a polygynous social structure during their breeding season where a single male controls a territory and actively retains females within that space (Bonner, 1994). As a result, female reactions to external stimuli frequently initiate a chain reaction where the male rushes through the harem to curtail female movement, impacting and disturbing other animals along the way. Hence, disturbances are often amplified. Habituation by regular human exposure on regularly monitored study beaches appears to decrease sensitivity to UAS use (e.g., Supplementary Figure 4C). Finally, the detection of UAS noise is a primary source of animal disturbance across animal taxa (Scobie and Hugenholtz, 2016; Mulero-Pázmány et al., 2017). We found fur seals were significantly more likely to react when approached from upwind (Table 7) likely because UAS noise is more strongly propagated to target animals during upwind approaches. Therefore, we suggest that behavioral reactions would be lower if groups are approached from downwind.
Finally, behavioral response studies typically rely on a subjective assessment of animal reaction. However, studies to date have relied almost exclusively on behavioral observations from a single observer which may introduce an unknown bias. Despite similarities in scoring between observers in this study (Supplementary Figure 6), inter-observer variance was informative to every model tested in this study. It seems prudent to obtain behavioral scores from ≥3 independent observers so that observer effects can be assessed and propagated through modeling frameworks. Moreover, accurately tracking behavioral change in real time from multiple animals is at best problematic. Digitally recording target animals with photographs or video natively allows for review by multiple observers and a permanent record to ensure reproducibility.
Physiological Response
Physiological metrics provide insight into the responses of wildlife to disturbance that are not detectable externally (Weimerskirch et al., 2002). For example, an elevated heartrate could indicate a stress response even if no behavioral change was detected (Weimerskirch et al., 2018). Although the resting respiration rates of large aquatic mammals are substantially lower than terrestrial mammals of similar mass, pulmonary and cardiovascular systems are coupled in the same way; therefore, change in respiration rate is highly correlated with change in heart rate (e.g., Mortola, 2015). Predictable changes in respiration rates were detected for leopard seals across a range (3–16 breaths/min) similar to changes seen during sedation captures (U.S. AMLR unpublished data). However, patterns of respiration rate changes in response to UAS were distinct from behavioral responses, paradoxically, due to a peak in physiological responses during the control (no UAS) period (Figure 6). In further contrast to behavioral response, model comparison indicated molt stage and higher altitudes (46 and 30 m) were significant effects (Table 9). However, the coefficients were negative signifying that seals had higher respiration rates during the control period than when the UAS was hovering overhead at 30 m. Because adult leopard seals have no terrestrial predators, it seems likely that elevated control respiration rates were a carryover effect from human researchers arriving to the area rather than a UAS effect. We suggest future studies use an extended (>15 min) acclimation period for camera placement. Finally, baseline respirations were significantly higher during molt compared to pre- or post-molt periods, which is logical because molting and new fur growth necessitates a substantial increase in metabolism (Costa and Crocker, 1996), and therefore respiration rate.
Conclusion
Small UAS allow researchers to obtain data that are comparable to traditional collection methods (e.g., Krause et al., 2017; Hodgson et al., 2018) in ways that are typically cost-effective, safer (Sasse, 2003; Watts et al., 2012) and at larger scales (Sweeney et al., 2015). We demonstrated that when studied using appropriate context, and operated responsibly, UAS can be less invasive to wildlife than traditional observation techniques as well.
We suggest that wildlife managers and policy makers take a precautionary approach when considering the regulation of UAS use. Given myriad differences in UAS types, site-specific conditions, observation requirements, and species-specific risks to overflight, we recommend a policy emphasis on in situ risk assessments rather than fixed requirements or exclusions. Future UAS-wildlife response studies should incorporate experimental design that explicitly compares wildlife responses to the non-UAS data collection methods.
Best Practices for UAS Use
Our results reinforce previously established best-practices for conducting UAS flights near wildlife (Hodgson and Koh, 2016; Mulero-Pázmány et al., 2017). Scientists collecting counts or body measurements from penguins or pinnipeds should use a small, battery-powered UAS (Goebel et al., 2015), and fly at the highest altitude possible that allows for adequate sensor resolution (Scobie and Hugenholtz, 2016; Mustafa et al., 2018). Particular caution should be used if data collection requires flights later in the breeding season, at altitudes below 30 m, or when studying harem breeders like otariid species. Finally, pilots should approach animal groups from downwind if possible. Small UAS should be considered as a primary, low-disturbance methodology to obtain such data if available.
Best Design for UAS-Wildlife Disturbance Studies
While UAS wildlife response studies have increased in recent years, the available data is not yet sufficient to resolve the manifold mitigating factors in many systems (Mustafa et al., 2018). And, of course, UAS technology continues to evolve rapidly. In order to provide the most useful data to wildlife managers and policy makers we suggest that future studies:
• Are explicit in their study design, analysis, and presentation about the context of alternate non-UAS options.
• Assign behavioral scores by ≥3 independent observers so that individual variance can be assessed and propagated through modeling frameworks. Doing so will increase confidence in inference.
• Control for individual-level effects on physiological parameters (e.g., heart or respiration rate) when possible.
• Record wildlife responses with photographs or video.
Data Availability Statement
The original contributions presented in the study are included in the article/Supplementary Material, further inquiries can be directed to the corresponding authors.
Ethics Statement
The animal study was reviewed and approved by the NMFS-SWFSC Institutional Animal Care and Use Committee, Permit # SWPI 2014-03R. Additionally, research was completed in accordance with Marine Mammal Protection Act (MMPA) Permit # 20599, and Antarctic Conservation Act (ACA) Permit # Watters 2017-012.
Author Contributions
DK, JH, MG, and WP designed the study. DK conducted all the field work. DK and JH trained and supervised the technicians and analyzed the data. DK and JH wrote the manuscript with editing from WP and MG. All authors contributed to the article and approved the submitted version.
Funding
Financial, infrastructure, and logistical support was provided by the U.S. AMLR Program, NOAA Fisheries.
Conflict of Interest
The authors declare that the research was conducted in the absence of any commercial or financial relationships that could be construed as a potential conflict of interest.
Acknowledgments
We are grateful to D. LeRoi from Aerial Imaging Solutions, LLC for excellent UAS technical support and advice. This project would not have been possible without funding from the U.S. AMLR Program, tireless field support from W. Taylor, S. Woodman, N. de Gracia, M. Klostermann, A. Fox, S. Walden, J. Rusin, and J. Senzer, and dedicated photo scoring by A. Fox, T. Terpening, A. Reynaga, and S. Morales. Finally, thank you for editorial advice and insight from K. Sweeney, G. Watters, and the Borrego Springs Writer’s Workshop.
Supplementary Material
The Supplementary Material for this article can be found online at: https://www.frontiersin.org/articles/10.3389/fmars.2021.648772/full#supplementary-material
References
Agnew, D. J. (1997). Review—the CCAMLR ecosystem monitoring programme. Antarct. Sci. 9, 235–242. doi: 10.1017/S095410209700031X
Akaike, H. (1973). “Information theory and an extension of the maximum likelihood principle,” in Proceedings of the Second International Symposium on Information Theory, eds B. N. Petrov and F. Caski (Budapest: Akadémiai Kiadó), 267–281.
Arona, L., Dale, J., Heaslip, S., Hammill, M., and Johnston, D. (2018). Assessing the disturbance potential of small unoccupied aircraft systems (UAS) on gray seals (Halichoerus grypus) at breeding colonies in Nova Scotia. Canada. PeerJ 6:e4467. doi: 10.7717/peerj.4467
Barnas, A. F., Felege, C. J., Rockwell, R. F., and Ellis-Felege, S. N. (2018). A pilot(less) study on the use of an unmanned aircraft system for studying polar bears (Ursus maritimus). Polar Biol. 41, 1055–1062. doi: 10.1007/s00300-018-2270-0
Bates, D., Maechler, M., Bolker, B., and Walker, S. (2015). Fitting linear mixed-effects models using lme4. J. Stat. Softw. 67, 1–48. doi: 10.18637/jss.v067.i01
Bennitt, E., Bartlam-Brooks, H. L. A., Hubel, T. Y., and Wilson, A. M. (2019). Terrestrial mammalian wildlife responses to unmanned aerial systems approaches. Sci. Rep. 9:2142. doi: 10.1038/s41598-019-38610-x
Bolker, B. M., Brooks, M. E., Clark, C. J., Geange, S. W., Poulsen, J. R., Stevens, M. H. H., et al. (2009). Generalized linear mixed models: a practical guide for ecology and evolution. Trends Ecol. Evol. 24, 127–135. doi: 10.1016/j.tree.2008.10.008
Boyd, I. L., Wanless, S., and Camphuysen, C. J. (2006). Top Predators in Marine Ecosystems: Their Role in Monitoring and Management. Cambridge: Cambridge University Press.
Christensen, R. (2018). Ordinal—Regression Models for Ordinal Data. R package version 2019.12-10. Available online at: http://www.cran.r-project.org/package=ordinal/ (accessed December 17, 2019).
Christie, K. S., Gilbert, S. L., Brown, C. L., Hatfield, M., and Hanson, L. (2016). Unmanned aircraft systems in wildlife research: current and future applications of a transformative technology. Front. Ecol. Environ. 14:241–251. doi: 10.1002/fee.1281
Costa, D. P., and Crocker, D. E. (1996). “Marine mammals of the southern ocean,” in Foundations for Ecological Research West of the Antarctic Peninsula, eds R. M. Ross, E. E. Hofmann, and L. B. Quetin (Washington DC: American Geophysical Union), 287–301.
Crutsinger, G. M., Short, J., and Sollenberger, R. (2016). The future of UAVs in ecology: an insider perspective from the Silicon Valley drone industry. J. Unmanned Veh. Syst. 4, 161–168. doi: 10.1139/juvs-2016-0008
Domínguez-Sánchez, C. A., Acevedo-Whitehouse, K. A., and Gendron, D. (2018). Effect of drone-based blow sampling on blue whale (Balaenoptera musculus) behavior. Mar. Mamm. Sci. 34, 841–850. doi: 10.1111/mms.12482
Dunn, O. J. (1964). Multiple comparisons using rank sums. Technometrics 6, 241–252. doi: 10.1080/00401706.1964.10490181
Durban, J. W., Fearnbach, H., Barrett-Lennard, L. G., Perryman, W. L., and Leroi, D. J. (2015). Photogrammetry of killer whales using a small hexacopter launched at sea. J. Unmanned Veh. Syst. 3, 131–135. doi: 10.1139/juvs-2015-0020
Durban, J. W., Moore, M. J., Chiang, G., Hickmott, L. S., Bocconcelli, A., Howes, G., et al. (2016). Photogrammetry of blue whales with an unmanned hexacopter. Mar. Mamm. Sci. 32, 1510–1515. doi: 10.1111/mms.12328
Emslie, S. D., Nina, K., and Trivelpiece, W. (1995). Avian predation at penguin colonies on king George Island, Antarctica. Wilson Bull. 107, 317–327.
Goebel, M., Perryman, W., Hinke, J., Krause, D., Hann, N., Gardner, S., et al. (2015). A small unmanned aerial system for estimating abundance and size of Antarctic predators. Polar Biol. 38, 619–630. doi: 10.1007/s00300-014-1625-4
Goebel, M. E., Krause, D. J., Freeman, S., Burner, R., Bonin, C., Vasquez Del Mercado, R., et al. (2009). “Pinniped research at cape shirreff, Livingston Island, Antarctica, 2008/2009,” in AMLR 2008/2009 Field Season Report: Objectives, Accomplishments and Tentative Conclusions, NOAA-TM-NMFS-SWFSC-445, ed. A. Van Cise (Washington DC: NOAA), 38.
Gomez, C., Lawson, J. W., Wright, A. J., Buren, A. D., Tollit, D., and Lesage, V. (2016). A systematic review on the behavioural responses of wild marine mammals to noise: the disparity between science and policy. Can. J. Zool. 94, 801–819. doi: 10.1139/cjz-2016-0098
Hinke, J. T., Salwicka, K., Trivelpiece, S. G., Watters, G. M., and Trivelpiece, W. Z. (2007). Divergent responses of Pygoscelis penguins reveal a common environmental driver. Oecologia 153:853. doi: 10.1007/s00442-007-0781-4
Hodgson, J. C., and Koh, L. P. (2016). Best practice for minimising unmanned aerial vehicle disturbance to wildlife in biological field research. Curr. Biol. 26, R404–R405. doi: 10.1016/j.cub.2016.04.001
Hodgson, J. C., Mott, R., Baylis, S. M., Pham, T. T., Wotherspoon, S., Kilpatrick, A. D., et al. (2018). Drones count wildlife more accurately and precisely than humans. Methods Ecol. Evol. 9, 1160–1167. doi: 10.1111/2041-210x.12974
Jaeger, B. C., Edwards, L. J., Das, K., and Sen, P. K. (2017). An R2 statistic for fixed effects in the generalized linear mixed model. J. Appl. Stat. 44, 1086–1105. doi: 10.1080/02664763.2016.1193725
Johnston, D. W. (2019). Unoccupied aircraft systems in marine science and conservation. Annu. Rev. Mar. Sci. 11, 439–463. doi: 10.1146/annurev-marine-010318-095323
King, L. M. (2014). Will drones revolutionise ecotourism? J. Ecotourism 13, 85–92. doi: 10.1080/14724049.2014.948448
Krause, D. J., Goebel, M. E., Marshall, G. J., and Abernathy, K. (2016). Summer diving and haul-out behavior of leopard seals (Hydrurga leptonyx) near mesopredator breeding colonies at Livingston Island. Antarctic Peninsula. Mar. Mamm. Sci. 32, 839–867. doi: 10.1111/mms.12309
Krause, D. J., Goebel, M. E., and Kurle, C. M. (2020). Leopard seal diets in a rapidly warming polar region vary by year, season, sex, and body size. BMC Ecol. 20:32. doi: 10.1186/s12898-020-00300-y
Krause, D. J., Hinke, J. T., Perryman, W. L., Goebel, M. E., and LeRoi, D. J. (2017). An accurate and adaptable photogrammetric approach for estimating the mass and body condition of pinnipeds using an unmanned aerial system. PLoS One 12:e0187465. doi: 10.1371/journal.pone.0187465
Lambertucci, S. A., Shepard, E. L. C., and Wilson, R. P. (2015). Human-wildlife conflicts in a crowded airspace. Science 348, 502–504. doi: 10.1126/science.aaa6743
Linchant, J., Lisein, J., Semeki, J., Lejeune, P., and Vermeulen, C. (2015). Are unmanned aircraft systems (UASs) the future of wildlife monitoring? A review of accomplishments and challenges. Mamm. Rev. 45, 239–252. doi: 10.1111/mam.12046
McEvoy, J. F., Hall, G. P., and McDonald, P. G. (2016). Evaluation of unmanned aerial vehicle shape, flight path and camera type for waterfowl surveys: disturbance effects and species recognition. PeerJ 4:e1831. doi: 10.7717/peerj.1831
McIntosh, R. R., Holmberg, R., and Dann, P. (2018). Looking without landing—using remote piloted aircraft to monitor fur seal populations without disturbance. Front. Mar. Sci. 5:202. doi: 10.3389/fmars.2018.00202
Moreland, E. E., Cameron, M. F., Angliss, R. P., and Boveng, P. L. (2015). Evaluation of a ship-based unoccupied aircraft system (UAS) for surveys of spotted and ribbon seals in the Bering Sea pack ice. J. Unmanned Veh. Syst. 3, 114–122.
Mortola, J. P. (2015). The heart rate - breathing rate relationship in aquatic mammals: a comparative analysis with terrestrial species. Curr. Zool. 61, 569–577. doi: 10.1093/czoolo/61.4.569
Mulero-Pázmány, M., Jenni-Eiermann, S., Strebel, N., Sattler, T., Negro, J. J., and Tablado, Z. (2017). Unmanned aircraft systems as a new source of disturbance for wildlife: a systematic review. PLoS One 12:e0178448. doi: 10.1371/journal.pone.0178448
Mustafa, O., Barbosa, A., Krause, D. J., Peter, H.-U., Vieira, G., and Rümmler, M.-C. (2018). State of knowledge: Antarctic wildlife response to unmanned aerial systems. Polar Biol. 41, 2387–2398. doi: 10.1007/s00300-018-2363-9
Pfeifer, C., Barbosa, A., Mustafa, O., Peter, H.-U., Rümmler, M.-C., and Brenning, A. (2019). Using fixed-wing UAV for detecting and mapping the distribution and abundance of penguins on the South Shetlands Islands. Antarctica. Drones 3:39.
Pomeroy, P., O’Connor, L., and Davies, P. (2015). Assessing use of and reaction to unmanned aerial systems in gray and harbor seals during breeding and molt in the UK. J. Unmanned Veh. Syst. 3, 102–113. doi: 10.1139/juvs-2015-0013
Ramos, E. A., Maloney, B., Magnasco, M. O., and Reiss, D. (2018). Bottlenose dolphins and antillean manatees respond to small multi-rotor unmanned aerial systems. Front. Mar. Sci. 5:316. doi: 10.3389/fmars.2018.00316
Raoult, V., Colefax, A. P., Allan, B. M., Cagnazzi, D., Castelblanco-Martínez, N., Ierodiaconou, D., et al. (2020). Operational protocols for the use of drones in marine animal research. Drones 4:64. doi: 10.3390/drones4040064
Ratcliffe, N., Guihen, D., Robst, J., Crofts, S., Stanworth, A., and Enderlein, P. (2015). A protocol for the aerial survey of penguin colonies using UAVs. J. Unmanned Veh. Syst. 3, 95–101. doi: 10.1139/juvs-2015-0006
R-Core-Team (2019). R: A Language and Environment for Statistical Computing 3.5.3. Vienna: R Foundation for Statistical Computing.
Rümmler, M.-C., Mustafa, O., Maercker, J., Peter, H.-U., and Esefeld, J. (2016). Measuring the influence of unmanned aerial vehicles on Adélie penguins. Polar Biol. 39, 1329–1334. doi: 10.1007/s00300-015-1838-1
Rümmler, M.-C., Mustafa, O., Maercker, J., Peter, H.-U., and Esefeld, J. (2018). Sensitivity of adélie and Gentoo penguins to various flight activities of a micro UAV. Polar Biol. 41, 2481–2493. doi: 10.1007/s00300-018-2385-3
Rush, G. P., Clarke, L. E., Stone, M., and Wood, M. J. (2018). Can drones count gulls? Minimal disturbance and semiautomated image processing with an unmanned aerial vehicle for colony-nesting seabirds. Ecol. Evol. 8, 12322–12334. doi: 10.1002/ece3.4495
Sasse, D. B. (2003). Job-Related mortality of wildlife workers in the United States, 1937-2000. Wildlife Soc. Bull. (1973-2006) 31, 1015–1020.
Scobie, C. A., and Hugenholtz, C. H. (2016). Wildlife monitoring with unmanned aerial vehicles: quantifying distance to auditory detection. Wildlife Soc. Bull. 40, 781–785. doi: 10.1002/wsb.700
Smith, C. E., Sykora-Bodie, S. T., Bloodworth, B., Pack, S. M., Spradlin, T. R., and LeBoeuf, N. R. (2016). Assessment of known impacts of unmanned aerial systems (UAS) on marine mammals: data gaps and recommendations for researchers in the United States. J. Unmanned Veh. Syst. 4, 31–44. doi: 10.1139/juvs-2015-0017
Sweeney, K. L., Helker, V. T., Perryman, W. L., LeRoi, D. J., Fritz, L. W., Gelatt, T. S., et al. (2015). Flying beneath the clouds at the edge of the world: using a hexacopter to supplement abundance surveys of Steller sea lions (Eumetopias jubatus) in Alaska. J. Unmanned Veh. Syst. 4, 70–81. doi: 10.1139/juvs-2015-0010
Torres, L. G., Nieukirk, S. L., Lemos, L., and Chandler, T. E. (2018). Drone up! quantifying whale behavior from a new perspective improves observational capacity. Front. Mar. Sci. 5:319. doi: 10.3389/fmars.2018.00319
Vas, E., Lescroël, A., Duriez, O., Boguszewski, G., and Grémillet, D. (2015). Approaching birds with drones: first experiments and ethical guidelines. Biol. Lett. 11, 20140754.
Wallace, P., Martin, R., and White, I. (2017). Keeping pace with technology: drones, disturbance and policy deficiency. J. Environ. Plan. Manag. 61, 1–18. doi: 10.1080/09640568.2017.1353957
Watts, A. C., Ambrosia, V. G., and Hinkley, E. A. (2012). Unmanned aircraft systems in remote sensing and scientific research: classification and considerations of use. Remote Sens. 4, 1671–1692.
Weimerskirch, H., Prudor, A., and Schull, Q. (2018). Flights of drones over sub-Antarctic seabirds show species- and status-specific behavioural and physiological responses. Polar Biol. 41, 259–266. doi: 10.1007/s00300-017-2187-z
Keywords: animal behavior, disturbance, RPAS, unmanned aerial systems, UAS, UAV, wildlife response, hexacopter
Citation: Krause DJ, Hinke JT, Goebel ME and Perryman WL (2021) Drones Minimize Antarctic Predator Responses Relative to Ground Survey Methods: An Appeal for Context in Policy Advice. Front. Mar. Sci. 8:648772. doi: 10.3389/fmars.2021.648772
Received: 01 January 2021; Accepted: 05 February 2021;
Published: 11 March 2021.
Edited by:
Rob Harcourt, Macquarie University, AustraliaReviewed by:
Vincent Raoult, The University of Newcastle, AustraliaMia Wege, University of Pretoria, South Africa
Copyright © 2021 Krause, Hinke, Goebel and Perryman. This is an open-access article distributed under the terms of the Creative Commons Attribution License (CC BY). The use, distribution or reproduction in other forums is permitted, provided the original author(s) and the copyright owner(s) are credited and that the original publication in this journal is cited, in accordance with accepted academic practice. No use, distribution or reproduction is permitted which does not comply with these terms.
*Correspondence: Douglas J. Krause, douglas.krause@noaa.gov