Modeling Steel Corrosion Failure in Reinforced Concrete by Cover Crack Width 3D FEM Analysis
 J. H. Castorena-González1
  U. Martin2
  C. Gaona-Tiburcio3 R. E. Núñez-Jáquez1
  F. M. Almeraya-Calderón3
  J. M. Bastidas4
  D. M. Bastidas2*
- 1Facultad de Ingeniería Mochis, Universidad Autónoma de Sinaloa, Culiacán, Mexico
- 2National Center for Education and Research on Corrosion and Materials Performance, Department of Chemical, Biomolecular, and Corrosion Engineering, The University of Akron, Akron, OH, United States
- 3Centro de Innovación e Investigación en Ingeniería Aeronáutica, Universidad Autónoma de Nuevo León, Nuevo León, Mexico
- 4National Center for Metallurgical Research, Spanish National Research Council, Madrid, Spain
A new predictive 3D FEM model is proposed using the corrosion damage function by measuring the concrete cover crack width, which is a function of the free concrete cover depth, the steel rebar diameter, the mechanical properties of the concrete, and the length of the anodic zone. A significant aspect to evaluate service lifetime conditions in corroded reinforced concrete structures (RCSs) is the concrete cover crack width. Surface cracks originate due to the pressure exerted by the volume expansion of the corrosion products and oxide layer formed on the rebars. In this work, concrete cover crack width on corroded RCS is analyzed by means of finite element method allowing a corrosion damage model to be proposed. The model obtained was used to find a theoretical relationship between the dissolved steel (corrosion process) and the concrete cover crack width. The results were validated using three experimental data sets from the literature: two corrosion case studies in natural environments and one work covering accelerated corrosion in laboratory test conditions. All the beams were exposed to the simultaneous action of flexural stresses and corrosion. A good correlation was observed between the model and the experimental results, thus supporting reliability of the analytical process and validation of the proposed corrosion damage model.
Introduction
The corrosion susceptibility of steel is the main cause of deterioration of a reinforced concrete structure (RCS) (Cabrera, 1996; Liu and Weyers, 1998). The environmentally-induced carbonation of a RCS decreases the concrete pH value to around 9, causing disruption of the passive layer of the steel rebar which was generated when the pH of the concrete was high (12.6). Additionally, RCS are subjected to the ingress of chlorides through the concrete cover due to the proximity from a marine environment, de-icing salts or from the concrete mixing processes. Once the chlorides reach the steel rebar, they promote the passivity breakdown, thus initiating pitting corrosion (González, 2007). The use of stainless-steel (SS) rebars increases critical chloride corrosion threshold, in addition SS rebars provide a high ductility and improved mechanical performance of RCS, this leads to an increase in the maximum design crack width withstood by the high corrosion resistance of SS rebars, and make SS rebars especially suitable for structures located in seismic zones (Medina et al., 2015).
Corrosion monitoring is commonly performed by non-destructive DC and AC techniques, such as linear polarization resistance (LPR), and electrochemical impedance spectroscopy (EIS), respectively. However, EIS technique requires qualified staff to interpret the data. One limitation of the LPR technique is its reproducibility, as during the test, a non-uniform potential distribution is generated on the sample. This produces extremely difficult situations to model due to the application of a small DC excitation signal (∼10–20 mV) to a large-scale reinforcing steel structure. In this way, to overcome non-uniform distributed electric potential field, a very interesting widely used approach is the confinement of the electrical signal using a guard ring (Andrade et al., 1990).
Electrochemical impedance spectroscopy is a powerful technique for quantitative measurement of the corrosion rate and, in general, the electrochemical parameters, such as the electrochemical double-layer for adsorption-desorption processes and mass transport processes, which take place on the steel surface. Nevertheless, EIS measurements on the steel/concrete system require long testing times because of the application of a small AC signal (∼10 mV rms) in a wide frequency range (105 to 10–2 Hz). Moreover, the corrosion potential (Ecorr) may change during the measure causing some ambiguity in the physical interpretation of the results. Furthermore, the interpretation of EIS data is usually performed using an electrical equivalent circuit (EEC), which requires experienced researchers to unequivocally determine the corrosion rate and, in general, all the electrochemical parameters involved in the physical processes related to the system under discussion. The interpretation of EIS data becomes critical in the case of passivated reinforced specimens, where the EIS response of a steel/concrete system is poorly resolved in the low-frequency domain (the faradaic processes) and therefore limiting the possibility to perform a quantitative analysis of the corrosion process (Bastidas et al., 2001).
Morphological surface damage inspection/evaluation (color, texture, and shape) due to corrosion may be performed using visual inspection, which presents the drawback of using subjective criteria for decision-making. Digital image processing (DIP) methods are currently gathering high attention to on-site analysis of RCSs corrosion (Choi and Kim, 2005; Liu et al., 2016). Finite element method (FEM) shows that the cracking of concrete beams due to steel corrosion is caused by an increasing radial expansion of the corroded steel rebars. Beam cracking develops in four stages: internal cracking, internal penetration, external horizontal cracking, and external vertical cracking (Du et al., 2013). Combining DIP and FEM may be an alternative diagnostic tool to the electrochemical LPR and EIS techniques.
Simulating the RCS beam is an advantageous and effective strategy to save costs and human resources, but it cannot be ignored that reinforced concrete is a combination of several materials and its property is unpredictable, making definition of materials in the finite element software challenging.
Corrosion of RCS is described by initiation and propagation stages according to classical Tutti model (Tuutti, 1982). The corrosion initiation stage is the time in which chloride and carbon dioxide (CO2) penetrate through the concrete cover until they reach the steel rebar surface. A critical threshold value is needed to cause the passivity breakdown, which initiates the corrosion process (Duffó et al., 2004). During initiation stage, there is no external damage to the RCS. Besides, propagation stage is favor by relative humidity, oxygen and temperature, and is defined by the appearance of the first visible crack on the concrete cover surface, then multiple cracks develop until delamination is found. To quantify the corrosion damage non-destructive electrochemical techniques have been used (Song, 2000; González, 2007; Fajardo et al., 2014).
Concrete corrosion-induced cracking and delamination are mainly due to the formation of oxide scale layers on top of rebars. The different volume of iron oxides and oxyhydroxides with respect to iron, produces concrete cracking caused by the high exerted pressure of the oxide scale (Sánchez-Deza et al., 2017). The key parameter on the final observed pressure, is the molar volume ratio coefficient (α), calculated as follows: α = Vm(oxyhydroxide)/Vm(Fe), where Vm(oxyhydroxide) and Vm(Fe) are the molar volumes of oxyhydroxide and iron, respectively (Sánchez-Deza et al., 2018). The Vm (cm3/mol) parameter is obtained dividing the molar mass of a crystalline phase by its density (Sánchez-Deza et al., 2017).
The high values for α coefficient, as is the case of akaganeite (β-FeOOH, α = 3.59), particularly contribute to a rapid cracking process. In addition, several crystalline phases are responsible for the exerted pressure of the oxide scale in RCS, lepidocrocite (γ-FeOOH, α = 3.16), goethite (α-FeOOH, α = 2.94), maghemite (γ-Fe2O3, α = 2.30), hematite (α-Fe2O3, α = 2.13), and magnetite (Fe3O4, α = 2.09).
A more comprehensive mechanism of the deterioration process of steel reinforced concrete consists of four different stages: (1) The ingress of physical and chemical agents by diffusion initiate the corrosion process. (2) The oxides grow around the reinforcement until a maximum limit is reached, producing pressure on the interface between the concrete and the steel reinforcement. The additional pressure promotes the growth of microcracks through the concrete cover, producing the first visible concrete cover crack. (3) The crack width increases due to the ongoing formation of oxide products in the steel reinforcement and concrete interface. (4) The concrete cover detaches, and the structure fails. For each of the first three stages, experimental, analytical, and numerical studies have been carried out to establish maintenance policies. Amongst the numerical methods used, the FEM is the most common. For example, in the first ingress stage (Pan and Wang, 2011; Shafei et al., 2012; Muthulingam and Rao, 2014), where the ingress of chloride ions through the concrete cover is modeled with finite elements, some works consider the interface between aggregates and mortar, different reinforcement configurations in the transversal section and the properties of concrete and ion diffusion to determine the beginning of the cracking in the steel-concrete interface. In the second stage (Chernin and Val, 2011; Ožbolt and Oršanić, 2014; Guzmán and Gálvez, 2017), the finite element models show the cracking pattern in the concrete cover depends primarily on the diameter of the reinforcement, concrete cover, position of the anode and cathode, and the transport of corrosion products through of the cracks; previous studies by Guzmán and Gálvez (2017), found that in the case of non-uniform corrosion around the steel, the time at which the first visible crack appears on the surface is earlier than the time for uniform corrosion. The third stage, which is considered the most important, due to the visible crack width on the concrete surface, is one of the relevant criteria for assessing service conditions. Chen and Leung (2015) developed a model using FEM that related the crack width on the surface of the concrete cover with the percentage of corroded steel, considering two types of corrosion, uniform and “non-uniform.” The definition for non-uniform corrosion they presented referred to non-uniform geometrical distribution but corrosion mechanism is still uniform (general corrosion). Alternatively, Yang et al. (2018) developed a numerical model via FEM that simulated the crack propagation and calculated the surface crack width considering a non-uniform corrosion process. The model proposed the inclusion of cohesive finite elements to overcome the convergence problem. However, these two studies do not consider the three-dimensional effect of the corroded length of steel, which significantly affects the crack width according to experimental evidence (Torres-Acosta and Sagüés, 2004). An important aspect of the work of Yang et al. (2018), which is continued in this article, is that after the first crack appears on the surface, the modulus of elasticity of the concrete, as well as its tensile strength, do not have a significant effect on the crack width. In this article, the length along the rebar with uniform corrosion is considered for the modeling of the concrete cracking.
The aim of this paper is to develop a simple numerical model for predicting corrosion failure risk of steel in concrete using a 3D FEM analysis by measuring the width of the concrete cracks and calculating the length along the rebar with uniform corrosion, defined as the “length of anodic zone.”
Materials And Methods
Finite Element Method (FEM)
Finite element analysis was performed using ANSYS [ANSYS release 15.0, Canonsburg, PA, United States], which is a general-purpose FEM package. The detailed description of the proposed model and calculations are presented in the Supplementary Appendix.
The physical model used to perform numerical analysis using FEM is shown in Figure 1, which depicts a beam with a single rebar (Andrade et al., 1993). These literature data provided useful experimental results as they reported stress-strain tests on concrete using five strain gauges. The strain values were used to adjust the numerical-experimental curve. The single rebar is modeled using SOLID186 element and the concrete by SOLID65 elements. With the SOLID65 element, it is possible to simulate cracking.
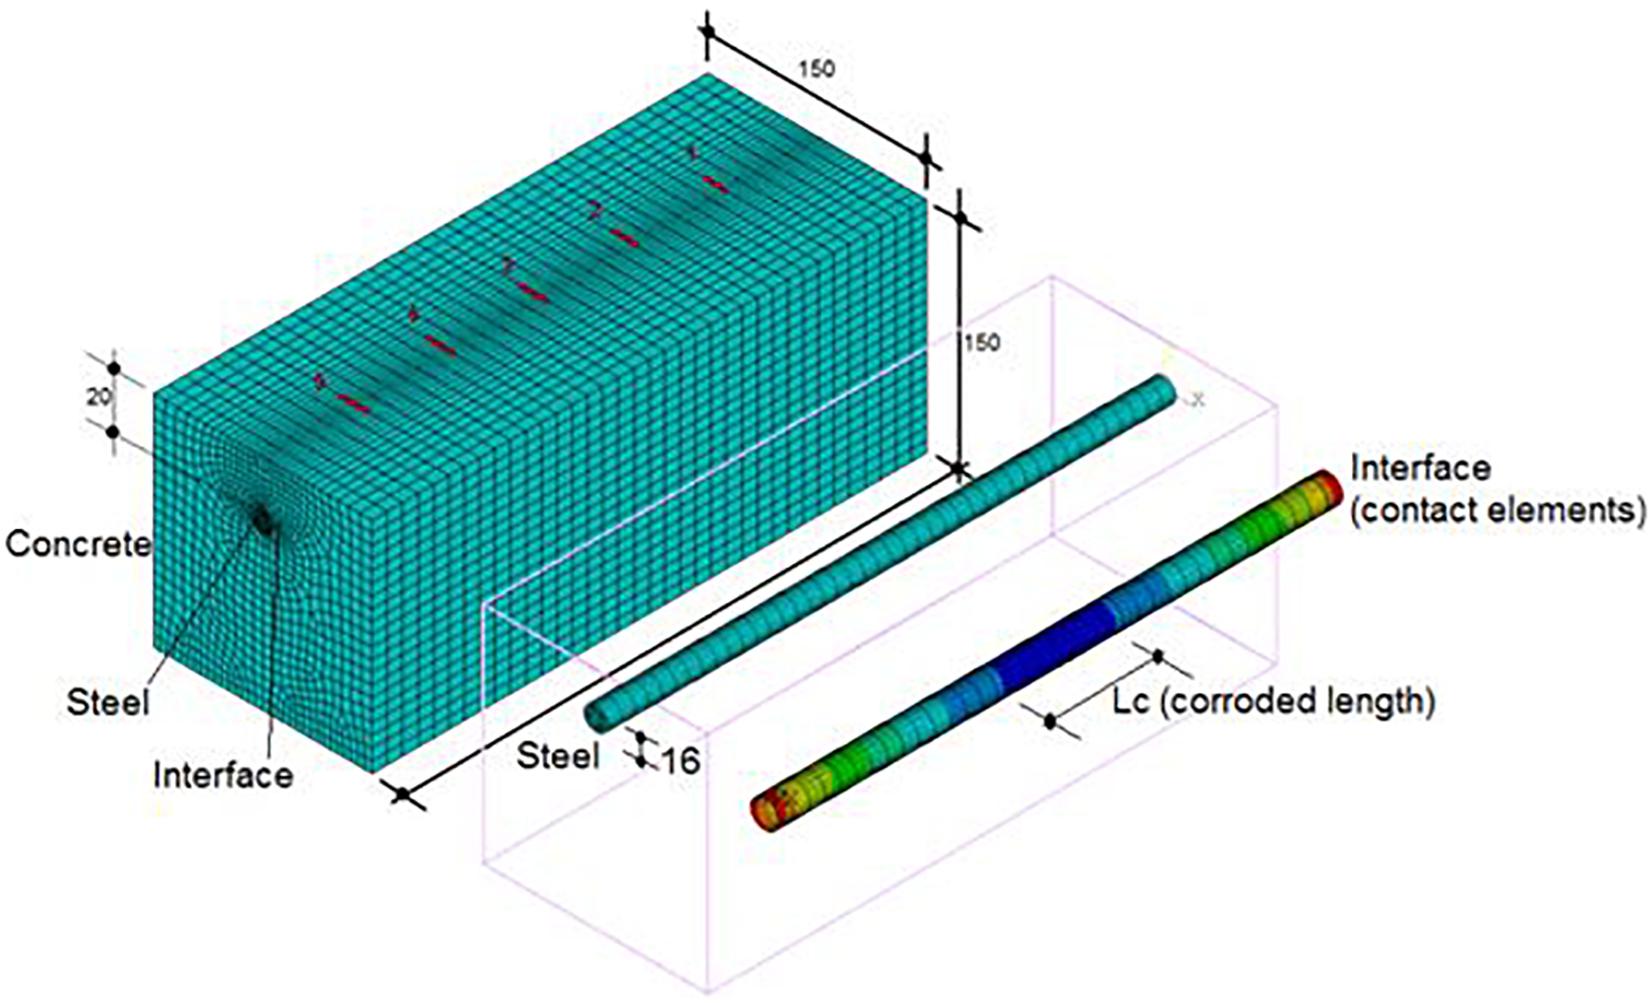
Figure 1. Physical model used to perform numerical analysis by FEM.
The FEM analysis used contact elements to account for the steel-concrete interface. This approach allows modeling of two-separated solid (concrete and steel) that can interact together. Two different sides for the contact elements were considered: one side is referred to as the contact surface (CONTA174) and the other side as the target surface (TARGE170). Total of 35856 finite elements were used: 27090 SOLID65, 6462 SOLID186, 1152 CONTA174, and 1152 TARGE170. The contact surface is connected to the steel, while the target surface is adjacent to the concrete, a schematic diagram is shown in Figure 2. The stiffness relationship between the two contact areas is modeled by a spring (dummy, represented by the value of its contact stiffness Kcont) that is placed between the two contact areas. The use of contact elements needs to consider the specific properties of the oxide scale, i.e., corrosion product stiffness allows representation of the steel/concrete interface. There are three main contact algorithms in ANSYS: Penalty Method, Lagrange Multipliers, and Augmented Lagrangian Method. In this work, Penalty Method has been used, since it imposes an approximate compatibility through the contact stiffness, Kcont. In this method, ANSYS assumes that contact force (Fcont) along the normal direction is a function of Kcont and the displacement of the nodes in contact (δ), obtained by Fcont = Kcont×δ. The Kcont stiffness is calculated by adjusting the parameters FKN, FKT and FTOLN provided by ANSYS for the properties of the contact elements. For high contact stiffness values (Kcont), scattered contact force (Fcont) results were obtained, thus low convergence of the model limited the magnitude of δ. The initial value of δ can be approached using the elasticity theory for a homogeneous material (Timoshenko and Goodier, 1970), see Eq. (1):
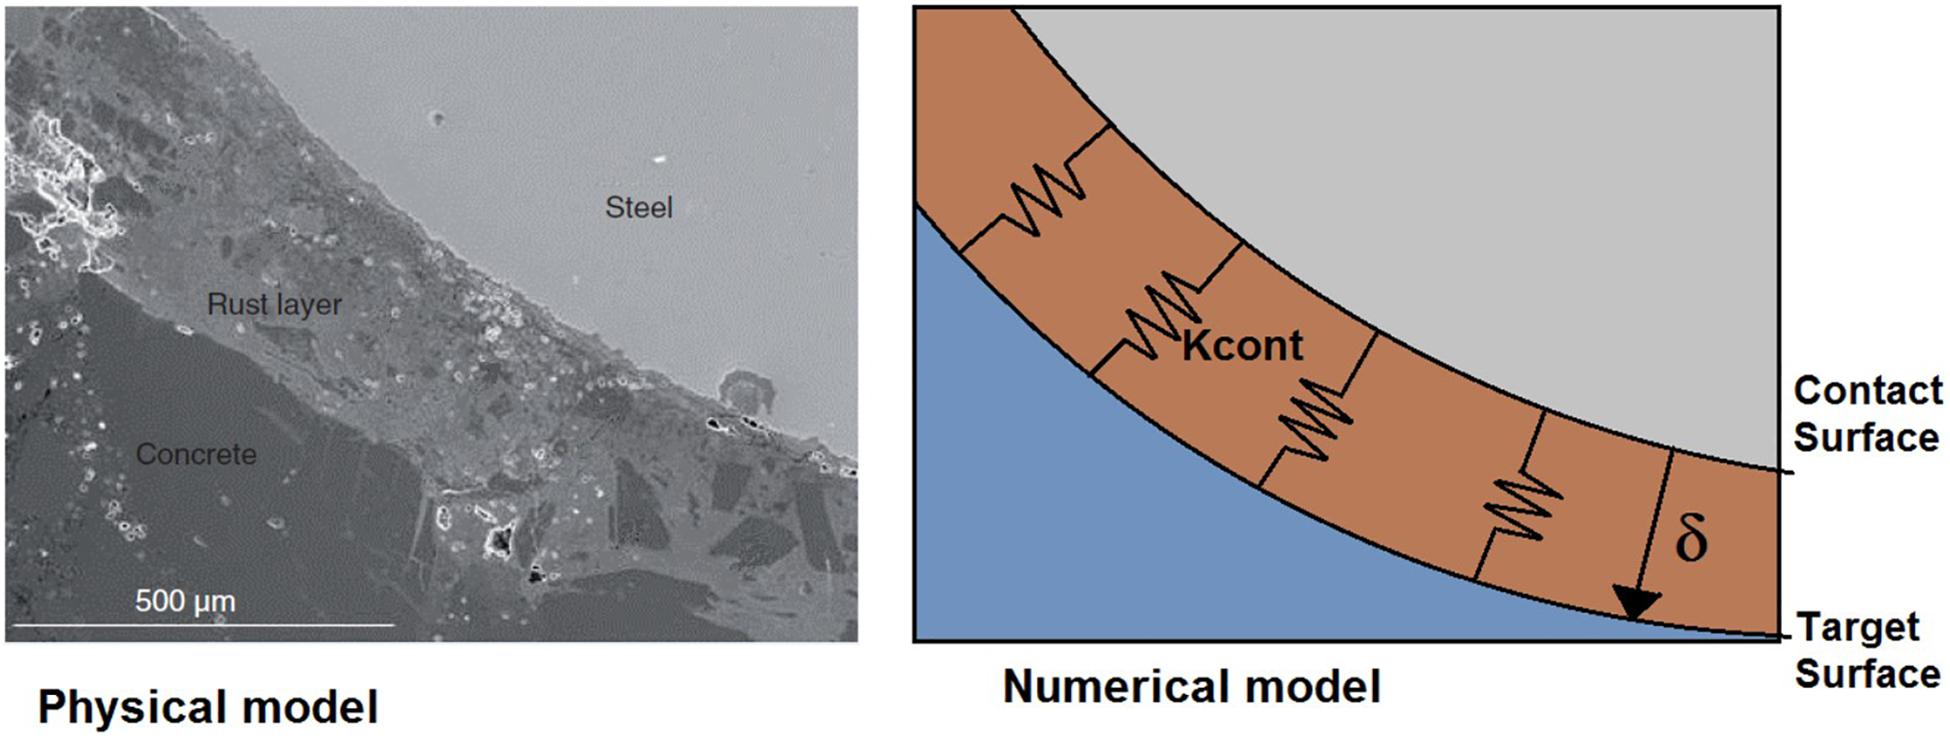
Figure 2. Diagram of the steel-concrete interface, (left) physical model including rust layer, and (right) numerical model depicting the contact surface, target surface, contact stiffness (Kcont) and contact surface thickness (δ).
where Es is the modulus of elasticity for the steel rebar; νs is the Poisson’s coefficient of the steel rebar; Ec is the modulus of elasticity of concrete; νc is the Poisson’s coefficient of concrete; r0 is the initial radius of the steel rebar; Rc is the distance from the steel rebar center to the nearest free concrete surface (Rc = C+r0), where C is the free concrete cover; and Pg is the radial pressure at the steel-concrete interface, which is obtained using Eq. (2):
where ft is the tensile strength of concrete. The process of simulating the beam and the rebar in the FEM has been described recently by Castorena-González et al. (2019).
Among the different models found in the literature, the so-called “smeared crack model” (Pantazopoulou and Papoulia, 2001), allows the crack width (w, mm) to be obtained using FEM. The mean deformation around the free concrete surface (Rc) is calculated using Eq. (3):
where εy is the strain in polar coordinates.
In this model, a uniform expansion of iron oxyhydroxides around the steel rebar perimeter is assumed, where stresses are transmitted to the surrounding concrete through the contact elements. The amount of iron oxyhydroxides that exert pressure were labeled with the variable δr, see Figure 2. To calculate the penetration quantity (x1) from δr, Eq. (4) was used:
where x1 is the penetration of corrosion in the steel rebar during the process, after the first crack, and α as defined above is the molar volume expansion coefficient defined as the relationship between the iron oxyhydroxides and the original iron molar volume. These values vary between 2.09 and 3.59 (2.09 ≤ α ≤ 3.59), according to different corrosion products formation, see Table 1 (Sánchez-Deza et al., 2017, 2018). The composition of these iron oxyhydroxides depends mainly on the chloride and oxygen concentration, relative humidity, and temperature. Thus, it is not possible to predict the iron oxyhydroxide compound to be formed. Therefore, in the present study it is considered a value of α = 3.59, corresponding to akaganeite as the main iron oxyhydroxide found in marine environments (Sánchez-Deza et al., 2017).
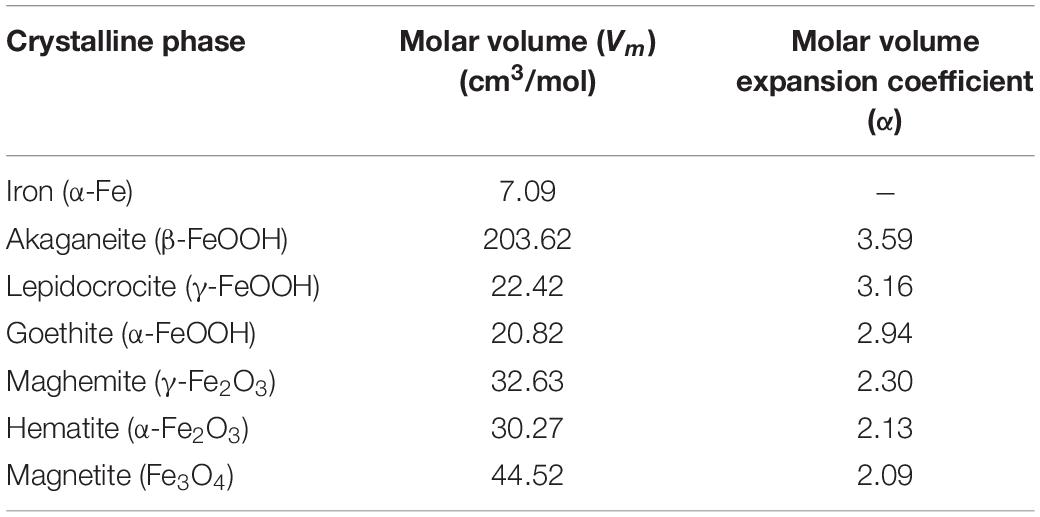
Table 1. Molar volume (Vm) and molar volume expansion coefficient (α) (α = Vm(oxyhydroxide)/Vm(Fe)) for iron oxyhydroxides (Sánchez-Deza et al., 2017, 2018).
A scheme of the concrete cracking stages is depicted in Figure 3 using 3D FEM modeling. Pit initiation (Figure 3a), and crack initiation and propagation stages in Figures 3b,c, respectively. Figure 4 shows corrosion-induced cracking for a single reinforcement, where deformation is obtained as a function of the initial radius of steel (x0) and the radius after corrosion penetration process (x) (Andrade et al., 1993), i.e., a 16 mm diameter rebar is located in the center of one the specimens sides, having a 20 mm concrete cover, and an applied current density of 10 μA/cm2. The three different concrete cover cracking stages considered in Figure 3, have now been included and labelled as point A corresponding to the crack initiation, and B and C to the propagation stages (see Figure 4). Figure 4 also includes the comparison between numerical and experimental results. In a previous study, the crack width was calculated by multiplying the approximate length of the strain gages (30 mm) by the measured strain, thus, by the time the first visible crack appears on the surface, its width was found to be 0.03 mm (Andrade et al., 1993). Using Eq. (3), a crack width of 0.016 mm is attained. The crack width values obtained from both methods, although different, are considered valid because they agree with the experimentally observed crack width (<0.05 mm). This behavior is shown in Figure 4 for the curve obtained using FEM model, which shows the brittle behavior of concrete, in which it is observed that the first visible crack may be between 0.07 and 0.027 mm, resembling the experimental value of 0.032 mm obtained through a microscope, shown in Figure 5.
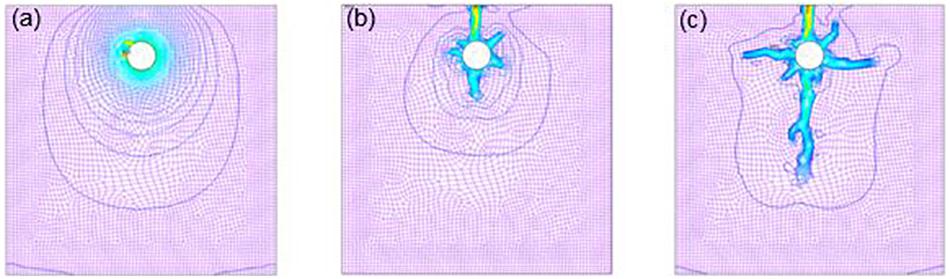
Figure 3. 3D FEM image, showing the reinforced concrete corrosion-induced cracking stages, (a) pit initiation, (b) crack initiation, and (c) crack propagation process.
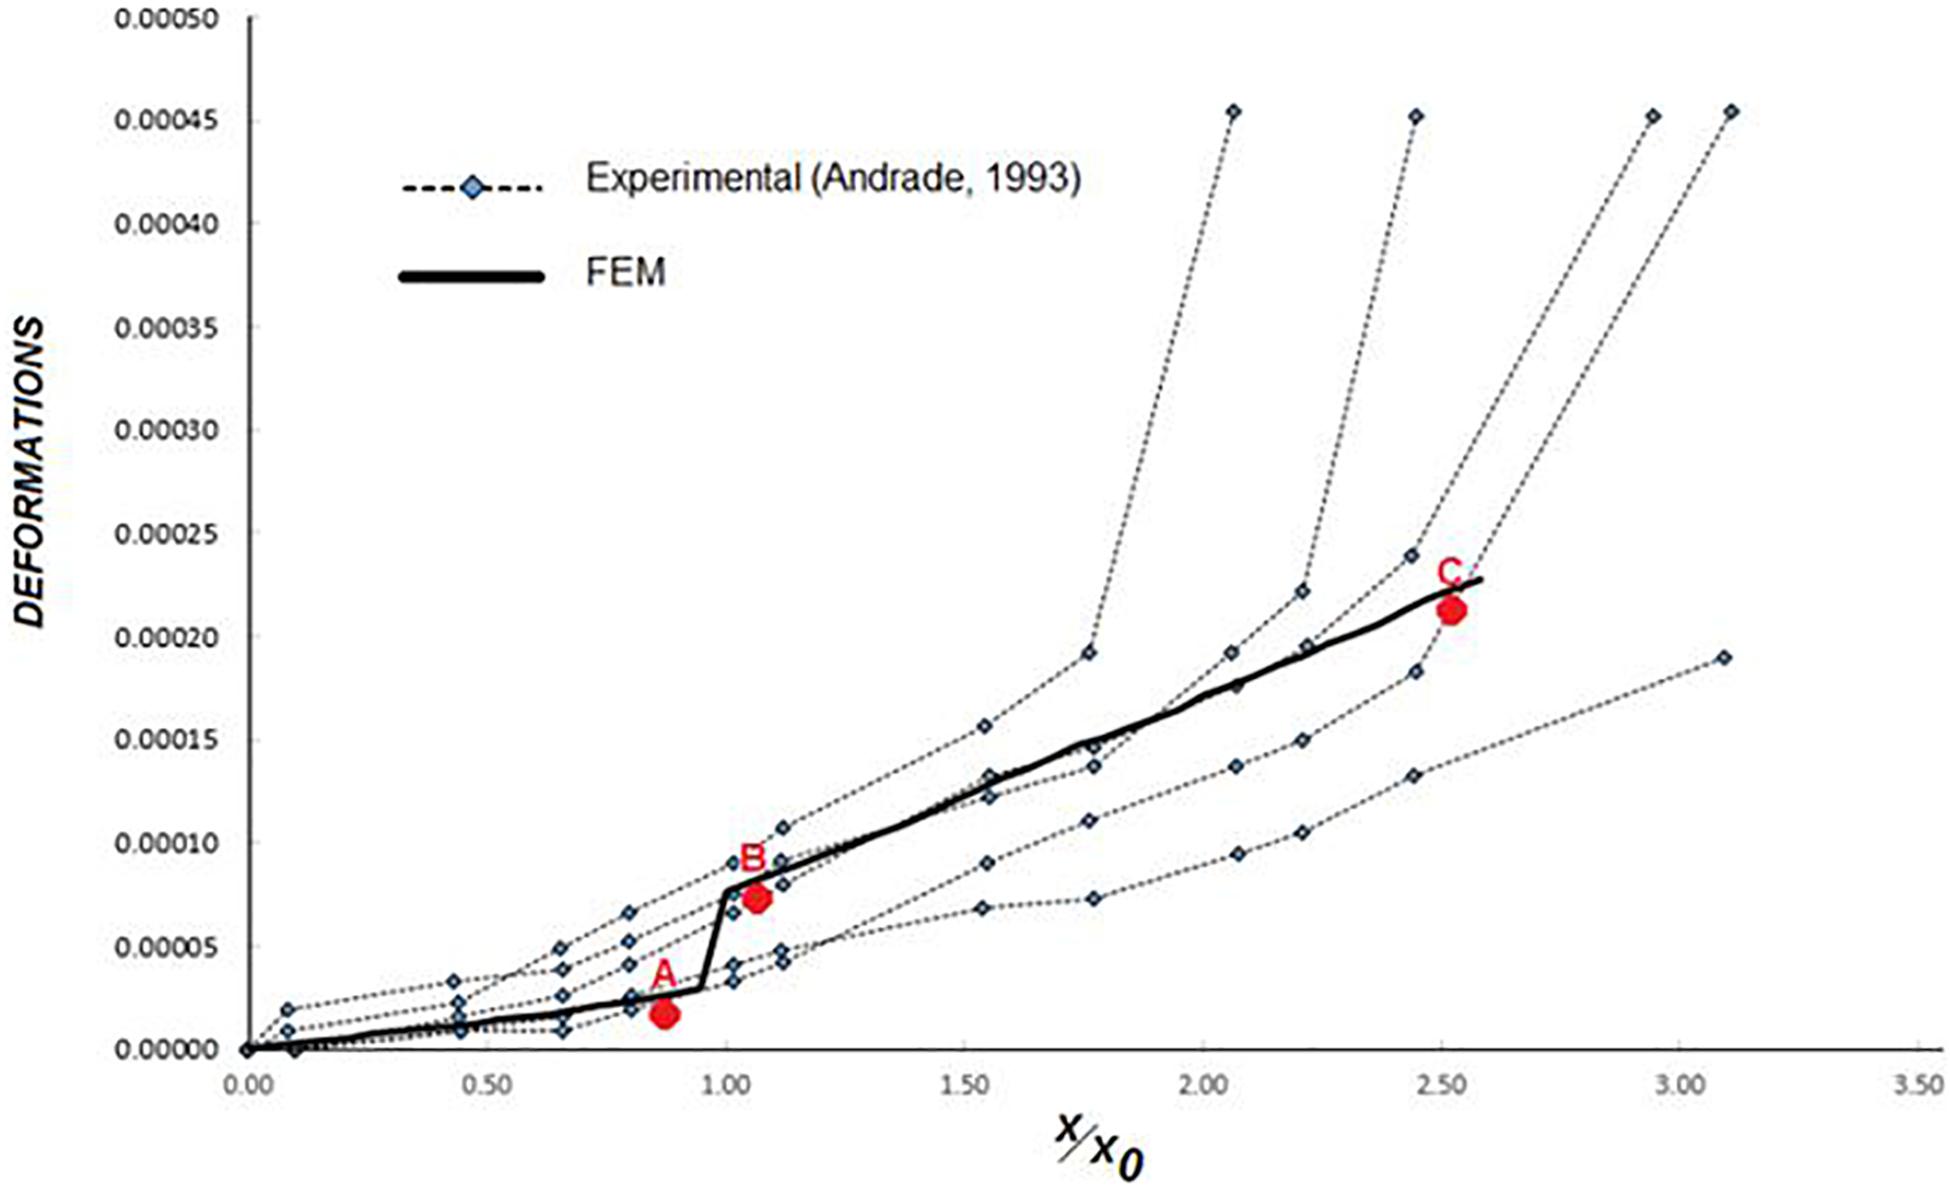
Figure 4. Deformation vs. x/x0 plot, showing the corrosion-induced cracking behavior. Comparison between experimental data taken from the literature and simulated data using the FEM model.
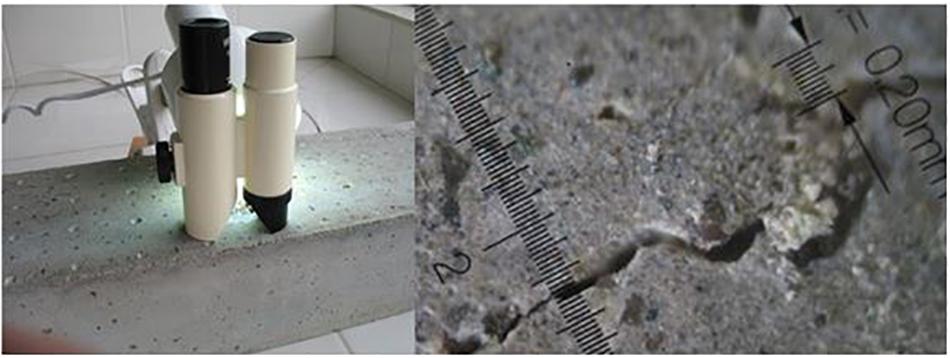
Figure 5. Optical microscope image of the concrete cover crack (including crack width of 0.2 mm) found after the corrosion propagation process.
The experimental validation of the proposed FEM model is defined by Eq. (5):
where x is the total pit penetration depth of steel rebar among the entire corrosion process (including initiation and propagation stages), xcr is the pit penetration depth during the corrosion initiation stage (first visible crack on the free concrete cover), and xp is the pit penetration depth after the corrosion propagation stage. Three experiments by different authors were taken from the literature: two corrosion case studies in natural environments and one work covering accelerated corrosion in laboratory test conditions. The experiments were chosen due to their ability to quantify the corroded length (Lc) and to describe the type of oxide produced (Torres-Acosta and Sagüés, 2004; Vidal et al., 2004; Poupard et al., 2006), which are very important parameters for the applicability of the proposed FEM model.
Vidal et al. (2004) reported corrosion and cracking results for two beams corroded in natural environments for periods of 14 and 17 years. In addition, the beams were subjected to a constant loading regime. For the calculation of the pit penetration depth in the different corrosion stages, xcr and xp values, the Eq. (6) proposed by Vidal et al. (2004).
where ϕ0 is the initial steel rebar diameter (in mm); ΔAs is the steel cross-section loss (mm2); As corresponds to the initial steel cross-section area of the steel rebar (mm2); and λ is the pit concentration factor. For λ value of 8 [localized corrosion induced by chlorides (Vidal et al., 2004)], the values of ΔAs and Lc for the different regions of the Beam A were obtained from the work of Vidal et al. (2004). For the beam A, it was considered that ϕ0 = 16 mm, C = 48 mm, Ec = 32000 MPa, f’c = 45 MPa, ft = 4.7 MPa, fy = 500 MPa, and As = 201.1 mm2, see Table 2.
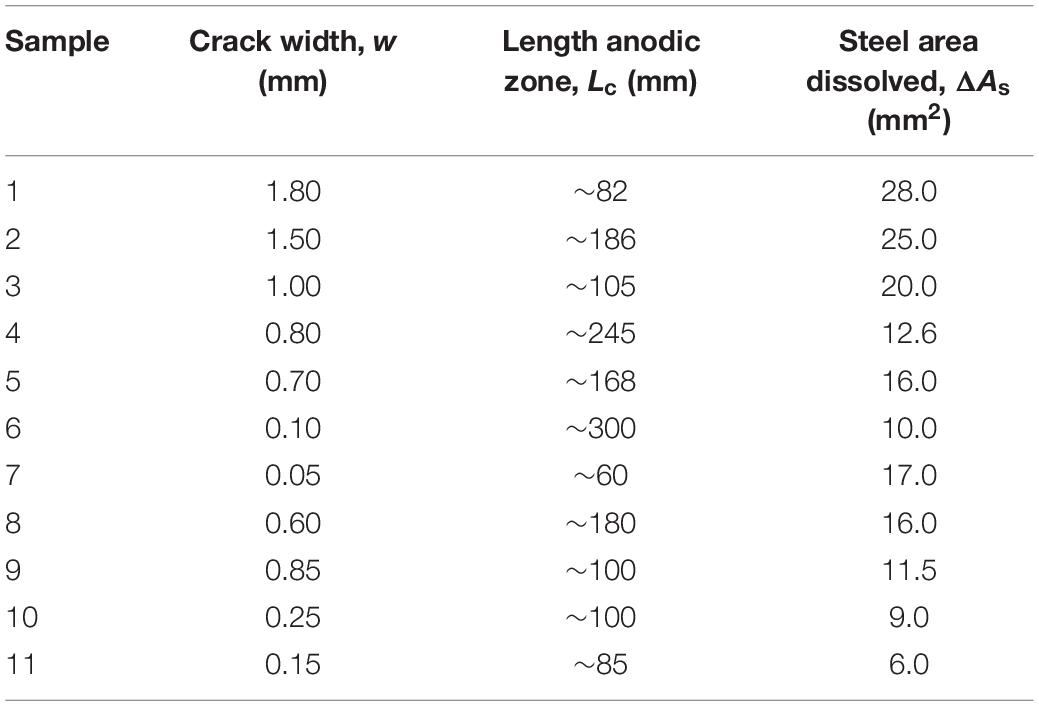
Table 2. Experimental crack width values due to corrosion, calculated using data of the literature (Vidal et al., 2004).
A study of Poupard et al. (2006) reported on the corrosion damages of a prestressed steel beam exposed to a marine environment for 40 years. A carbon steel rebar embedded in concrete was used with ϕ0 = 6 mm and a free cover of C = 16 mm. The average mechanical resistance of the concrete used was 30 MPa, and the modulus of elasticity (Young’s modulus) and tensile strength of concrete were calculated according to the ACI 318-19 standard with Ec = 26000 MPa, and ft = 3.43 MPa (ACI 318-19,2019). Following the same procedure as in the previous approach, the results obtained by Poupard et al. (2006) were related to tension in the beam and considered in this work to validate the current proposed model (see Table 3).
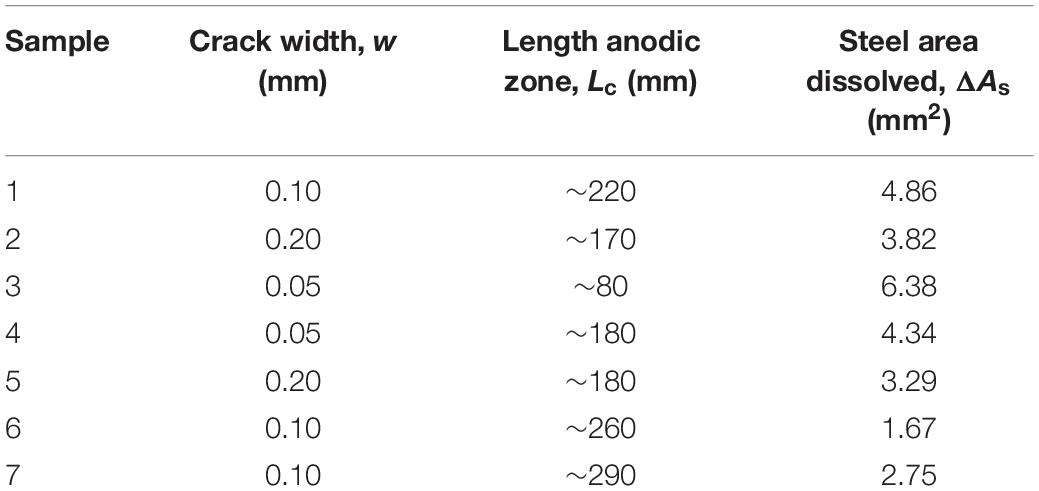
Table 3. Experimental crack width values due to corrosion, calculated using data from the literature (Poupard et al., 2006).
Ožbolt et al. (2012) proposed a coupled 3D chemo-hygro-thermo-mechanical model for analysis of steel rebar corrosion before and after passivation using a 3D FE code. It was found that the radial pressure around the rebar surface is not radial-symmetrically distributed. In addition, models that considered transport of corrosion products through cracks produced lower corrosion damage than without considering this effect. Thus, in this study no transport of corrosion products effect is being introduced in the proposed model.
Torres-Acosta and Sagüés determined the relationship between the loss of bending load capacity in reinforced concrete beams and the loss of steel due to localized corrosion in the steel rebar (Torres-Acosta and Sagüés, 2004). The difference with the two previous referred works (Vidal et al., 2004; Poupard et al., 2006), is that the beam was exposed to accelerated corrosion conditions. The central part of the beam was contaminated with chlorides allowing control of the length of the anodic zone (Lc). A steel rebar of diameter, ϕ0 = 9.5 mm was used with a concrete cover of C = 20 mm (Torres-Acosta and Sagüés, 2004). A compressive strength of 37 MPa was reported, indicating a value of the modulus of elasticity of Ec = 28760 MPa and a tensile strength value of ft = 3.81 MPa. The literature data values are included in Table 4 (Torres-Acosta and Sagüés, 2004).
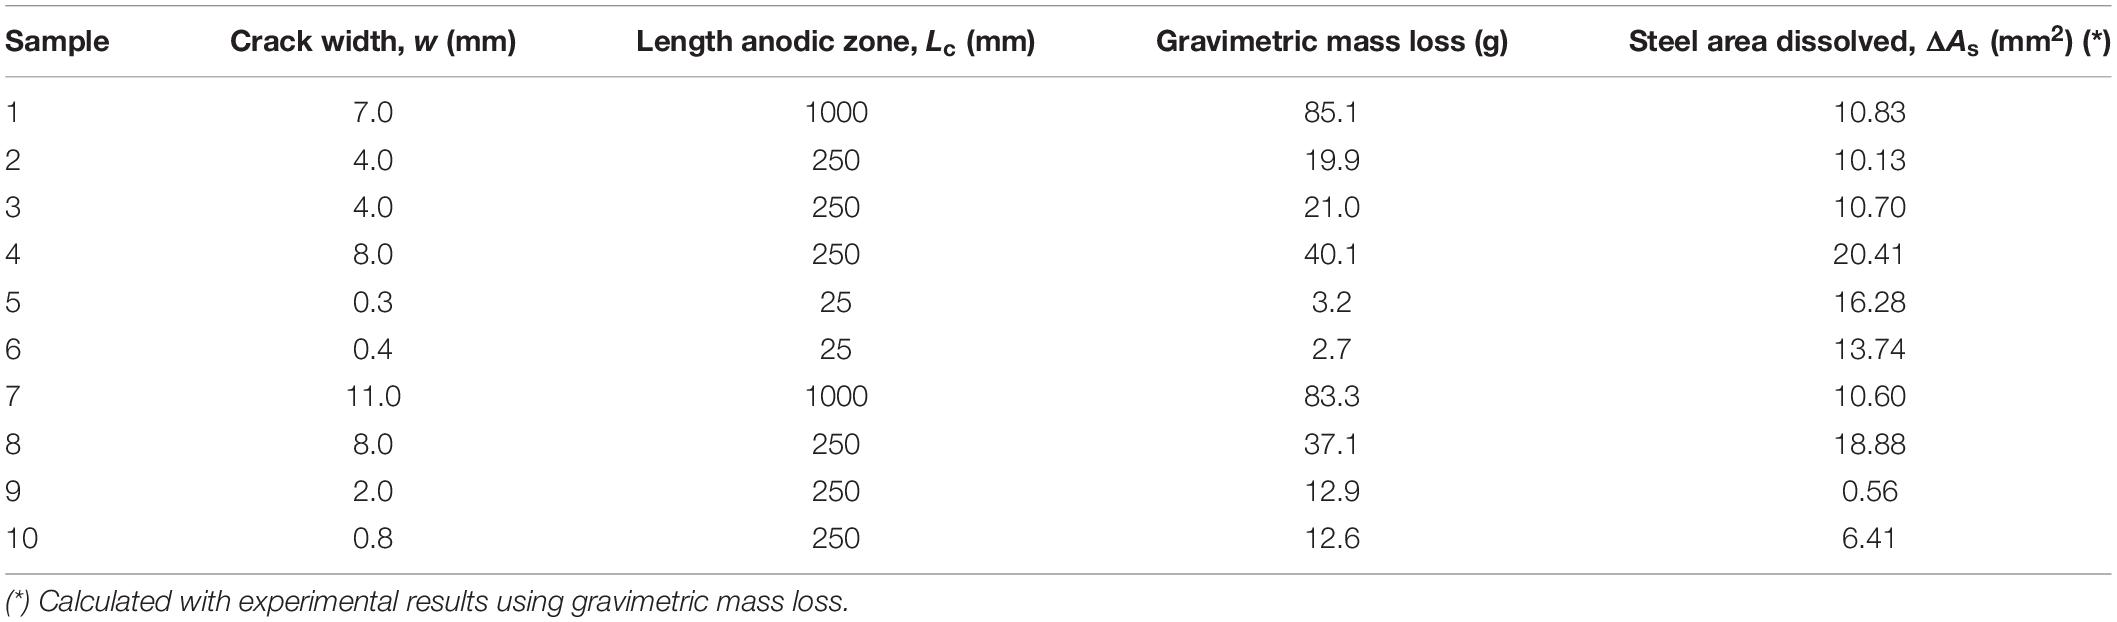
Table 4. Experimental crack width values due to corrosion, calculated using data from the literature (Torres-Acosta and Sagüés, 2004).
Results and Discussion
In works published by Vidal et al. (2004) and Poupard et al. (2006) the area of dissolved steel (ΔAs) was measured experimentally, while Torres-Acosta and Sagüés (2004) considered the mass loss. For comparative purposes it is necessary to express the results obtained using Eq. (5) in terms of area reduction according to Eq. (7):
where x (mm) is obtained using Eq. (5).
Figure 6 shows the relationship between the theoretical predictions of radius loss due to corrosion (x) using Eq. (7) and the experimental results from the measurements of ΔAs from literature (Torres-Acosta and Sagüés, 2004; Vidal et al., 2004; Poupard et al., 2006). A good correlation can be observed between the results obtained using the proposed FEM model, excluding samples S1 and S2, which correspond to an accelerated corrosion process with the following relevant characteristics: the sample S1 presented two specimens with a very small length (Lc = 25 mm), almost the same size as the maximum aggregate particle size (19 mm), while the sample S2 presented a corroded steel length of Lc = 1000 mm, and a measured crack width of w = 11 mm. Thus, it can be said that the developed model in this work has been validated and is applicable for Lc>50 mm, and crack widths w<11 mm.

Figure 6. Experimental vs. FEM data plot of the three beams studied, showing a high correlation.
Numerical Analysis
The modeling approaches described above were applied to investigate the non-linear relationships between the width of the crack and the penetration of corrosion in the steel rebar. For all the analyses, several parameters were chosen considering the same geometry (rebars at the top side of the beam). The following parameters consider both the mechanical properties of the concrete and the anodic corroded length (Lc) of the steel rebar: tensile strength ft = 2.0–3.0 MPa, compressive strength fc = 30–50 MPa, modulus of elasticity Ec = 22000–35000 MPa, and Lc = 50–380 mm. A behavior representative of the results that were obtained is shown in the graphs of Figure 7 with the variation of the tensile strength. It is observed that, before the first crack appears, the material and geometrical properties are relevant, however, during the growth of the crack (on the surface), their contribution greatly decreases. Thus, a model is proposed that describes the process in two states: before the crack appears on the surface and during its growth, as shown in Figure 8. The crack width on the surface varies with differences in length. Although a method can be utilized to identify the crack width, it cannot be said that the width of a crack close to the surface of the steel rebar is equivalent to the measured width of an exterior crack. The relationship obtained through a non-linear adjustment between cracks width and corrosion penetration depth is presented in Eq. (8):
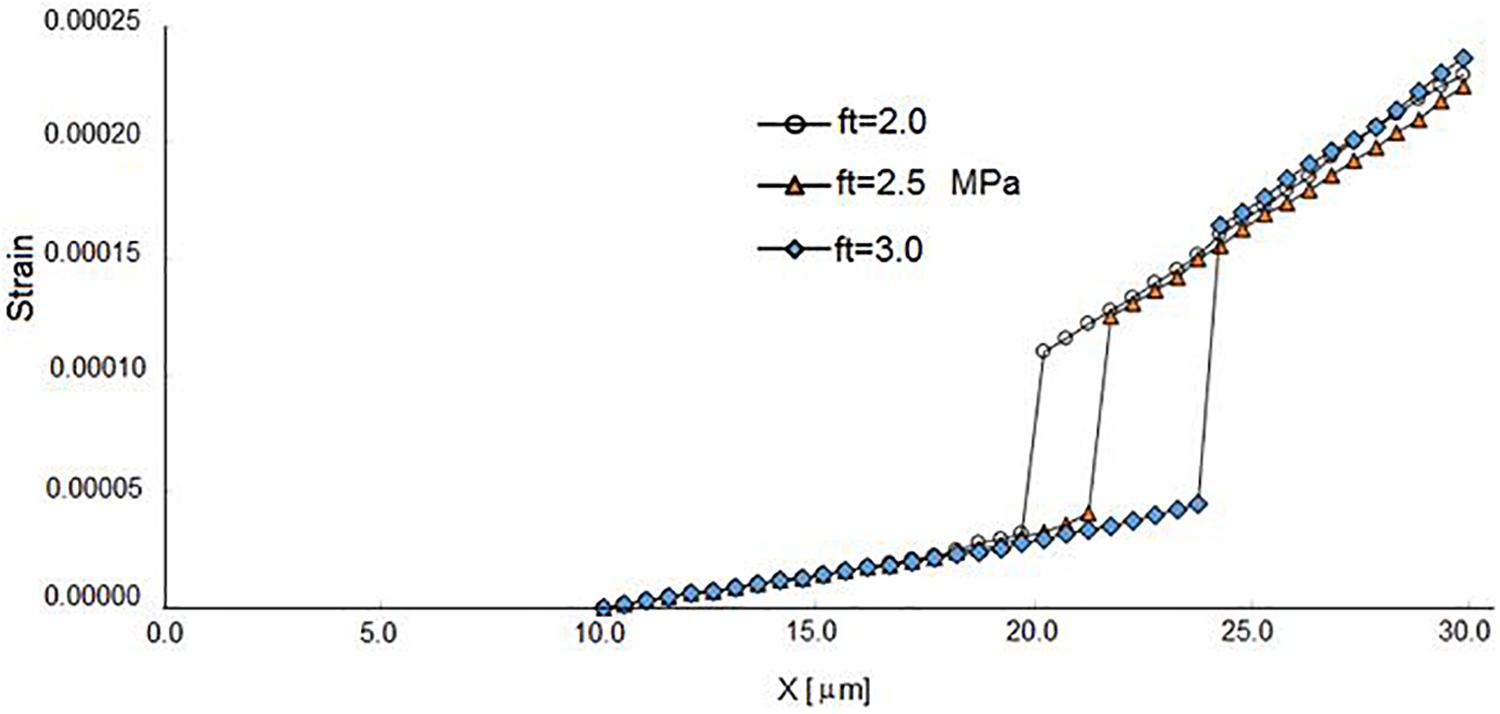
Figure 7. Tensile stress plot for the steel samples, with different tensile strength (ft) values of 2.0, 2.5, and 3.0 MPa.
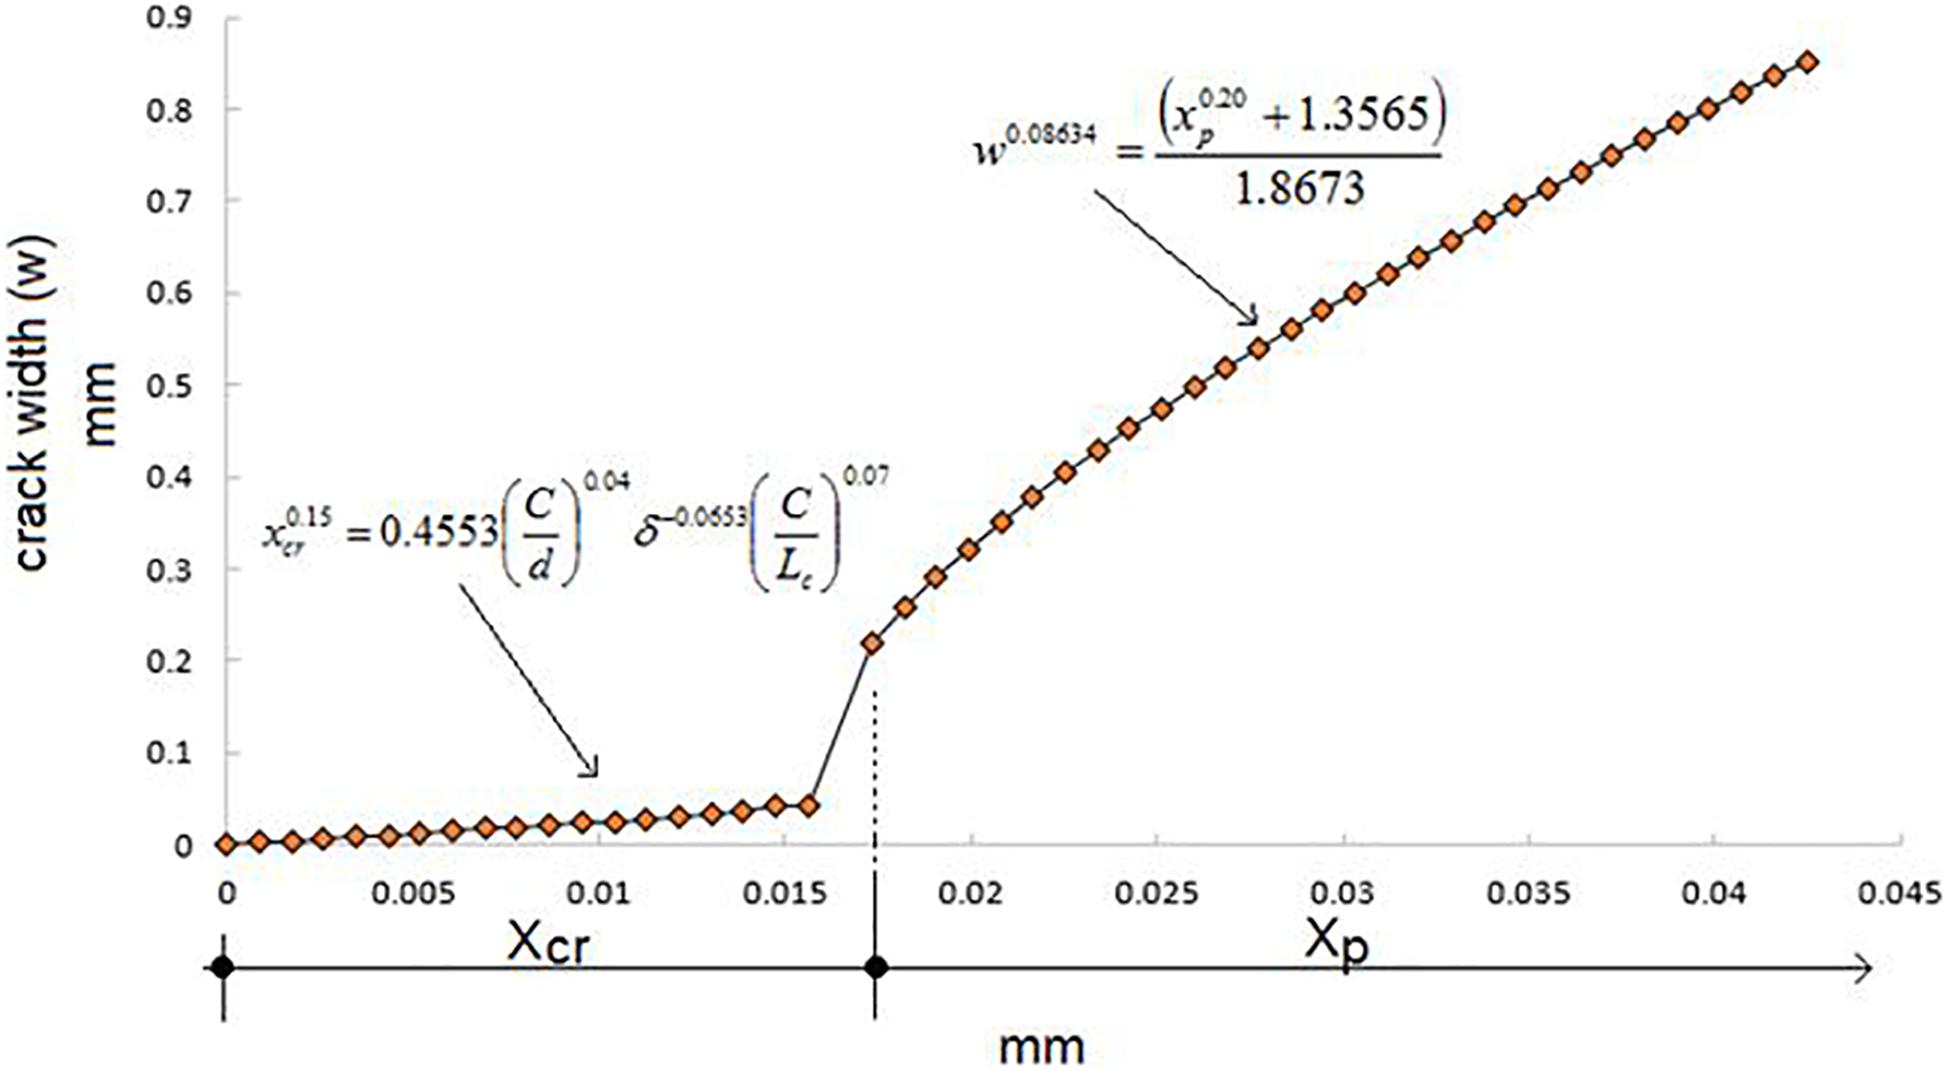
Figure 8. Crack width analysis as a function of xcr (steel corroded cross-section when first crack observed) and xp (steel corroded cross-section after crack propagation).
where w is the crack width (in mm) in the concrete cover; and xp is the penetration depth (in mm) for corrosion in the steel rebar after the first crack is formed. A predictive corrosion damage function model in RCS using visual observation of crack width has been developed. As a result, Eq. (8) is transformed to determine the xp parameter in terms of the crack width (w) producing Eq. (9) (Shafei et al., 2012):
Conclusion
Modeling of the concrete cover crack width due to localized corrosion of steel rebar using finite contact elements has been developed. A predictive model was proposed using the corrosion damage function by measuring the crack width in the surface of the concrete. The model is based on geometry, free concrete cover depth, steel rebar diameter, anodic zone length, and the mechanical properties of the concrete: modulus of elasticity, tensile strength, and Poisson’s modulus. The results were validated using three sets of experiments from literature, two corrosion case studies in natural environments and one work covering accelerated corrosion in laboratory test conditions. These beams were also subjected to the simultaneous action of flexural stress and corrosion. It was observed that before the first crack appears, the material and geometrical properties are relevant, however, during the growth of the crack (on the surface), they become less significant. A good correlation was obtained between the proposed model and the experimental results.
Data Availability Statement
The datasets generated for this study are available on request to the corresponding author.
Author Contributions
JC-G perform the experimental chart and FEM analysis. UM worked on the analysis of results and preparation of the manuscript. CG-T worked on the analysis of results. RN-J and FA-C worked on the analysis of results. JB helped with the interpretation and discussion of results and preparation of the manuscript. DB helped with the interpretation and discussion of results, in addition to writing and elaborating the manuscript.
Conflict of Interest
The authors declare that the research was conducted in the absence of any commercial or financial relationships that could be construed as a potential conflict of interest.
Acknowledgments
The authors express their gratitude to the PROMEP Program of the Autonomous University of Sinaloa and the CECYT of Sinaloa State, Mexico, for financial support. UM and DB acknowledge funding from The University of Akron, Fellowship Program FRC-207367.
Supplementary Material
The Supplementary Material for this article can be found online at: https://www.frontiersin.org/articles/10.3389/fmats.2020.00041/full#supplementary-material
References
ACI 318-19 (2019). Building Code Requirements for Structural Concrete and Commentary. Michigan: American Concrete Institute.
Andrade, C., Alonso, C., and Molina, F. J. (1993). Cover cracking as a function of rebar corrosion: part I-experimental test. Mater. Struct. 26, 453–464. doi: 10.1007/bf02472805
Andrade, C., Macias, A., Feliu, S., Escudero, M. L., and González, J. A. (1990). “Quantitative measurement of the corrosion rate using a small counter electrode in the boundary of passive and corroded zones of a long concrete beam,” in Corrosion Rates of Steel in Concrete, ASTM STP 1065, eds N. S. Berke, V. Chaker, and D. Whiting (Philadelphia: American Society for Testing and Materials), 134–142.
Bastidas, J. M., Polo, J. L., Torres, C. L., and Cano, E. (2001). A study on the stability of AISI 316L stainless steel pitting corrosion through its transfer function. Corros. Sci. 43, 269–281. doi: 10.1016/s0010-938x(00)00082-2
Cabrera, J. G. (1996). Deterioration of concrete due to reinforcement steel corrosion. Cem. Concr. Comp. 18, 47–59. doi: 10.1016/0958-9465(95)00043-7
Castorena-González, J. H., Gaona-Tiburcio, C., Bastidas, D. M., Núñez-Jáquez, R. E., Bastidas, J. M., and Almeraya-Calderón, F. M. (2019). Finite element modelling to predict reinforced concrete corrosion-induced cracking. Rev. Metal. 55:e150.
Chen, E., and Leung, C. K. Y. (2015). Finite element modeling of concrete cover cracking due to non-uniform steel corrosion. Eng. Fract. Mech. 134, 61–78. doi: 10.1016/j.engfracmech.2014.12.011
Chernin, L., and Val, D. V. (2011). Prediction of corrosion-induced cover cracking in reinforced concrete structures. Const. Build. Mater. 25, 1854–1869. doi: 10.1016/j.conbuildmat.2010.11.074
Choi, K. Y., and Kim, S. S. (2005). Morphological analysis and classification of types of surface corrosion damage by digital image processing. Corros. Sci. 47, 1–15. doi: 10.1016/j.corsci.2004.05.007
Du, Y. G., Chan, A. H. D., Clark, L. A., Wang, X. T., Gurkalo, F., and Bartos, S. (2013). Finite element analysis of cracking and delamination of concrete beam due to steel corrosion. Eng. Struct. 56, 8–21. doi: 10.1016/j.engstruct.2013.04.005
Duffó, G. S., Morris, W., Raspini, I., and Saragovi, C. (2004). A study of steel rebars embedded in concrete during 65 years. Corros. Sci. 46, 2143–2157. doi: 10.1016/j.corsci.2004.01.006
Fajardo, S., Sánchez-Deza, A., Criado, M., La Iglesia, A., and Bastidas, J. M. (2014). Corrosion of steel embedded in fly ash mortar using a transmission line model. J. Electrochem. Soc. 161:E3158.
González, J. A. (2007). Prediction of reinforced concrete structure durability by electrochemical techniques. Corrosion 63, 811–818. doi: 10.5006/1.3278430
Guzmán, S., and Gálvez, J. C. (2017). Modelling of concrete cover cracking due to non-uniform corrosion of reinforcing steel. Const. Build. Mater. 155, 1063–1071. doi: 10.1016/j.conbuildmat.2017.08.082
Liu, T., and Weyers, R. E. (1998). Modelling the dynamic corrosion process in chloride contaminated concrete structures. Cem. Concr. Res. 28, 365–379. doi: 10.1016/s0008-8846(98)00259-2
Liu, Y. F., Cho, S., Spencer, B. F., and Fan, J. S. (2016). Concrete crack assessment using digital image processing and 3D scene reconstruction. J. Comput. Civ. Eng. 30:04014124. doi: 10.1061/(asce)cp.1943-5487.0000446
Medina, E., Medina, J. M., Cobo, A., and Bastidas, D. M. (2015). Evaluation of mechanical and structural behavior of austenitic and duplex stainless steel reinforcements. Constr. Build. Mater. 78, 1–7. doi: 10.1016/j.conbuildmat.2015.01.008
Muthulingam, S., and Rao, B. N. (2014). Non-uniform time-to-corrosion initiation in steel reinforced concrete under chloride environment. Corros. Sci. 82, 304–315. doi: 10.1016/j.corsci.2014.01.023
Ožbolt, J., Oršanić, F., Balabanić, G., and Kušter, M. (2012). Modeling damage in concrete caused by corrosion of reinforcement: coupled 3D FE model. Int. J. Fract. 178, 233–244. doi: 10.1007/s10704-012-9774-3
Ožbolt, J., and Oršanić, F. G. (2014). Balabaniæ, modeling pull-out resistance of corroded reinforcement in concrete: coupled three-dimensional finite element model. Cem. Concr. Compos. 46, 41–55. doi: 10.1016/j.cemconcomp.2013.10.014
Pan, T., and Wang, L. (2011). Finite-element analysis of chemical transport and reinforcement corrosion-induced cracking in variably saturated heterogeneous concrete. J. Eng. Mech. 137, 334–345. doi: 10.1061/(asce)em.1943-7889.0000232
Pantazopoulou, S. J., and Papoulia, K. D. (2001). Modelling cover-cracking due to reinforcement corrosion in RC structures. J. Eng. Mech. ASCE 127, 342–351. doi: 10.1061/(asce)0733-9399(2001)127:4(342)
Poupard, O., L’Hostis, V., Catinaud, S., and Petre-Lazar, I. (2006). Corrosion damage diagnosis of a reinforced concrete beam after 40 years natural exposure in marine environment. Cem. Concr. Res. 36, 504–520. doi: 10.1016/j.cemconres.2005.11.004
Sánchez-Deza, A., Bastidas, D. M., La Iglesia, A., and Bastidas, J. M. (2017). A simple thermodynamic model on the cracking of concrete due to rust formed after casting. Anti Corros. Method. Mater. 64, 335–339. doi: 10.1108/acmm-11-2015-1602
Sánchez-Deza, A., Bastidas, D. M., La Iglesia, A., Mora, E. M., and Bastidas, J. M. (2018). Service life prediction for 50-year-old buildings in marine environments. Rev. Metal. 54:e111.
Shafei, B., Alipour, A., and Shinozuka, M. (2012). Prediction of corrosion initiation in reinforced concrete members subjected to environmental stressors: a finite-element framework. Cem. Concr. Res. 42, 365–376. doi: 10.1016/j.cemconres.2011.11.001
Song, G. (2000). Theoretical analysis of the measurement of polarization resistance in reinforced concrete. Cem. Concr. Comp. 22, 407–415. doi: 10.1016/s0958-9465(00)00040-8
Timoshenko, S., and Goodier, J. (1970). Theory of Elasticity. New York, NY: McGraw-Hill International Book Company.
Torres-Acosta, A., and Sagüés, A. (2004). Concrete cracking by localized steel corrosion – geometric effects. ACI Mater. J. 101, 501–507.
Tuutti, K. (1982). Corrosion of Steel in Concrete. Stockholm: Swedish Cement and Concrete Research Institute.
Vidal, T., Castel, A., and François, R. (2004). Analysing crack width to predict corrosion in reinforced concrete. Cem. Concr. Res. 34, 165–174. doi: 10.1016/s0008-8846(03)00246-1
Keywords: concrete cover cracking, corrosion, crack width, numerical model, finite element method (FEM)
Citation: Castorena-González JH, Martin U, Gaona-Tiburcio C, Núñez-Jáquez RE, Almeraya-Calderón FM, Bastidas JM and Bastidas DM (2020) Modeling Steel Corrosion Failure in Reinforced Concrete by Cover Crack Width 3D FEM Analysis. Front. Mater. 7:41. doi: 10.3389/fmats.2020.00041
Received: 09 July 2019; Accepted: 06 February 2020;
Published: 21 February 2020.
Edited by:
Yu-Fei Wu, RMIT University, AustraliaCopyright © 2020 Castorena-González, Martin, Gaona-Tiburcio, Núñez-Jáquez, Almeraya-Calderón, Bastidas and Bastidas. This is an open-access article distributed under the terms of the Creative Commons Attribution License (CC BY). The use, distribution or reproduction in other forums is permitted, provided the original author(s) and the copyright owner(s) are credited and that the original publication in this journal is cited, in accordance with accepted academic practice. No use, distribution or reproduction is permitted which does not comply with these terms.
*Correspondence: D. M. Bastidas, dbastidas@uakron.edu