 Johanna Santala
 Jari P. T. Valkonen
- 1Finnish Food Safety Authority Evira, Helsinki, Finland
- 2Department of Agricultural Sciences, University of Helsinki, Helsinki, Finland
Plants recognize unrelated viruses by the antiviral defense system called RNA interference (RNAi). RNAi processes double-stranded viral RNA into small RNAs (sRNAs) of 21–24 nucleotides, the reassembly of which into longer strands in silico allows virus identification by comparison with the sequences available in databases. The aim of this study was to compare the virus detection sensitivity of sRNA-based virus diagnosis with the established virus species-specific polymerase chain reaction (PCR) approach. Viruses propagated in tobacco plants included three engineered, infectious clones of Potato virus A (PVA), each carrying a different marker gene, and an infectious clone of Potato virus Y (PVY). Total RNA (containing sRNA) was isolated and subjected to reverse-transcription real-time PCR (RT-RT-PCR) and sRNA deep-sequencing at different concentrations. RNA extracted from various crop plants was included in the reactions to normalize RNA concentrations. Targeted detection of selected viruses showed a similar threshold for the sRNA and reverse-transcription quantitative PCR (RT-qPCR) analyses. The detection limit for PVY and PVA by RT-qPCR in this study was 3 and 1.5 fg of viral RNA, respectively, in 50 ng of total RNA per PCR reaction. When knowledge was available about the viruses likely present in the samples, sRNA-based virus detection was 10 times more sensitive than RT-RT-PCR. The advantage of sRNA analysis is the detection of all tested viruses without the need for virus-specific primers or probes.
Introduction
The large number and high genetic variability of plant viruses make their detection cumbersome. Virus-specific antibodies or probes are available mainly for prevalent, economically harmful plant viruses, whereas the absence of specific diagnostic tools for the great majority of plant viruses hampers broader surveys of viruses (Zaitlin and Palukaitis, 2000; Jones et al., 2017). Plants themselves do, however, recognize virus infection via an antiviral defense system called RNA interference (RNAi), which targets and processes double-stranded RNA into 21- to 24-nucleotide (nt) small RNAs (sRNAs) (Ding and Voinnet, 2007). sRNAs can be extracted from plant tissues and sequenced, and the sequences can then be reassembled into partial or full viral genomes in silico, which allows identification by comparison with viral sequences available in databases. This method, published by Kreuze et al. (2009), has been widely adopted and has been used for surveys of viruses in cultivated (Kashif et al., 2012; Moon and Park, 2016; Massart et al., 2017) and wild plants (Bi et al., 2012). It allows the detection of different, unrelated viruses simultaneously in a single assay, without need for antibodies, probes, etc.
The real-time polymerase chain reaction (RT-PCR) method is a well-established, sensitive and specific tool for virus detection and was used for many years before the sRNA-based approach was introduced (Rowhani et al., 1995; Roberts et al., 2000; Boonham et al., 2008; Gutiérrez-Aguirre et al., 2009; Mirmajlessi et al., 2015). RT-PCR-based methods will likely remain as basic tools for plant inspection, e.g., targeted testing of viruses, but detection based on RNA sequencing is gaining popularity for screening a wide range of viruses simultaneously. As interest in applying sRNA-based virus detection in official plant inspection is increasing, the aim of this study was to estimate whether similar detection thresholds can be reached with the sRNA-based and RT-PCR-based methods.
Materials and Methods
Virus Propagation
Infectious clones of Potato virus A (PVA) engineered to express red fluorescent protein (RFP) (PVA-ynHC/6K2rfp) (Haikonen et al., 2013), green fluorescent protein (PVA-GFP) (Rajamäki et al., 2005) or β-glucuronidase (PVA-GUS) (Kelloniemi et al., 2008) and an infectious clone of Potato virus Y [PVY-N605(1048)] (Bukovinszki et al., 2007) were used to inoculate 5-week-old tobacco plants (Nicotiana tabacum L. cv. Samsun nn) by particle bombardment using a HandyGun (Sikorskaite et al., 2010). Plants were placed in a growth chamber (16-h photoperiod; relative humidity, 70%; light intensity, 200 μE m-2s-1; temperature, 18 and 22°C during the night and day, respectively) and were given 0.3 g fertilizer (16:9:22 = N/P/K; Yara, Espoo, Finland) per liter of water when watered.
RNA Extraction, Quantification, and cDNA Synthesis
The uppermost fully expanded leaves were sampled from the tobacco plants. Total RNA was extracted from the leaves using Trizol reagent generated in-house (Caldo et al., 2004). In addition, pure viral RNA was isolated with this method from virus particles that had been isolated from tobacco leaf sap, as described (Valkonen et al., 1991). The RNA concentration was determined using a Nanodrop (Thermo Fischer Scientific, Waltham, MA, United States). 1 μg of leaf RNA (per sample) was treated with RQ1 RNase-free DNase (Promega, Madison, WI, United States) according to the manufacturer’s instructions and used for cDNA synthesis. cDNA synthesis was also carried out on 1000 and 250 ng of RNA extracted from purified PVY and PVA particles, respectively. cDNA was synthesized with Moloney murine leukemia virus (M-MLV) reverse transcriptase (Promega) using random hexamers, according to the manufacturer’s instructions.
Total RNA was also isolated from leaves of cultivated strawberries [Fragaria × ananassa (Weston) Duchesne ex Rozier (pro sp.)], raspberries (Rubus idaeus L.) and Ribes species obtained from the genetic resource collection maintained by the Natural Resources Institute of Finland (LUKE). A protocol combining the cetyl trimethylammonium bromide (CTAB) method and acidic phenol–chloroform extraction was used for RNA purification (Kurokura et al., 2006). Purity and concentration of RNA samples were determined with the Nanodrop. RNA was stored at -80°C.
RT-PCR and Deep Sequencing
Potato virus Y and PVA RNA was quantified by real-time quantitative PCR (qPCR) using cDNA generated from total RNA extracted from systemically infected tobacco leaves. Primer3 software1 was used to design specific forward (F) and reverse (R) primers for RT-qPCR amplification of a 127-nt product from the coat protein (CP) encoding region of PVY (F-primer PVY-CP-QPCR-F1, 5′-ACACCAGTGAGGGCTAGRGA-3′; R-primer PVY-CP-QPCR-R, 5′-GTGGTGTGCCTCTCTGTGTT-3′) and a 138-nt product from the CP-encoding region of PVA (F-primer PVA-CP-QPCR-F, 5′-TCGCAGAGGCGTACATTGAG-3′; R-primer PVA-CP-QPCR-R, 5′-CTGATCGGAGTGGTTGCAGT-3′).
Quantitative PCR was carried out using LightCycler 480 SYBR Green I Master Mix (Roche, Basel, Switzerland) and a LightCycler 480 Instrument (Roche) in a 384-well microtiter plate format. Each well in the plate contained 1× SYBR Green I Master Mix with 0.45 pmol of forward and reverse primers and 5 μl (50 ng) of cDNA, in a total volume of 15 μl. The polymerase chain reaction (PCR) program consisted of a pre-incubation step at 95°C for 5 min, followed by 45 cycles of 10 s at 95°C, 10 s at 60°C, and 10 s at 72°C. Production of a single product only by each primer pair was evidenced by melting curve analysis at the end of the program.
For qPCR, the PVY cDNA synthesized from RNA extracted from PVY particles was diluted to 50, 5.0, 0.5, 0.05, or 0.005 ng of cDNA in the reaction. Similarly, 12.5, 1.25, 0.125, 0.0125, or 0.00125 ng of PVA cDNA was included in the qPCR reactions. Cq-values were used to draw a standard curve that was used together with the Cq-values obtained from the PVY- or PVA-infected tobacco leaves to estimate the concentration of viral RNA in tobacco leaves.
For sRNA deep sequencing, different amounts of viral RNA (PVY, PVA-RFP, PVA-GFP, or PVA-GUS) were added to the four RNA pools, each of which contained a total RNA mixture from the leaves of strawberry, raspberry, and Ribes spp. These pools contained 3 μg total RNA in a volume of 15 μl. We thus analyzed four different concentrations of PVY and 12 different concentrations of PVA (1.0–0.000001 ng in 3 μg) (Table 1).
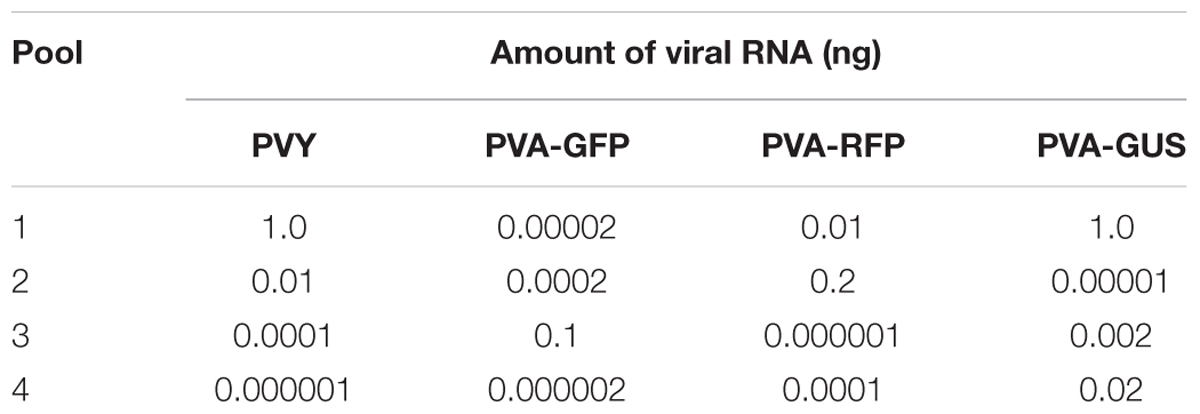
TABLE 1. Composition of the RNA pools (3 μg) subjected to sRNA deep sequencing.
RNA samples sequenced in the laboratory of Fasteris SA (Plan-les-Ouates, Switzerland) were analyzed for RNA concentration with the Qubit RNA assay (Invitrogen) and for integrity with the Agilent Bioanalyzer 2100 Total RNA Nano Assay (Agilent Technologies, Santa Clara, CA, United States). sRNAs shorter than 30 nt were isolated from the gel following acrylamide gel electrophoresis. Libraries for sequencing were prepared using the TruSeq small RNA kit (Illumina, San Diego, CA, United States). Sequencing was carried out with an Illumina HiSeq 2500 instrument using the 50-bp single-end mode. RNA sequences (i.e., reads) were sorted to files based on their size after base-calling and trimming of the adapter sequences and were subjected to further analysis. Data were deposited to the European nucleotide archive (ENA), Accession No. ERP1080512.
Detection sensitivity achieved by sRNA deep sequencing as compared with RT-RT-PCR was compared using an RT-RT-PCR -test commercially available from Fera Science, Ltd. (York, United Kingdom) (Boonham et al., 2008) in the plant analysis laboratory unit of the Finnish Food Safety Authority Evira. Because the PCR primers in Fera’s method are designed for detection of PVY or PVA, it was not possible to distinguish the three infectious PVA clones (PVA-GFP, PVA-RFP, and PVA-GUS) included in the pools. Therefore, RNA extracted from leaves of the tobacco plants, each infected with one of the three PVA constructs, was separately diluted to four different concentrations (Table 1). For PVY, aliquots of the original pools sent for sequencing were tested by RT-RT-PCR (Table 1). All RNA samples hence prepared were transferred to test tubes containing 3 μg of a mixture of total RNA extracted from leaves of strawberry, raspberry and Ribes spp. in a total volume of 15 μl. This was done to mimic the total RNA concentrations used in sRNA sequencing. All the thus generated 16 samples were tested by RT-RT-PCR in duplicate using 50 ng of RNA. The experiment was carried out three times starting from the dilution of RNA.
Bioinformatics
Velvet software was used to produce contiguous sequences (contigs) from the reads of 21–24 nt (Zerbino and Birney, 2008). The k-mer values 13, 15, and 17 were tested for assembly of contigs. The length cut-off values (COVs) that determined whether the contigs would be analyzed further were 30, 50, and 100 nt. Subsequently, contigs assembled using k-mer values 13–25 were post-assembled into larger contigs using AssemblyAssembler3.
Homologous sequences were sought in the National Center for Biotechnology Information (NCBI) database using BLASTn (nucleotide blast). The contigs corresponding to the reference sequences were identified by alignment with the GFP-encoding (741 nt; NCBI Accession No. 13928062), RFP-encoding (678 nt; Accession No. 125976381) or GUS-encoding (1812 nt; Accession No. S69414.1) sequence and the sequence of PVY (9701 nt; Accession No. X97895.1) using BLASTn.
The mapping analysis of sequence data was carried out with Novoalign software (Novocraft Technologies, Malaysia). All obtained 21- to 24-nt reads were analyzed against the reference sequences.
Results
The amounts of RNA from PVY and the three engineered clones of PVA, PVA-GFP, PVA-RFP, and PVA-GUS, in the uppermost fully expanded leaves of the infected tobacco plants were 15.08, 0.86, 2.20, and 11.12 ng per 1 μg of total RNA, respectively, as determined by RT-qPCR. Based on this knowledge, different amounts of RNA were added to the RNA pools (Table 1) and subjected to deep sequencing.
Analysis of the RNA pools with the Bioanalyzer assay at Fasteris SA indicated that the quality of the RNA was good enough for sRNA sequencing [RNA integrity number (RIN) values 4.6–5.8]. RNA concentrations in the pools measured with Qubit at Fasteris SA (Table 2) differed from the expected concentration of 200 ng/μl, which was originally based on the Nanodrop measurements. Sequencing by Illumina was successful, as indicated by a mean quality score > 38 in each pool. Over 97% of the reads had quality scores > 30 as determined by Illumina. The total number of reads per pool was 14–21 million (Table 2). Most reads were 21–24 nt (Table 3), but reads of up to 44 nt were also detected as a result of imperfect size selection by acrylamide gel electrophoresis and subsequent purification of the sRNAs.
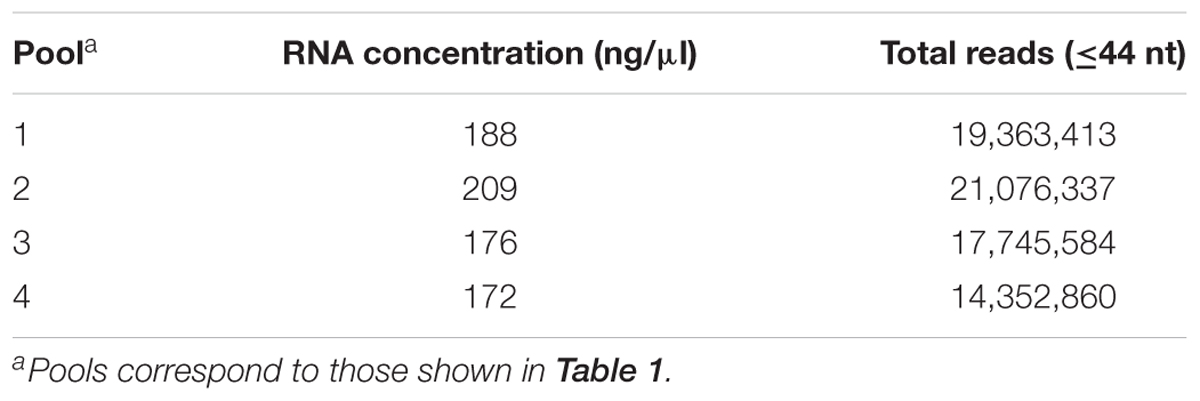
TABLE 2. Concentration of RNA in pools of samples measured by Qubit, and the total number of reads obtained by sRNA deep sequencing.
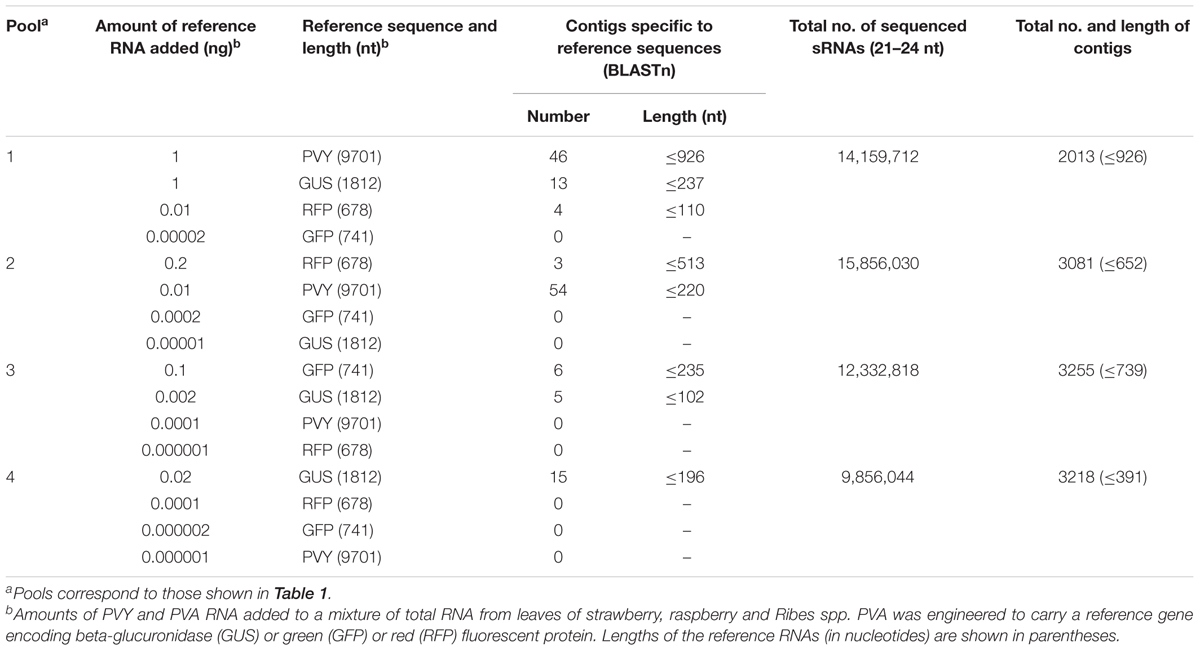
TABLE 3. Number of contigs assembled from sRNAs by Velvet (k-mer = 15, COV = 50 nt) and identified as the references sequences by BLASTn in four pools of samples.
Contigs were built with Velvet using 21- to 24-nt reads. The k-mer values 13, 15, and 17 and COVs at 30, 50, and 100 nt were tested. The highest numbers of contigs homologous to PVY or to the reference sequences inserted into the genome of PVA were obtained using the k-mer value 15 and a COV of 50 nt (Table 3). Using a COV of 100 nt led to the loss of shorter contigs specific to the reference sequences, whereas a COV of 30 nt produced short contigs that were not homologous to the reference sequences (data not shown).
PVY was detected by Velvet-based de novo analysis in the RNA pools amended with total RNA of tobacco containing 1 or 0.01 ng of PVY RNA (Table 3). However, no PVY-specific contigs were obtained from the pools containing 0.001 or 0.000001 ng PVY RNA.
Potato virus A genomes, each carrying a different reference sequence encoding GUS, GFP or RFP, were distinguished by the reference sequence-specific contigs obtained by Velvet-based de novo analysis of sRNA reads. GUS-specific contigs were obtained from the pools containing 1, 0.02, or 0.002 ng of PVA-GUS RNA. GFP was detected in the pool containing 0.1 ng PVA-GFP RNA, but not in the three other pools containing 500–50,000 times less PVA-GFP RNA. RFP-specific contigs were obtained from pools containing 0.2 and 0.01 ng of PVA-RFP RNA (Table 3).
Post-assembly analysis of the data with AssemblyAssembler was carried out using a wider range of k-mers (13–25 nt). Results were essentially similar to those obtained with Velvet alone, but contigs were longer in some cases when AssemblyAssembler was used.
All sequenced 21- to 24-nt reads were aligned with the reference sequences using Novoalign to determine the relationship between the amount of virus and the number of reads aligned to the reference sequences. Because the reference sequences varied in length and the total number of reads varied between the sample pools, the results were normalized among the four pools by calculating the number of reads aligned per 1000 nt of the reference sequence and per 1 million total reads. The number of reads that aligned to the reference sequences decreased with diminishing amounts of viral RNA (Figure 1).
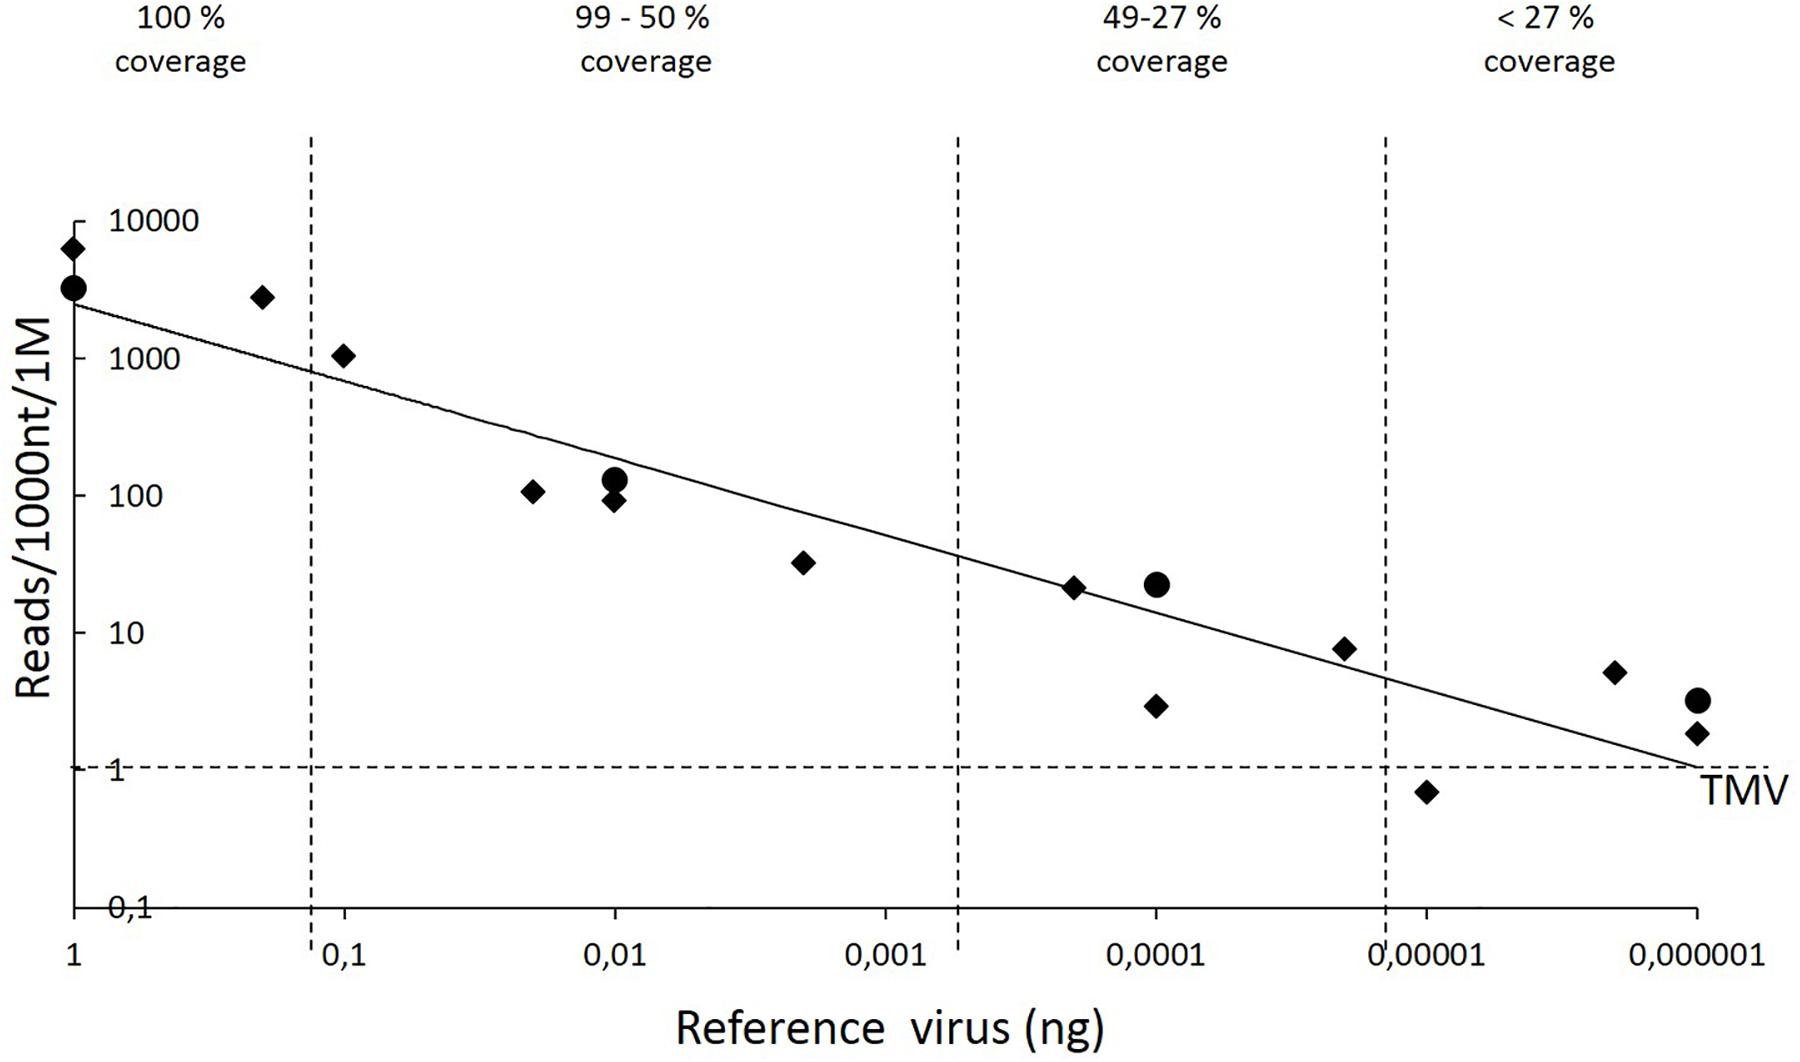
FIGURE 1. Reference sequence–guided analysis of the obtained 21- to 24-nt reads. The descending trend line (y = 2486.1 × 0.5616; correlation coefficient, 0.8927) illustrates the correlation between the number of aligned reads and the amount of viral RNA. Novoalign software was used to align the sRNA reads to the reference sequences. The y axis shows the number of reads that aligned per 1000 nt of the reference sequence per 1 million (1 M) total reads, i.e., genomic sequence of PVY or the marker gene sequences GFP, GUS, and RFP, each carried by a different copy of the PVA genome. The x axis indicates the amount of PVY or PVA genomic RNA. The sequenced RNA pool of 15 μl also contained 3 μg of total RNA obtained by mixing RNA from strawberry, raspberry, and Ribes spp. Quadrilaterals refer to PVY, whereas circles refer to the three reference sequences carried by PVA. Both axes are in a logarithmic scale. The vertical dashed lines were included to visualize how diminishing amounts of viral RNA reduce the coverage of reference sequences by sRNA reads and hence limit the possibility of detecting viruses. The horizontal dashed line indicates the background noise caused by alignment of a few reads to the sequence of Tobacco mosaic virus (TMV), which was not included in the samples.
Aligning the 21- to 24-nt reads from each pool to the genome of Tobacco mosaic virus (TMV; NCBI Accession No. JX993906.1 – not present in the samples) revealed that, on average, only one read was perfectly aligned per 1000 nt of the TMV genome per 1 million total reads. Similar results were observed in all pools, indicating that only a low level of background noise was present in the analysis.
Detection of the reference sequences by the Velvet-based de novo analysis required 0.002 ng of viral RNA (pool 3, GUS-encoding sequence, Table 3). Novoalign-based mapping of all the 21- to 24-nt reads from pool 3 to the GUS sequence reached nearly complete coverage (99%), with the mean depth of coverage being 12, i.e., each nucleotide in the reference sequence was covered by 12 reads on average. Smaller amounts of reference sequence-carrying viral RNA (0.00002–0.0002 ng) resulted in coverage of ca.25–50% of the reference sequence, whereas lower amounts of viral RNA (≤0.00001 ng) resulted in only sporadic read alignments to the corresponding reference sequence; however, the depth of coverage in those few positions was high in some cases.
The standard RT-RT-PCR method (“Fera’s method”) used in the plant analysis laboratory unit of the Finnish Food Safety Authority Evira detected PVA and PVY in the pools containing ≥0.0002 ng of PVA RNA and ≥0.0001 ng of PVY RNA in 3 μg of total RNA, combined from miscellaneous plants, in a volume of 15 μl. The average Cq-values were 34.63 and 34.59 for the pools containing 0.0002 ng of PVA and 0.0001 ng of PVY RNA, respectively, which corresponds to 3.0 and 1.5 fg of viral RNA, respectively, in 50 ng of total RNA used for an RT-RT-PCR reaction. No amplification products were obtained when the RNA pools were tested by RT-RT-PCR without adding any PVY or PVA RNA (data not shown).
Discussion
There is increased interest in applying sRNA-based approaches to virus detection, as well as to official plant inspection. The aim of this study was to estimate sensitivity of the sRNA-based method, as compared with the established RT-RT-PCR approach. The question was addressed using two globally distributed, aphid-transmitted potyviruses, PVY and PVA, in the experiments. Three marker genes inserted in an infectious cDNA clone of PVA allowed us to distinguish the three engineered PVA clones and treat them as ‘strains’ of PVA. Total RNA from various crop plants was included in the samples to be analyzed by sRNA and RT-RT-PCR, to maintain the overall amount and concentration of RNA as constant as possible across the samples.
In this study, sRNA libraries were prepared from gel-extracted small RNA fractions (<30 nt) obtained from 3 μg of plant total RNA, resulting in 15–20 million reads per sample. Results showed that detection of PVA and PVY by the specified sRNA approach using Velvet-based de novo analysis required a 10-fold higher amount of viral RNA than detection by RT-RT-PCR. sRNA deep sequencing followed by Velvet-based de novo assembly of the reads to contigs ≥ 50 nt required 0.002 ng of viral RNA in 3 μg of total RNA in a volume of 15 μl. The de novo assembly approach is needed when no educated presumption is available about the viruses present. This is an advantage of sRNA-based virus detection, because sRNA-based diagnosis using de novo assembly of the reads can detect all viruses without the need for virus- or virus group-specific primers or probes. Higher amounts of viral sRNA allowed assembly of longer contigs and more reliable virus identification by comparison to the sequences available in databases such as NCBI.
In contrast, sRNA-based virus detection was 10 times more sensitive than RT-RT-PCR when knowledge was available about the viruses likely present in the samples. In this case, sRNA reads were mapped to the existing reference sequences suspected in the samples using the Novoalign software. Hence, as little as 0.00002–0.0002 ng of PVY or PVA RNA was sufficient to cover ca. 25–50% of the reference sequence with virus-derived sRNA reads. This coverage, albeit not complete, was high enough to conclude the presence of PVA and PVY. Higher amounts of viral RNA resulted in nearly full to complete coverage of the reference sequences. The RT-RT-PCR method used in the plant analysis laboratory unit of the Finnish Food Safety Authority Evira detected PVA and PVY in the pools containing ≥0.0002 and ≥0.0001 ng of PVY and PVA RNA, respectively. Hence, in this case sRNA-based diagnosis reached a similarly high sensitivity relative to RT-RT-PCR in the detection of the viruses.
Taken together, deep sequencing using the specific conditions described in this study and subsequent de novo analysis required the equivalent of 30 fg of viral RNA in 50 ng of total RNA per PCR reaction for detection of the viruses. However, with prior knowledge about the possible viruses present in the samples, detection sensitivity reached the level of 0.3 fg of viral RNA in 50 ng of total RNA per PCR reaction. The detection limit for PVY and PVA by RT-qPCR in this study was 3 and 1.5 fg of viral RNA, respectively, in 50 ng of total RNA per PCR reaction.
It is worth noting that the sensitivity of sRNA deep sequencing for virus detection can be adjusted during the process of sample preparation for sequencing and by depth of sequencing. For example, starting the library preparation from total RNA without gel-based or column-based separation of the sRNA fraction could diminish the sensitivity, because unwanted RNA remains in the library. Size selection can also be conducted using ready-made libraries. Deeper sequencing, i.e., obtaining more reads per sample, is expected to increase the sensitivity of virus detection but will also increase the cost of the analysis.
Recent studies have compared sRNA-based virus diagnostics with sequencing of long viral RNAs (RNAseq) as two alternative approaches for virus detection based on next-generation sequencing. Both methods are also able to detect previously unknown viruses (Pecman et al., 2017; Zheng et al., 2017; and references therein). Those authors concluded that all plant viruses are detectable using both methods. The costs of sRNA-based diagnosis may be slightly lower, but more user-friendly bioinformatics tools designed for the purpose of sRNA data analysis would be appreciated for routine use of the method in diagnostic labs that must analyze vast numbers of samples in a limited time.
Author Contributions
JS made experimental design and carried out laboratory experiments. JS and JV interpreted the data and wrote the manuscript.
Funding
This study was supported financially by a grant (Dnro 2221/03.01.02/2015) to JV from the Ministry of Agriculture and Forestry, Finland.
Conflict of Interest Statement
The authors declare that the research was conducted in the absence of any commercial or financial relationships that could be construed as a potential conflict of interest.
Acknowledgments
We thank Janne Streng (University of Helsinki) for technical assistance, and Jaana Laamanen and Anne Lemmetty [Natural Resources Institute of Finland (LUKE)] for the samples of berry plants.
Footnotes
- ^ https://academic.oup.com/nar/article/40/15/e115/1223759
- ^ www.ebi.uk/ena
- ^ https://github.com/dzerbino/velvet/tree/master/contrib/AssemblyAssembler1.3
References
Bi, Y., Tugume, A. K., and Valkonen, J. P. (2012). Small-RNA deep sequencing reveals Arctium tomentosum as a natural host of Alstroemeria virus X and a new putative emaravirus. PLoS One 7:e42758. doi: 10.1371/journal.pone.0042758
Boonham, N., Laurenson, L., Weekes, R., and Mumford, R. (2008). Direct detection of plant viruses in potato tubers using real-time PCR. Methods Mol. Biol. 508, 249–258. doi: 10.1007/978-1-59745-062-1_19
Bukovinszki, A., Gotz, R., Johansen, E., Maiss, E., and Balazs, E. (2007). The role of the coat protein region in symptom formation on Physalis floridana varies between PVY strains. Virus Res. 27, 122–125. doi: 10.1016/j.virusres.2007.03.023
Caldo, R. A., Nettleton, D., and Wise, R. P. (2004). Interaction-dependent gene expression in Mla-specific response to barley powdery mildew. Plant Cell 16, 2514–2528. doi: 10.1105/tpc.104.023382
Ding, S. W., and Voinnet, O. (2007). Antiviral immunity directed by small RNAs. Cell 130, 413–426. doi: 10.1016/j.cell.2007.07.039
Gutiérrez-Aguirre, I., Mehle, N., Delić, D., Gruden, K., Mumford, R., and Ravnikar, M. (2009). Real-time quantitative PCR based sensitive detection and genotype discrimination of Pepino mosaic virus. J. Virol. Methods 162, 46–55. doi: 10.1016/j.jviromet.2009.07.008
Haikonen, T., Rajamäki, M. L., and Valkonen, J. P. (2013). Interaction of the microtubule-associated host protein HIP2 with viral helper component proteinase is important in infection with Potato virus A. Mol. Plant Microbe Interact. 26, 734–744. doi: 10.1094/MPMI-01-13-0023-R
Jones, S., Baizan-Edge, A., MacFarlane, S., and Torrance, L. (2017). Viral diagnostics in plants using next generation sequencing: computational analysis in practice. Front. Plant Sci. 8:1770. doi: 10.3389/fpls.2017.01770
Kashif, M., Pietilä, S., Artola, K., Jones, R. A. C., Tugume, A. K., Mäkinen, V., et al. (2012). Detection of viruses in sweetpotato from Honduras and Guatemala augmented by deep-sequencing of small-RNAs. Plant Dis. 96, 1430–1437. doi: 10.1094/PDIS-03-12-0268-RE
Kelloniemi, J., Mäkinen, K., and Valkonen, J. P. (2008). Three heterologous proteins simultaneously expressed from a chimeric potyvirus: infectivity, stability and the correlation of genome and virion lengths. Virus Res. 135, 282–291. doi: 10.1016/j.virusres.2008.04.006
Kreuze, J., Perez, A., Untiveros, M., Quispe, D., Fuentes, S., Barker, I., et al. (2009). Complete viral genome sequence and discovery of novel viruses by deep-sequencing of small RNAs: a generic method for diagnosis, discovery and sequence of viruses. Virology 388, 1–7. doi: 10.1016/j.virol.2009.03.024
Kurokura, T., Inaba, Y., and Sugiyama, N. (2006). Histone H4 gene expression and morphological changes on shoot apices of strawberry (Fragaria × ananassa Duch.) during floral induction. Sci. Hortic. 110, 192–197. doi: 10.1016/j.scienta.2006.07.013
Massart, S., Candresse, T., Gil, J., Lacomme, C., Predajna, L., Ravnikar, M., et al. (2017). A framework for the evaluation of biosecurity, commercial, regulatory and scientific impacts of plant viruses and viroids identified by NGS technologies. Front. Microbiol. 8:45. doi: 10.3389/fmicb.2017.00045
Mirmajlessi, S. M., Loit, E., Mänd, M., and Mansouripour, S. M. (2015). Real-time PCR applied to study on plant pathogens: potential applications in diagnosis - a review. Plant Prot. Sci. 51, 177–190. doi: 10.17221/104/2014-PPS
Moon, J. Y., and Park, J. M. (2016). Cross-talk in viral defense signaling in plants. Front. Microbiol. 7:2068. doi: 10.3389/fmicb.2016.02068
Pecman, A., Kuntjak, D., Gutiérrez-Aquirre, I., Adams, I., Fox, A., Boonham, N., et al. (2017). Next generation sequencing for detection and discovery of viruses and viroids: comparison of two approaches. Front. Microbiol. 8:1998. doi: 10.3389/fmicb.2017.01998
Rajamäki, M. L., Kelloniemi, J., Alminaite, A., Kekarainen, T., Rabenstein, F., and Valkonen, J. P. (2005). A novel insertion site inside the potyvirus P1 cistron allows expression of heterologous proteins and suggests some P1 functions. Virology 342, 88–101. doi: 10.1016/j.virol.2005.07.019
Roberts, C. A., Dietzgen, R. G., Heelan, L. A., and Maclean, D. J. (2000). Real-time RT-PCR fluorescent detection of tomato spotted wilt virus. J. Virol. Methods 88, 1–8. doi: 10.1016/S0166-0934(00)00156-7
Rowhani, A., Maningas, M. A., Lile, L. S., Daubert, S. D., and Golino, D. A. (1995). Development of a detection system for viruses of woody-plants based on PCR analysis of immobilized virions. Phytopathology 85, 347–352. doi: 10.1094/Phyto-85-347
Sikorskaite, S., Vuorinen, A. L., Rajamäki, M. L., Nieminen, A., Gaba, V., and Valkonen, J. P. (2010). HandyGun: an improved custom-designed, non-vacuum gene gun suitable for virus inoculation. J. Virol. Methods 165, 320–324. doi: 10.1016/j.jviromet.2010.02.025
Valkonen, J. P., Pehu, E., Jones, M. G., and Gibson, R. W. (1991). Resistance in Solanum brevidens to both potato virus Y and potato virus X may be associated with slow cell to cell spread. J. Gen. Virol. 72, 231–236. doi: 10.1099/0022-1317-72-2-231
Zaitlin, M., and Palukaitis, P. (2000). Advances in understanding plant viruses and virus diseases. Annu. Rev. Phytopathol. 38, 117–143. doi: 10.1146/annurev.phyto.38.1.117
Zerbino, D. R., and Birney, E. (2008). Velvet: algorithms for de novo short read assembly using de Bruijn graphs. Genome Res. 18, 821–829. doi: 10.1101/gr.074492.107
Keywords: plant virus, diagnostics, small RNA, siRNA, detection threshold, VirusDetect, qPCR
Citation: Santala J and Valkonen JPT (2018) Sensitivity of Small RNA-Based Detection of Plant Viruses. Front. Microbiol. 9:939. doi: 10.3389/fmicb.2018.00939
Received: 19 March 2018; Accepted: 23 April 2018;
Published: 14 May 2018.
Edited by:
John P. Carr, University of Cambridge, United KingdomReviewed by:
Neil Boonham, University of Newcastle, AustraliaFrancis Wamonje, Sokoine University of Agriculture, Tanzania
Copyright © 2018 Santala and Valkonen. This is an open-access article distributed under the terms of the Creative Commons Attribution License (CC BY). The use, distribution or reproduction in other forums is permitted, provided the original author(s) and the copyright owner are credited and that the original publication in this journal is cited, in accordance with accepted academic practice. No use, distribution or reproduction is permitted which does not comply with these terms.
*Correspondence: Johanna Santala, johanna.santala@evira.fi Jari P. T. Valkonen, jari.valkonen@helsinki.fi