 Caijiao Wei
 Mei Li
 Xihong Zhao
- Research Center for Environmental Ecology and Engineering, Key Laboratory for Green Chemical Process of Ministry of Education, Key Laboratory for Hubei Novel Reactor & Green Chemical Technology, School of Environmental Ecology and Biological Engineering, Wuhan Institute of Technology, Wuhan, China
Rapid and sensitive methods have been developed to detect foodborne pathogens, a development that is important for food safety. The aim of this study is to explore Surface-enhanced Raman scattering (SERS) with silver nano substrates to detect and identify the following three foodborne pathogens: Escherichia coli O157: H7, Staphylococcus aureus and Salmonella. All the cells were resuspended with 10 mL silver colloidal nanoparticles, making a concentration of 107 CFU/mL, and were then exposed to 785 nm laser excitation. In this study, the results showed that all the bacteria can be sensitively and reproducibly detected directly by SERS. The distinctive differences can be observed in the SERS spectral data of the three food-borne pathogens, and the silver colloidal nanoparticles can be used as highly sensitive SERS-active substrates. In addition, the assay time required only a few minutes, which indicated that SERS coupled with the silver colloidal nanoparticles is a promising method for the detection and characterization of food-borne pathogens. At the same time, principle component analysis (PCA) and hierarchical cluster analysis (HCA) made the different bacterial strains clearly differentiated based on the barcode spectral data reduction. Therefore, the SERS methods hold great promise for the detection and identification of food-borne pathogens and even for applications in food safety.
Introduction
For food safety management and monitoring, foodborne pathogens have always been an issue of concern as they can cause severe illness in humans via contaminated water or food (Zhao et al., 2017a). According to the data from the World Health Organization, there are many outbreaks and numerous deaths each year caused by Escherichia coli O157: H7, Staphylococcus aureus, Salmonella, Listeria monocytogenes, Campylobacter jejuni, and so on (Liu et al., 2017). Rapid identification and detection of pathogens are major issues for public health and food safety (Zhao et al., 2014, 2016). To date, the detection of foodborne pathogens mainly includes traditional methods, immunological methods, and molecular biology methods, but they are labor intensive, time consuming and inconvenient for onsite detection (Erik and Anna, 2007; Roda et al., 2012; Zhong and Zhao, 2017, 2018; Wei et al., 2018). It is thus necessary to explore efficient, sensitive, fast, inexpensive and accurate methods to detect and identify pathogens (Zhao et al., 2017b).
Raman spectroscopy is a scattering spectrum discovered by the Indian physicist C.V. Raman (Krishnan, 1928). The spectrum mainly provides fingerprint information of the molecular structure according to vibrational and rotational information of matter. Due to the low intensity of conventional Raman scattering (RS), it has been severely limited in many applications. Meanwhile, Surface-enhanced Raman scattering (SERS) spectroscopy avoids the problems associated with conventional RS. When the target analyte approaches or adsorbs certain rough metal (gold, silver, etc.) nanoparticle surfaces, the signals can be enhanced by many orders of magnitude compared to normal RS (Sivanesan et al., 2014). In addition, this method handles samples easily and provides the basis for non-destructive and ultra-sensitive detection of samples (Wang and Irudayaraj, 2012). SERS, as an ultrasensitive vibrational spectroscopic technique, can detect molecules on or near the surface of plasmonic nanostructures and greatly extends the role of standard RS (Wang et al., 2012). Beyond that, SERS also inherits rich chemical fingerprint information from RS, which can be conveniently made under ambient and aqueous conditions. In particular, it also gains sensitivity by plasmon-enhanced excitation and scattering and has a narrow width that is suitable for multiplex analysis (Zong et al., 2018). Therefore, SERS is rapidly emerging as a sensitive analytical tool and has been applied to many analyses and fields such as chemistry, biochemistry, microbiology, environmental sciences and so on. For example, Betz et al. (2012) detected whether melamine could be found in infant formula without the need for purification or additional equipment by using SERS. Kim et al. (2015) adopted silver nanoparticles as SERS substrates to detect C-reactive protein without using any labels; the minimum detection amounts in the buffer and in 1% serum were 0.01 and 0.1 ng mL-1, respectively. Sivanesan et al. (2014) developed nanostructured silver-gold bimetallic SERS substrates for selective identification of bacteria in human blood. Xu et al. (2015) applied label-free SERS to detect DNA with single-base sensitivity. SERS has the ability to identify single molecules by using their intrinsic vibrational fingerprint and can provide highly specific biochemical information about the components of bacterial cells, including proteins and peptides, polysaccharides, nucleic acids, phospholipids, etc. (Hou et al., 2014; Zheng et al., 2016; Zhao et al., 2018). Because each type of bacteria has its own specific biochemical information and can exhibit its characteristic peaks, this technique can rapidly identify good versus bad bacteria in the field based on its unique Raman fingerprint. Meisel et al. (2014) detected 19 species of the most important harmful bacteria via Raman microspectroscopy and built up a three-level classification model based on the whole amount of Raman data. After the first classifier differentiation of Gram-positive and Gram-negative bacteria by Raman spectra, two decision knots of the bacterial genus and species followed. The study showed that the accuracy of the identification results of each different step was in the range of 90.6–99.5%.
In the SERS study, it is important to bring target analyte or target molecular structure in contact with or in close proximity of the surface of metallic nanostructures (Dong et al., 2014; Huang et al., 2015; Li et al., 2017). For microorganisms and living cells, the colloidal nanoparticles are generally preferred as substrates (Culha et al., 2010). Gold and silver are two commonly used materials for the preparation of nano-metal substrates for SERS measurement. Compared with silver, gold is more expensive but produces weaker SERS enhancement than silver (Fan et al., 2011; Chuang et al., 2014). In addition, nanosilver has the following advantages: a high molar extinction coefficient, excellent optical properties and nanosilver aggregates having strong SERS effects (Wang et al., 2016). Therefore, the silver colloidal nanoparticles (AgNPs) were employed widely for bacteria detection. There are various methods for synthesizing AgNPs, such as reduction reaction methods, ultrasonic assisted reduction methods, electrolytic methods, light induction methods, thermal decomposition methods, microwave methods and so on (Huang et al., 2014). Among these, the microwave methods have the advantages of uniform reaction, easy nucleation and less pollution, and convenient and rapid synthesis; meanwhile, the prepared nanomaterials have high purity and uniform distribution (Du et al., 2015). Thus rapid microwave is an important technique for synthesizing metallic nanostructures. However, simple and green microwave methods for synthesizing highly SERS-active AgNPs have rarely been reported. Herein, the objective of this study is to evaluate the feasibility of adopting the microwave method to synthesize silver colloidal solutions as the SERS-active substrate for the detection and identification of foodborne pathogens.
Materials and Methods
Preparation of the Silver Colloidal Nanoparticles
In this study, the microwave heating method was used to synthesize AgNPs due to the advantages of simple operation, uniform heating, fast heating and fast preparation that it holds over other methods. In brief, 1 × 10⁻³ M of AgNO3 was dissolved in 200 mL double distilled water. An aliquot of 1% sodium citrate solution (10 mL) was added dropwise with continuous stirring to an aqueous silver nitrate solution. The solution was put into a microwave oven at a power of 700 W until a yellow color solution was obtained. The prepared AgNps were characterized by UV-Vis spectrophotometry (UV-1800, Shimadzu Enterprise Management, Ltd., China) under a wavelength range of 300–800 nm. At the same time, the particle size distribution of AgNps was determined by a ZEN3690 Malvern laser particle size analyzer (Malvern Instruments Ltd., United Kingdom). In order to more fully analyze the size, morphology and stability of nanoparticles, the as-synthesized AgNps was characterized by a transmission electron microscope (TEM, model JEOL JEM 1200EX) operated at 200 kV and the zeta potential of AgNps was measured by dynamic light scattering with Zetasizer Nano ZS (Malvern Instruments Ltd., United Kingdom). For TEM, samples were prepared by placing approximately 10 μL of the as-synthesized Ag colloid dispersing in water onto a TEM grid and then drying under an IR lamp.
Preparation of Bacterial Samples
All the strains from the American Type Culture Collection (ATCC, United States) were preserved at -80°C in our laboratory until use, namely Escherichia coli O157:H7 (ATCC 43895), S. aureus (ATCC 27664) and Salmonella (ATCC 13076). Bacterial strains were stored at -80°C in BactoTM Tryptic Soy Broth (TSB; Becton, Dickinson and Co., Sparks, MD, United States) containing 20% glycerol, were inoculated in LB agar plates and incubated at 37°C overnight. Afterward, the pure culture was transferred to BactoTM TSB at 37°C overnight with shaking (110 rpm). The bacterial concentration was about 108 CFU/mL. One milliliter of cell suspension was centrifuged at 6,000 ×g for 5 min and the supernatant was discarded. The cell pellets were washed three times with double distilled water, centrifuged at 6,000 ×g for 5 min and finally resuspended with 10 mL of the silver colloidal nanoparticles or double distilled water. Next, the solution was mixed with a vortex to obtain a mixture that was as homogeneous as possible and then stood for 3–5 min. This procedure was designed to make AgNps and bacteria adsorb each other. Transmission electron microscopy (TEM) measurements were also performed to investigate the distribution of the AgNps coated on the Escherichia coli O157: H7.
SERS Measurement
In order to explore whether the AgNps that were prepared by the microwave heating method as the SERS substrate for detecting foodborne pathogens have an enhanced signal or not, the experiment was carried out as follows. All the Escherichia coli O157: H7, S. aureus and Salmonella samples were transferred to glass capillary tubes and then were detected using a Portable Raman Spectrometer (I0785MM0350MF, Ocean Optics Company, United States). The spectral coverage was from 400 - 2000 cm-1 with a 785 nm excitation light. The laser power was 70 mW and the average scan time was 4 s. Bacteria samples without AgNps were also scanned. All the procedures were carried out in three replicates. The schematic diagram for the SERS detection of foodborne pathogens with AgNPs is shown in Figure 1.
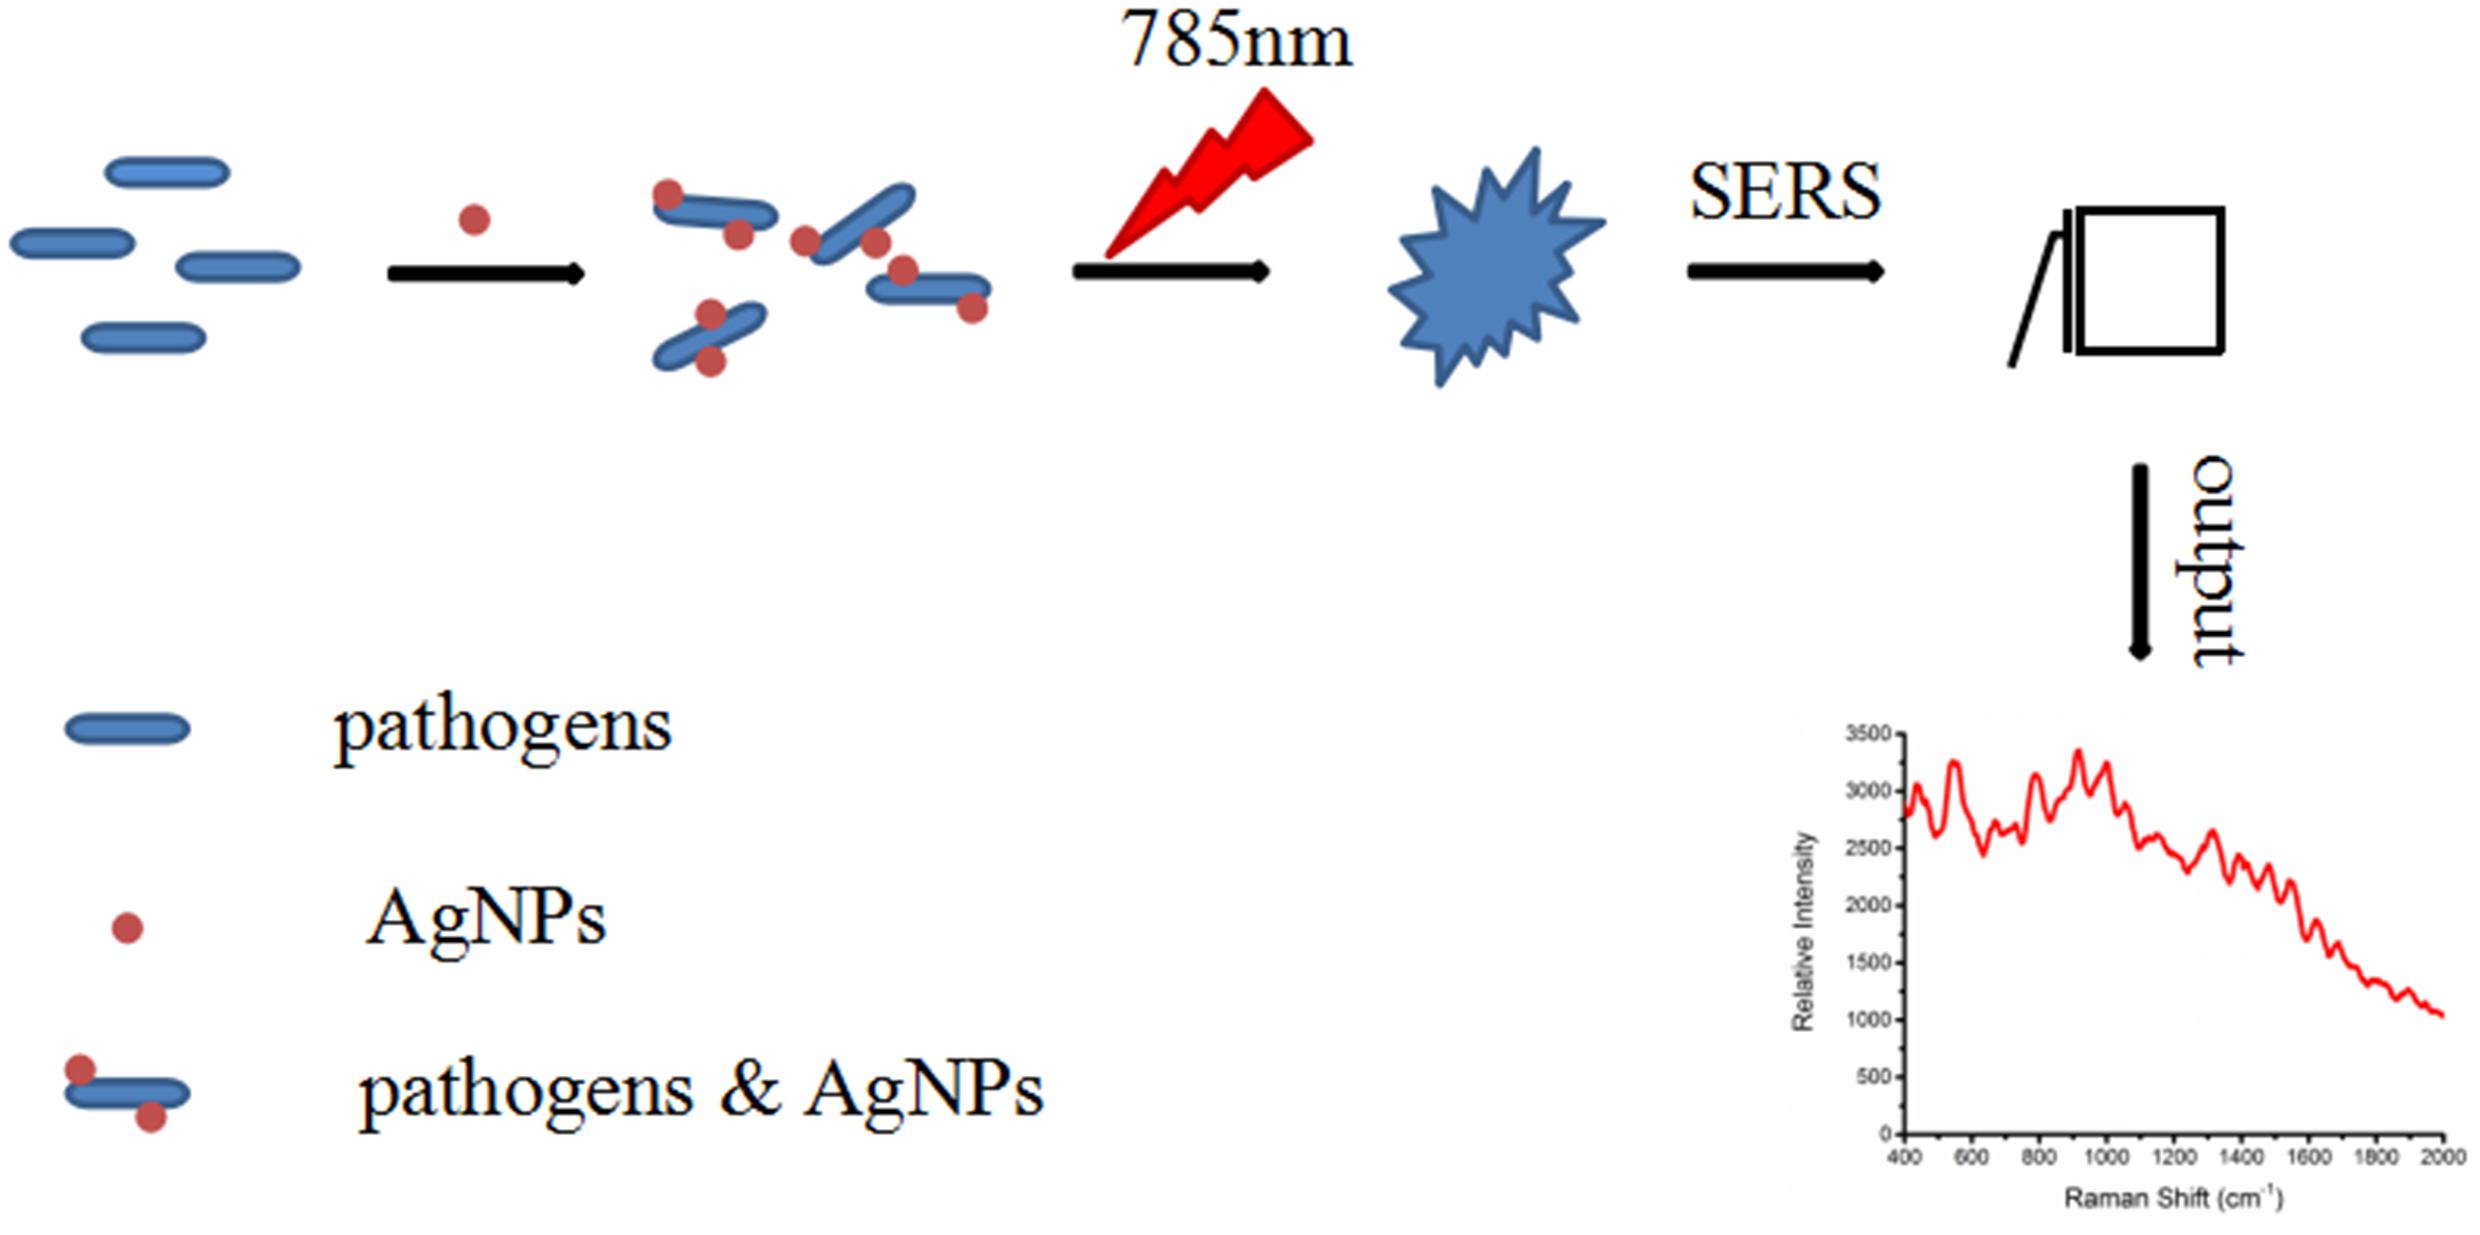
Figure 1. Schematic diagram of the SERS detection of bacteria with the silver colloidal nanoparticles.
Data Analysis
The normal Raman and SERS spectra data were analyzed by Origin software version 9.0 (Origin Lab Corporation, Northampton, MA, United States) and SPSS multivariate data analysis software (version 11.5.0, SPSS Inc., Chicago, IL, United States). The baseline correction helped to determine any difference between spectra quickly (Sundaram et al., 2013), so the pre-processing algorithms were conducted to analyze the data, for instance smoothing, normalization and second-derivative transformation. For purposes of bacterial identification, principal component analysis (PCA) and hierarchical cluster analysis (HCA) were applied in this study. Prior to the two multivariate analyses, all the spectra were smoothed in order to eliminate any high-frequency instrument background noise by averaging near data points and were then normalized to a range of 0 to 1; meanwhile, they were also subjected to second-derivative transformation to separate overlapping bands and remove baseline offsets.
Results and Analysis
Characterization of the AgNps
The size and dispersion of AgNps have a certain effect on SERS detection, so absorption peak and particle size distribution are characterized by UV-Vis spectrophotometry and Malvern laser particle size analyzer, respectively. The characterization of the AgNPs, rapidly synthesized by green microwave technology, can be seen in Figures 2A,B. The UV-Vis spectrum of the AgNps reveals a maximum absorbance of 427 nm as is shown in Figure 2A. TEM and the corresponding size distribution revealed that the green microwave technology-synthesized AgNps have an average diameter of 65 ± 2 nm (Figures 3A, 2B). In the Figures, there are no distinct peaks in the UV-Vis and DLS spectra and no aggregation in TEM images. Thus, it can also be shown that the distribution of AgNps in the solution is relatively uniform and without aggregation. In order to verify the stability of the prepared AgNps, the zeta potential of the as-synthesized Ag colloid dispersing in water was measured three times by dynamic light scattering with Zetasizer Nano ZS. The results were -40.0, -39.3, and -40.5 mV respectively, which indicated that the as-synthesized Ag colloid dispersal in water is evenly distributed and has certain stability. According to relevant literature, the bactericidal properties of the nanoparticles are size-dependent, since the only nanoparticles that present a direct interaction with the bacteria preferentially have a diameter of approximately 1–10 nm (Morones et al., 2005; Shrivastava et al., 2007) However, in our study, the sizes of silver nanoparticles are mostly concentrated at 50–70 nm. Moreover, it takes only a few minutes from the mixing process of nano silver and bacteria to the whole process of detection. Thus, it can be stated that the proteins, purine and cell membrane of bacteria are not affected by AgNPs. Meanwhile, after placing the silver colloidal nanoparticles for 4 h, the solution was still a clear and transparent light yellow with no deposition phenomenon, which also indicates that the silver colloid has good stability. However, in bacterial SERS experiments, whether the SERS effect can generate that depends on whether the bacteria can combine effectively with AgNps. Thus, to understand the formation of the AgNP-bacteria complex, the Escherichia coli O157: H7 coated with silver nanoparticles was performed by TEM. It can be clearly seen from Figure 3B that the AgNPs were successfully and uniformly synthesized around the bacterial cell wall.
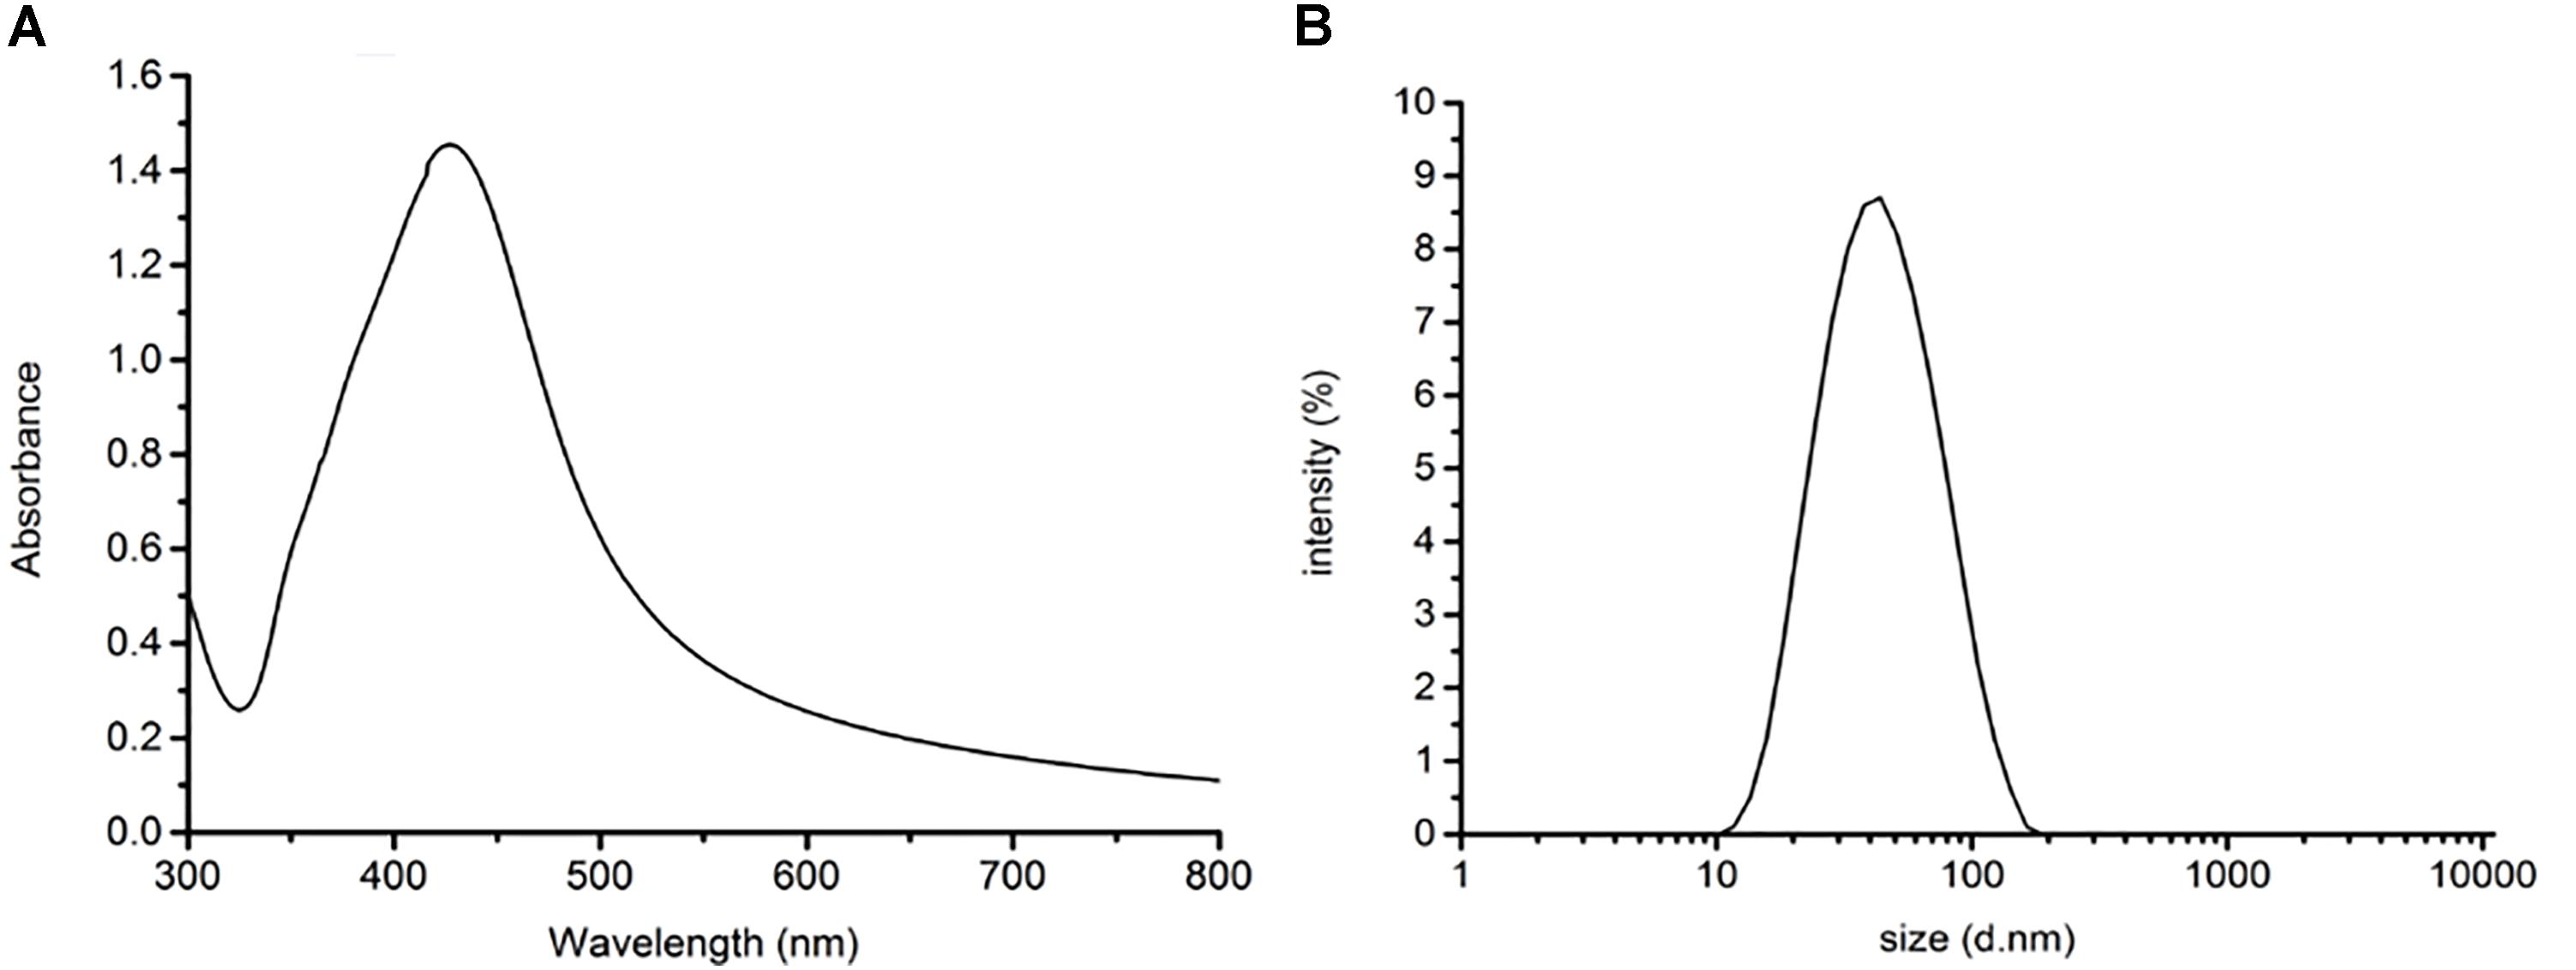
Figure 2. (A) UV-Vis absorption spectrum of AgNPs and (B) diameter distribution of AgNPs.
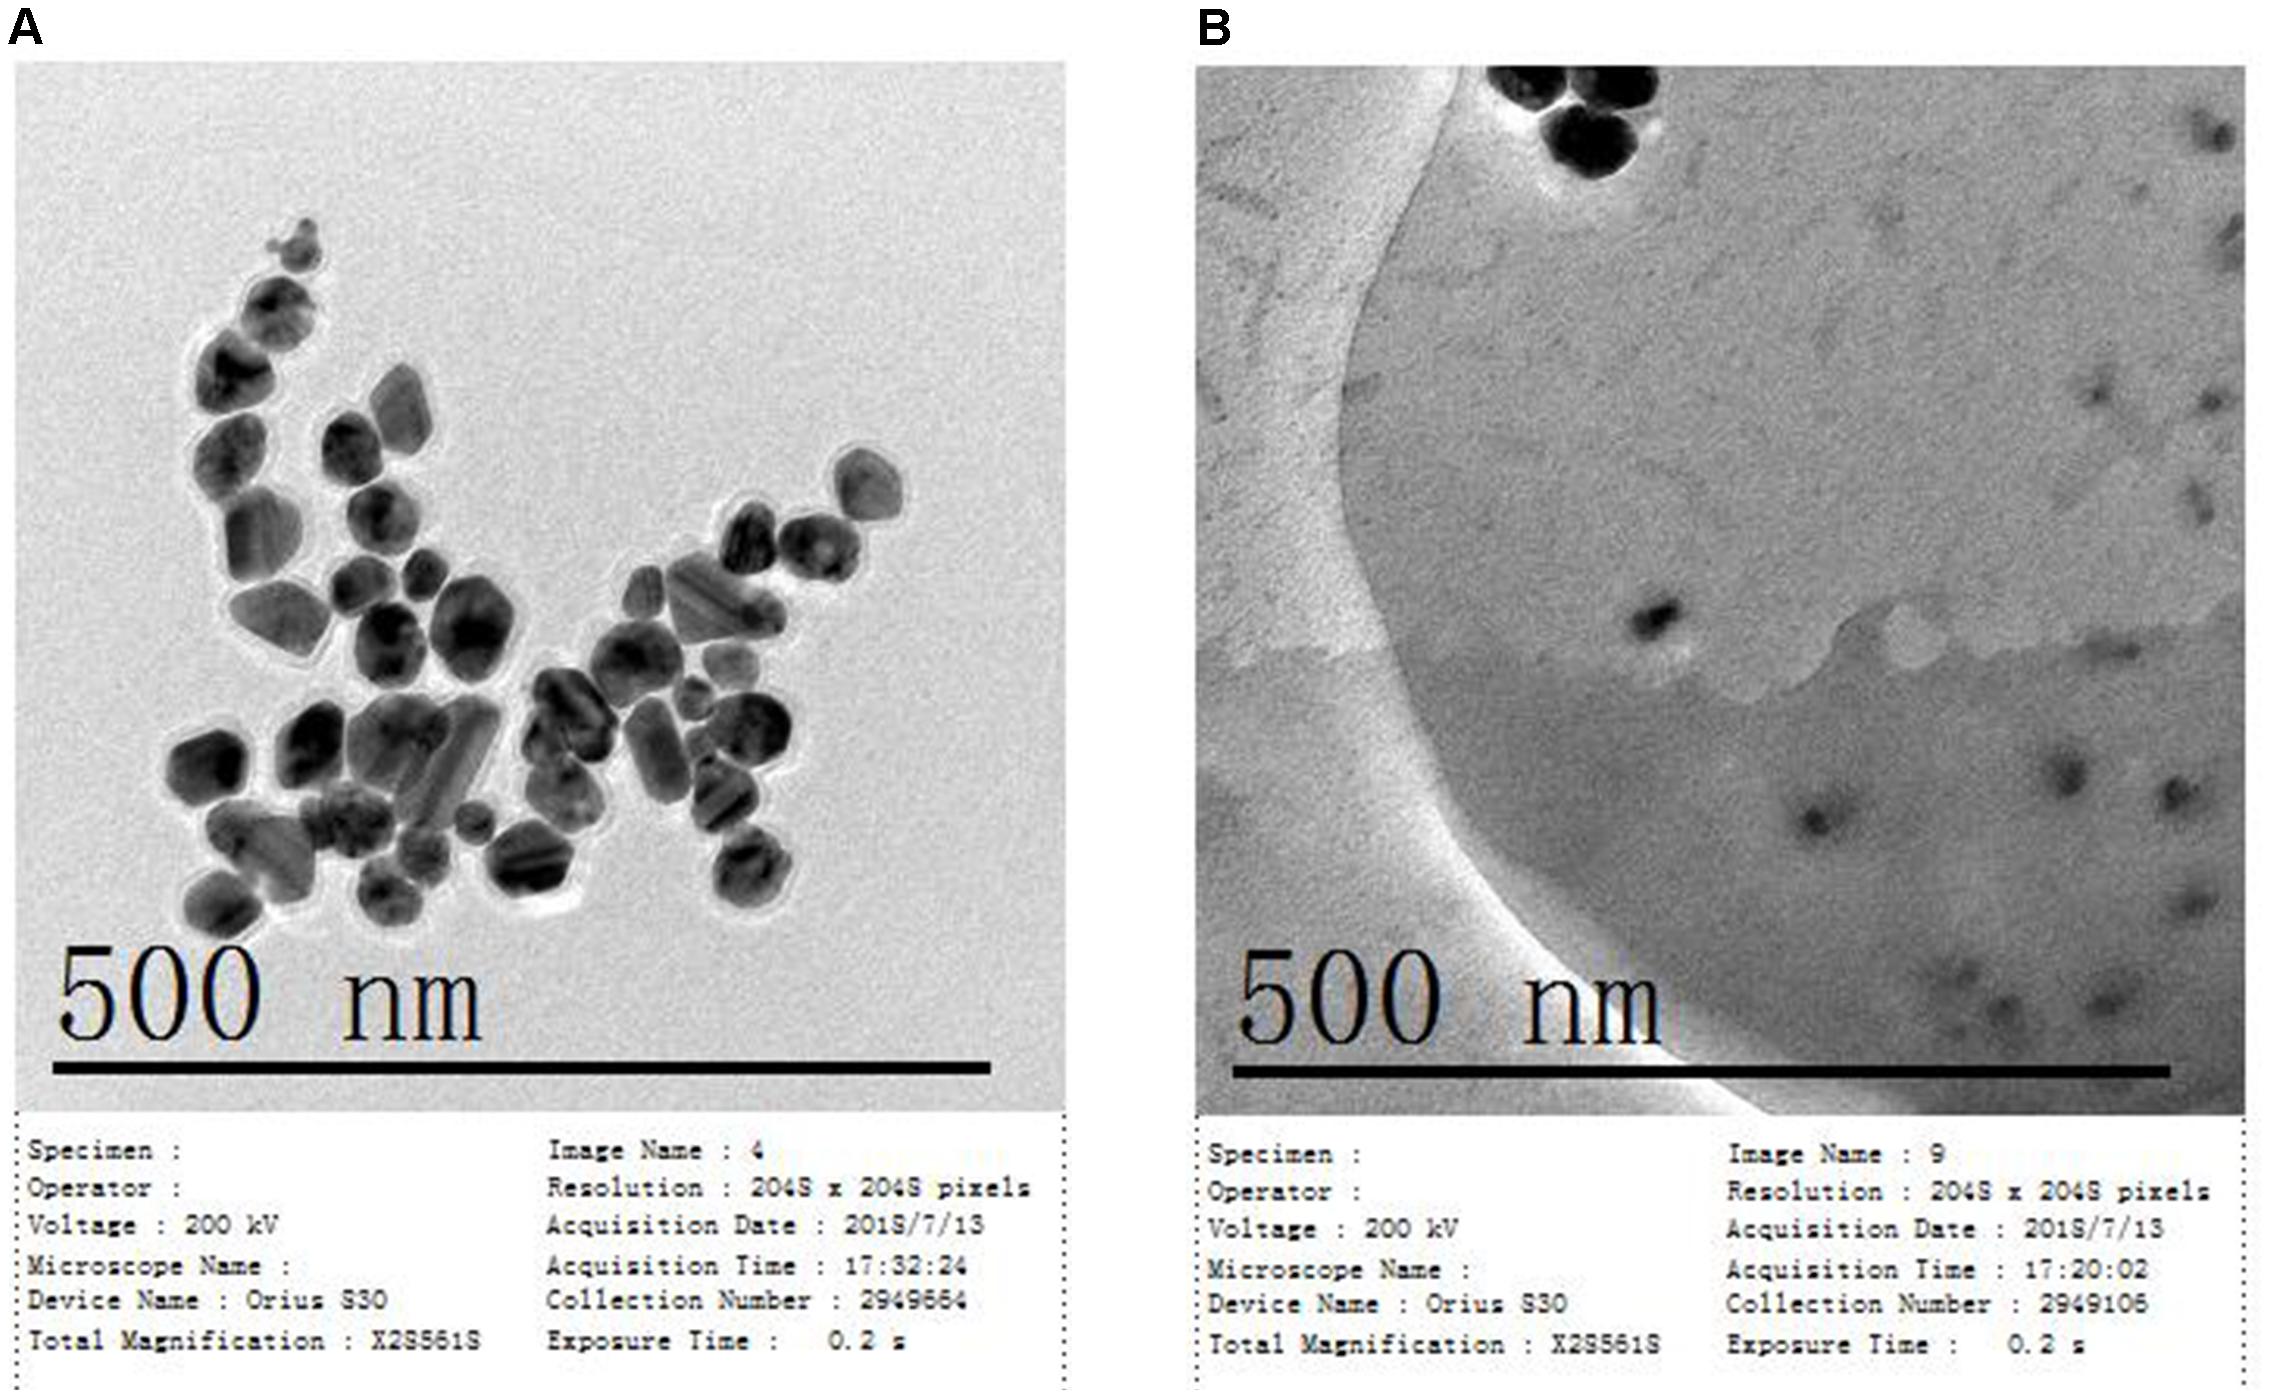
Figure 3. (A) TEM image of synthetic AgNPs and (B) TEM image of Escherichia coli O157: H7 coated with AgNPs.
SERS Spectra of Foodborne Pathogens and Structural Analysis
In order to determine how the AgNps enhance the SERS signal, equal concentrations of bacteria, both with and without AgNps, were tested and SERS spectra were recorded. As shown in Figure 4A, the foodborne pathogens without AgNps did not exhibit obvious Raman signal. However, when Escherichia coli O157: H7, Staphylococcus aureus, and Salmonella were coupled with AgNps, respectively, they exhibited a unique and significant Raman spectral signal (Figure 4B). These spectra were the average spectra obtained from the replicated samples. It is obvious that the SERS effect measured with the bacteria in AgNps is greatly enhanced and has stronger signal intensity than that without AgNps. It also demonstrates that SERS is capable of detecting these three foodborne pathogens with the aid of the silver colloidal nanoparticles. A comparison among the SERS spectra of Escherichia coli O157: H7, S. aureus and Salmonella is shown in Figures 4a–c, respectively. It can be seen from the figure that the bands of Raman vibration characteristic peaks of these three pathogens are mainly between 400 and 1650 cm-1. In order to further understand and distinguish these three different foodborne pathogens, all the characteristic peaks of the SERS signals are collected in Table 1. S. aureus has significant Raman vibrational peaks at 437, 545, 668, 727, 788, 915, 996, 1054, 1151, 1313, 1390, 1480, 1546, and 1621 cm-1. The Escherichia coli O157: H7 SERS spectra exhibit characteristic peaks at 437, 542, 689, 792, 918, 999, 1054, 1108, 1161, 1228, 1304, 1390, 1422, 1474, 1543, and 1621 cm-1. Typical peaks at 437, 545, 668, 727, 788, 915, 996, 1054, 1151, 1313, 1390, 1480, 1546, and 1621 cm-1 are observed in Salmonella. In the detection of microorganisms, Raman can provide phenotypic information on signatures from cell tissues, which are mainly attributed to proteins, lipopolysaccharides, carbohydrates, nucleic acids (DNA and RNA), peptidoglycan, quinones, cytochromes, phospholipids and some endogenous biomolecules (Nelson et al., 1992). It demonstrates the vibrational information from cell structural components. Therefore, specific information can be obtained based on the structures, conformations and attributions represented by these spectra, so that the bacteria can be classified. Peaks at about 550 cm-1 are assigned to S-S stretching in proteins. Peaks at about 670 cm-1 are for the cysteine stretch model present in the protein. Peaks near 690 cm-1 belong to the guanine ring region of DNA/RNA. Peaks at about 730 cm-1 belong to the NAG component in the peptidoglycan structure of the bacterial cell wall (Jarvis and Goodacre, 2004). Peaks around at 918 cm-1 are attributed to the vibration of the nucleic acid and the peaks between 1220 and 1640 cm-1 are mainly attributed to amide I, amide II, amide III vibration and carboxylic acid stretching (Sundaram et al., 2013). The band at ∼1000 cm-1 is assigned to phenylalanine according to the literature (Nelson et al., 1992). The SERS peak at 918 cm-1 is due to C–COO- stretch (carbohydrates). A strong Raman band due to the COO-stretching vibration of proteins is observed at 1390 cm-1. The specific Raman peak assignments are shown in Table 1. Comparing the Raman peaks of Escherichia coli O157: H7, S. aureus and Salmonella, it can be seen that there are both similarities and differences between them. For example, the number of major spectral bands of Escherichia coli O157: H7, S. aureus and Salmonella exhibit clear similarities, such as bands at 1054 and 1621 cm-1, although their relative intensities are different. However, there are also obvious differences. For instance, bands at 542 and 918 cm-1 are significant to Escherichia coli O157: H7 and Salmonella but not in S. aureus, while a band at 668 cm-1 is unique for S. aureus and Salmonella. However, peaks at 689 and 1422 cm-1 are only present in Escherichia coli O157: H7. Peaks at 885, 1256, and 1337 cm-1 are only present in Salmonella. To distinguish the three foodborne pathogens, the ratio of intensities of the peaks and the unique peaks can be used. Therefore, the unique and distinct vibrational spectral information of SERS can be used to identify and discriminate between different foodborne pathogens.
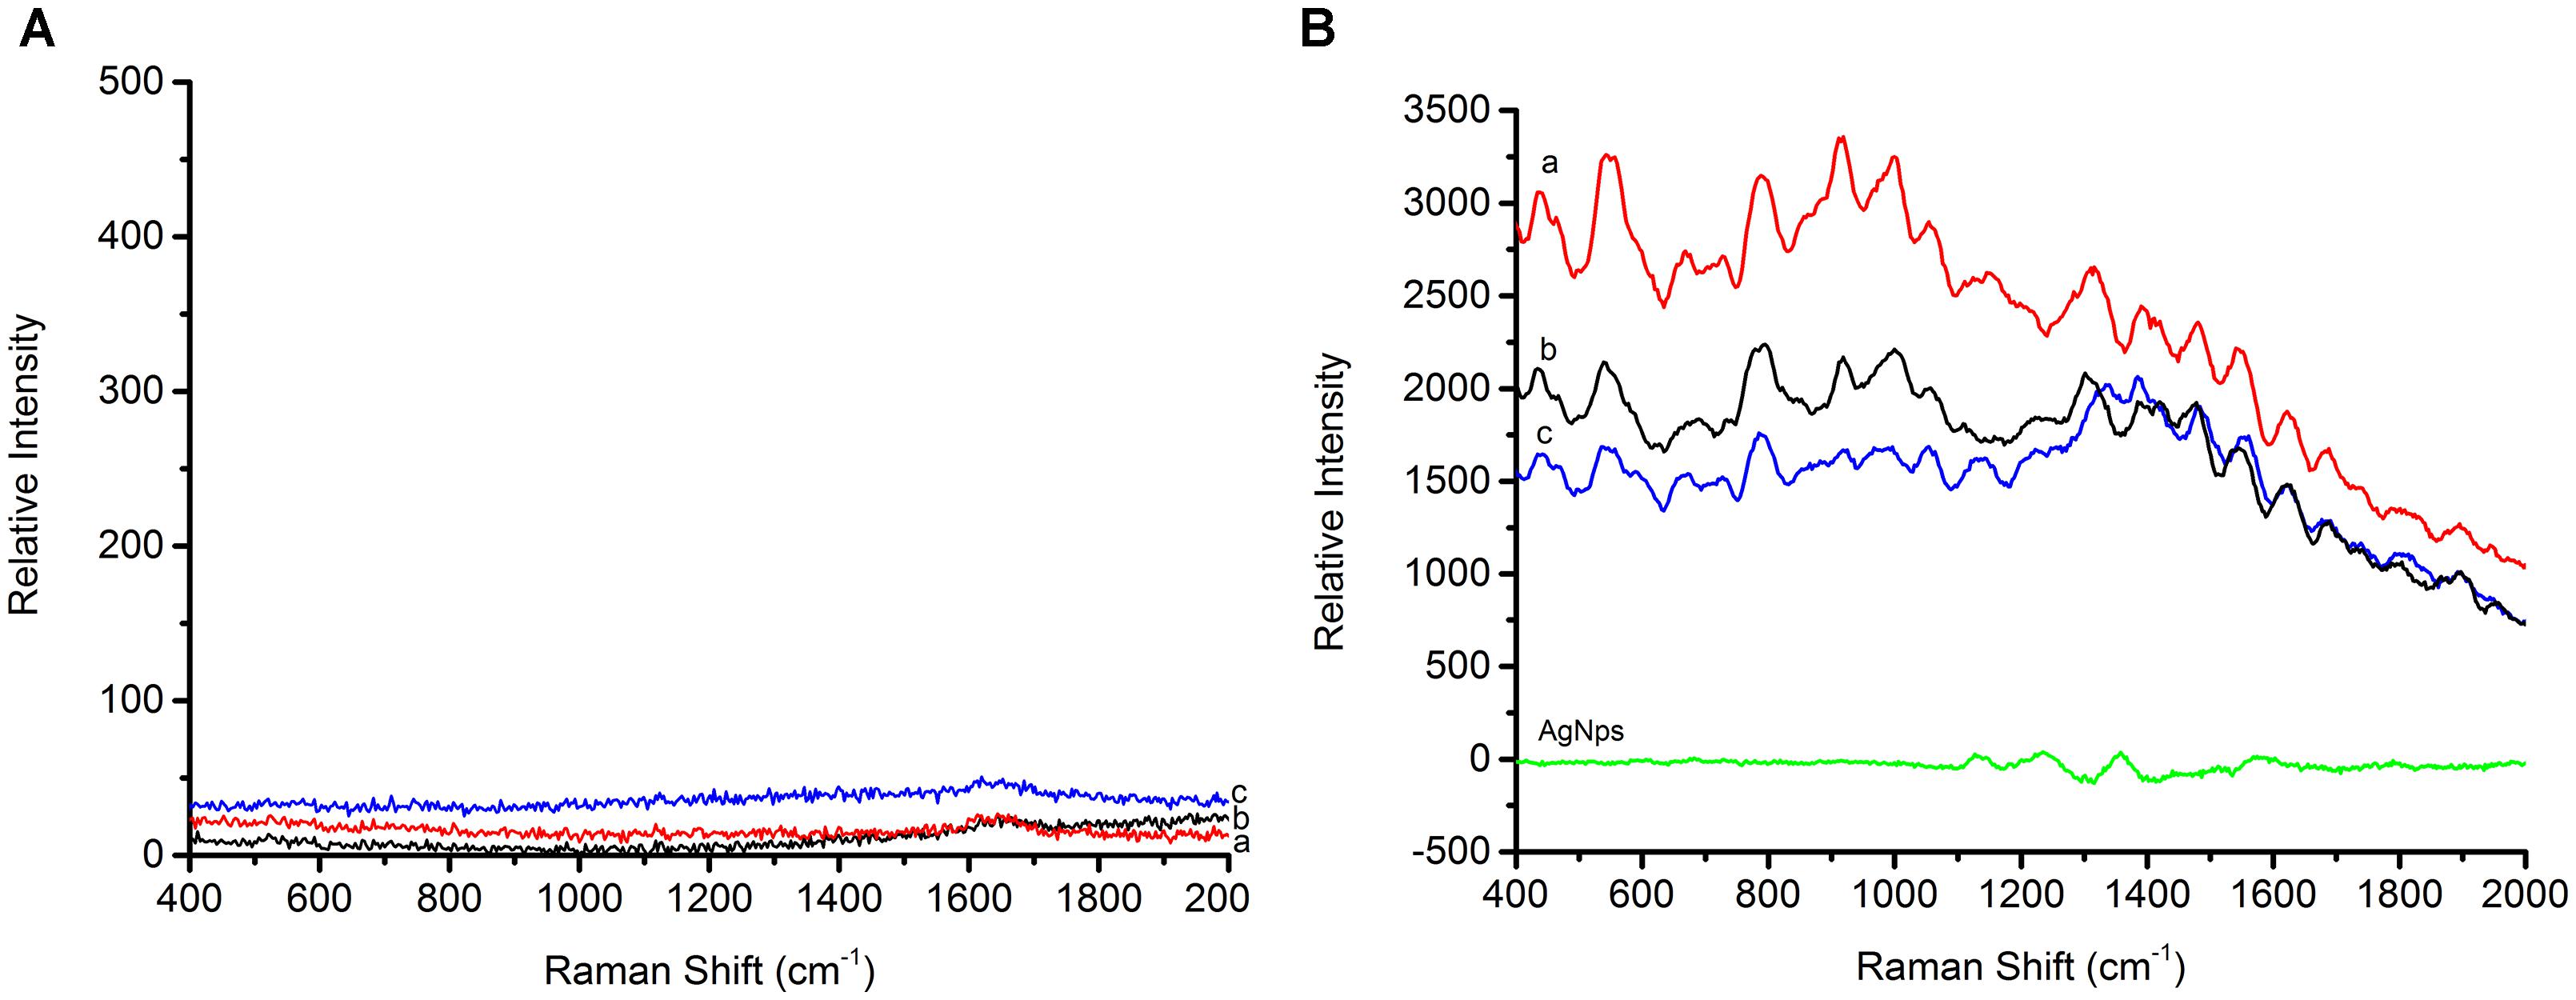
Figure 4. (A) Raman spectra of three foodborne pathogens, (B) SERS spectra of three foodborne pathogens (a) is Staphylococcus aureus, (b) is Escherichia coli O157: H7, and (c) is Salmonella, AgNPs is silver nanoparticles solution.
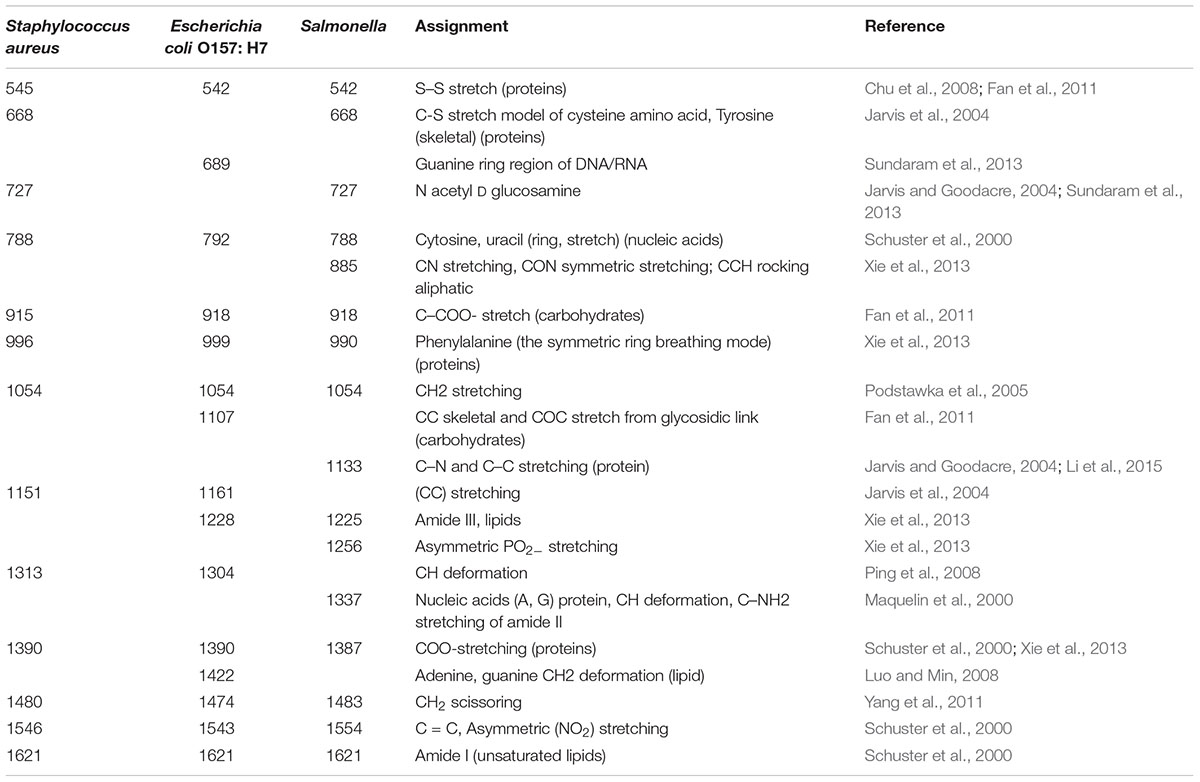
Table 1. Raman shift and tentative assignment of peaks from the SERS spectra of three foodborne pathogens.
Reproducibility of SERS Spectra
According to the characterization of AgNps, substrates play a major role in the signal enhancement for SERS (Chu et al., 2008). Thus the reproducible SERS study using four different batches of silver nanoparticles was conducted to test Escherichia coli O157: H7, S. aureus and Salmonella, respectively, in this study. Each AgNps substrate was prepared independently. The three foodborne pathogens of SERS spectral reproducibility with substrates AgNps are illustrated in Figures 5–7, respectively. When bacterial samples were treated with different SERS substrates individually, the variability could be found to be common. However, in this study, the manufactured AgNps substrates did not show any change or noise in the spectra. From the figures, these three foodborne pathogens that combined four different batches of AgNps SERS spectra have a high degree of reproducibility. The results provide strong support for rapid SERS detection of foodborne pathogens.
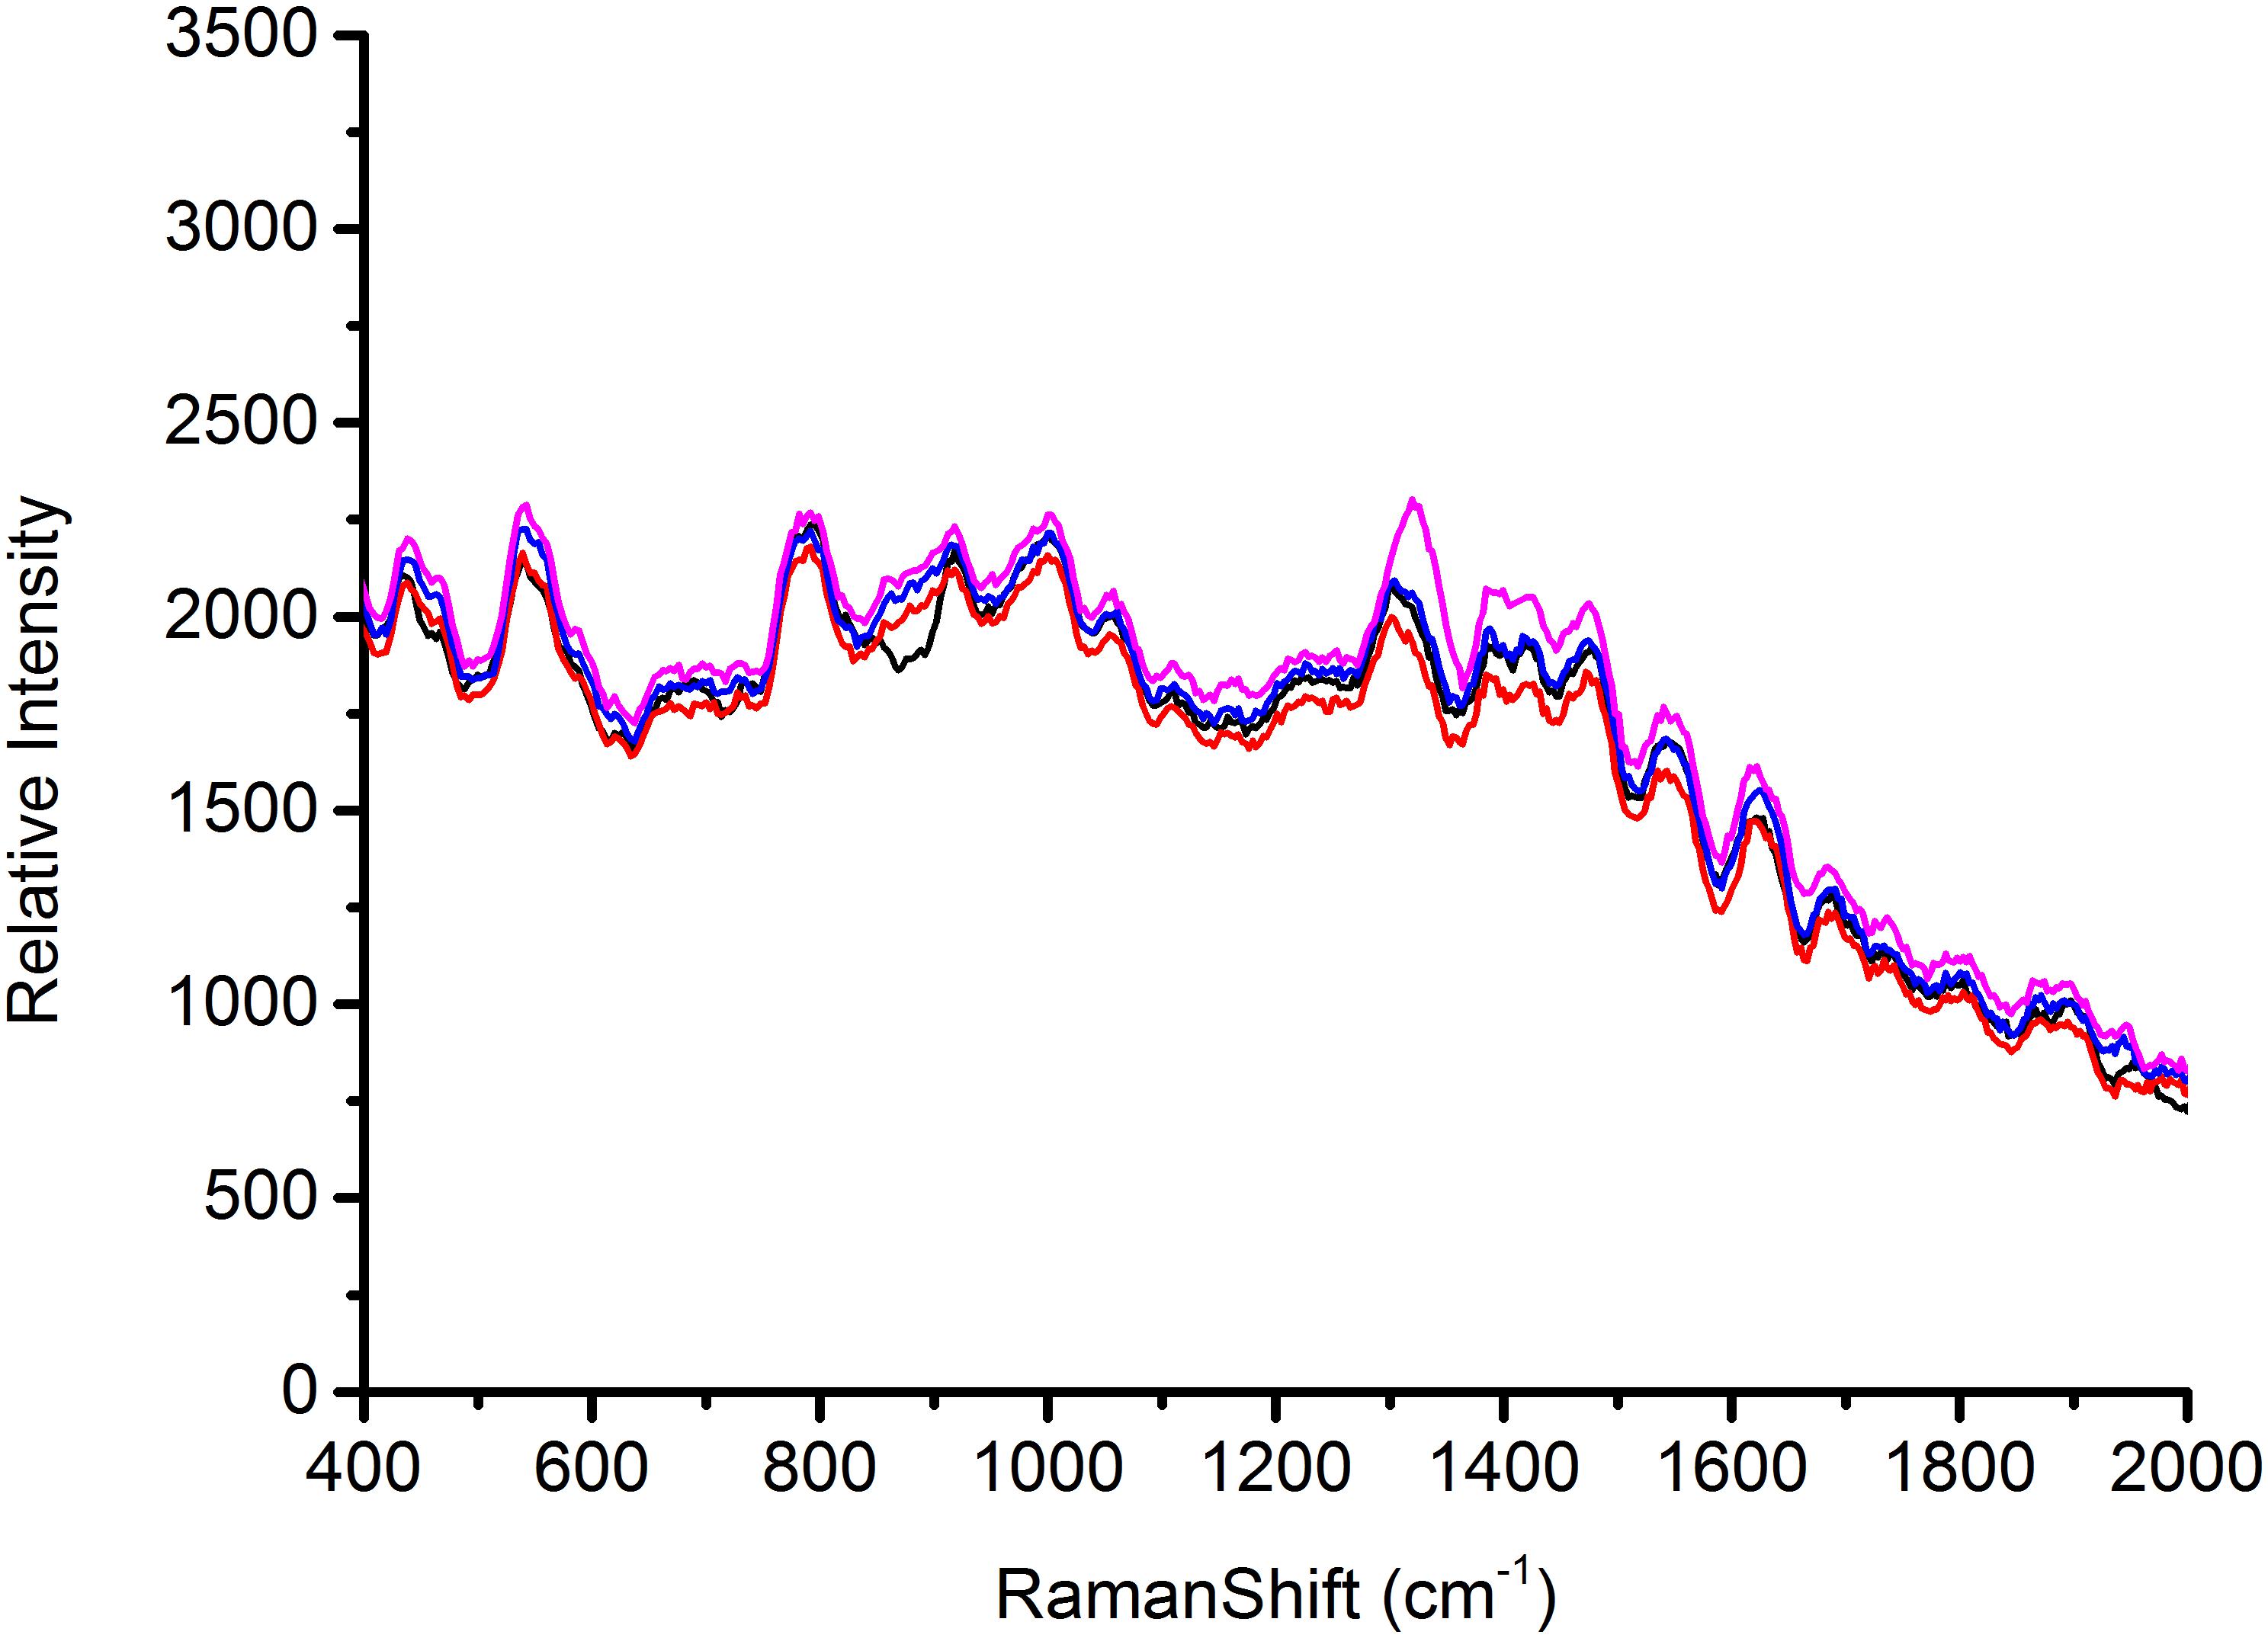
Figure 5. SERS spectra of Escherichia coli O157: H7 with four batches of prepared AgNPs.
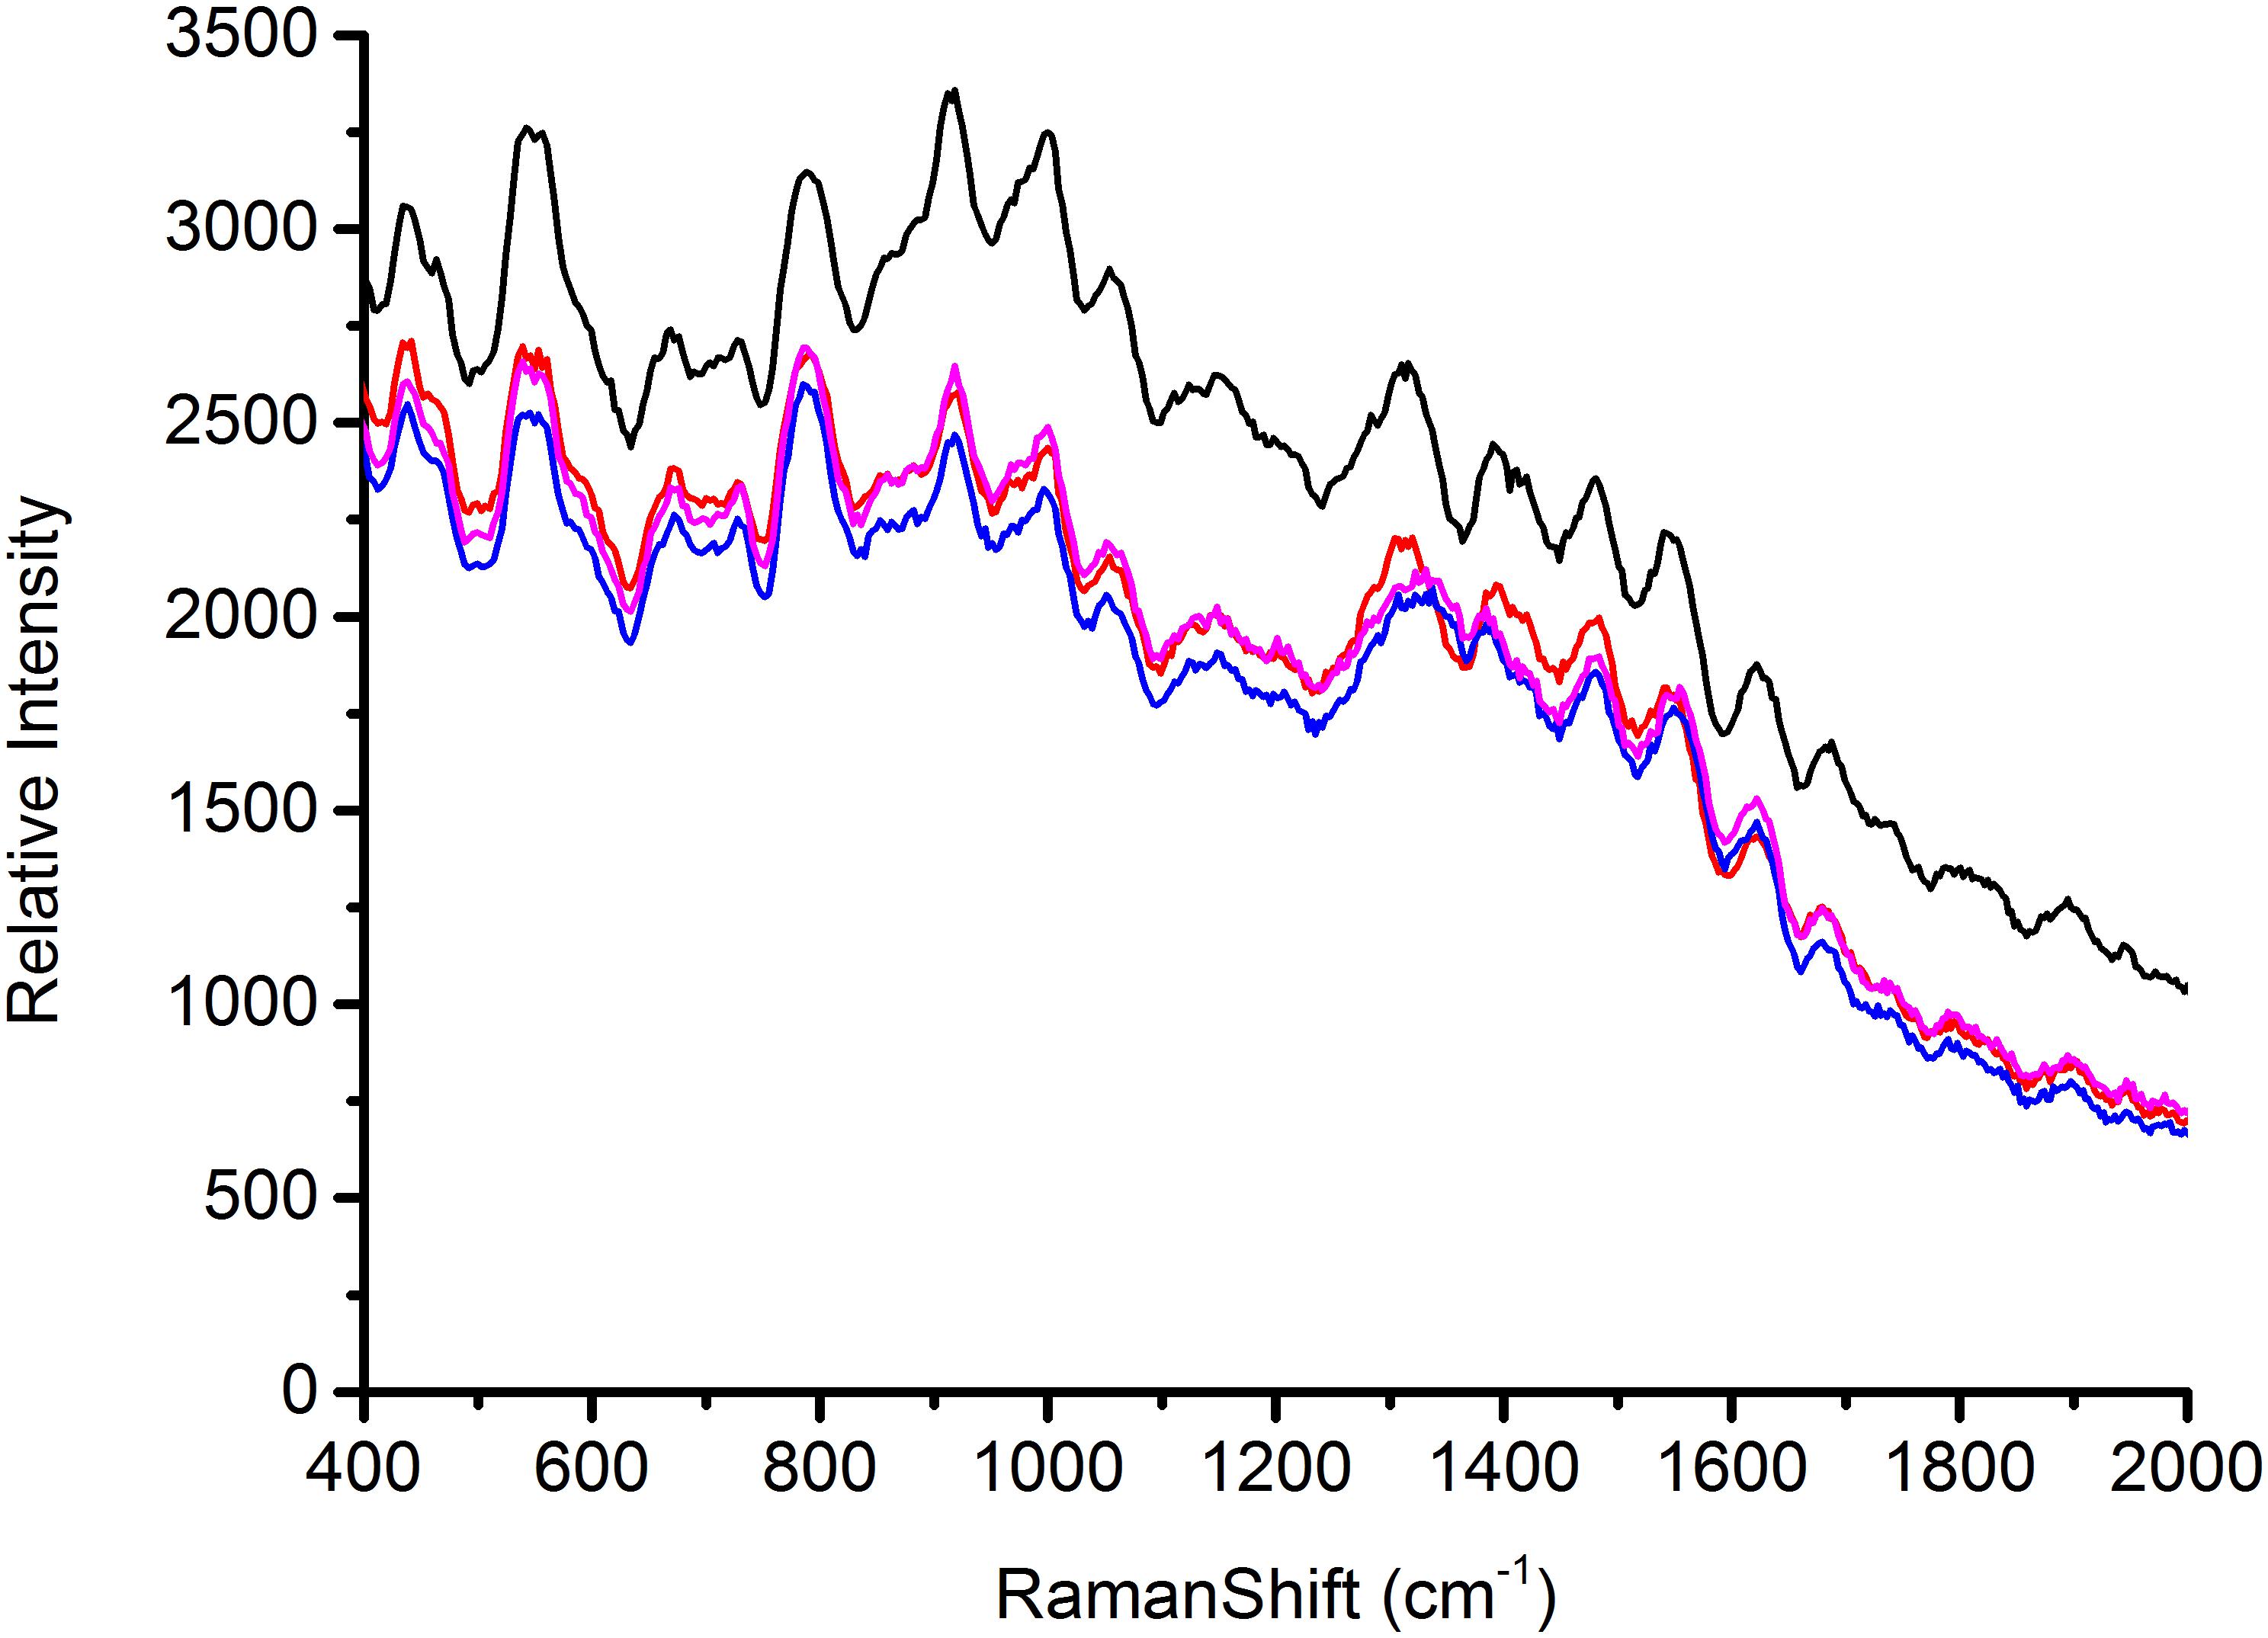
Figure 6. SERS spectra of Staphylococcus aureus with four batches of prepared AgNPs.
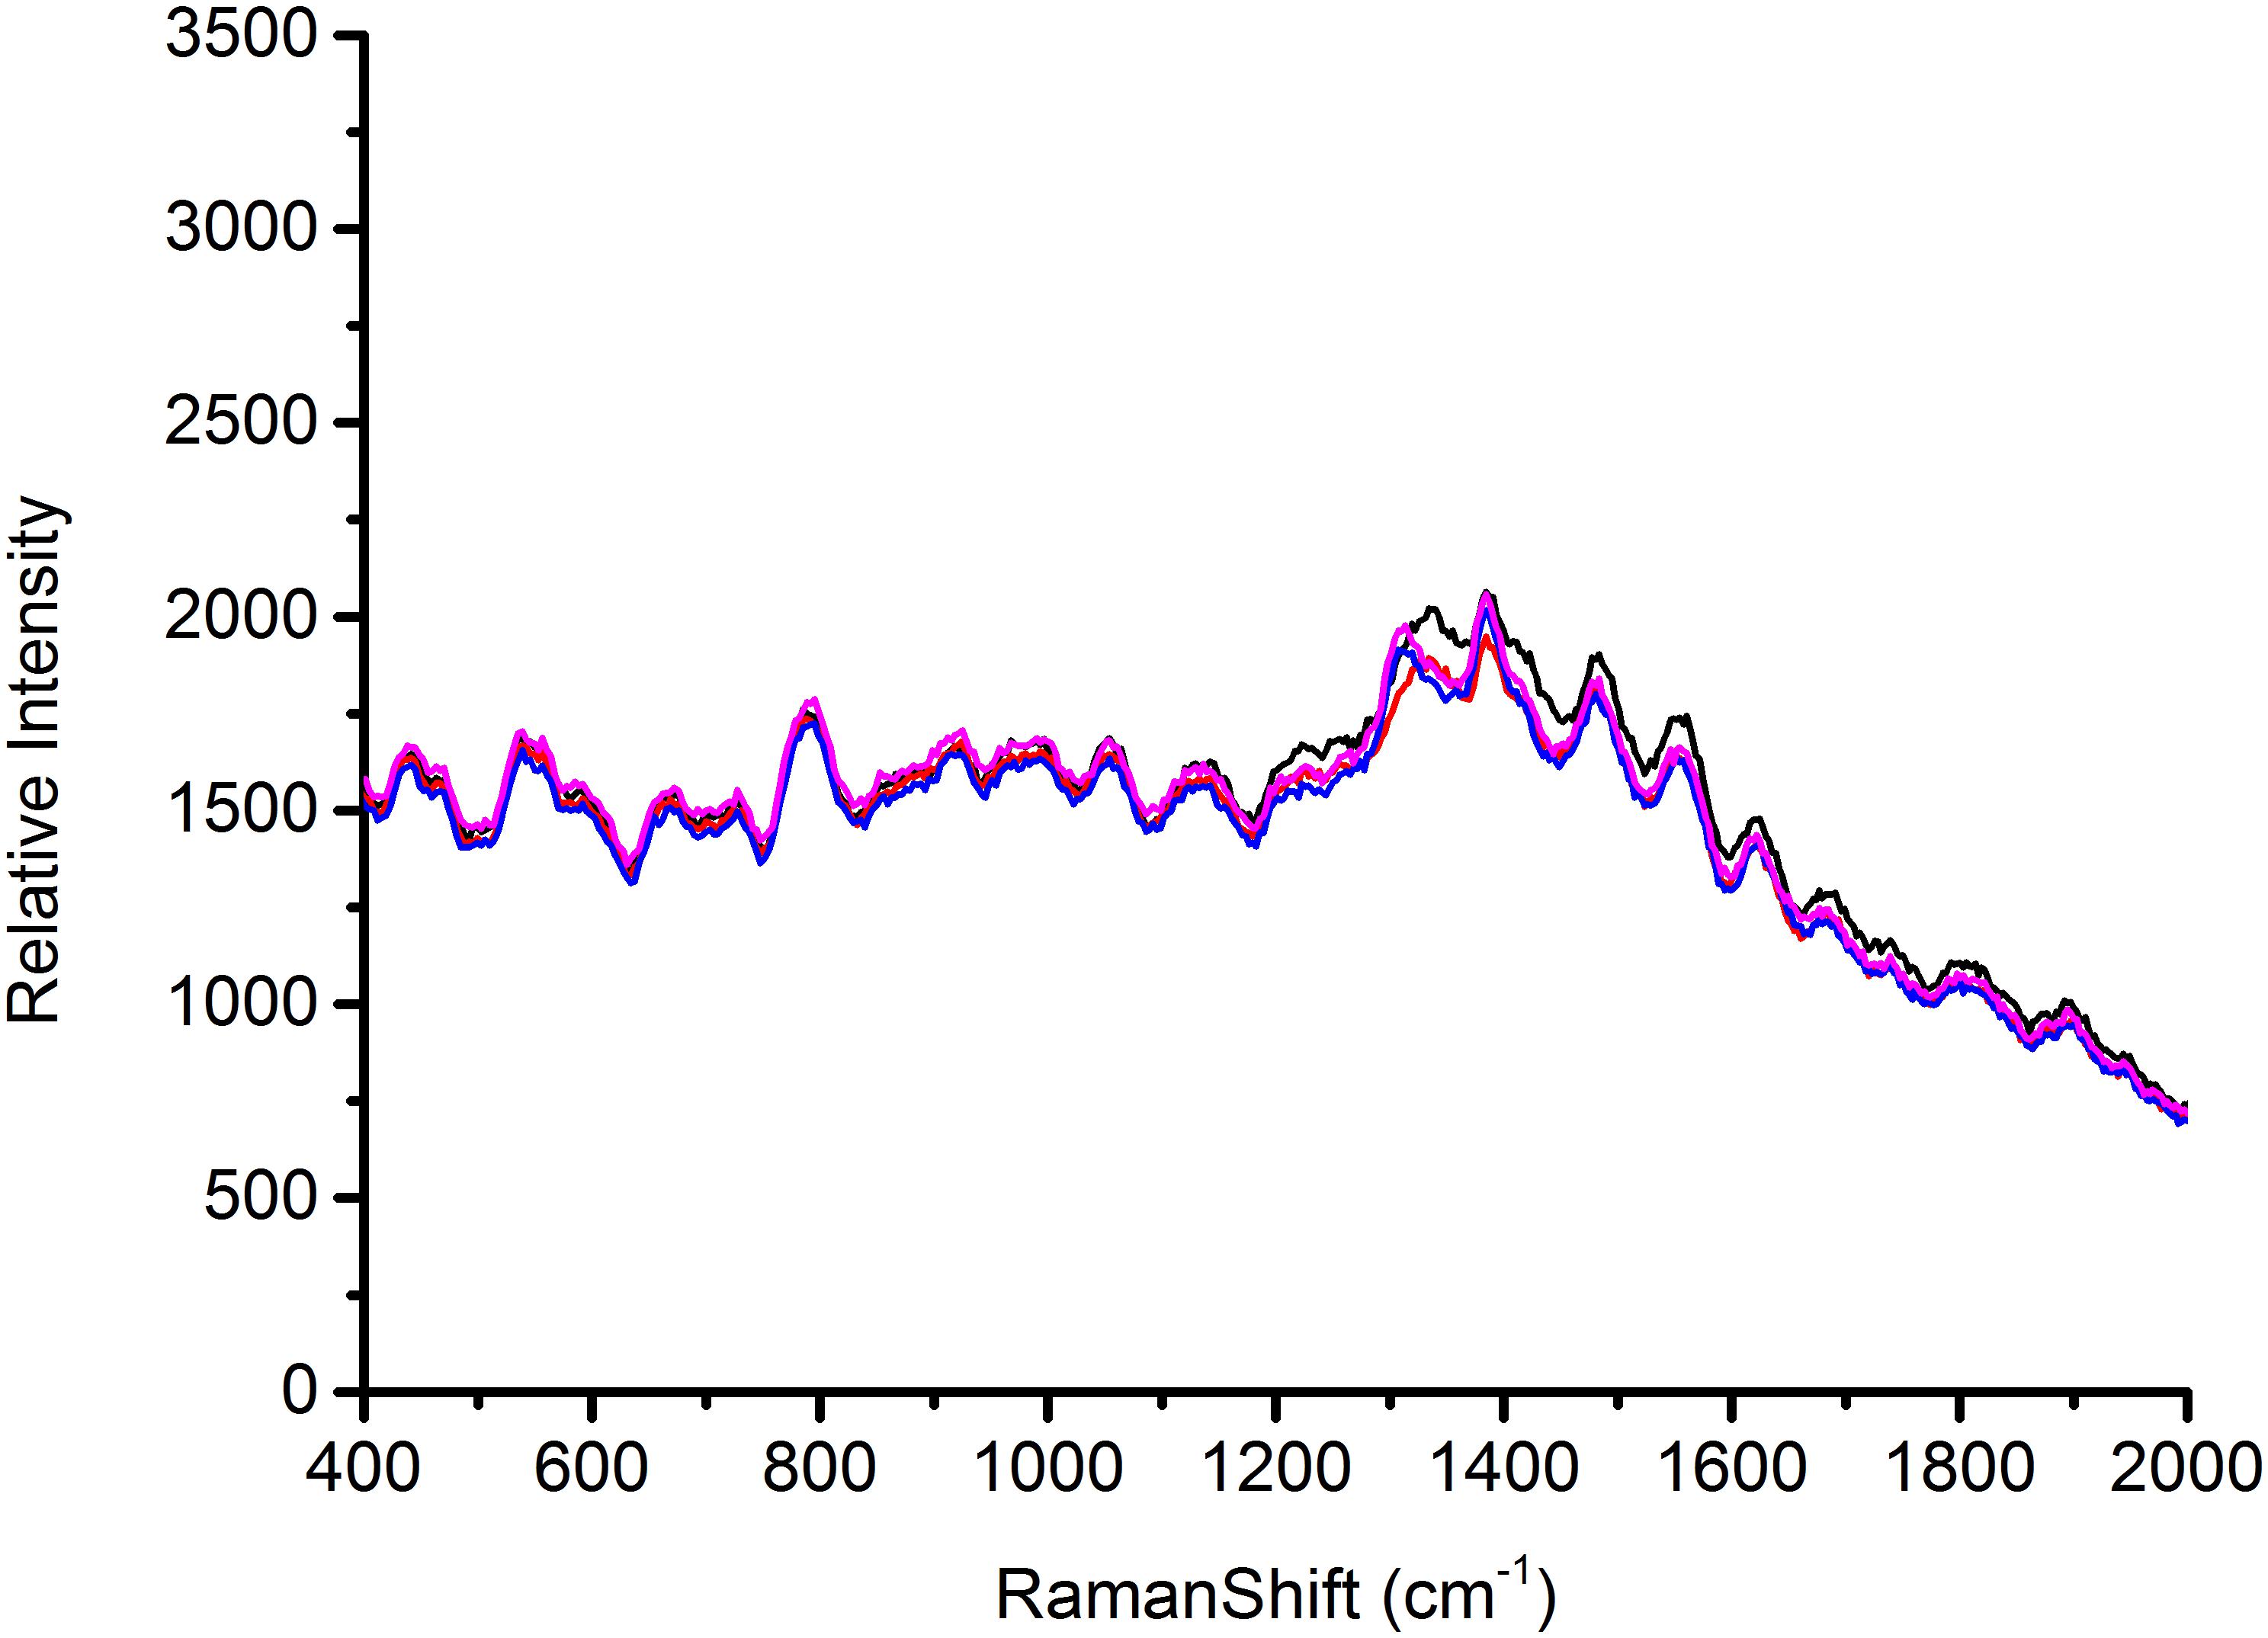
Figure 7. SERS spectra of Salmonella with four batches of prepared AgNPs.
PCA and HCA Classification
Principal component analysis can greatly reduce the dimensionality of complex multivariate data to several principal components (PCs), eliminate random variation (noise) and can objectively capture the minimal spectral differences between the similar spectra (Zhang et al., 2012; Li et al., 2015). The SERS spectra are used as the inputs for the PCA model. Then the PCA projects data into the transformation space to maximize data variability, which makes it easier to observe the similarities and differences in spectra. Therefore, PCA is widely used to analyze SERS spectral data variances and develop classification models to distinguish pathogens based on the SERS spectra. Hierarchical clustering analysis is performed using measurements of distances as the standard for classification. It utilizes multiple statistical values to decide the degree of affinity between different samples. A HCA dendrogram is constructed using the Ward-linkage algorithm and squared distances, which were used to evaluate the member dissimilarity (He et al., 2008). It also utilizes the corresponding dendrograms’ multiple statistical results to discriminate and categorize the samples. At the same time, PCA results can be further corroborated. Considering that it was difficult to classify and identify microorganisms based on similar vibrational spectra, the PCA methods and HCA methods were employed to analyze and differentiate their SERS spectra acquired from bacterial samples in this study. Figure 8A shows a three-dimensional (3D) PCA plot of the first three PCs for the three bacterial strains. The PCA performed on the second derivative transformed SERS spectral data from the three foodborne pathogen samples (about 1 × 10⁷–108 CFU/ml) over a range of 500–800 cm-1. The resulting HCA dendrogram presents a clear characterization at strain level of each analyzed foodborne pathogen. In Figure 8B, the three foodborne pathogen samples of Escherichia coli O157: H7, S. aureus and Salmonella can be effectively distinguished in the HCA dendrogram. The classification of HCA helps to determine the similarities and differences between groups. It can be seen from Figure 8B that the SERS spectra can mainly be categorized into three clusters and the result is consistent with that shown in PCA.
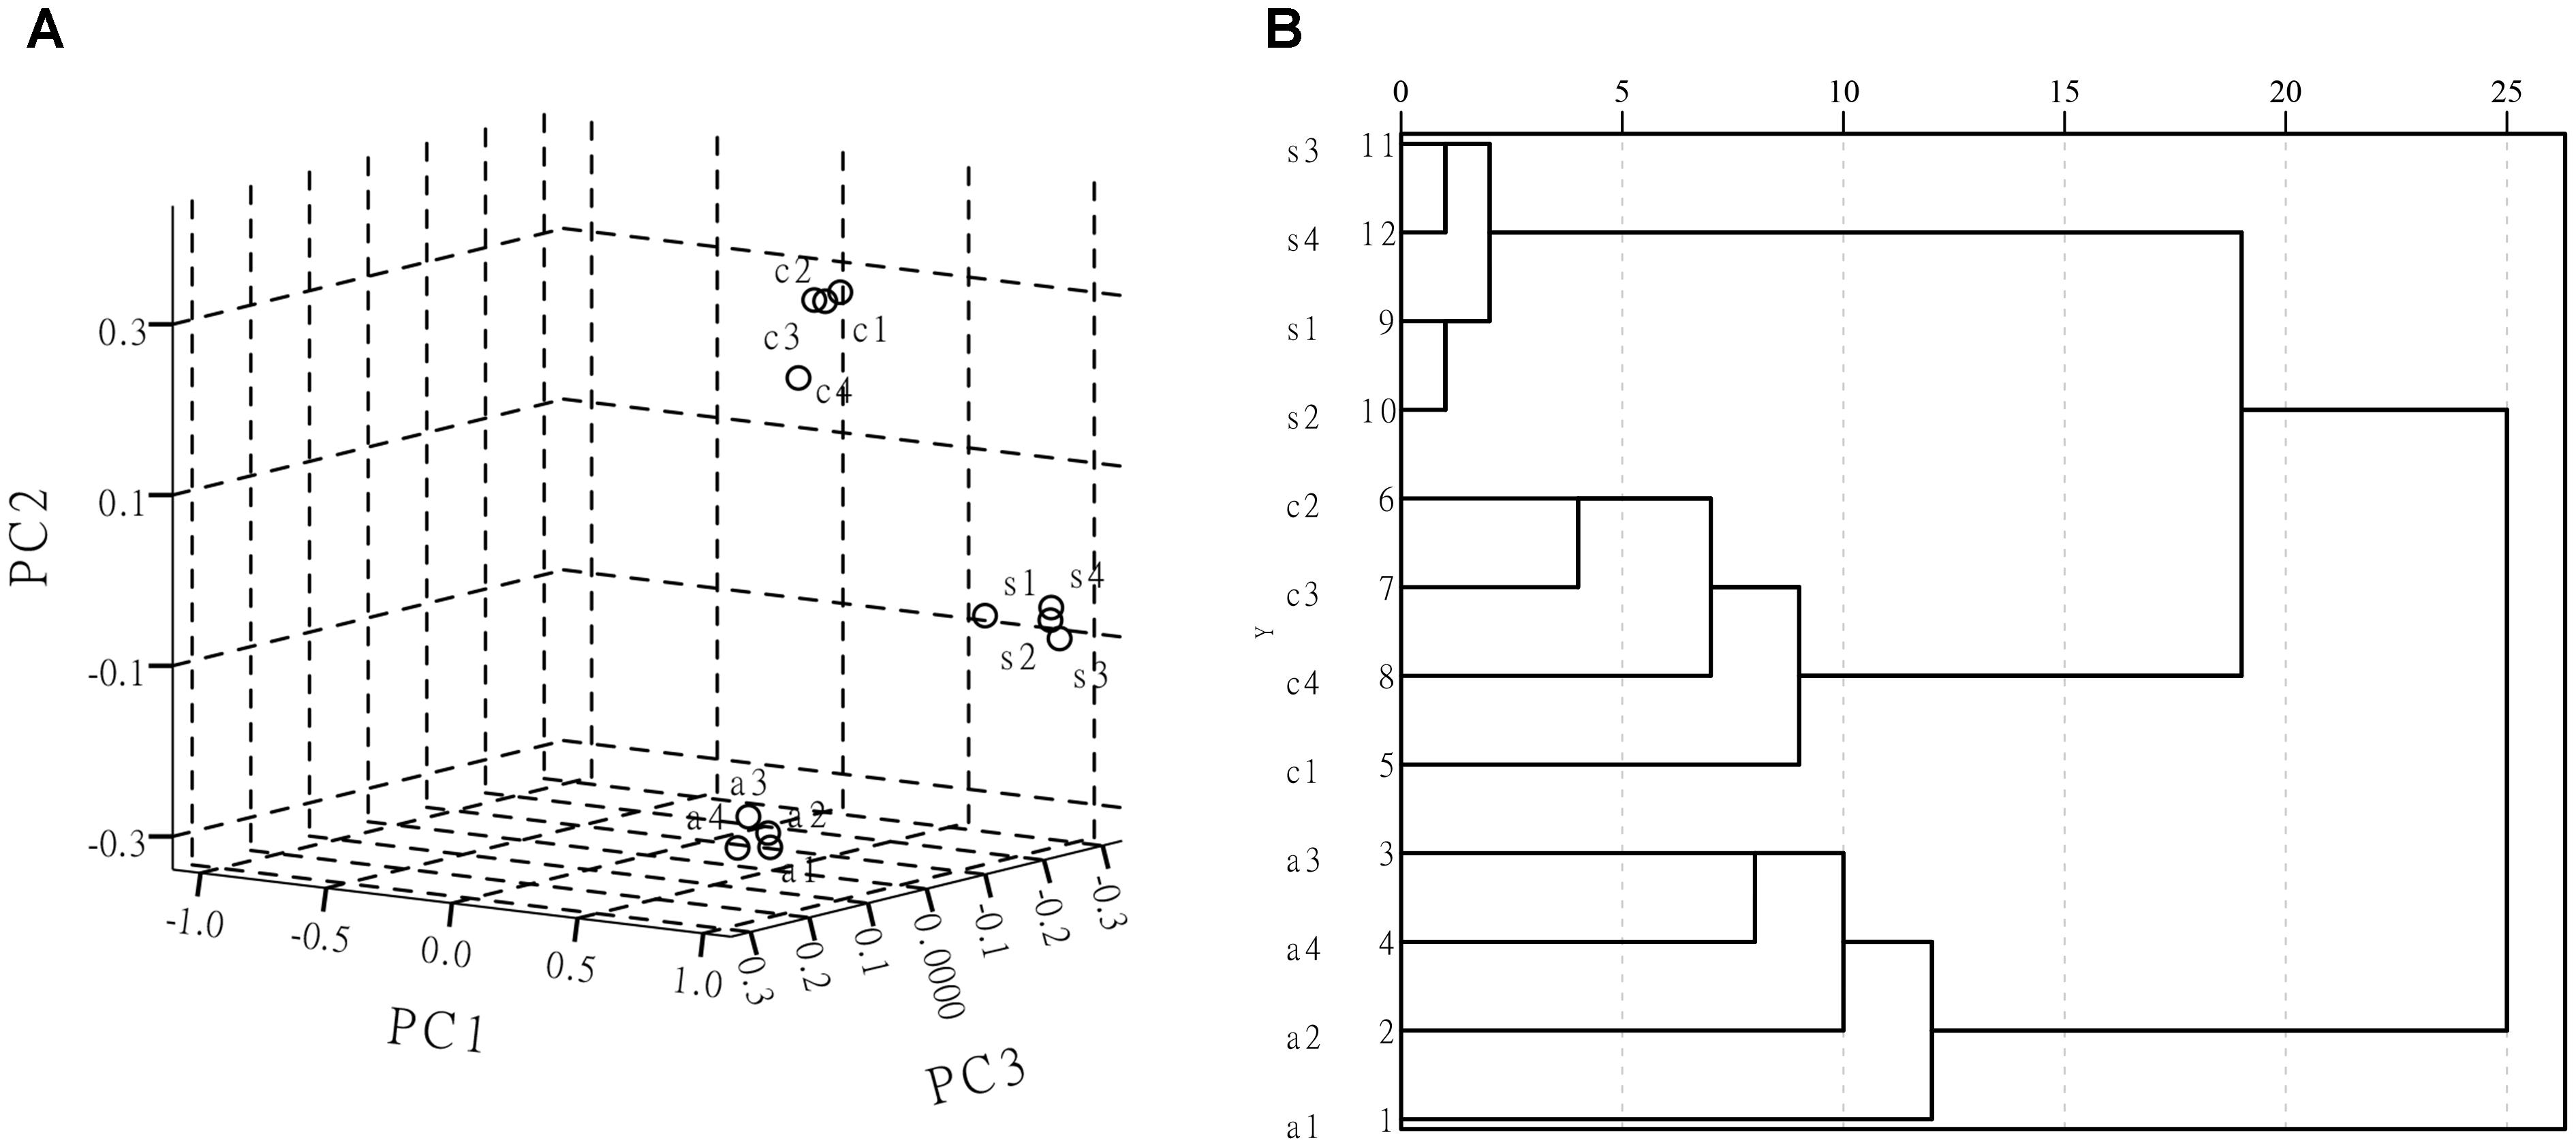
Figure 8. (A) PCA scores plot of Escherichia coli O157: H7, Staphylococcus aureus, Salmonella. (B) Composite dendrogram generated by hierarchy cluster analysis (HCA) from those three pathogenic bacteria; (s) is Staphylococcus aureus, (c) is Escherichia coli O157: H7, (a) is Salmonella.
Discussion
The AgNps were prepared by a quick and easy microwave heating method, which was used as SERS substrates to detect and discriminate Escherichia coli O157: H7, S. aureus and Salmonella in this study. At this point, the molecular level interpretation about SERS’ vibrational features has not been universally established, but we can make some general statements and identify these spectra based on the spectral position and varying intensities. In the given spectral region, all the foodborne pathogens have similar peaks, with some differences in frequency for certain peaks. Those results are consistent with previous reports (Zeiri et al., 2004; Sundaram et al., 2013). To allow for more precise distinction between the three foodborne pathogens SERS spectra, all the characteristic peaks in SERS spectra that can be attributed to different functional groups are collected in Table 1. Comparing the SERS spectra of these three kinds of bacteria, we found that the three Raman are similar to unique Raman peaks in themselves. S. aureus and Salmonella both have Raman peaks at 727 cm-1, which are attributed to N-acetylglucosamine (NAG) in peptidoglycans. This result also confirms that the NAG exists in both Gram-negative and Gram-positive bacteria, whereas for Escherichia coli O157: H7 this region is represented by a broad and weak peak. The similar results were obtained in the study of pathogen identification using a portable Raman spectroscopy system (Luo and Min, 2008). Moreover, all of them have many differences, which mainly come from the quantity and distribution of cellular components such as proteins, phospholipids, nucleic acids, and carbohydrates. For instance, Escherichia coli O157: H7 has unique Raman peaks at 689, 1107, 1161, 1304, and 1422 cm-1, S. aureus has its own unique Raman peaks at 966, 1151, 1313, and 1480 cm-1, while Salmonella has their own unique Raman peaks at 885, 1133, 1256, and 1337 cm-1. Meanwhile, there is also an obvious difference in the intensity of SERS vibrational peaks among these three foodborne pathogens. However, the spectral information of these three pathogens is not completely coincident with other studies. Comparing with other studies (Xie et al., 2013; Wang et al., 2016), they appear to be different peaks. It indicates that these spectra only presented ingredient information activated by metallic nanosilver.
In this study, a rapid SERS technique coupled with silver colloidal nanoparticles as substrates has been explored to identify the foodborne pathogens. Compared to traditional detection methods, this method is faster and easier to perform and has a high degree of reproducibility. All the foodborne pathogens have similar peaks, with some difference in frequency for certain peaks in the given spectral region. The spectra showed largely similar peaks, such as those at 542, 918, 1054, and 1621 cm-1, but they also have their unique peaks that can easily be distinguished. In addition, it is difficult to classify and identify microorganisms due to similar vibrational spectra, so multivariate statistical analysis of PCA and HCA were applied to explore the data and identify individual groups based on differences in the SERS spectra in this study.
Conclusion
The SERS has great prospects for application in detection of foodborne pathogens. If this method is further applied, quantitative detection of viable cells from dead cells, identifying different foodborne pathogen species and subspecies level, and then establishing a bacterial SERS database could be next steps. We believe that SERS will be more universally applicable in the area of food microbiology and also provides a sensitive and efficient tool for food safety control. So far, it is still very challenging to apply SERS techniques to detect pathogens for qualitative and quantitative analyses in complex media (food). If SERS can be integrated with chemometrics methods and spectral data analysis as well as with the development of micro-Raman spectrometers and nanosubstrates, and determine the best conditions to obtain reproducible results in complex food matrices or separate the bacteria from the complex food substrate via some filter membranes, there could be further advances not only in food, but also in the human health sectors.
Author Contributions
XZ designed this study and wrote the manuscript. CW and ML finished the experiments and collected the data. All authors read and approved the final manuscript.
Funding
This work has been supported by the National Natural Science Foundation of China (31501582), Hubei Provincial Natural Science Foundation of China (2018CFB514), Science Research Fund of Wuhan Institute of Technology (17QD01 and 16QD04), and Open Project Program of Key Laboratory for Green Chemical Process of Ministry of Education in Wuhan Institute of Technology (2017007).
Conflict of Interest Statement
The authors declare that the research was conducted in the absence of any commercial or financial relationships that could be construed as a potential conflict of interest.
References
Betz, J. F., Cheng, Y., and Rubloff, G. W. (2012). Direct SERS detection of contaminants in a complex mixture: rapid, single step screening for melamine in liquid infant formula. Analyst 137, 826–828. doi: 10.1039/c2an15846a
Chu, H., Huang, Y., and Zhao, Y. (2008). Silver nanorod arrays as a surface-enhanced Raman scattering substrate for foodborne pathogenic bacteria detection. Appl. Spectrosc. 62, 922–931. doi: 10.1366/000370208785284330
Chuang, T. L., Chang, C. C., Chu-Su, Y., Wei, S. C., Zhao, X. H., Hsueh, P. R., et al. (2014). Disposable surface plasmon resonance aptasensor with membranebased sample handling design for quantitative interferon-gamma detection. Lab Chip 14, 2968–2977. doi: 10.1039/C4LC00249K
Culha, M., Kahraman, M., Çam, D., Sayın, I., and Keseroglu, K. (2010). Rapid identification of bacteria and yeast using surface-enhanced Raman scattering. Surf. Interface Anal. 42, 462–465. doi: 10.1002/sia.3256
Dong, S., Zhou, J., Hui, D., Pang, X., Wang, Q., Zhang, S., et al. (2014). Interaction between edge dislocations and amorphous interphase in carbon nanotubes reinforced metal matrix nanocomposites incorporating interface effect. Int. J. Solids Struct. 51, 1149–1163. doi: 10.1016/j.ijsolstr.2013.12.011
Du, H. Y., Song, Z., Wang, J., Liang, Z., Shen, Y., and You, F. (2015). Microwave-induced shape-memory effect of silicon carbide/poly(vinyl alcohol) composite. Sens. Actuators A Phys. 228, 1–8. doi: 10.1016/j.sna.2015.01.012
Erik, E., and Anna, A. (2007). Comparison of culture, ELISA and PCR techniques for Salmonella detection in faecal samples for cattle, pig and poultry. BMC Vet. Res. 3:21. doi: 10.1186/1746-6148-3-21
Fan, C., Hu, Z., Mustapha, A., and Lin, M. (2011). Rapid detection of food- and waterborne bacteria using surface-enhanced Raman spectroscopy coupled with silver nanosubstrates. Appl. Microbiol. Biotechnol. 92, 1053–1061. doi: 10.1007/s00253-011-3634-3
He, L., Liu, Y., Lin, M., Mustapha, A., and Wang, Y. (2008). Detecting single Bacillus spores by surface enhanced Raman spectroscopy. Sens. Instrum. Food Qual. Saf. 2, 247–253. doi: 10.1007/s11694-008-9054-0
Hou, M., Wang, Y., Liu, S., Guo, J., Li, Z., and Lu, P. (2014). Sensitivity-enhanced pressure sensor with hollow-core photonic crystal fiber. J. Lightwave Technol. 32, 4637–4641. doi: 10.1109/JLT.2014.2358713
Huang, Z., Jiang, H., Liu, P., Sun, J., Guo, D., Shan, J., et al. (2014). Continuous synthesis of size-tunable silver nanoparticles by a green electrolysis method and multi-electrode design for high yield. J. Mater. Chem. A 3, 1925–1929. doi: 10.1039/c4ta06782g
Huang, Z. Q., He, X. Q., and Liew, K. M. (2015). A sensitive interval of imperfect interface parameters based on the analysis of general solution for anisotropic matrix containing an elliptic inhomogeneity. Int. J. Solids Struct. 73-74, 67–77. doi: 10.1016/j.ijsolstr.2015.07.009
Jarvis, R. M., Brooker, A., and Goodacre, R. (2004). Surface-enhanced raman spectroscopy for bacterial discrimination utilizing a scanning electron microscope with a raman spectroscopy interface. Anal. Chem. 76, 5198–5202. doi: 10.1021/ac049663f
Jarvis, R. M., and Goodacre, R. (2004). Discrimination of bacteria using surface-enhanced Raman spectroscopy. Anal. Chem. 76, 40–47. doi: 10.1021/ac034689c
Kim, H., Kim, E., Choi, E., Baek, C. S., Song, B., Cho, C. H., et al. (2015). Label-free C-reactive protein SERS detection with silver nanoparticle aggregates. RSC Adv. 5, 34720–34729. doi: 10.1039/C5RA00040H
Krishnan, K. S. (1928). A new type of secondary radiation. Nature 121, 501–502. doi: 10.1038/121501c0
Li, W. L., Wu, A., Li, Z. C., Zhang, G., and Yu, W. Y. (2017). A new calibration method between an optical sensor and a rotating platform in turbine blade inspection. Measure. Sci. Technol. 28:035009. doi: 10.1088/1361-6501/aa50df
Li, X., Yang, T., Li, S., Wang, D., and Guan, D. (2015). Detecting esophageal cancer using surface-enhanced Raman spectroscopy (SERS) of serum coupled with hierarchical cluster analysis and principal component analysis. Appl. Spectrosc. 69, 1334–1341. doi: 10.1366/14-07829
Liu, J. Y., Zhou, R., Li, L., Peters, B. M., Li, B., Lin, C. W., et al. (2017). Viable but non-culturable state and toxin gene expression of enterohemorrhagic Escherichia coli 0157 under cryopreservation. Res. Microbiol. 168, 188–193. doi: 10.1016/j.resmic.2016.11.002
Luo, B., and Min, L. (2008). A portable Raman system for the identification of foodborne pathogenic bacteria. J. Rapid Methods Autom. Microbiol. 16, 238–255. doi: 10.1111/j.1745-4581.2008.00131.x
Maquelin, K., Choosmith, L. P., Van, V. T., Endtz, H. P., Smith, B., Bennett, R., et al. (2000). Raman spectroscopic method for identification of clinically relevant microorganisms growing on solid culture medium. Anal. Chem. 72, 12–19. doi: 10.1021/ac991011h
Meisel, S., Stöckel, S., Rösch, P., and Popp, J. (2014). Identification of meat-associated pathogens via Raman microspectroscopy. Food Microbiol. 38, 36–43. doi: 10.1016/j.fm.2013.08.007
Morones, J. R., Elechiguerra, J. L., Camacho, A., Holt, K., Kouri, J. B., Ramã-Rez, J. T., et al. (2005). The bactericidal effect of silver nanoparticles. Nanotechnology 16, 2346–2353. doi: 10.1088/0957-4484/16/10/059
Nelson, W. H., Manoharan, R., and Sperry, J. F. (1992). UV resonance Raman studies of bacteria. Appl. Spectrosc. Rev. 27, 67–124. doi: 10.1080/05704929208018270
Ping, K., Malvadkar, N. A., Cetinkaya, M., Wang, H., Allara, D. L., and Demirel, M. C. (2008). Surface-enhanced raman detection on metalized nanostructured Poly(p-xylylene) films. Adv. Mater. 20, 3562–3565. doi: 10.1002/adma.200800936
Podstawka, E., Ozaki, Y., and Proniewicz, L. M. (2005). Part III: surface-enhanced Raman scattering of amino acids and their homodipeptide monolayers deposited onto colloidal gold surface. Appl. Spectrosc. 59, 1516–1526. doi: 10.1366/000370205775142520
Roda, A., Mirasoli, M., Roda, B., Bonvicini, F., Colliva, C., and Reschiglian, P. (2012). Recent developments in rapid multiplexed bioanalytical methods for foodborne pathogenic bacteria detection. Microchim. Acta 178, 7–28. doi: 10.1007/s00604-012-0824-3
Schuster, K. C., Urlaub, E., and Gapes, J. R. (2000). Single-cell analysis of bacteria by Raman microscopy: spectral information on the chemical composition of cells and on the heterogeneity in a culture. J. Microbiol. Methods 42, 29–38. doi: 10.1016/S0167-7012(00)00169-X
Shrivastava, S., Bera, T., Roy, A., Singh, G., Ramachandrarao, P., and Dash, D. (2007). Characterization of enhanced antibacterial effects of novel silver nanoparticles. Nanotechnology 18:225103. doi: 10.1088/0957-4484/18/22/225103
Sivanesan, A., Witkowska, E., Adamkiewicz, W., Dziewit,Ł, Kamińska, A., and Waluk, J. (2014). Nanostructured silver-gold bimetallic SERS substrates for selective identification of bacteria in human blood. Analyst 139, 1037–1043. doi: 10.1039/c3an01924a
Sundaram, J., Park, B., Kwon, Y., and Lawrence, K. C. (2013). Surface enhanced Raman scattering (SERS) with biopolymer encapsulated silver nanosubstrates for rapid detection of foodborne pathogens. Int. J. Food Microbiol. 167, 67–73. doi: 10.1016/j.ijfoodmicro.2013.05.013
Wang, Y., and Irudayaraj, J. (2012). Surface-enhanced Raman spectroscopy at single-molecule scale and its implications in biology. Philos. Trans. R. Soc. Lond. 368:20120026. doi: 10.1098/rstb.2012.0026
Wang, Y., Yan, B., and Chen, L. (2012). SERS tags: novel optical nanoprobes for bioanalysis. Chem. Rev. 113, 1391–1428. doi: 10.1021/cr300120g
Wang, Y., Zhang, X., Wen, G., Liang, A., and Jiang, Z. (2016). Facile synthesis of a highly SERS active nanosilver sol using microwaves and its application in the detection of E. coli using Victoria blue B as a molecular probe. Anal. Methods 8, 4881–4887. doi: 10.1039/C6AY00728G
Wei, C. J., Zhong, J. L., Hu, T., and Zhao, X. H. (2018). Simultaneous detection of Escherichia coli O157:H7, Staphylococcus aureus and Salmonella by multiplex PCR in milk. 3 Biotech 8:76. doi: 10.1007/s13205-018-1086-5
Xie, Y., Xu, L., Wang, Y., Shao, J., Wang, L., Wang, H., et al. (2013). Label-free detection of the foodborne pathogens of Enterobacteriaceae by surface-enhanced Raman spectroscopy. Anal. Methods 5, 946–952. doi: 10.1039/C2AY26107C
Xu, L. J., Lei, Z. C., Li, J., Zong, C., Yang, C. J., and Ren, B. (2015). Label-free surface-enhanced Raman spectroscopy detection of DNA with single-base sensitivity. J. Am. Chem. Soc. 137, 5149–5154. doi: 10.1021/jacs.5b01426
Yang, X., Gu, C., Qian, F., Li, Y., and Zhang, J. Z. (2011). Highly sensitive detection of proteins and bacteria in aqueous solution using surface-enhanced Raman scattering and optical fibers. Anal. Chem. 83, 5888–5894. doi: 10.1021/ac200707t
Zeiri, L., Bronk, B. V., Shabtai, Y., Eichler, J., and Efrima, S. (2004). Surface-enhanced Raman spectroscopy as a tool for probing specific biochemical components in bacteria. Appl. Spectrosc. 58, 33–40. doi: 10.1366/000370204322729441
Zhang, L., Xu, J., Mi, L., Gong, H., Jiang, S., and Yu, Q. (2012). Multifunctional magnetic–plasmonic nanoparticles for fast concentration and sensitive detection of bacteria using SERS. Biosens. Bioelectron. 31, 130–136. doi: 10.1016/j.bios.2011.10.006
Zhao, X., Li, M., and Xu, Z. (2018). Detection of foodborne pathogens by surface enhanced raman spectroscopy. Front. Microbiol. 9:1236. doi: 10.3389/fmicb.2018.01236
Zhao, X., Lin, C. W., Wang, J., and Oh, D. H. (2014). Advances in rapid detection methods for foodborne pathogens. J. Microbiol. Biotechnol. 24, 297–312. doi: 10.4014/jmb.1310.10013
Zhao, X., Zhao, F., Wang, J., and Zhong, N. (2017a). Biofilm formation and control strategies of foodborne pathogens: food safety perspectives. RSC Adv. 7, 36670–36683. doi: 10.1039/C7RA02497E
Zhao, X., Zhong, J., Wei, C., Lin, C. W., and Ding, T. (2017b). Current perspectives on viable but non-culturable state in foodborne pathogens. Front. Microbiol. 8:580. doi: 10.3389/fmicb.2017.00580
Zhao, X. H., Wei, C. J., Zhong, J. L., and Jin, S. W. (2016). Research advance in rapid detection of foodborne Staphylococcus aureus. Biotechnol. Biotechnol. Equip. 30, 827–833. doi: 10.1080/13102818.2016.1209433
Zheng, Y., Mao, S., Liu, S., Wong, S. H., and Wang, Y. W. (2016). Normalized relative RBC-Based minimum risk bayesian decision approach for fault diagnosis of industrial process. IEEE Trans. Ind. Electron. 63, 7723–7732. doi: 10.1109/TIE.2016.2591902
Zhong, J., and Zhao, X. (2018). Isothermal amplification technologies for the detection of foodborne pathogens. Food Anal. Methods 11, 1543–1560. doi: 10.1007/s12161-018-1177-2
Zhong, J. L., and Zhao, X. H. (2017). Detection of viable but non-culturable Escherichia coli O157:H7 by PCR in combination with propidium monoazide. 3 Biotech 8:28. doi: 10.1007/s13205-017-1052-7
Keywords: Surface-enhanced Raman scattering, silver nanoparticles, foodborne pathogens, bioanalysis, food safety, rapid detection
Citation: Wei C, Li M and Zhao X (2018) Surface-Enhanced Raman Scattering (SERS) With Silver Nano Substrates Synthesized by Microwave for Rapid Detection of Foodborne Pathogens. Front. Microbiol. 9:2857. doi: 10.3389/fmicb.2018.02857
Received: 09 February 2018; Accepted: 06 November 2018;
Published: 13 December 2018.
Edited by:
Learn-Han Lee, Monash University Malaysia, MalaysiaReviewed by:
Om V. Singh, Technology Sciences Group Inc., United StatesLingxin Chen, Yantai Institute of Coastal Zone Research (CAS), China
Simion Astilean, Babeş-Bolyai University, Romania
Copyright © 2018 Wei, Li and Zhao. This is an open-access article distributed under the terms of the Creative Commons Attribution License (CC BY). The use, distribution or reproduction in other forums is permitted, provided the original author(s) and the copyright owner(s) are credited and that the original publication in this journal is cited, in accordance with accepted academic practice. No use, distribution or reproduction is permitted which does not comply with these terms.
*Correspondence: Xihong Zhao, xhzhao2006@gmail.com