X-Ray Causes mRNA Transcripts Change to Enhance Orai2-Mediated Ca2+ Influx in Rat Brain Microvascular Endothelial Cells
 Fangfang Xu1†
  Yang Wang3,1† Huiwen Gao1 Xinchen Zhang2 Yu Hu3 Tingting Han2
  Bing Shen1
  Lesha Zhang1*
  Qibing Wu2*
- 1School of Basic Medical Sciences, Anhui Medical University, Hefei, China
- 2Department of Radiotherapy, The First Affiliated Hospital of Anhui Medical University, Hefei, China
- 3Department of Otolaryngology-Head and Neck Surgery, Lu’an People’s Hospital, Lu’an Affiliated Hospital of Anhui Medical University, Lu’an, China
Background: Radiation-induced brain injury is a serious and treatment-limiting complication of brain radiation therapy. Although endothelial cell dysfunction plays a critical role in the development of this pathogenesis, the underlying molecular mechanisms remain elusive.
Methods: Primary cultured rat brain microvascular endothelial cells (BMECs) were divided into five groups without or with exposure of x-rays delivered at 5 Gy or 20 Gy. For the irradiated groups, cells were continued to cultivate for 12 or 24 h after being irradiated. Then the mRNA libraries of each group were established and applied for next-generation sequencing. Gene ontology and Kyoto Encyclopedia of Genes and Genomes pathway enrichment analyses were conducted to analyze the sequencing results. Quantitative polymerase chain reaction, western blotting, cck8 assay and intracellular calcium concentration assays were conducted to analyze the role of Orai2-associated SOCE in x-ray induced cellular injury.
Results: In total, 3,005 transcripts in all the four x-ray–exposed groups of BMECs showed expression level changes compared with controls. With the dose of x-ray augment and the following cultured time extension, the numbers of differentially expressed genes (DEGs) increased significantly in BMECs. Venn diagrams identified 40 DEGs common to all four exposure groups. Functional pathway enrichment analyses indicated that those 40 DEGs were enriched in the calcium signaling pathway. Among those 40 DEGs, mRNA and protein expression levels of Orai2 were significantly upregulated for 24 h. Similarly, calcium influx via store-operated calcium entry, which is modulated by Orai2, was also significantly increased for 24 h in x-ray–exposed BMECs. Moreover, the change in SOCE was suppressed by btp-2, which is a non-selective inhibitor of Orai. Additionally, x-ray exposure induced a significant decrease of proliferation in BMECs in the dose- and time-dependent manner.
Conclusion: These findings provide evidence for molecular mechanisms underlying BMECs dysfunction in development of radiation-induced brain injury and suggest new approaches for therapeutic targets.
Introduction
Brain radiotherapy is a critical and effective treatment for intracranial tumors (Balentova and Adamkov, 2015). It has also long been recognized as primary management of nasopharyngeal carcinoma (Lee et al., 2019; Sun et al., 2019). However, radiation-induced brain injury remains a major common and serious complication of this therapy, with the severity of the injury determined by the radiation dose, irradiated brain volume, and accompanying treatment (Andrews et al., 2017; Wang et al., 2018). Patients with brain injury often experience impairments in memory, attention, cognitive function, and language skills or even death (Burns et al., 2016; Wang et al., 2019a). Thus, it is of the utmost importance to understand brain injury induced by radiotherapy to improve its therapeutic effect.
Radiation has a profound and progressive effect on the neurons, glia, and vasculature of the brain, causing molecular, cellular, and functional changes (Balentova and Adamkov, 2015). However, the molecular mechanisms underlying radiation-induced brain injury are not fully understood. According to previous studies, radiation may directly damage brain parenchymal cells or provoke damage to the vascular system, leading to brain ischemia (Yang et al., 2017). Emerging evidence suggests that radiation damages the vascular system by inducing endothelial cell apoptosis, reducing vessel density and length, increasing vascular permeability and vascular endothelial growth factor expression, and disrupting the blood-brain barrier (Li et al., 2004; Brown et al., 2005; Jin et al., 2014). Although radiation-induced brain injury is influenced by numerous and complicated factors, endothelial cell dysfunction plays a primary role in its development (Balentova and Adamkov, 2015; Tripathi et al., 2019). Therefore, it is crucial to elucidate the mechanisms underlying endothelial cell dysfunction to aid in the prevention and treatment of radiation-induced brain injury.
Proteomics and transcriptomics analyses have been applied in the study of long-term radiation-induced vascular dysfunction (Azimzadeh et al., 2015). However, such data assessing the molecular mechanisms of radiation-induced vascular dysfunction are insufficient and incomplete. A recent study by our team analyzed x-ray–treated (20 Gy) brain microvascular endothelial cells (BMECs) with next-generation sequencing and found that this radiation causes 383 genes to be significantly differentially expressed in BMECs and that these genetic alterations are accompanied by functional changes in the calcium (Ca2+) signaling pathway (Wu et al., 2020). In the present study, we used next-generation sequencing to further investigate the effects of two delivered doses of ionizing radiation (5 and 20 Gy) and of time after the exposure on transcriptional expression changes in BMECs.
Because ionizing irradiation induces alterations in the Ca2+ signaling pathway in BMECs (Wu et al., 2020), it is necessary to determine the molecular mechanisms underlying the potential Ca2+ signaling pathway–induced brain injury. The most widely known pathway for entry of Ca2+ into cells is through store-operated Ca2+ entry (SOCE), and SOCE is modulated by STIM, a Ca2+ sensor located in the endoplasmic reticulum, and by proteins in the Orai family, which form highly selective Ca2+ channels (Moccia et al., 2019). Therefore, Orai proteins and the associated SOCE may be involved in radiation-induced brain injury. Veath et al. have provided evidence that Orai2 modulates the magnitude of SOCE by forming heteromeric channels (Vaeth et al., 2017).
Given the plausibility for the involvement of Orai proteins and SOCE in radiation-induced brain injury and the finding by (Vaeth et al., 2017), a primary goal of the present study was to test the hypothesis that the levels of Orai2 expression and the magnitude of SOCE are increased in BMECs exposed to x-rays. We used high-throughput sequencing, real-time quantitative polymerase chain reaction (qPCR), and intracellular Ca2+ concentration ([Ca2+]i) assays to assess whether this molecular mechanism may be related to BMEC dysfunction and contribute to radiation-induced brain injury.
Materials and Methods
Primary Culture of BMECs
All animal experiments were conducted in compliance with the National Institutes of Health (publication No. 8523). The Animal Experimentation Ethics Committee of Anhui Medical University (No. LLSC 20200179) reviewed and approved the study protocol and handling of the animals. Total of six Sprague Dawley rats (littermates, aged 2–3 weeks and weighing 10–20 g, sex in half) were purchased from the Animal Center of Anhui Medical University. The rats had free access to food and water and were house in a room with a 12-h light/dark cycle. The temperature of the room was maintained at 22–25°C. Tissue attainment from the rats for the harvest of BMECs and the primary BMECs dispersion were conducted as previously described (Zhang et al., 2007). Briefly, a gas mixture containing 100% oxygen and 2% isoflurane with the volume speed of 0.2 L/ min was used to anesthetize rats. Then the rats were humanely killed by inhalation of excess carbon dioxide (CO2) and cleansed three times with 75% alcohol. All subsequent procedures were conducted under aseptic conditions. The brain and its cerebral hemispheres were removed and placed in a petri dish containing a sterile phosphate-buffered saline solution. The pia mater, surface blood vessels, and cerebral medulla were removed from the cerebral cortex. The harvested tissue was cut into pieces, homogenized into suspensions, and filtered through an 80 µm mesh screen. The resulting filtrate was then filtered through a 200 µm mesh screen. The oversize residue was collected and centrifuged at 1,000 rpm for 5 min at 4°C. The resulting precipitate was collected and digested with 0.2% type II collagenase (Sigma-Aldrich, St. Louis, MO, United States) in phosphate-buffered saline at 37°C for 30 min and then centrifuged at 1,000 rpm for 5 min at 4°C. Finally, the obtained precipitate was resuspended in Endothelial Cell Medium containing 20% fetal bovine serum, 1% endothelial cell growth supplement, and 1% penicillin/streptomycin solution. The growth of other types of cells and impurities was reduced through the differential adhesion method, and the cell culture medium was replaced 4 h later. Cells were incubated at 37°C in 5% CO2. The medium was replaced every 3 days.
BMECs X-Ray Exposure
A CLINIC600C linear accelerator (Varian, United States) was used to irradiate BMECs, at a rate of 2.5 Gy/ min. Cells cultured to 60% confluence were irradiated with 5 Gy or 20 Gy. The x-ray source was 100 cm from the cells and had an irradiation range of 20 cm × 20 cm. The cells in the control group were not irradiated by x-rays, but received all other treatments that the x-ray–exposed group received. The primary cultured BMECs were divided into five groups: (1) unexposed controls; (2) 12 h after delivery of 5 Gy of radiation; (3) 24 h after delivery of 5 Gy of radiation; (4) 12 h after delivery of 20 Gy of radiation; and (5) 24 h after delivery of 20 Gy of radiation. All experiments were conducted with three biological replicates.
RNA Preparation
RNA was extracted using a commercially available kit (Vazyme Biotech Co., Ltd, Nanjing, China). BMECs with or without radiation exposure were digested and resuspended in lysis buffer RL1. The cell suspension was transferred to a genomic DNA filter column and centrifuged at 13,000 × g for 2 min. The resulting supernatant was collected and buffer RL2 was added. The mixture was placed in an RNAPure column and centrifuged again. The precipitate was collected. Buffer RW1 and buffer RW2 were used to rinse the RNAPure columns. The columns were put into new RNase-free collection tubes. RNAase-free ddH2O (60 μL) was added to the central part of the columns. The columns remained at room temperature for 2 min to dissolve RNA, and were then centrifuged at 13,000 × g for 1 min to elute RNA. A spectrophotometer was used to determine the purity and concentration of the extracted RNA. The optical density ratio of 260–280 nm was between 1.8 and 2.2, which met experimental requirements. Then messenger RNAs extractions were performed using Poly A selection of Illumina TruSeq RNA sample preparation kit (Illumina, San Diego, CA, United States) to establish the RNA sample libraries. In specific, the total RNAs were undergone two rounds of purification using poly-T oligo-attached magnetic beads. During the second elution of the poly-A RNA, the RNA was also fragmented.
High-Throughput Sequencing and Data Processing
The high-throughput sequencing platform Illumina HiSeq 2,500 was used to analyze the RNA samples. The sequencing length was 150 base pairs. All the quantity and quality of RNA sample came up to the standards of high-throughput sequencing. FastQC software (Patel and Jain, 2012) was used to assess sequence quality, and Trimmomatic software (version 0.3) Bolger et al. (2014) was used to filter adaptors and lower mass readings. The quality-approved sequences were mapped to the rat reference genome (National Center for Biotechnology Information [NCBI] genome assembly, version Rnor_6.0, the genome assembly download site is https://www.ncbi.nlm.nih.gov/genome/73?genome_assembly_id=203777) with HISAT2 (version 2.0.13) (Kim et al., 2015), converted to a binary BAM file through samtools (version 1.9) (Li, 2011), and assembled into single complete transcripts through StringTie (version 1.3.5) software (Pertea et al., 2015). The transcripts were then annotated according to the National Center for Biotechnology Information’s annotation file (.gtf) Rnor 6.0. To quantify the expression level of each transcript, we utilized the most commonly used method, that is, fragments per kilobase being presented as per million fragments mapped. By using the blood-brain barrier RNA sequencing (RNA-Seq) quantification software Kallisto (Bray et al., 2016), the number of known mRNA sequences was counted. Transcript expression levels of samples from each of the five groups were analyzed to compare differences between each two groups by using edgR package software (http://bioconductor.org/packages/2.4/bioc/html/edgeR.html) (Robinson et al., 2010). A negative binomial model was used to calculate the significance of the gene expression level changes among the groups.
Gene Ontology and Kyoto Encyclopedia of Genes and Genomes Pathway Enrichment Analyses
The differentially expressed transcriptomes (with a 1.5-fold change cutoff) from each of the four x-ray–exposed groups were obtained, and those that were found in all four groups were further analyzed by GO and KEGG pathway enrichment analyses and gene expression pattern analyses (Ashburner et al., 2000; Kanehisa and Goto, 2000). The Metascape database was used to analyze and annotate enrichment of the functional pathways for the proteins encoded by DEGs. GO annotation was conducted with the Metascape online tool. GO annotation was used to describe the functions of the screened DGEs in the three GO domains: molecular function, biological process, and cellular component. KEGG pathway analysis of the DEGs was also carried out in the same database. Significantly upregulated or downregulated genes based on the obtained RNA-Seq data were regarded as DEGs, and a two-sided p < 0.05 was considered statistically significant.
Gene Expression Pattern Analysis
The expression patterns of the DEGs found in all four x-ray–exposed groups were further revealed using R package TCseq (version 1.10.0) (Wang et al., 2019b), focusing on those characteristics that changed with time after irradiation. Euclidean distance was used as a measure of the distance between samples. The fuzzy c-means clustering algorithm was applied to cluster genes having the same expression pattern over time.
qPCR Analysis
The RNA reverse transcription reaction system (20 μL) contained RNA (1 μg), 50 μM Oligo (dT)18 Primer (1 μL), 50 ng/ μL random hexamers (1 μL), HiScript Enzyme Mix (2 μL) (Vazyme Biotech Co., Ltd, Nanjing, China), 2 × Reaction Mix (10 μL), and sufficient diethyl pyrocarbonate–treated water to bring the total volume to 20 μL. The reaction was performed using the following conditions: 25°C for 5 min, 50°C for 15 min, and 85°C for 5 min. The qPCR reaction for the collected cDNA was conducted using the Roche LightCycler 480 II PCR instrument (Basel, Switzerland) according to the SYBR Green I Master method. A mixture containing 2 × AceQ qPCR SYBR Green Master Mix, forward primer, reverse primer, cDNA, and ddH2O was used in the amplification reaction. The reaction was carried out in three stages: (1) denaturation at 95°C for 5 min; (2) 40 cycles of 95ºC for 10 s and 60ºC for 30 s; and (3) dissociation at 95 °C for 15 s, 60 ºC for 60 s, and 95°C for 15 s. A melt curve was used to analyze each reaction product. To detect possible carryover or contamination, negative controls were conducted for every sample. The mRNA levels were normalized against β-actin. The primer sequences for β-actin were 5′-CCCATCTATGAGGGTTACGC-3′ (forward) and 5′-TTTAATGTCACGCACGATTTC-3′ (reverse). The primer sequences for Orai2 were 5′-ACCTTGTGATTGGCAGGGTA-3′ (forward) and 5′-ACTGCGATATCCCACTGGAG-3′ (reverse). Relative gene expression levels of the control and the x-ray–exposed groups were calculated according to the 2−ΔΔCT method.
[Ca2+]i Assay
[Ca2+]i was measured using Fluo-8 AM as previously described (Guo et al., 2020). Briefly, cells were seeded on a cell culture cover glass and incubated in culture medium containing Fluo-8 AM (6 μM) and 0.02% pluronic F-127 for 30 min. Then the cells were mounted in a Ca2+ imaging chamber containing a Ca2+-free physiological saline solution with 140 mM NaCl, 2 mM MgCl2, 5 mM KCl, 0.2 mM EGTA, 10 mM glucose, and 10 mM HEPES brought to pH 7.4 with HCl or NaOH. To deplete intracellular Ca2+ stores, we added 4 μM thapsigargin and incubated the cells for at least 10 min. We added CaCl2 to initiate Ca2+ influx. N-(4-[3,5-bis(trifluoromethyl)-1H-pyrazol-1-yl]phenyl)-4-methyl-1,2,3-thiadiazole-5-carboxamide (btp-2, HY-100831, MedChemExpress) was used to block Orai channel and added to the solution. For analysis, the ratio of the real-time fluorescence intensity relative to the baseline fluorescence intensity (F1/F0) was used to represent the magnitude of the Ca2+ influx.
Western Blotting
Equal amounts of protein were electrophoresed on 10% SDS-PAGE gels and transferred to PVDF membranes for immunoblotting. The membranes were blocked with a 5% non-fat milk dilution in TBST for 1 hour at RT and incubated with dilutions of primary antibody, which is Orai2 (20592-1-AP, Protein tech, dilution ratio of 1:1,000) or GAPDH (AF7021, Affinity, dilution ratio of 1:1,000) kept overnight at 4°C. After incubation with HRP-conjugated goat anti-rabbit IgG (E-AB-1003, Elabscience, dilution ratio of 1:5,000), chemiluminescence detection was performed by using the ECL plus Western blotting detection reagent (GE Health, Little Chalfont, United Kingdom), and immunoblots were quantified by densitometry using a chemiluminescence gel imaging analysis system (P and Q, Shanghai, China).
BMECs Proliferation Assay
To detect the effect of x-ray on BMECs survival, the cell proliferation assay was performed as the manufactur’s instructions. The cells were coated on 96-well plates and irradiated with 5 Gy or 20 Gy. Then the cells were continue to cultivate for 12 or 24 h. The cells in the control group were not irradiated by x-ray. After that, cells were cultured with 10 μL cell counting kit-8 solution for 2 h at 37°C. To examine the optical density value, a microplate reader was used.
Statistical Analysis
All data are presented as mean ± SEM. One-way analysis of variance, or t tests when only two groups were compared, was used to assess the data. Two-sided p values < 0.05 were considered statistically significant. GraphPad PRISM software version 8.3.0.538 (GraphPad Software, San Diego, CA, United States) was used for statistical analysis and for graphing.
Results
Quality of High-Throughput Sequencing
Five groups of cultured rat primary BMECs were sequenced. The raw data were trimmed and filtered using Trimmomatic software and evaluated via FastQC. All the raw data and differently expressed gene transcripts information are accessible via GEO accession numbers series GSE166073. GSE166073 study can be viewed at https://www.ncbi.nlm.nih.gov/geo/query/acc.cgi?acc=GSE166073. The median score of the reads was greater than 30, indicating that the quality of all samples was good (Supplementary Figure S1A).
The sequences that passed the quality check were further mapped and quantified via HISAT2 and StringTie software, using the rat reference genome and its annotation file in the Ensembl database (Cunningham et al., 2019). Each treatment group had three biological replicates. The mapping ratios of samples were above 90% in each group, indicating that the reference genome was suitable and that the sequencing samples were not contaminated (Supplementary Figures S1B–E).
To further evaluate the sequenced samples and to assess experimental reliability, we conducted correlation and principal component analyses of mRNA expression levels. Correlations were relatively high between the different biological replicates in each group (Supplementary Figures S2A–D). The results from the principal component analysis indicated clear heterogeneity in the RNA-Seq data between the irradiated cells and cells in the control group (Supplementary Figures S2E–H). Taken together, these results showed the sequencing data were reliable and of high quality.
Identification of DEGs in BMECs
Log2-transformed (FPKM + 1) values were used to evaluate the overall transcription expression levels in each group. No significant differences in overall expression levels were found between the control and treated groups (Figures 1A–D). The heat map of the cluster analysis (Figures 1E–H) indicated that compared with the control group, 12 h after exposure to a delivered x-ray dose of 5 Gy, the expression levels of 428 transcripts were significantly upregulated, whereas those of 301 transcripts were significantly downregulated; 24 h after exposure to the same dose, 375 transcripts were significantly upregulated, whereas 260 transcripts were significantly downregulated. In groups treated with a delivered x-ray dose of 20 Gy, 12 h after exposure, the expression levels of 452 transcripts were significantly upregulated and 215 transcripts were significantly downregulated; 24 h after exposure to this same dose, 1,052 transcripts were significantly upregulated and 1,102 transcripts were significantly downregulated. These findings indicated that the number of differentially expressed transcripts 24 h after 20 Gy was substantially higher than that 12 h after the exposure, suggesting that the change in transcript levels was time dependent. In addition, irradiation caused more DEGs 24 h after exposure to the higher dose (20 Gy) than after exposure to the lower dose (5 Gy). Volcano maps of the DEGs are shown in Figures 2A–D. To explore potential factors that similarly affected the development of the x-ray exposure–induced changes in transcript expression levels in BMECs, we used Venn diagrams to find 40 DEGs (Table 1) at the intersection of all four exposure groups (Figure 2E).
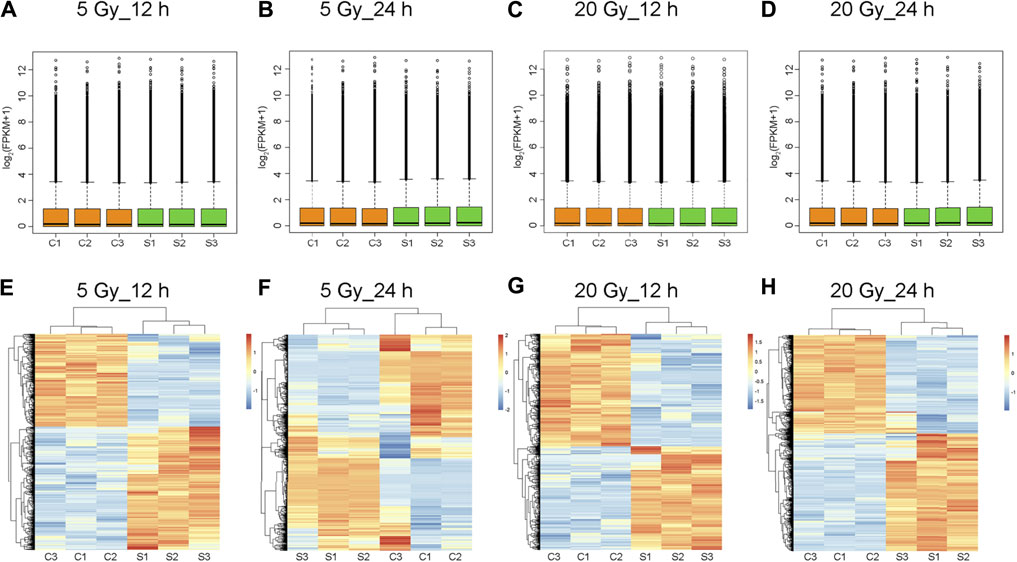
FIGURE 1. Total expression levels and cluster analysis of transcripts. (A–D) Overall transcript expression levels. C1, C2, and C3 represent control groups; S1, S2, and S3, x-ray–treated groups; FPKM, fragments per kilobase of exon model per million reads mapped. (E–H) Transcripts differentially expressed in brain microvascular endothelial cells exposed to the indicated x-ray dose compared with unexposed control cells; 12 h or 24 h is the time after x-ray exposure. Clustered heatmaps show combinations of transcripts with similar natures. Red indicates high expression level; blue, low expression. Log2 (FPKM + 1) values are scaled to different color depths.
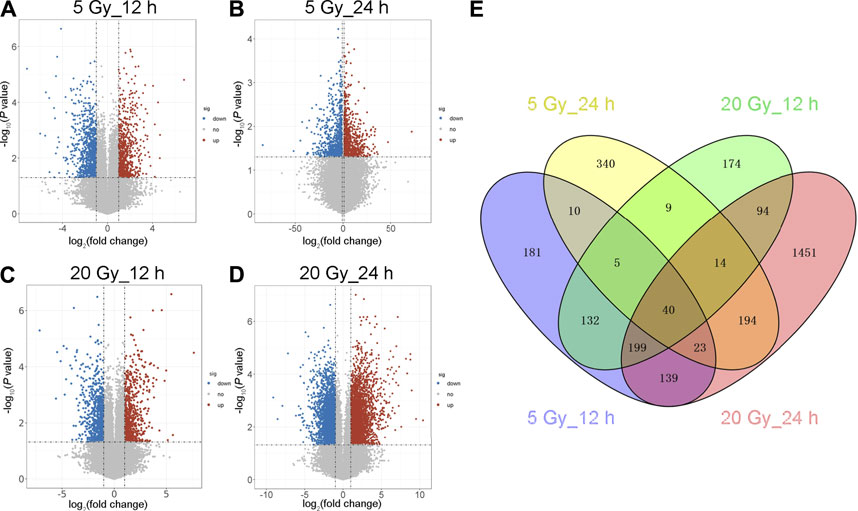
FIGURE 2. Volcano map and Venn diagram of differentially expressed genes (DEGs). (A–D) Volcano maps showing an overview of the differentially expressed transcripts (DEG cut points: corrected-P < 0.05 and absolute fold change ≥1.5) at the indicated x-ray dose (5 or 20 Gy) and time after exposure (12 or 24 h). Red dots represent significantly upregulated genes; blue dots, downregulated genes; gray dots, no significant change. (E) Venn diagram of the DEGs in the four irradiated groups. Blue shows 729 DEGs 12 h after 5 Gy; yellow, 635 DEGs 24 h after 5 Gy; green, 667 DEGs 12 h after 20 Gy; and red, 2,154 DEGs 24 h after 20 Gy. The intersection of the four groups has 40 DEGs.
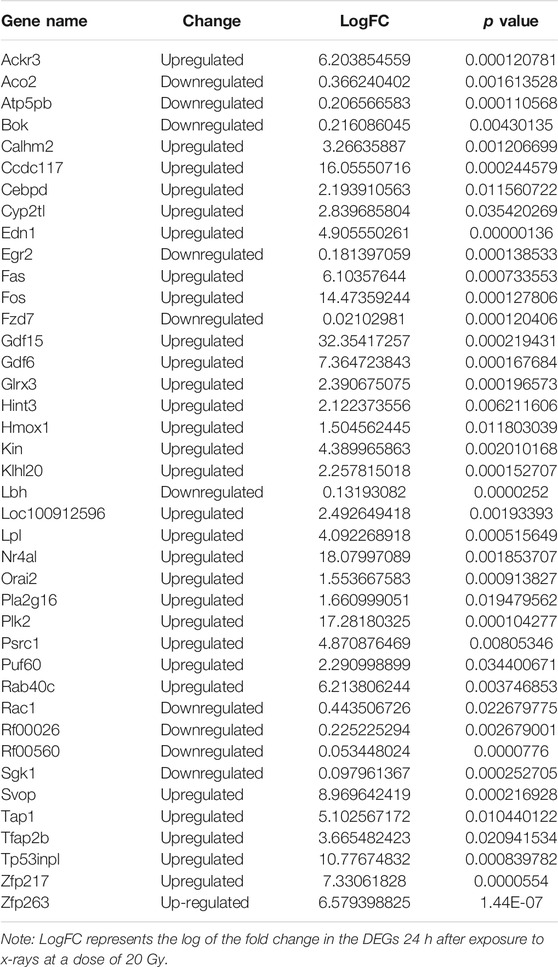
TABLE 1. Genes differentially expressed 12 and 24 h after x-ray exposure at doses of 5 and 20 Gy.
Functional and KEGG Pathway Enrichment Analysis of DEGs
GO functional annotation of these 40 DEGs was performed using the Metascape online tool, and the molecular functions, biological processes, and cellular components enriched for these genes were assessed. The resulting enriched GO terms are shown in Figure 3. KEGG pathway analysis was conducted using the Metascape online tool, and the top 20 enriched pathways are given in Figure 4.
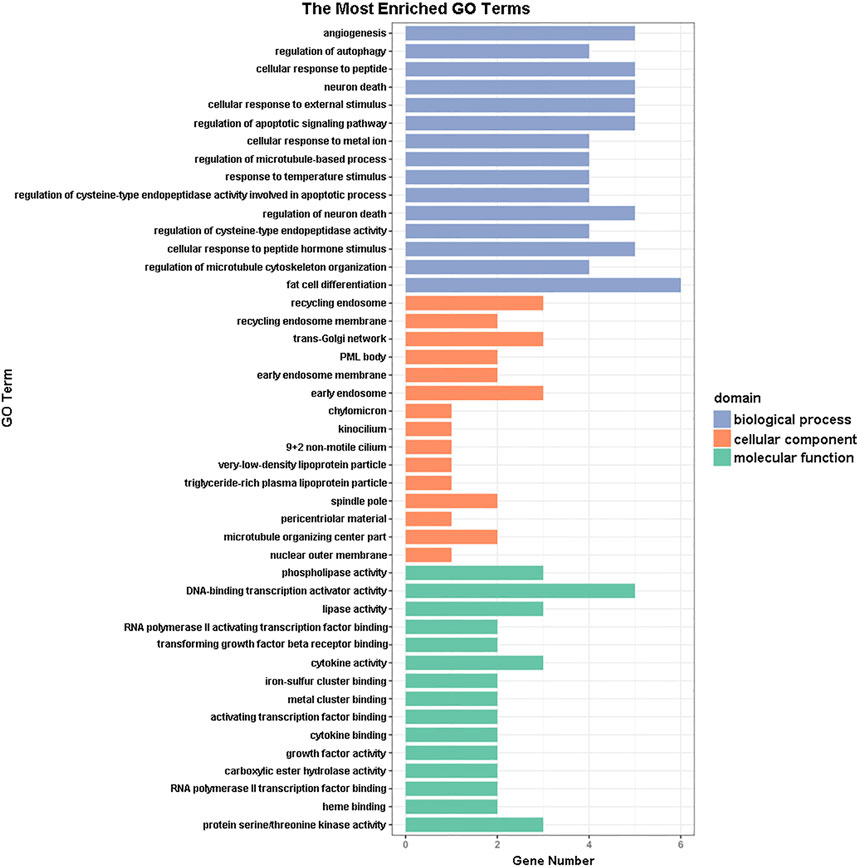
FIGURE 3. Gene ontology (GO) enrichment analysis results. The 15 most enriched GO terms in each of the three GO domains (molecular function, biological process, and cellular component) for the differentially expressed genes.
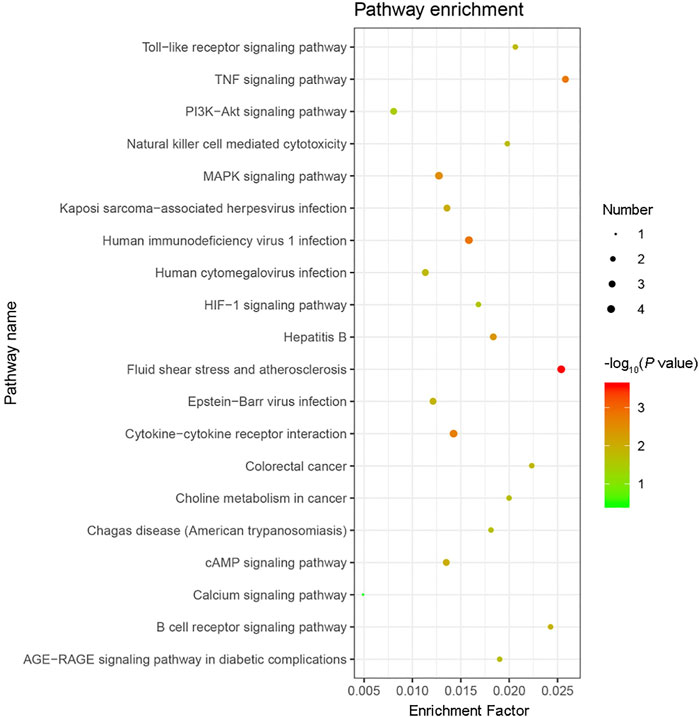
FIGURE 4. KEGG pathway enrichment analysis results. The top 20 KEGG pathways enriched with the 40 differentially expressed genes (DEGs) were analyzed by Metascape. The size of the circle indicates the number of DEGs enriched in the indicated pathway. Colors indicate P values as −log10(P), with red representing higher values, and green lower values (all P values are less than 0.05).
Expression Pattern of DEGs
The changes in the expression levels of the 40 DEGs with exposure time were created using TCseq software and are presented in Figures 5A,B. Six patterns were observed based on the change in expression levels from 1 to 12 h after x-ray exposure and from 13 to 24 h after exposure. Cluster one showed a pattern of continuous upregulation in transcript expression through 24 h, but the change in the slope of the upregulation during the second 12 h was shallower than that during the first 12 h. Cluster two also showed a pattern of continuous upregulation, but the change in the slope of the upregulation during the second 12 h was steeper than that during the first 12 h. Cluster three showed a slight downregulation in transcript expression during the first 12 h but a steep upregulated slope during the second 12 h. Cluster four showed a steep downregulation during the first 12 h but a stable or only slight downregulation in the second 12 h. Cluster five showed continuous transcript downregulation but the slope of the change during the second 12 h was steeper than that during the first 12 h. Cluster six showed a steep upregulation in transcript levels in the first 12 h followed by a steep downregulation in the second 12 h. The expression pattern of each of the 40 DEGs over 24 h following x-ray exposure is given by delivered radiation dose in Table 2.
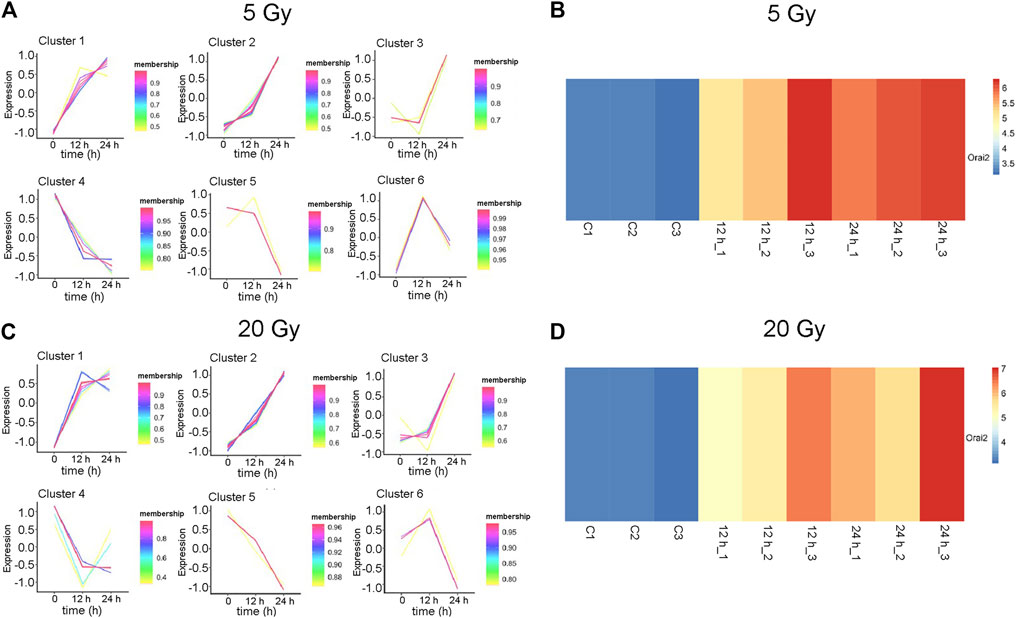
FIGURE 5. Expression patterns of 40 differentially expressed genes (DEGs). (A–B) Six gene expression pattern diagrams were drawn based on the expression levels of 40 DEGs 12 and 24 h after brain microvascular endothelial cells were irradiated with a delivered x-ray dose of (A) 5 Gy or (B) 20 Gy. (C–D) Overview of Orai2 expression profiles are shown as heatmaps for the respective control cells and 12 and 24 h after cells were exposed to 5 Gy (C) or 20 Gy (D). Three biological replicates were used in each group. Blue and red indicate low and high expression, respectively.
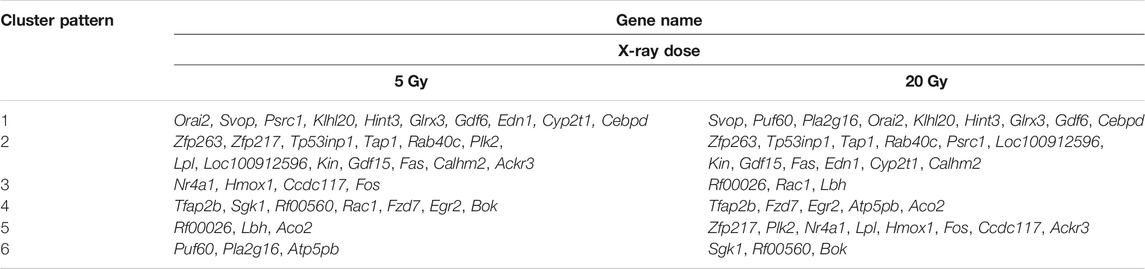
TABLE 2. Differentially expressed gene level patterns over time in brain microvascular endothelial cells, by x-ray exposure dose.
The expression of Orai2 appeared in Cluster pattern one for both radiation doses, indicating that expression levels of Orai2 continued to increase for 24 h after exposure (Figures 5A,B; Table 2). The heat map analysis also showed that expression levels of Orai2 increased in a time-dependent manner after irradiation (Figures 5C,D). Given that Orai proteins form Ca2+ release-activated Ca2+ channels and mainly regulate Ca2+ influx and the Ca2+signaling pathway via SOCE (Moccia et al., 2019), we hypothesized that x-ray exposure would increase Orai2-associated SOCE in BMECs over time.
The Effect of X-Ray Treatment on Orai2-Associated SOCE in BMECs
To test this hypothesis, BMECs mounted on cell culture cover glass were irradiated with delivered doses of 5 Gy or 20 Gy and cultured for 12 h or 24 h. The [Ca2+]i was then determined. Compared with the control group, the magnitude of the Ca2+ influx into irradiated cells was significantly higher after the Ca2+stores were depleted (Figures 6A–D). Meanwhile, the magnitude of the Ca2+ influx through SOCE was significantly higher in cells cultured for 24 h vs. those cultured for 12 h after being irradiated with either 5 Gy or 20 Gy. Thus, SOCE appeared to be enhanced in x-ray–exposed BMECs in a time-dependent manner. Moreover, to elucidate the correlation between Orai and Ca2+ level in x-ray induced BMECs injury, btp-2 was used to non-selectively inhibit Orai. From Figures 6E–H, btp-2 significantly suppressed the increase of SOCE induced by x-ray exposure in BMECs. When compared with the CTL group, which presents calcium influx immediately increased after 1 mM Ca2+ was added, when 10 µM btp-2 was added to a Ca2+-free bath solution, enhancement of SOCE was blocked whether the BMECs were undergone either 5 Gy or 20 Gy of x-ray exposure. Overall, the above results present that Orai2-associated SOCE involves in the changing induced by irradiation in BMECs.
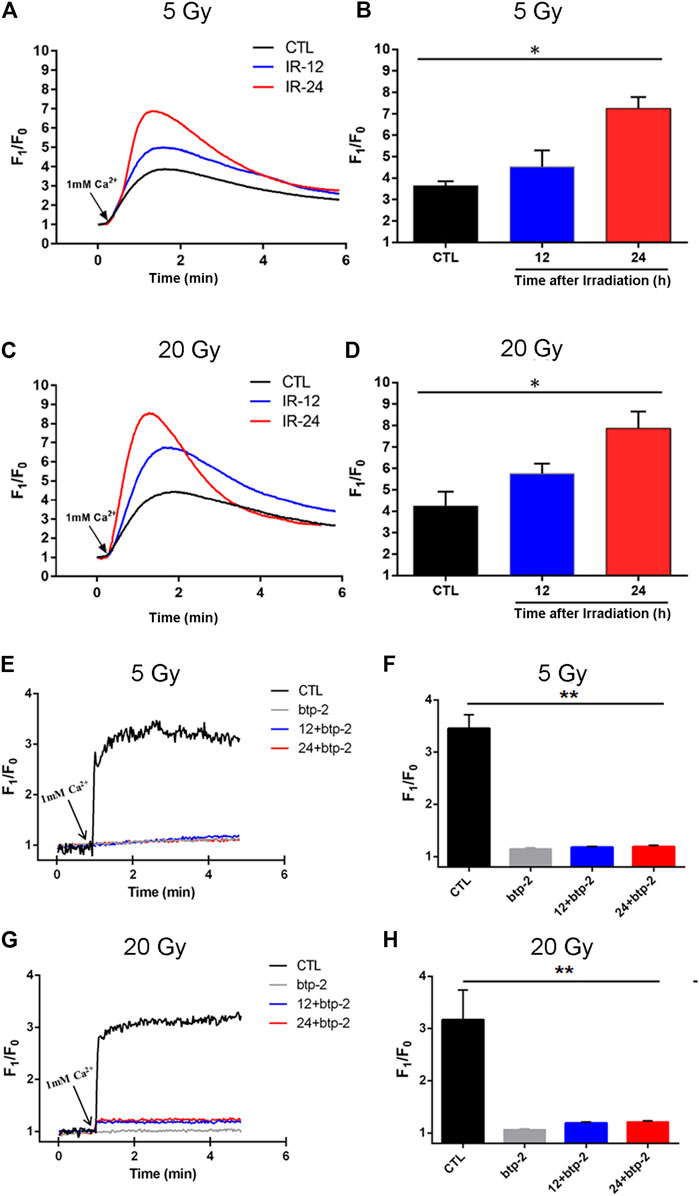
FIGURE 6. Effect of x-ray exposure on Orai2-associated store-operated Ca2+ entry (SOCE) in brain microvascular endothelial cells (BMECs). (A–D) Changes in the magnitude of Ca2+ entry via SOCE in the BMECs. Representative traces (A, C) and summary data (B, D) showing SOCE evoked by the addition of thapsigargin (2 µM) in BMECs 12 h (IR-12) or 24 h (IR-24) after the delivery of 5 Gy (A, B) or 20 Gy (C, D) of ionizing radiation or not (CTL). SOCE was achieved by re-introducing 1 mM Ca2+ to a Ca2+-free bath solution. F1/F0 represents the magnitude of the Ca2+ influx. (E–H) Orai blocking inhibited the enhancement of store-operated Ca2+ entry (SOCE) induced by x-ray exposure in BMECs. Representative traces (E, G) and summary data (F, H) showing thapsigargin-evoked SOCE in BMECs. 10 µM btp-2 was added to a Ca2+ -free bath solution. Data are shown as the mean ± SEM (n = 6). *p < 0.05, **p < 0.01 vs. the control group.
X-ray Exposure Increases the Expression of Orai2 and Decreases the Proliferation Rates of BMECs.
To confirm our earlier RNA-Seq findings indicating an upregulation of Orai2 expression levels following x-ray exposure, we used qPCR and western blotting. As shown in (Figures 7A,B), the mRNA expression levels of Orai2 significantly increased over time in BMECs receiving either dose, consistent with the RNA-Seq results. The protein levels of Orai2 were also significantly increased over time either after exposure of 5 Gy or 20 Gy x-ray, this trend was consistent with that of Orai2 on the mRNA level (Figures 7C–F). Additionally, when the cells were exposed with either 5 Gy or 20 Gy x-ray and continuing cultured for either 12 h or 24 h, the cell proliferation rates were lower than that of control group which was not treated by irradiation in the dose- and time-dependent manner (Supplementary Figure S3). This finding provides supporting evidence for an association between Orai2 and SOCE and cellular injury following x-ray exposure.
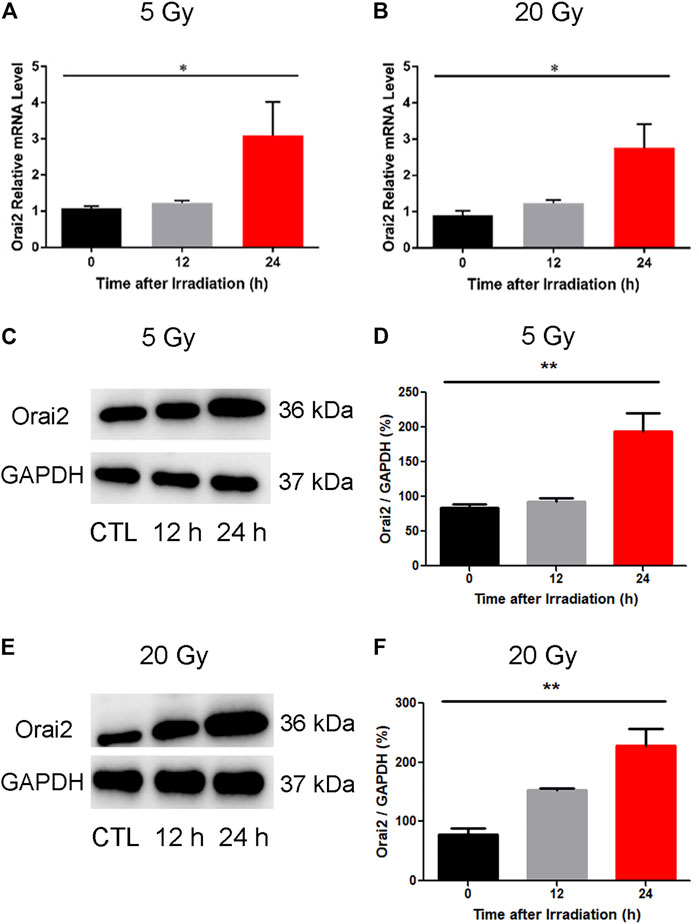
FIGURE 7. Effect of x-ray exposure on the expression of Orai2 on the mRNA and the protein levels. (A–B) Orai2 mRNA expression levels in irradiated BMECs relative to controls are significantly increased 24 h after 5 Gy (A) or 20 Gy (B). Data are shown as the mean ± SEM (n = 3–6). *p < 0.05 vs. the control group. (C–F) Effect of x-ray exposure on Orai2 expression in brain microvascular endothelial cells. Representative images (C, E) and summary data (D, F) showing Orai2 expression in the cells exposed with 5 Gy or 20 Gy x-ray and continuing cultured for 12 h or 24 h. The control group were not irradiated. GAPDH was loading as a control. Data are shown as the mean ± SEM (n = 4). *p < 0.05, **p < 0.01 vs. the control group.
Discussion
Although radiotherapy is used for treating primary intracranial tumors and metastases, the brain is still the major dose-limiting organ owing to the complications of radiation-induced brain injury (Balentova and Adamkov, 2015; Yang et al., 2017). Investigating the dose-dependent pathophysiological development of such brain injury is essential for the management of radiotherapy and the discovery of drug targets to relieve damage. Endothelial cell dysfunction plays a critical role in the pathogenesis of radiation-induced brain injury. Specifically, radiation induces endothelial cell apoptosis, increases vascular permeability, and disrupts the blood-brain barrier (Li et al., 2004; Brown et al., 2005; Jin et al., 2014). However, how the underlying mechanisms of endothelial dysfunction and endothelial function change over time and with dose of radiation remain unclear. We previously investigated the effect of a delivered x-ray dose of 20 Gy on transcript expression in BMECs by using high-throughput sequencing (Wu et al., 2020), a powerful tool for revealing changed genetic patterns and potential therapeutic targets of disease (Ma et al., 2010; Azorsa et al., 2016). The present study followed up on that work and further explored transcript expression alterations with two doses (5 Gy or 20 Gy) and times (12 h or 24 h) following x-ray exposure. High-throughput sequencing results indicated that the number of DEGs after 20 Gy was significantly increased 24 h after the exposure compared with 12 h after exposure at the same dose. The higher dose of radiation caused more DEGs than the lower dose 24 h after exposure. We found 40 DEGs common to both doses and times after exposure and grouped them into six expression changing patterns. GO and KEGG pathway enrichment analyses showed the pathways in which the 40 DEGs were involved. Our results from both RNA-Seq and qPCR analyses also indicated that Orai2 was upregulated with exposure to either dose and remained upregulated for at least 24 h. Moreover, western blotting results showed that Orai2 expression levels were significantly increased over time either after exposure of 5 Gy or 20 Gy x-ray. Our [Ca2+]i assay results suggested that x-ray exposure induced an enhancement of SOCE in a time-dependent manner, and the increase could be inhibited by btp-2, a non-selective inhibitor of Orai. This is, to our knowledge, the first report on how the dose and time following exposure to x-rays influence the genetic profile, including changes in mRNA Orai2 expression, and alter SOCE in BMECs.
Many studies have previously shown that endothelial cell apoptosis is involved in radiation-induced brain injury (Peña et al., 2000; Li et al., 2004). Among the 40 DEGs determined by high-throughput sequencing in the present study, we found several that regulate cell apoptosis. Bok is a member of the Bcl-2 family, which is an important antiapoptotic factor in BMECs (Ueda et al., 2005). Previous studies have reported that Bcl-2 expression is significantly decreased in BMECs during oxygen glucose deprivation–induced injury and ischemia-reperfusion injury (Yang et al., 2012; Chen et al., 2018). Our sequencing results showed that Bok was downregulated in BMECs exposed to x-rays; such downregulation may promote endothelial cell apoptosis. By contrast, Fas, which encodes the Fas cell surface death receptor, was upregulated. Fas plays a key role in the positive regulation of programmed cell death. It has been reported that Fas mediated the apoptotic response of mouse testis cells to ionizing radiation (Embree-Ku et al., 2002). As shown in Table 2, the expression of Fas appeared in the “Cluster two″ pattern, which continued to increase for 24 h after x-ray exposure, for both the 5 Gy and the 20 Gy dose. These results provide supporting evidence that Fas upregulation may enhance cell apoptosis after radiation. However, further study is warranted to verify these changes and our speculation.
Irradiation induces an increase in brain vascular permeability (Yuan et al., 2003; Yuan et al., 2006). In the present study, we found changes in genes related to the regulation of vascular permeability, including atypical chemokine receptor 3 (Ackr3) and frizzled family receptor 7 (Fzd7). Ackr3 encodes a member of the G protein–coupled receptor family. Ackr3 is considered a scavenger of the CXC chemokine CXCL12, which prevents leukocytes from entering the microvasculature of the brain; thus, upregulation of Ackr3 promotes blood-brain barrier impairment and inflammatory brain injury (Cruz-Orengo et al., 2011; Silwedel et al., 2018). Our results showed that Ackr3 was upregulated in BMECs exposed to x-rays. By contrast, Fzd7 was significantly downregulated. The expression pattern of Fzd7 was in “Cluster 4,” which continues to decrease for a least 24 h after x-ray exposure, in both the 5 Gy and the 20 Gy group. Fzd7 encodes frizzled7, a receptor for Wnt proteins. Inhibition or deletion of frizzled7 induces elevated permeability of cells and vessels by regulating the Wnt canonical signaling pathway (Ferreira Tojais et al., 2014). Thus, our findings provide evidence supporting the importance of Fzd7 in the development of radiation-induced brain injury. We speculate that the changes in Ackr3 and Fzd7 together cause an increase in endothelial permeability. However, further experimental study will be needed to confirm these changes and potential effects.
A series of prior studies has shown that Ca2+ influx or even the accumulation of Ca2+ significantly increases vascular permeability and cell apoptosis (Jho et al., 2005; Pinton et al., 2008; Bates, 2010). Radiation induces an increase in [Ca2+]i, with a dose-dependent increase in some types of cells (Decrock et al., 1864; Liu et al.eng, 2017; Bo et al., 2020). Among the many factors that modulate Ca2+influx, Orai2 is an important protein, playing a key role in SOCE (Scremin et al., 2020). Our results showed that Orai2 is upregulated in a time-dependent manner, increasing 12 h after x-ray exposure and increasing further after 24 h, consistent with the observed time-dependent increase in SOCE. It has been reported that the expression level of Orai2 is significantly increased in pulmonary arterial smooth muscle cells from patients with idiopathic pulmonary arterial hypertension (Fernandez et al., 2015). Enhanced expression of the Orai2 transcript has also been found in endothelial cells of lung explants obtained from patients with idiopathic pulmonary arterial hypertension (Saygin et al., 2020). In addition, overexpression of Orai2 is responsible for enhanced SOCE in endothelial progenitor cells and pulmonary artery smooth muscle cells, whereas silencing Orai2 significantly attenuates thapsigargin-induced SOCE in the acute myeloid leukemia cell line HL60 (Diez-Bello et al., 1864; Fernandez et al., 2015; Dragoni et al., 2014; Chen et al., 2017). On the basis of such previous study results, we speculate that the upregulation of Orai2 contributes to the increase in the magnitude of Ca2+ entry via SOCE, leading to increased [Ca2+]i. To test this hypothesis, we used btp-2 to block Orai2 activity. Our results indicated that the enhancement of SOCE induced by x-ray exposure were significantly inhibited by btp-2. Therefore, Orai2 was responsible for the change in SOCE. As to the injury of BMECs induced by the irradiation, we observed the effect of x-ray exposure on proliferation of BMECs by cell counting kit-8 assay (Supplementary Figure S3). When the cells were exposed with either 5 Gy or 20 Gy x-ray and continuing cultured for either 12 h or 24 h, the cell proliferation rates were lower than that of control group which was not treated by irradiation in the dose- and time-dependent manner. Therefore, the result shows that x-ray injury could directly inhibit the growth of BMECs. Moreover, according to the functional and KEGG pathway enrichment analysis of DEGs from the sequencing data, we can also indicate the changed gene transcripts primarily enrich in the biological pathways relating to regulation of autophagy, neuron death, apoptotic process. The above evidence all could support the x-ray induced injury of BMECs. Evidences indicate that intracellular Ca2+ signaling is critical to promote the endothelial repair, among which SOCE most probably therapeutically induce the regrowth of wounded vessels by spur endothelial progenitor cells homing (Moccia et al., 2014). These imply that Orai2-mediated Ca2+ influx enhancement somehow may take part in the developmental injury of BMECs induced by x-ray.
In addition to the upregulation observed in the expression of the Orai2 transcript, the Ca2+ signaling pathway appeared in our results of the KEGG pathway enrichment analysis for the 40 DEGs common to all x-ray–exposed groups in the present study. Besides the Ca2+ signaling pathway, the results of the top 20 pathways enriched for these 40 DEGs also included the MAPK signaling pathway, PI3K-Akt signaling pathway, and HIF-1 signaling pathway. Previous studies have shown that radiation induces MAPK pathway activation, which in turn causes inflammatory and apoptotic responses (Nagaraja and Nagarajan, 2018; Mantawy et al., 2019). Rutin protected against radiation-induced neurotoxicity via regulation of PI3K-Akt signaling pathway (Thabet and Moustafa, 2018). Mounting evidence has shown that HIF-1 inhibition enhances the effect of radiotherapy and decreases the development of radiation-induced necrosis (Meng et al., 2018; Yang et al., 2018). In addition, results from our GO functional enrichment analysis indicated that the 40 DEGs were enriched, among other relevant processes, in the regulation of apoptosis, angiogenesis, and neuron death.
Conclusion
In summary, our findings showed that x-ray exposure induced changes in levels of transcript expression in BMECs, with alterations in some transcripts dose- or time-dependent. We found that the 40 DEGs common to the two doses and times following exposure were enriched in the regulation of the Ca2+signaling pathway, apoptosis, and angiogenesis as well as other processes. Among these DEGs, Orai2 may play a pivotal role in radiation-induced brain injury. We speculate that the observed upregulation in the level of Orai2 expression and the observed enhancement in SOCE lead to intracellular Ca2+ accumulation, which eventually contributes to radiation-induced brain injury. These results provide evidence for a potential molecular mechanism underlying radiation-induced brain injury and may shed new light on approaches to mitigate or prevent such injury.
Data Availability Statement
The data presented in the study are deposited in the GEO repository, accession number GSE166073.
Ethics Statement
The animal study was reviewed and approved by The Animal Experimentation Ethics Committee of Anhui Medical University.
Author Contributions
FX and YW designed and performed experiments. HG, XZ, YH, TH, and BS analyzed the data and co-wrote the manuscript. LZ and QW guided and supervised the whole study. All authors read and approved the final manuscript to be published.
Funding
The present work was supported by the National Natural Science Foundation of China (81570403 to BS, 81903590 to LZ) and the Natural Science Foundation of Anhui Province (1808085MH246 to QW, 1808085QH243 to LZ).
Conflict of Interest
The authors declare that the research was conducted in the absence of any commercial or financial relationships that could be construed as a potential conflict of interest.
Publisher’s Note
All claims expressed in this article are solely those of the authors and do not necessarily represent those of their affiliated organizations, or those of the publisher, the editors and the reviewers. Any product that may be evaluated in this article, or claim that may be made by its manufacturer, is not guaranteed or endorsed by the publisher.
Acknowledgments
We thank the Center for Scientific Research of Anhui Medical University for valuable help in our study.
Supplementary Material
The Supplementary Material for this article can be found online at: https://www.frontiersin.org/articles/10.3389/fmolb.2021.646730/full#supplementary-material
References
Andrews, R. N., Metheny-Barlow, L. J., Peiffer, A. M., Hanbury, D. B., Tooze, J. A., Bourland, J. D., et al. (2017). Cerebrovascular Remodeling and Neuroinflammation Is a Late Effect of Radiation-Induced Brain Injury in Non-human Primates. Radiat. Res. 187 (5), 599–611. doi:10.1667/rr14616.1
Ashburner, M., Ball, C. A., Blake, J. A., Botstein, D., Butler, H., Cherry, J. M., et al. (2000). Gene Ontology: Tool for the Unification of Biology. Nat. Genet. 25 (1), 25–29. doi:10.1038/75556
Azimzadeh, O., Sievert, W., Sarioglu, H., Merl-Pham, J., Yentrapalli, R., Bakshi, M. V., et al. (2015). Integrative Proteomics and Targeted Transcriptomics Analyses in Cardiac Endothelial Cells Unravel Mechanisms of Long-Term Radiation-Induced Vascular Dysfunction. J. Proteome Res. 14 (2), 1203–1219. doi:10.1021/pr501141b
Azorsa, D. O., Turnidge, M. A., and Arora, S. (2016). Data Analysis for High-Throughput RNAi Screening. Methods Mol. Biol. 1470, 247–260. doi:10.1007/978-1-4939-6337-9_19
Balentova, S., and Adamkov, M. (2015). Molecular, Cellular and Functional Effects of Radiation-Induced Brain Injury: A Review. Int. J. Mol. Sci. 16 (11), 27796–27815. doi:10.3390/ijms161126068
Bates, D. O. (2010). Vascular Endothelial Growth Factors and Vascular Permeability. Cardiovasc. Res. 87 (2), 262–271. doi:10.1093/cvr/cvq105
Bo, T., Yamamori, T., Yamamoto, K., Fujimoto, M., Yasui, H., and Inanami, O. (2020). Mitochondrial Fission Promotes Radiation-Induced Increase in Intracellular Ca2+ Level Leading to Mitotic Catastrophe in Mouse Breast Cancer EMT6 Cells. Biochem. Biophys. Res. Commun. 522 (1), 144–150. doi:10.1016/j.bbrc.2019.11.027
Bolger, A. M., Lohse, M., and Usadel, B. (2014). Trimmomatic: a Flexible Trimmer for Illumina Sequence Data. Bioinformatics 30 (15), 2114–2120. doi:10.1093/bioinformatics/btu170
Bray, N. L., Pimentel, H., Melsted, P., and Pachter, L. (2016). Near-optimal Probabilistic RNA-Seq Quantification. Nat. Biotechnol. 34 (5), 525–527. doi:10.1038/nbt.3519
Brown, W. R., Thore, C. R., Moody, D. M., Robbins, M. E., and Wheeler, K. T. (2005). “Vascular Damage after Fractionated Whole-Brain Irradiation in Rats,”. Editor eng, 164, 662–668. doi:10.1667/rr3453.1Radiat. Res.5
Burns, T. C., Awad, A. J., Li, M. D., and Grant, G. A. (2016). Radiation-induced Brain Injury: Low-Hanging Fruit for Neuroregeneration. Neurosurg. Focus 40 (5), E3. doi:10.3171/2016.2.FOCUS161E3
Chen, J., Sysol, J. R., Singla, S., Zhao, S., Yamamura, A., Valdez-Jasso, D., et al. (2017). Nicotinamide Phosphoribosyltransferase Promotes Pulmonary Vascular Remodeling and Is a Therapeutic Target in Pulmonary Arterial Hypertension. Circulation, 135, 1532–1546.
Chen, Y., Wang, L., Zhang, Y., Zhou, Y., Wei, W., and Wan, Z. (2018). The Effect of Therapeutic Mild Hypothermia on Brain Microvascular Endothelial Cells during Ischemia-Reperfusion Injury. Neurocrit. Care 28 (3), 379–387. doi:10.1007/s12028-017-0486-4
Cruz-Orengo, L., Holman, D. W., Dorsey, D., Zhou, L., Zhang, P., Wright, M., et al. (2011). CXCR7 Influences Leukocyte Entry into the CNS Parenchyma by Controlling Abluminal CXCL12 Abundance during Autoimmunity. J. Exp. Med. 208 (2), 327–339. doi:10.1084/jem.20102010
Decrock, E., Hoorelbeke, D., Ramadan, R., Delvaeye, T., De Bock, M., Wang, N., et al. (2017). Calcium, Oxidative Stress and Connexin Channels, a Harmonious Orchestra Directing the Response to Radiotherapy Treatment? Biochim. Biophys. Acta Mol. Cell Res. 1864, 1099–1120. doi:10.1016/j.bbamcr.2017.02.007
Diez-Bello, R., Jardin, I., Salido, G. M., and Rosado, J. A. (2017). Orai1 and Orai2 Mediate Store-Operated Calcium Entry that Regulates HL60 Cell Migration and FAK Phosphorylation. Biochim. Biophys. Acta Mol. Cell Res. 1864 (6), 1064–1070. doi:10.1016/j.bbamcr.2016.11.014
Dragoni, S., Laforenza, U., Bonetti, E., Reforgiato, M., Poletto, V., Lodola, F., et al. (2014). Enhanced Expression of Stim, Orai, and TRPC Transcripts and Proteins in Endothelial Progenitor Cells Isolated from Patients with Primary Myelofibrosis. PLoS One 9 (3), e91099. doi:10.1371/journal.pone.0091099
Embree-Ku, M., Venturini, D., and Boekelheide, K. (2002). Fas Is Involved in the P53-dependent Apoptotic Response to Ionizing Radiation in Mouse Testis1. Biol. Reprod. 66 (5), 1456–1461. doi:10.1095/biolreprod66.5.1456
Fernandez, R. A., Wan, J., Song, S., Smith, K. A., Gu, Y., Tauseef, M., et al. (2015). Upregulated Expression of STIM2, TRPC6, and Orai2 Contributes to the Transition of Pulmonary Arterial Smooth Muscle Cells from a Contractile to Proliferative Phenotype. Am. J. Physiol. Cell Physiol. 308 (8), C581–C593. doi:10.1152/ajpcell.00202.2014
Ferreira Tojais, N., Peghaire, C., Franzl, N., Larrieu-Lahargue, F., Jaspard, B., Reynaud, A., et al. (2014). Frizzled7 Controls Vascular Permeability through the Wnt-Canonical Pathway and Cross-Talk with Endothelial Cell junction Complexes. Cardiovasc. Res. 103 (2), 291–303. doi:10.1093/cvr/cvu133
Guo, J., Zhao, R., Zhou, M., Li, J., Yao, X., Du, J., et al. (2020). TRPP2 and STIM1 Form a Microdomain to Regulate Store-Operated Ca2+ Entry and Blood Vessel Tone. Cell Commun Signal 18 (1), 138. doi:10.1186/s12964-020-00560-7
Jho, D., Mehta, D., Ahmmed, G., Gao, X. P., Tiruppathi, C., Broman, M., et al. (2005). Angiopoietin-1 Opposes VEGF-Induced Increase in Endothelial Permeability by Inhibiting TRPC1-dependent Ca2 Influx. Circ. Res. 96 (12), 1282–1290. doi:10.1161/01.RES.0000171894.03801.03
Jin, X., Liang, B., Chen, Z., Liu, X., and Zhang, Z. (2014). The Dynamic Changes of Capillary Permeability and Upregulation of VEGF in Rats Following Radiation-Induced Brain Injury. Microcirculation 21 (2), 171–177. doi:10.1111/micc.12103
Kanehisa, M., and Goto, S. (2000). KEGG: Kyoto Encyclopedia of Genes and Genomes, (in eng). Nucleic Acids Res. 28 (1), 27–30. doi:10.1093/nar/28.1.27
Kim, D., Langmead, B., and Salzberg, S. L. (2015). HISAT: a Fast Spliced Aligner with Low Memory Requirements. Nat. Methods 12 (4), 357–360. doi:10.1038/nmeth.3317
Lee, A. W. M., Ng, W. T., Chan, J. Y. W., Corry, J., Mäkitie, A., Mendenhall, W. M., et al. (2019). Management of Locally Recurrent Nasopharyngeal Carcinoma. Cancer Treat. Rev. 79, 101890. doi:10.1016/j.ctrv.2019.101890
Li, H. (2011). A Statistical Framework for SNP Calling, Mutation Discovery, Association Mapping and Population Genetical Parameter Estimation from Sequencing Data. Bioinformatics 27 (21), 2987–2993. doi:10.1093/bioinformatics/btr509
Li, Y.-Q., Chen, P., Jain, V., Reilly, R. M., and Wong, C. S. (2004). Early Radiation-Induced Endothelial Cell Loss and Blood-Spinal Cord Barrier Breakdown in the Rat Spinal Cord. Radiat. Res. 161 (2), 143–152. doi:10.1667/rr3117
Liu, X., et al. (2017). Radiation Inhibits Salivary Gland Function by Promoting STIM1 Cleavage by Caspase-3 and Loss of SOCE through a TRPM2-dependent Pathway. Sci. Signal., 10.
Ma, C. X., Luo, J., and Ellis, M. J. (2010). Molecular Profiling of Triple Negative Breast Cancer. Breast Dis. 32 (1-2), 73–84. doi:10.3233/BD-2010-0309
Mantawy, E. M., Said, R. S., and Abdel-Aziz, A. K. (2019). Mechanistic Approach of the Inhibitory Effect of Chrysin on Inflammatory and Apoptotic Events Implicated in Radiation-Induced Premature Ovarian Failure: Emphasis on TGF-β/MAPKs Signaling Pathway. Biomed. Pharmacother. 109, 293–303. doi:10.1016/j.biopha.2018.10.092
Meng, L., Cheng, Y., Tong, X., Gan, S., Ding, Y., Zhang, Y., et al. (2018). Tumor Oxygenation and Hypoxia Inducible Factor-1 Functional Inhibition via a Reactive Oxygen Species Responsive Nanoplatform for Enhancing Radiation Therapy and Abscopal Effects. ACS Nano 12 (8), 8308–8322. doi:10.1021/acsnano.8b03590
Moccia, F., Negri, S., Shekha, M., Faris, P., and Guerra, G. (2019). Endothelial Ca2+ Signaling, Angiogenesis and Vasculogenesis: Just what it Takes to Make a Blood Vessel. Int. J. Mol. Sci. 20 (16). doi:10.3390/ijms20163962
Moccia, F., Tanzi, F., and Munaron, L. (2014). Endothelial Remodelling and Intracellular Calcium Machinery. Cmm 14 (4), 457–480. doi:10.2174/1566524013666131118113410
Nagaraja, S. S., and Nagarajan, D. (2018). Radiation-Induced Pulmonary Epithelial-Mesenchymal Transition: A Review on Targeting Molecular Pathways and Mediators. Cdt 19 (10), 1191–1204. doi:10.2174/1389450119666180207092234
Patel, R. K., and Jain, M. (2012). NGS QC Toolkit: a Toolkit for Quality Control of Next Generation Sequencing Data. PLoS One 7 (2), e30619. doi:10.1371/journal.pone.0030619
Peña, L. A., Fuks, Z., and Kolesnick, R. N. (2000). “Radiation-induced Apoptosis of Endothelial Cells in the Murine central Nervous System: protection by Fibroblast Growth Factor and Sphingomyelinase Deficiency. Cancer Res. 60, 321–327.
Pertea, M., Pertea, G. M., Antonescu, C. M., Chang, T.-C., Mendell, J. T., and Salzberg, S. L. (2015). StringTie Enables Improved Reconstruction of a Transcriptome from RNA-Seq Reads. Nat. Biotechnol. 33 (3), 290–295. doi:10.1038/nbt.3122
Pinton, P., Giorgi, C., Siviero, R., Zecchini, E., and Rizzuto, R. (2008). Calcium and Apoptosis: ER-Mitochondria Ca2+ Transfer in the Control of Apoptosis. Oncogene 27 (50), 6407–6418. doi:10.1038/onc.2008.308
Robinson, M. D., McCarthy, D. J., and Smyth, G. K. (2010). edgeR: a Bioconductor Package for Differential Expression Analysis of Digital Gene Expression Data. Bioinformatics 26 (1), 139–140. doi:10.1093/bioinformatics/btp616
Saygin, D., Tabib, T., Bittar, H. E. T., Valenzi, E., Sembrat, J., Chan, S. Y., et al. (2020). Transcriptional Profiling of Lung Cell Populations in Idiopathic Pulmonary Arterial Hypertension. Pulm. Circ. 10 (1). Jan-Mar 2020. doi:10.1177/2045894020908782
Scremin, E., Agostini, M., Leparulo, A., Pozzan, T., Greotti, E., and Fasolato, C. (2020). ORAI2 Down-Regulation Potentiates SOCE and Decreases Aβ42 Accumulation in Human Neuroglioma Cells. Int. J. Mol. Sci. 21 (15). doi:10.3390/ijms21155288
Silwedel, C., Speer, C. P., Haarmann, A., Fehrholz, M., Claus, H., Buttmann, M., et al. (2018). Novel Insights into Neuroinflammation: Bacterial Lipopolysaccharide, Tumor Necrosis Factor α, and Ureaplasma Species Differentially Modulate Atypical Chemokine Receptor 3 Responses in Human Brain Microvascular Endothelial Cells. J. Neuroinflammation 15 (1), 156. doi:10.1186/s12974-018-1170-0
Sun, X.-S., Li, X.-Y., Chen, Q.-Y., Tang, L.-Q., and Mai, H.-Q. (2019). Future of Radiotherapy in Nasopharyngeal Carcinoma. Bjr 92 (1102), 20190209. doi:10.1259/bjr.20190209
Thabet, N. M., and Moustafa, E. M. (2018). Protective Effect of Rutin against Brain Injury Induced by Acrylamide or Gamma Radiation: Role of PI3K/AKT/GSK-3β/NRF-2 Signalling Pathway. Arch. Physiol. Biochem. 124 (2), 185–193. doi:10.1080/13813455.2017.1374978
Tripathi, M., Ahuja, C., Mukherjee, K., Kumar, N., Dhandapani, S., Dutta, P., et al. (2019). The Safety and Efficacy of Bevacizumab for Radiosurgery - Induced Steroid - Resistant Brain Edema; Not the Last Part in the Ship of Theseus, (in eng). Neurol. India 67 (5), 1292–1302. doi:10.4103/0028-3886.271242
Ueda, Y., Nakagawa, T., Kubota, T., Ido, K., and Sato, K. (2005). Glioma Cells under Hypoxic Conditions Block the Brain Microvascular Endothelial Cell Death Induced by Serum Starvation. J. Neurochem. 95 (1), 99–110. doi:10.1111/j.1471-4159.2005.03343.x
Vaeth, M., Yang, J., Yamashita, M., Zee, I., Eckstein, M., Knosp, C., et al. (2017). ORAI2 Modulates Store-Operated Calcium Entry and T Cell-Mediated Immunity. Nat. Commun. 8, 14714. doi:10.1038/ncomms14714
Wang, T. M., Shen, G. P., Chen, M. Y., Zhang, J. B., Sun, Y., He, J., et al. (2019). Genome-Wide Association Study of Susceptibility Loci for Radiation-Induced Brain Injury. J. Natl. Cancer Inst. 111 (6), 620–628. doi:10.1093/jnci/djy150
Wang, Y.-L., Chen, S., Xiao, H.-F., Li, Y., Wang, Y., Liu, G., et al. (2018). Differentiation between Radiation-Induced Brain Injury and Glioma Recurrence Using 3D pCASL and Dynamic Susceptibility Contrast-Enhanced Perfusion-Weighted Imaging. Radiother. Oncol. 129 (1), 68–74. doi:10.1016/j.radonc.2018.01.009
Wang, Z. G., Guo, L. L., Ji, X. R., Yu, Y. H., Zhang, G. H., and Guo, D. L. (2019). Transcriptional Analysis of the Early Ripening of 'Kyoho' Grape in Response to the Treatment of Riboflavin. Genes (Basel) 10 (7). doi:10.3390/genes10070514
Wu, Q., Fang, Y., Zhang, X., Song, F., Wang, Y., Chen, H., et al. (2020). Effect of X-Rays on Transcript Expression of Rat Brain Microvascular Endothelial Cells: Role of Calcium Signaling in X-ray-induced Endothelium Damage. Biosci. Rep. 40 (4). doi:10.1042/BSR20193760
Yang, L., Yang, J., Li, G., Li, Y., Wu, R., Cheng, J., et al. (2017). Pathophysiological Responses in Rat and Mouse Models of Radiation-Induced Brain Injury. Mol. Neurobiol. 54 (2), 1022–1032. doi:10.1007/s12035-015-9628-x
Yang, R., Duan, C., Yuan, L., Engelbach, J. A., Tsien, C. I., Beeman, S. C., et al. (2018). Inhibitors of HIF-1α and CXCR4 Mitigate the Development of Radiation Necrosis in Mouse Brain. Int. J. Radiat. Oncol. Biol. Phys. 100 (4), 1016–1025. doi:10.1016/j.ijrobp.2017.12.257
Yang, W., Li, L., Huang, R., Pei, Z., Liao, S., and Zeng, J. (2012). Hypoxia Inducible Factor-1alpha Mediates protection of DL-3-N-Butylphthalide in Brain Microvascular Endothelial Cells against Oxygen Glucose Deprivation-Induced Injury, (in eng). Neural Regen. Res. 7 (12), 948–954. doi:10.3969/j.issn.1673-5374.2012.12.012
Yuan, H., Gaber, M. W., Boyd, K., Wilson, C. M., Kiani, M. F., and Merchant, T. E. (2006). Effects of Fractionated Radiation on the Brain Vasculature in a Murine Model: Blood-Brain Barrier Permeability, Astrocyte Proliferation, and Ultrastructural Changes. Int. J. Radiat. Oncol. Biol. Phys. 66 (3), 860–866. doi:10.1016/j.ijrobp.2006.06.043
Yuan, H., Gaber, M. W., McColgan, T., Naimark, M. D., Kiani, M. F., and Merchant, T. E. (2003). Radiation-induced Permeability and Leukocyte Adhesion in the Rat Blood-Brain Barrier: Modulation with Anti-ICAM-1 Antibodies. Brain Res. 969 (1-2), 59–69. doi:10.1016/s0006-8993(03)02278-9
Keywords: x-ray, high-throughput sequencing, brain microvascular endothelial cell, Orai2, store-operated calcium entry
Citation: Xu F, Wang Y, Gao H, Zhang X, Hu Y, Han T, Shen B, Zhang L and Wu Q (2021) X-Ray Causes mRNA Transcripts Change to Enhance Orai2-Mediated Ca2+ Influx in Rat Brain Microvascular Endothelial Cells. Front. Mol. Biosci. 8:646730. doi: 10.3389/fmolb.2021.646730
Received: 28 December 2020; Accepted: 05 March 2021;
Published: 14 September 2021.
Edited by:
Peng Zhang, Institute of ENT and Shenzhen Key Laboratory of ENT, ChinaReviewed by:
Limei Liu, Peking University Health Science Centre, ChinaWei Han, Hefei Institutes of Physical Science (CAS), China
Copyright © 2021 Xu, Wang, Gao, Zhang, Hu, Han, Shen, Zhang and Wu. This is an open-access article distributed under the terms of the Creative Commons Attribution License (CC BY). The use, distribution or reproduction in other forums is permitted, provided the original author(s) and the copyright owner(s) are credited and that the original publication in this journal is cited, in accordance with accepted academic practice. No use, distribution or reproduction is permitted which does not comply with these terms.
*Correspondence: Lesha Zhang, zhanglesha@ahmu.edu.cn; Qibing Wu, wuqibing@ahmu.edu.cn
†These authors have contributed equally to this work and share first authorship