 Yimo Zhou1,2,3,4
 Yuesong Pan1,2,3,4
 Hongyi Yan1,2,3,4Yilong Wang1,2,3,4
 Zixiao Li1,2,3,4
 Xingquan Zhao1,2,3,4Hao Li1,2,3,4Xia Meng1,2,3,4
 Chunxue Wang1,2,3,4
 Liping Liu1,2,3,4
 Yongjun Wang1,2,3,4*
- 1Department of Neurology, Beijing Tiantan Hospital, Capital Medical University, Beijing, China
- 2China National Clinical Research Center for Neurological Diseases, Beijing, China
- 3Center of Stroke, Beijing Institute for Brain Disorders, Beijing, China
- 4Beijing Key Laboratory of Translational Medicine for Cerebrovascular Disease, Beijing, China
Background: The triglyceride glucose index (TyG index) has been proposed as a simple and credible surrogate marker of insulin resistance. However, it is unclear whether TyG index correlates with adverse clinical outcomes in patients with ischemic stroke. Accordingly, this study aimed to explore the relationship between baseline TyG index and clinical outcomes of ischemic stroke individuals.
Methods: We included eligible subjects with ischemic stroke from the China National Stroke Registry II for the current analysis. TyG index was calculated and divided into quartiles to explore the relationship with the outcomes of ischemic stroke. Outcomes included stroke recurrence, all-cause mortality, poor functional outcome at 12 months, and neurologic worsening at discharge. Multivariable Cox regression and logistic regression models were performed to explore the correlation of baseline TyG index with the outcomes.
Results: Among the 16,310 patients enrolled in the study, the average age was 64.83 ± 11.9 years, and 63.48% were men. The median TyG index was 8.73 (interquartile range, 8.33–9.21). After adjustment for multiple potential covariates, the fourth quartile of TyG index was associated with an increased risk of stroke recurrence (adjusted HR, 1.32; 95% CI, 1.11–1.57; P = 0.002), all-cause mortality (adjusted HR, 1.25; 95%CI, 1.06–1.47; P = 0.01) at 12-month follow-up, and neurological worsening (adjusted OR, 1.26; 95% CI, 1.02–1.55; P = 0.03) at discharge, but not poor functional outcome compared with the first quartile.
Conclusion: TyG index representing insulin resistance was associated with an increased risk of stroke recurrence, all-cause mortality, and neurologic worsening in patients with ischemic stroke.
Introduction
Stroke is one of the most significant causes of death and disability, with most of the burden in low-income and middle-income countries (1). Improving poststroke outcomes is an urgent issue worldwide. Thus, it is of great importance to identify those stroke patients at high risk for poor outcomes and deliver effective secondary preventions. Insulin resistance (IR) is prevalent in patients with stroke (2). Former studies revealed that IR facilitates the progression of ischemic stroke (IS) through promoting atherosclerosis (3–5), inducing hemodynamic disturbances (6), and accelerating platelet adhesion, activation, and aggregation (7–9), which could trigger stroke recurrence in individuals with IS.
Two large randomized trials have suggested that treatment with pioglitazone, an insulin-sensitizing agent, reduces cardiovascular risk in diabetic patients or nondiabetic patients with IR who were diagnosed with an IS or a transient ischemic attack (TIA) (10, 11). In this sense, IR would be a new target for secondary prevention of stroke for patients with IS or TIA. Recently, a number of studies proved that IR estimated by the homeostasis model assessment of insulin resistance (HOMA-IR) is independently correlated with unfavorable clinical outcomes in patients with IS (12–14). In this regard, the detection of IR in patients after IS could have clinical relevance in secondary prevention of stroke. Although useful in research, the use of HOMA-IR is substantially limited by the need for insulin measurement in clinical practice.
Lately, the triglyceride glucose index (TyG index) has been proposed as a simple surrogate marker of IR (15). Indeed, a number of studies have shown its credibility through assessing by HOMA-IR and hyperinsulinemic-euglycemic clamp test (15–17). Although previous studies have shown that TyG index is associated with carotid atherosclerosis (18), coronary artery calcification (19), coronary artery stenosis (20), and high risk of cardiovascular disease (21), it is not known whether TyG index correlates with adverse clinical outcomes in patients with IS. Moreover, the independent correlation between TyG and prevalent IS in a general population has been uncovered (22). Therefore, this study aimed to explore the relationship between baseline TyG index and clinical outcomes for IS patients through a nationwide prospective registry study.
Materials and Methods
Study Cohort and Data Collection
The China National Stroke Registry (CNSR) is a national hospital-based, prospective stroke registry. The registry consists of 3 phases to date. Data collected from September 2007 to August 2008 were used as CNSR phase 1 (CNSR I). This study was conducted on the basis of CNSR phase 2 (CNSR II) which was launched in 2012 aiming at evaluating stroke care delivery in clinical practice (23). CNSR phase 3 has been launched in 2015 and is still in progress (24). The criteria for site selection in CNSR I have been previously published (25). The same criteria were used for selection in CNSR II in order for the hospital characteristics to be in line with those in CNSR I. Patients were eligible if they met the following criteria: age 18 years or older; diagnosis within seven days of the index event of IS, TIA, spontaneous intracerebral hemorrhage, or subarachnoid hemorrhage confirmed by brain imaging; or direct hospital admission from a physician's clinic or emergency department. Among the 25,018 patients in the CNSR II, 19,604 were diagnosed with IS on admission. Ultimately, 16,310 subjects were included in the analysis of the study after excluding patients without data of fasting triglyceride or fasting glucose at admission (n = 1,020) and lost to follow-up at 12 months (n = 2,274; Figure 1).
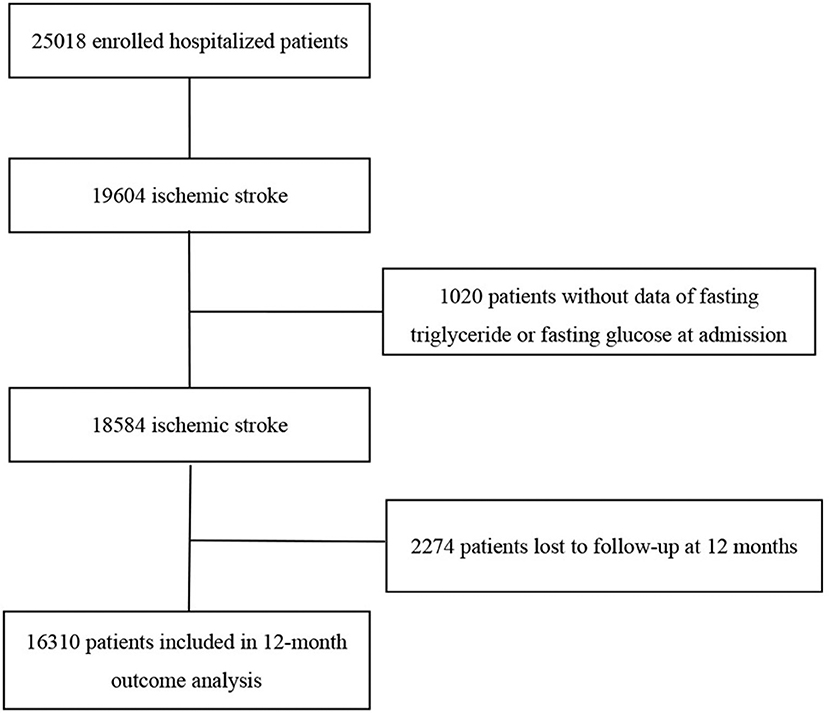
Figure 1. Patient selection flow diagram.
Baseline information, including patients' demographics, vascular risk factors, pre-hospital medication history, related laboratory data, and treatment, were collected by trained research coordinators at each participating hospital. Patients were defined as obese according to body mass index (BMI) for the Asian population (BMI ≥ 27.5 kg/m2) provided by the World Health Organization Expert Consultation panel for appropriate BMI. Diabetic patients were classified if either of the following criteria was met: (1) self-reported physician diagnosis of diabetes mellitus; (2) hypoglycemic medications before hospitalization.
The CNSR II study was approved by the Central Institutional Review Board in Beijing Tiantan Hospital, and all written informed consents were obtained from patients or their legally authorized representatives.
Triglyceride Glucose Index Evaluation
Fasting blood samples were drawn within 24 h of admission, triglyceride and glucose levels were tested by automated enzymatic method at each research center. TyG index was calculated as ln[fasting triglycerides (mg/dl) × fasting glucose (mg/ dl)/2] (16). All measurements were performed by trained laboratory personnel blinded to subjects' clinical situations.
Patient Follow-up and Outcome Evaluation
Patients enrolled were followed up by telephone interview at 12-month after disease onset according to the protocol of CSNR II study. Clinical outcomes, including recurrent stroke, all-cause mortality, and modified Rankin Scale (mRS) score, were obtained by trained research coordinators who were blinded to subjects' baseline characteristics. The recurrent stroke included IS, intracranial hemorrhage, and subarachnoid hemorrhage. Poor functional outcome was defined as mRS scores of 3 to 6. The poststroke clinical course during hospitalization was also evaluated using neurologic worsening, which was defined as a ≥2-point increase in National Institutes of Health Stroke Scale (NIHSS) score hospitalization compared with the NIHSS score on admission (26).
Statistical Analysis
Continuous variables are described as means ± standard deviations (SDs) or medians with interquartile range (IQRs) and categorical variables as proportions. The demographic and clinical characteristics stratified by TyG index quartiles were compared by using the χ2 test for categorical variables and analysis of variance or Kruskal–Wallis test for continuous variables, respectively. In the main analysis of the study, the TyG index was examined as quartiles to explore the relationship with the outcomes of IS. Taking the lowest quantiles of TyG index as the reference, we performed Cox regression models to explore the correlation of the categories of TyG index with stroke recurrence and all-cause mortality and logistic regression models for its relationship with poor functional outcome at 12 months and neurologic worsening during hospitalization. Adjusted hazard ratios (HR) or odds ratios (OR) with their 95% confidence intervals (CIs) were estimated in each regression model. Multivariable models were adjusted for characteristics that were significantly different at baseline. Besides, to further evaluate the pattern and magnitude of the relationship between TyG index on a continuous scale and the risk of stroke recurrence, all-cause mortality, poor functional outcome, and neurologic worsening, we used a logistic regression model or Cox regression model with restricted cubic splines for TyG index. In the sensitivity analysis, we excluded patients with diabetes or obesity. The TyG index was evaluated as continuous to investigate a potential dose-response relationship with the outcomes of IS.
All statistical analyses were conducted with SAS software version 9.4 (SAS Institute Inc., Cary, NC). All P values were 2-sided, with P values < 0.05 considered significant.
Results
Baseline Characteristics
The included patients in the study were stratified into four groups based on their TyG index levels. The baseline characteristics of the patients according to the TyG index quartiles are demonstrated in Table 1. The average age of the patients was 64.83 ± 11.9 years, and 63.48% were men. The median TyG index was 8.73 (IQR, 8.33–9.21). The patients with higher TyG index tended to have higher systolic and diastolic blood pressure and lower frequency of smoking and were more likely to receive antihypertensive drugs and hypoglycemia drugs before admission. Besides, significant differences in the history of hypertension, atrial fibrillation, diabetes mellitus, and previous stroke were also observed among groups. Parameters related to glucose metabolism (BMI, triglyceride, and fasting blood pressure at admission) increased as the TyG index increased.

Table 1. Baseline characteristics according to TyG index quartiles.
12-Month Clinical Outcomes According to TyG Index
Table 2 shows the association between clinical outcomes of IS and TyG index quartiles. Adjusted hazard ratios/odds ratios with 95% confidence intervals of the TyG index for clinical outcomes are presented in Table 2. The relationship between the TyG index and the clinical outcomes were explored by categorizing the TyG index into quartiles using the first quartile as the reference. After adjusting for multivariate, it was found that patients with a TyG index of Q4 (≥9.21) were associated with increased risk of stroke recurrence and all-cause mortality at 12-month follow-up (adjusted HR, 1.32; 95% CI, 1.11–1.57; P = 0.002 and adjusted HR, 1.25; 95%CI, 1.06–1.47; P = 0.01, respectively) compared with patients with a TyG index of Q1 (≤ 8.33). After adjustment for age, sex, and potential confounders in a logistic regression model, the patients with a TyG index of Q4 were associated with an elevated risk of neurological worsening at discharge (adjusted OR, 1.26; 95% CI, 1.02–1.55; P = 0.03) compared with patients with a TyG index of Q1. However, no significant association was observed between TyG index and poor functional outcomes at 12-month follow-up in patients with IS.
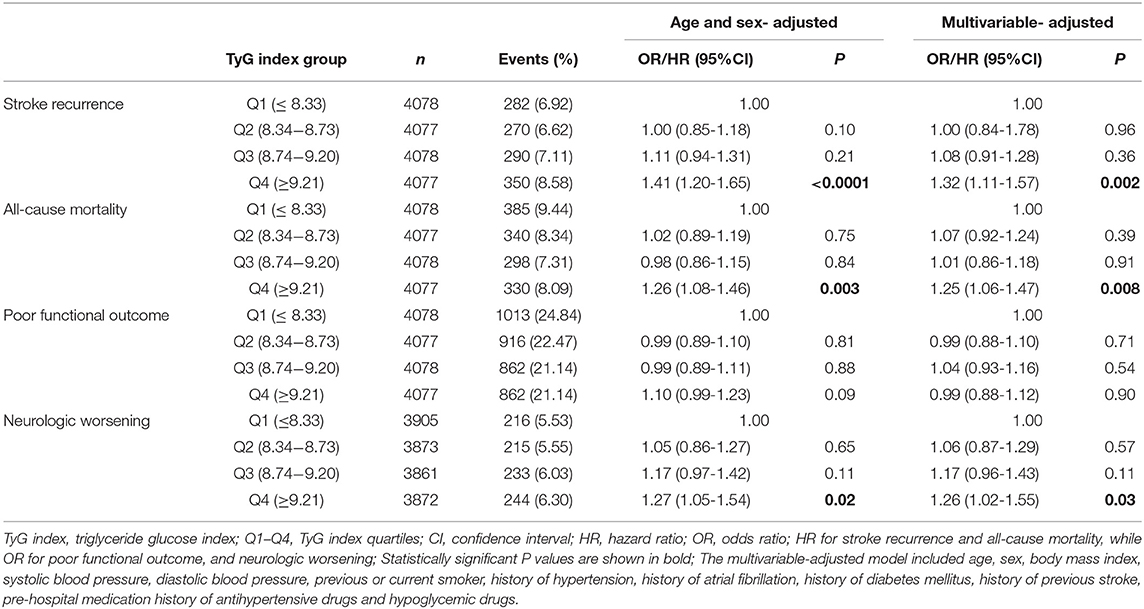
Table 2. Adjusted odds ratios/hazard ratios of TyG index quartiles for clinical outcomes.
Cox/logistic regression analyses with restricted cubic spline further demonstrated that higher baseline TyG index levels significantly associated with increased risk of recurrent stroke (Figure 2A), all-cause mortality (Figure 2B), and neurological worsening (Figure 2D); While no significant association was found between TyG index and poor functional outcomes (Figure 2C).
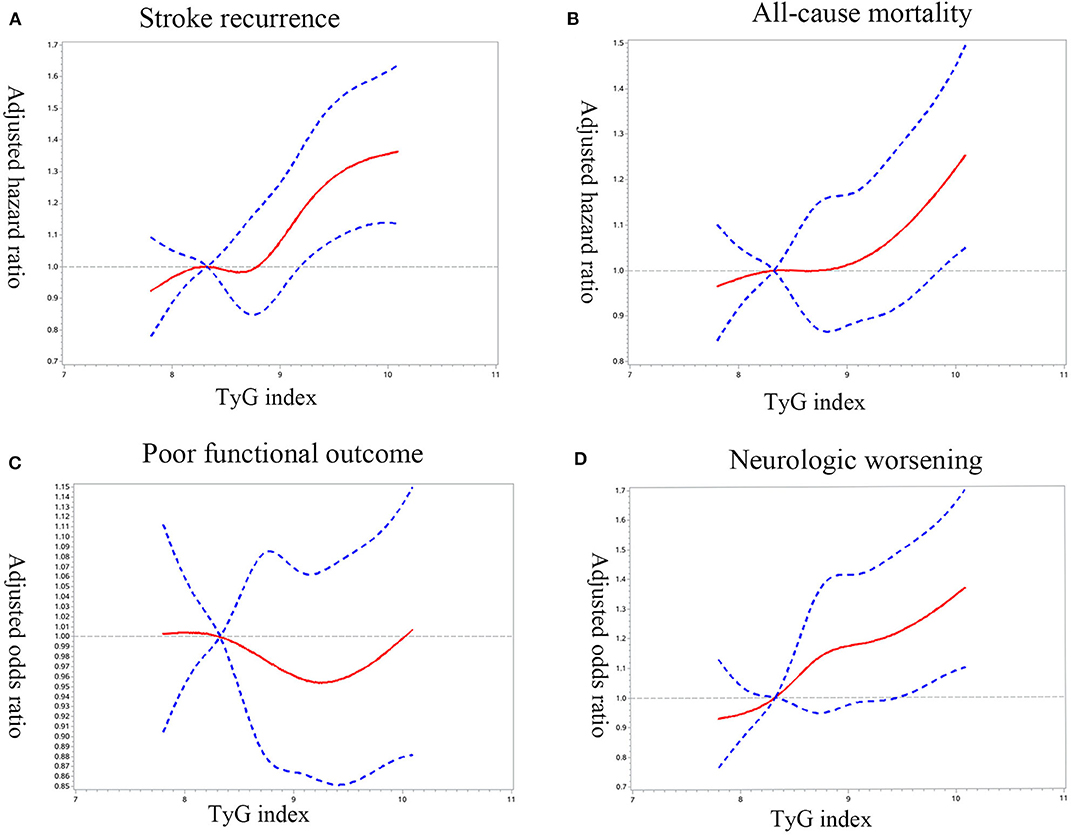
Figure 2. Adjusted hazard ratios/odds ratio of ischemic stroke prognosis according to triglyceride glucose index (TyG index) on admission. Adjusted hazard ratios/odds ratio of (A) stroke recurrence, (B) all-cause mortality, (C) poor functional outcome, and (D) neurologic worsening according to TyG index. HR/ORs were obtained by restricted cubic spline Cox/logistic regression after adjustment for confounding factors, with the first quartile of TyG index as reference. The solid red line indicates the adjusted hazard ratio/odds ratio and the dashed blue lines the 95% confidence interval bands.
Sensitivity Analysis
In the sensitivity analyses of continuous TyG index, the significant association was observed between TyG index (per unit) and stroke recurrence (adjusted HR, 1.19; 95% CI, 1.09–1.30; P < 0.0001) and between all-cause mortality (adjusted HR, 1.12; 95% CI, 1.02–1.22; P = 0.01) and neurological worsening (adjusted OR, 1.19; 95% CI, 1.07–1.32; P = 0.001) after adjusting for multiple variables (Table 3).
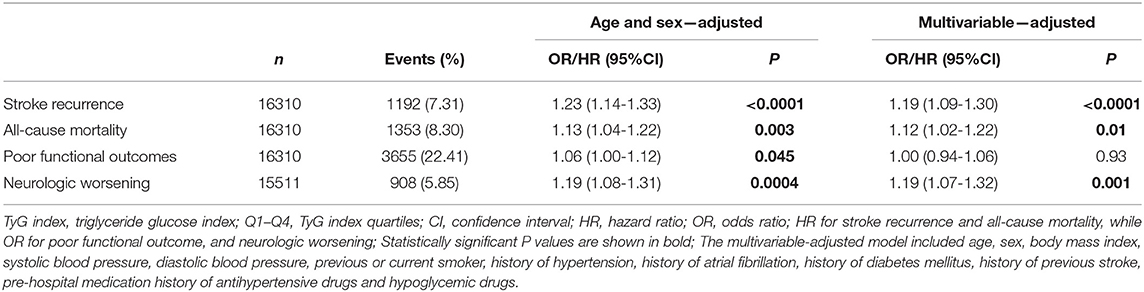
Table 3. Adjusted odds ratios/hazard ratios of TyG index as continuous variable (per unit) for clinical outcomes.
Finally, we assessed the aforementioned associations after excluding patients with obesity or diabetes. The multivariable-adjusted HR/OR of the above-described clinical outcomes showed a similar association for the TyG index even in nonobese patients (Supplementary Table 1) and nondiabetic patients (Supplementary Table 2). However, no significant association was observed between TyG index and all-cause mortality in nondiabetic patients.
Discussion
The major findings of the study are as follows. We found that IR, estimated by TyG index, was significantly associated with an increased risk of 12-month stroke recurrence, all-cause mortality, and neurologic worsening during hospitalization without accelerating 12-month poor functional outcome in patients suffered from IS.
Various pathophysiological pathways may underlie the association between IR and IS. Firstly, IR has been proposed to facilitate the pathogenesis of atherosclerosis (27). IR enhances the pathologic process of vascular endothelia cell, macrophages, and smooth muscle cells via inflammation, which contributes to the progression of atherosclerosis (28–30). Moreover, atherogenic impact through atherogenic dyslipidemia and the impaired fibrinolysis could be exerted by IR (31–33). Secondly, a body of researches has revealed that IS plays an important role in platelet adhesion, activation, and aggregation, which are associated with vessel occlusion and involved in IS incidents (34–37). Furthermore, Lundstrom et al. found that a high level of IR was a pre-requisite for high on-treatment platelet reactivity in minor IS or TIA patients prescribed clopidogrel as secondary prevention, which may influence the efficacy of antiplatelet treatment and lead to poor prognosis (38). Thirdly, IR causes hemodynamic disturbance. An attenuate cerebrovascular reserve (CVR) has been observed in patients with diabetes or non-diabetic IR (39, 40). Previous studies discovered that IR is involved in CVR through Bayliss effect, and chemical, neuronal, and metabolic mechanisms (41–44). Last, IR enlarges the role of modifiable risk factors in IS, such as hypertension, diabetes, dyslipidemia, and cigarette smoking (45–47). It may accelerate the progression of atherosclerosis by modifying the risk factors through inflammation and oxidative stress mechanisms and damage the cerebral metabolism (48, 49).
To date, previous studies mostly used HOMA-IR for the assessment of IR to evaluate the correlation between IR and clinical outcomes in patients with IS (13, 50, 51). However, it is usually impractical in clinical practice and large-scale research because of the need to measure insulin level.
In recent years, TyG index has been proposed to estimate insulin sensitivity by simply assessing circulating triglyceride and glucose concentration in routine clinical practice (15). Several potential mechanisms have been suggested to explain the correlation between TyG index and IR. It has been well established that hyperglycemia and dyslipidemia are two basic hallmarks of IR. IR may play a vital role in the development of hyperglycemia and dyslipidemia, which can further aggravate IR. As for whole-body glucose homeostasis, the expression and activity of glucose transporter are modulated by IR in multiple tissues, promoting glucose accumulation in circulation and forming hyperglycemia (52). Moreover, hyperglycemia may, in turn, impair insulin sensitivity, resulting in a vicious circle toward IR (53). With regard to lipid profiles, IR result in excessive release of free fatty acid into circulation by unstrained lipolysis (54, 55). The increased flux of free fatty acids increases hepatic triglyceride synthesis in the liver and release in plasma, which gives rise to hypertriglyceridemia and subsequent metabolic syndrome (54, 55). Meanwhile, increased circulating fatty acids may also inhibit insulin activity of glucose uptake in peripheral tissues and lipolysis, leading to exacerbation of IR and the development of another vicious circle between IR and dyslipidemia (56). Therefore, hypertriglyceridemia is considered as an excellent reflection of the IR condition (54). Overall, TyG index, the product of fasting triglyceride and glucose, could be used as a surrogate marker for the assessment of IR.
Although hyperglycemia and dyslipidemia underlie the mechanism of IR as we mentioned above, it may be inappropriate applying fasting glucose or triglycerides alone as surrogate estimates for IR. It is known that glucose metabolism is maintained within the normal range as long as hyperinsulinemia is efficient to surmount IR (57). The Metabolic Syndrome in Men study demonstrated that insulin sensitivity was already decreased substantially within the normal range of fasting plasma glucose (58). Therefore, fasting glucose alone may not be an accurate estimate for IR. As for triglyceride, a study conducted in a large Chinese population made a head-to-head comparison between lipid (including triglyceride), apolipoprotein measures, lipid ratios, lipid accumulation product, visceral adiposity index, and TyG index as predictors of IR. TyG index appeared to be more closely associated with IR than any other lipid-related variables studied, and proved to be the best discriminator in identifying IR (59). Accordingly, we considered TyG index a comprehensive marker for IR because both glucotoxicity and lipotoxicity are critical mechanisms in modulation of IR. In addition, a number of studies have identified the great correlations between TyG and hyperinsulinemic-euglycemic clamp test or HOMA-IR in different populations (16, 17, 60, 61). Thus, the TyG index is being considered as a credible and straightforward surrogate marker of IR for clinical practice.
The association between IR and incidence of IS has been well investigated in general population (62–64). However, whether IR correlated with clinical prognosis of individuals with IS is still a matter of debate. Therefore, we conducted our study to investigate the correlation in a large-scale, prospective cohort. In accordance with previous studies from the ACROSS-China registry (Abnormal Glucose Regulation in Patients with Acute Stroke Across China) (12, 65), the results in the main analysis of the study support that IR significantly increases the risk of stroke recurrence, all-cause mortality during the 12-month follow-up. The relationship between IR and neurologic worsening tested in the study is also in line with the result reported by Ago et al. (13). However, our study suggests that IR is not predictive of poor functional outcome, which is contrary to some study findings (12–14, 65). The different findings might have been caused by differences in designs of the studies, follow-up times, diagnostic methods, and ethnicities studied. In addition, there is no previous study of TyG index in the IS population, and the TyG index could be different from other markers of IR measurement.
This study, to the best of our knowledge, is the first study to associate the TyG index with clinical outcomes in patients with IS. Our study added evidence of the correlation between IR and prognosis of patients with IS based on a large-scale Chinese population. Furthermore, the IRIS study has provided evidence that treatment of insulin-sensitizing agent is effective in secondary prevention for individuals suffering from IS and IR. Thus, our study demonstrated that the TyG index would be an easily obtainable marker for risk stratification in IS patients during daily clinical practice.
The present study had several limitations. First, fasting triglyceride and glucose levels were tested at each study center. Thus, measurement errors derived from different analytic systems cannot be completely excluded. However, the testing results would be comparable because the measurement of triglyceride and glucose in all centers was based on the recommendation of International Federation of Clinical Chemistry and Laboratory Medicine (2011). Second, 3,294 (16.8%) patients were excluded from the study because of missing data or loss to follow-up at 12-month. The patients excluded were with higher NIHSS at admission, lower rate for antiplatelet treatment before the index event, and lower BMI, compared with the subjects included (Supplementary Table 3). Thus, a selective bias could not be avoided. Third, while recent studies indicated that imaging and biological markers are determinant factors to predict the prognosis of stroke (66, 67), these variables were not collected and analyzed in our study. Therefore, there is potential bias due to residual confounding from these unmeasured variables. Fourth, our study included acute IS patients within seven days from the onset of symptoms, and blood samples usually were not taken directly after falling ill in IS. As a result, the TyG index would reflect stress hyperglycemia to a large extent; additionally, fasting glucose and triglyceride level were influenced by various interventions given before admission which could be impossible to manage thoroughly in the study. Fifth, different quality of stroke care may also cause potential bias, allowing the fact that this study derived data from a nationwide cohort including hospitals with different geographic region, teaching status, hospital beds, and annual stroke discharges. Last, because our cohort included exclusively Chinese patients, the generalizability of the findings should be further validated in other ethnic populations. It is noticeable that this study only demonstrated the relationship between TyG index and adverse clinical outcomes in AIS patients, and further works are still needed to compare the predictive values of fasting glucose and triglyceride alone with TyG index in the future.
Conclusions
In this nationwide, large-scale stroke registry, higher TyG index representing IR was associated with an increased risk of stroke recurrence, all-cause mortality, and neurologic worsening in patients with IS. These findings may provide useful information for researchers interested in the fields of TyG index and stroke risk prediction not only for studies but also for clinical and public health applications.
Data Availability Statement
The datasets generated for this study are available on request to the corresponding author.
Ethics Statement
The studies involving human participants were reviewed and approved by the Central Institutional Review Board in Beijing Tiantan Hospital. The patients/participants provided their written informed consent to participate in this study.
Author Contributions
YZ, YP, and YoW conceptualize and design the study. YiW, XZ, CW, and LL assisted with data acquisition and interpretation. ZL and XM coordinated the study. YP, HY, and HL conducted the statistical analysis. YZ prepared the manuscript. YoW is the guarantor for this paper. All authors read and approved the final manuscript.
Funding
This study was supported by grants from National Key R&D Program of China (2016YFC0901001, 2016YFC0901002, 2017YFC1310901, 2017YFC1307905, and 2018YFC1312903), Beijing Municipal Administration of Hospitals' Mission Plan (SML20150502), Beijing Municipal Science & Technology Commission (D171100003017002), and the Ministry of Science and Technology of the People's Republic of China (2011BAI08B02).
Conflict of Interest
The authors declare that the research was conducted in the absence of any commercial or financial relationships that could be construed as a potential conflict of interest.
Acknowledgments
We thank all participating hospitals, their physicians, nurses, and researchers, and the China National Stroke Registry II Steering Committee members.
Supplementary Material
The Supplementary Material for this article can be found online at: https://www.frontiersin.org/articles/10.3389/fneur.2020.00456/full#supplementary-material
References
1. Feigin VL, Forouzanfar MH, Krishnamurthi R, Mensah GA, Connor M, Bennett DA, et al. Global and regional burden of stroke during 1990-2010: Findings from the Global Burden of Disease Study 2010. Lancet. (2014) 383:245–55. doi: 10.1016/S0140-6736(13)61953-4
2. Kernan WN, Inzucchi SE, Viscoli CM, Brass LM, Bravata DM, Shulman GI, et al. Impaired insulin sensitivity among nondiabetic patients with a recent TIA or ischemic stroke. Neurology. (2003) 60:1447–51. doi: 10.1212/01.WNL.0000063318.66140.A3
3. Fitzgibbons TP, Czech MP. Emerging evidence for beneficial macrophage functions in atherosclerosis and obesity-induced insulin resistance. J Mol Med. (2016) 94:267–75. doi: 10.1007/s00109-016-1385-4
4. Gast KB, Smit JWA, Heijer M den, Middeldorp S, Rippe RCA, le Cessie S, et al. Abdominal adiposity largely explains associations between insulin resistance, hyperglycemia and subclinical atherosclerosis: The NEO study. Atherosclerosis. (2013) 229:423–9. doi: 10.1016/j.atherosclerosis.2013.05.021
5. Slyper AH, Rosenberg H, Kabra A, Weiss MJ, Blech B, Gensler S, et al. Early atherogenesis and visceral fat in obese adolescents. Int J Obes. (2014) 38:954–8. doi: 10.1038/ijo.2014.11
6. Hilsted J, Bonde-Petersen F, Nørgaard MB, Greniman M, Christensen NJ, Parving HH, et al. Haemodynamic changes in insulin-induced hypoglycaemia in normal man. Diabetologia. (1984) 26:328–32. doi: 10.1007/BF00266031
7. Kain K, Catto AJ, Grant PJ. Associations between insulin resistance and thrombotic risk factors in high-risk South Asian subjects. Diabet Med. (2003) 20:651–5. doi: 10.1046/j.1464-5491.2003.00958.x
8. Kain K, Catto AJ, Grant PJ. Clustering of thrombotic factors with insulin resistance in South Asian patients with ischaemic stroke. Thromb Haemost. (2002) 88:950–53. doi: 10.1055/s-0037-1613339
9. Vazzana N, Ranalli P, Cuccurullo C, Davì G. Diabetes mellitus and thrombosis. Thromb Res. (2012) 129:371–7. doi: 10.1016/j.thromres.2011.11.052
10. Wilcox R, Bousser MG, Betteridge DJ, Schernthaner G, Pirags V, Kupfer S, et al. Effects of pioglitazone in patients with type 2 diabetes with or without previous stroke: Results from PROactive (PROspective pioglitAzone Clinical Trial In macroVascular Events 04). Stroke. (2007) 38:865–73. doi: 10.1161/01.STR.0000257974.06317.49
11. Kernan WN, Viscoli CM, Furie KL, Young LH, Inzucchi SE, Gorman M, et al. Pioglitazone after ischemic stroke or transient ischemic attack. N Engl J Med. (2016) 374:1321–31. doi: 10.1056/NEJMoa1506930
12. Jing J, Pan Y, Zhao X, Zheng H, Jia Q, Mi D, et al. Insulin resistance and prognosis of nondiabetic patients with ischemic stroke. Stroke. (2017) 48:887–93. doi: 10.1161/STROKEAHA.116.015613
13. Ago T, Matsuo R, Hata J, Wakisaka Y, Kuroda J, Kitazono T, et al. Insulin resistance and clinical outcomes after acute ischemic stroke. Neurology. (2018) 90:e1470–77. doi: 10.1212/wnl.0000000000005358
14. Li S, Yin C, Zhao W, Zhu H, Xu D, Xu Q, et al. Homeostasis model assessment of insulin resistance in relation to the poor functional outcomes in nondiabetic patients with ischemic stroke. Biosci Rep. (2018) 38:1–9. doi: 10.1042/BSR20180330
15. Simental-Mendía LE, Rodríguez-Morán M, Guerrero-Romero F. The product of fasting glucose and triglycerides as surrogate for identifying insulin resistance in apparently healthy subjects. Metab Syndr Relat Disord. (2008) 109:717–22. doi: 10.1089/met.2008.0034
16. Guerrero-Romero F, Simental-Mendía LE, González-Ortiz M, Martínez-Abundis E, Ramos-Zavala MG, Hernández-González SO, et al. The product of triglycerides and glucose, a simple measure of insulin sensitivity. Comparison with the euglycemic-hyperinsulinemic clamp. J Clin Endocrinol Metab. (2010) 95:3347–51. doi: 10.1210/jc.2010-0288
17. Vasques ACJ, Novaes FS, de Oliveira M, da S, Matos Souza JR, Yamanaka A, Pareja JC, et al. TyG index performs better than HOMA in a Brazilian population: A hyperglycemic clamp validated study. Diabetes Res Clin Pract. (2011) 93:8–10. doi: 10.1016/j.diabres.2011.05.030
18. Irace C, Carallo C, Scavelli FB, De Franceschi MS, Esposito T, Tripolino C, et al. Markers of insulin resistance and carotid atherosclerosis. A comparison of the homeostasis model assessment and triglyceride glucose index. Int J Clin Pract. (2013) 67:665–72. doi: 10.1111/ijcp.12124
19. Kim MK, Ahn CW, Kang S, Nam JS, Kim KR, Park JS. Relationship between the triglyceride glucose index and coronary artery calcification in Korean adults. Cardiovasc Diabetol. (2017) 16:1–7. doi: 10.1186/s12933-017-0589-4
20. Lee EY, Yang HK, Lee J, Kang B, Yang Y, Lee SH, et al. Triglyceride glucose index, a marker of insulin resistance, is associated with coronary artery stenosis in asymptomatic subjects with type 2 diabetes. Lipids Health Dis. (2016) 15:1–7. doi: 10.1186/s12944-016-0324-2
21. Lee SB, Ahn CW, Lee BK, Kang S, Nam JS, You JH, et al. Association between triglyceride glucose index and arterial stiffness in Korean adults. Cardiovasc Diabetol. (2018) 17:11–6. doi: 10.1186/s12933-018-0692-1
22. Shi W, Xing L, Jing L, Tian Y, Yan H, Sun Q, et al. Value of triglyceride-glucose index for the estimation of ischemic stroke risk: insights from a general population. Nutr Metab Cardiovasc Dis. (2019) 9:1–9. doi: 10.1016/j.numecd.2019.09.015
23. Li Z, Wang C, Zhao X, Liu L, Wang C, Li H, et al. Substantial progress yet significant opportunity for improvement in stroke care in china. Stroke. (2016) 47:2843–9. doi: 10.1161/STROKEAHA.116.014143
24. Wang Y, Jing J, Meng X, Pan Y, Zhao X, Lin J, et al. The third china national stroke registry (CNSR-III) for patients with acute ischaemic stroke or transient ischaemic attack: Design, rationale and baseline patient characteristics. Stroke Vasc Neurol. (2019) 4:158–64. doi: 10.1136/svn-2019-000242
25. Wang Y, Cui L, Ji X, Dong Q, Zeng J, Wang Y, et al. The China National Stroke Registry for patients with acute cerebrovascular events: design, rationale, and baseline patient characteristics. Int J Stroke. (2011) 6:355–61. doi: 10.1111/j.1747-4949.2011.00584.x
26. Toyoda K, Fujimoto S, Kamouchi M, Iida M, Okada Y. Acute blood pressure levels and neurological deterioration in different subtypes of ischemic stroke. Stroke. (2009) 40:2585–8. doi: 10.1161/STROKEAHA.108.543587
27. Kostiuk E p, Zubkova ST. [Pathogenesis of atherosclerosis in diabetes mellitus. The role of insulin resistance and hyperinsulinemia]. Fiziol Zh. (1993) 39:93–8.
28. Ning B, Wang X, Yu Y, Waqar AB, Yu Q, Koike T, et al. High-fructose and high-fat diet-induced insulin resistance enhances atherosclerosis in Watanabe heritable hyperlipidemic rabbits. Nutr Metab (Lond). (2015) 12:30. doi: 10.1186/s12986-015-0024-3
29. Bornfeldt KE, Tabas I. Insulin resistance, hyperglycemia, and atherosclerosis. Cell Metab. (2011) 14:575–585. doi: 10.1016/j.cmet.2011.07.015
30. Oh J, Riek AE, Darwech I, Funai K, Shao J, Chin K, et al. Deletion of macrophage Vitamin D receptor promotes insulin resistance and monocyte cholesterol transport to accelerate atherosclerosis in mice. Cell Rep. (2015) 10:1872–86. doi: 10.1016/j.celrep.2015.02.043
31. Laakso M. Dyslipidaemias, insulin resistance and atherosclerosis. Ann Med. (1992) 24:505–9. doi: 10.3109/07853899209167003
32. Russell JC, Ahuja SK, Manickavel V, Rajotte R V, Amy RM. Insulin resistance and impaired glucose tolerance in the atherosclerosis-prone LA/N corpulent rat. Arteriosclerosis. (1987) 7:620–6. doi: 10.1161/01.atv.7.6.620
33. Jotic A, Milicic T, Covickovic Sternic N, Kostic VS, Lalic K, Jeremic V, et al. Decreased insulin sensitivity and impaired fibrinolytic activity in type 2 diabetes patients and nondiabetics with ischemic stroke. Int J Endocrinol. (2015) 2015:934791. doi: 10.1155/2015/934791
34. Ferreiro JL, Gómez-Hospital JA, Angiolillo DJ. Platelet abnormalities in diabetes mellitus. Diabetes Vasc Dis Res. (2010) 7:251–9. doi: 10.1177/1479164110383994
35. Moore SF, Williams CM, Brown E, Blair TA, Harper MT, Coward RJ, et al. Loss of the insulin receptor in murine megakaryocytes/platelets causes thrombocytosis and alterations in IGF signalling. Cardiovasc Res. (2015) 107:9–19. doi: 10.1093/cvr/cvv132
36. Ueno M, Fujita K, Yamamoto H, Ikeda T, Suga T, Yamaji K, et al. Impact of impaired glucose tolerance on clopidogrel response in patients with coronary artery disease. J Thromb Thrombolysis. (2015) 40:174–81. doi: 10.1007/s11239-015-1177-7
37. Santilli F, Vazzana N, Liani R, Guagnano MT, Davì G. Platelet activation in obesity and metabolic syndrome. Obes Rev an Off J Int Assoc Study Obes. (2012) 13:27–42. doi: 10.1111/j.1467-789X.2011.00930.x
38. Lundström A, Laska AC, Von Arbin M, Jörneskog G, Wallén H. Glucose intolerance and insulin resistance as predictors of low platelet response to clopidogrel in patients with minor ischemic stroke or TIA. Platelets. (2014) 25:102–10. doi: 10.3109/09537104.2013.777951
39. Chazova IE, Mychka VB, Mamyrbaeva KM, Gornostaev VV, Dvoskina IM, Sergienko VB. [Cerebrovascular complications in metabolic syndrome: possible approaches to decrease risk]. Ter Arkh. (2004) 76:74–80.
40. Chazova IE, Mychka VB, Gornostaev VV, Dvoskina IM, Sergienko VB. [Cerebral perfusion in patients with metabolic syndrome]. Zhurnal Nevrol i psikhiatrii Im SS Korsakova. (2005) 8–13.
41. Newman JMB, Dwyer RM, St-Pierre P, Richards SM, Clark MG, Rattigan S. Decreased microvascular vasomotion and myogenic response in rat skeletal muscle in association with acute insulin resistance. J Physiol. (2009) 587:2579–88. doi: 10.1113/jphysiol.2009.169011
42. Cade WT. Diabetes-related microvascular and macrovascular diseases in the physical therapy setting. Phys Ther. (2008) 88:1322–35. doi: 10.2522/ptj.20080008
43. Ince H, Taşdemir HA, Aydin M, Ozyürek H, Tilki HE. Evaluation of nerve conduction studies in obese children with insulin resistance or impaired glucose tolerance. J Child Neurol. (2015) 30:989–99. doi: 10.1177/0883073814550188
44. Lesniewski LA, Donato AJ, Behnke BJ, Woodman CR, Laughlin MH, Ray CA, et al. Decreased NO signaling leads to enhanced vasoconstrictor responsiveness in skeletal muscle arterioles of the ZDF rat prior to overt diabetes and hypertension. Am J Physiol Heart Circ Physiol. (2008) 294:H1840–50. doi: 10.1152/ajpheart.00692.2007
45. Flemming KD, Brown RDJ. Secondary prevention strategies in ischemic stroke: identification and optimal management of modifiable risk factors. Mayo Clin Proc. (2004) 79:1330–40. doi: 10.4065/79.10.1330
46. Ms CC, Wu S, Ms PL, Rn YH. Control of modifiable risk factors in ischemic stroke outpatients by pharmacist intervention : an equal allocation stratified randomized study. J Clin Pharm Ther. (2008) 33:529–35. doi: 10.1111/j.1365-2710.2008.00940.x
47. Khan NI, Naz L, Mushtaq S, Rukh L, Ali S, Hussain Z. Ischemic stroke: prevalence of modifiable risk factors in male and female patients in Pakistan. Pak J Pharm Sci. (2009) 22:62–7.
48. Toth PP. Insulin resistance, small LDL particles, and risk for atherosclerotic disease. Curr Vasc Pharmacol. (2014) 12:653–7. doi: 10.2174/15701611113119990125
49. Pham N, Dhar A, Khalaj S, Desai K, Taghibiglou C. Down regulation of brain cellular prion protein in an animal model of insulin resistance: possible implication in increased prevalence of stroke in pre-diabetics/diabetics. Biochem Biophys Res Commun. (2014) 448:151–6. doi: 10.1016/j.bbrc.2014.04.071
50. Wieberdink RG, Koudstaal PJ, Hofman A, Witteman JCM, Breteler MMB, Arfan Ikram M. Insulin resistance and the risk of stroke and stroke subtypes in the nondiabetic elderly. Am J Epidemiol. (2012) 176:699–707. doi: 10.1093/aje/kws149
51. Åberg D, Åberg ND, Jood K, Holmegaard L, Redfors P, Blomstrand C, Isgaard J, et al. Homeostasis model assessment of insulin resistance and outcome of ischemic stroke in non-diabetic patients - A prospective observational study. BMC Neurol. (2019) 19:1–9. doi: 10.1186/s12883-019-1406-3
52. Stringer DM, Zahradka P, Taylor CG. Glucose transporters: Cellular links to hyperglycemia in insulin resistance and diabetes. Nutr Rev. (2015) 73:140–54. doi: 10.1093/nutrit/nuu012
54. Neuhauser HK. The metabolic syndrome. Lancet. (2005) 366:1415–28. doi: 10.1016/S0140-6736(05)67780-X
55. Mikhail N. The metabolic syndrome: insulin resistance. In: Stress in Health and Disease. (2009). p. 317–32. doi: 10.1002/3527609156.ch19
56. Ferrannini E, Barrett EJ, Bevilacqua S, DeFronzo RA. Effect of fatty acids on glucose production and utilization in man. J Clin Invest. (1983) 72:1737–47. doi: 10.1172/JCI111133
57. Lebovitz HE, Banerji MA. Insulin resistance and its treatment by thiazolidinediones. Recent Prog Horm Res. (2001) 56:265–94. doi: 10.1210/rp.56.1.265
58. Stančáková A, Javorský M, Kuulasmaa T, Haffner SM, Kuusisto J, Laakso M. Changes in insulin sensitivity and insulin release in relation to glycemia and glucose tolerance in 6,414 finnish men. Diabetes. (2009) 58:1212–21. doi: 10.2337/db08-1607
59. Du T, Yuan G, Zhang M, Zhou X, Sun X, Yu X. Clinical usefulness of lipid ratios, visceral adiposity indicators, and the triglycerides and glucose index as risk markers of insulin resistance. Cardiovasc Diabetol. (2014) 13:3. doi: 10.1186/s12933-014-0146-3
60. Guerrero-Romero F, Villalobos-Molina R, Jiménez-Flores JR, Simental-Mendia LE, Méndez-Cruz R, Murguía-Romero M, et al. Fasting triglycerides and glucose index as a diagnostic test for insulin resistance in young adults. Arch Med Res. (2016) 47:382–7. doi: 10.1016/j.arcmed.2016.08.012
61. Kang B, Yang Y, Lee EY, Yang HK, Kim H-S, Lim S-Y, et al. Triglycerides/glucose index is a useful surrogate marker of insulin resistance among adolescents. Int J Obes (Lond). (2017) 41:789–92. doi: 10.1038/ijo.2017.14
62. Rundek T, Gardener H, Xu Q, Goldberg RB, Wright CB, Boden-Albala B, et al. Insulin resistance and risk of ischemic stroke among nondiabetic individuals from the northern Manhattan study. Arch Neurol. (2010) 67:1195–200. doi: 10.1001/archneurol.2010.235
63. Thacker EL, Psaty BM, McKnight B, Heckbert SR, Longstreth WT, Mukamal KJ, et al. Fasting and post-glucose load measures of insulin resistance and risk of ischemic stroke in older adults. Stroke. (2011) 42:3347–51. doi: 10.1161/STROKEAHA.111.620773
64. Howard G, Wagenknecht LE, Kernan WN, Cushman M, Thacker EL, Judd SE, et al. Racial differences in the association of insulin resistance with stroke risk: The REasons for Geographic and Racial Differences in Stroke (REGARDS) study. Stroke. (2014) 45:2257–62. doi: 10.1161/STROKEAHA.114.005306
65. Pan Y, Jing J, Chen W, Zheng H, Jia Q, Mi D, et al. Post-glucose load measures of insulin resistance and prognosis of nondiabetic patients with ischemic stroke. J Am Heart Assoc. (2017) 6:1–11. doi: 10.1161/JAHA.116.004990
66. Amarenco P, Lavallée PC, Labreuche J, Albers GW, Bornstein NM, Canhão P, et al. One-year risk of stroke after transient ischemic attack or minor stroke. N Engl J Med. (2016) 374:1533–42. doi: 10.1056/NEJMoa1412981
67. Lin J, Zheng H, Cucchiara BL, Li J, Zhao X, Liang X, et al. Association of Lp-PLA 2 -A and early recurrence of vascular events after TIA and minor stroke. Neurology. (2015) 85:1585–91. doi: 10.1212/WNL.0000000000001938
Nomenclature
TyG: triglyceride glucose
IR: insulin resistance
IS: ischemic stroke
TIA: transient ischemic attack
HOMA-IR: homeostasis model assessment of insulin resistance
CNSR: China National Stroke Registry
BMI: body mass index
mRS: modified Rankin Scale
NIHSS: National Institutes of Health Stroke Scale
SD: standard deviations
IQR: interquartile range
HR: hazard ratio
OR: odds ratio
CI: confident interval
IV: intravenous
CVR: cerebrovascular reserve
Keywords: insulin resistance, triglyceride glucose index, ischemic stroke, stroke recurrence, prognosis
Citation: Zhou Y, Pan Y, Yan H, Wang Y, Li Z, Zhao X, Li H, Meng X, Wang C, Liu L and Wang Y (2020) Triglyceride Glucose Index and Prognosis of Patients With Ischemic Stroke. Front. Neurol. 11:456. doi: 10.3389/fneur.2020.00456
Received: 24 January 2020; Accepted: 28 April 2020;
Published: 10 June 2020.
Edited by:
Mira Katan, University Hospital Zürich, SwitzerlandReviewed by:
Markus Arnold, University Hospital Zurich, SwitzerlandMaurice Giroud, Centre Hospitalier Regional Universitaire De Dijon, France
Copyright © 2020 Zhou, Pan, Yan, Wang, Li, Zhao, Li, Meng, Wang, Liu and Wang. This is an open-access article distributed under the terms of the Creative Commons Attribution License (CC BY). The use, distribution or reproduction in other forums is permitted, provided the original author(s) and the copyright owner(s) are credited and that the original publication in this journal is cited, in accordance with accepted academic practice. No use, distribution or reproduction is permitted which does not comply with these terms.
*Correspondence: Yongjun Wang, yongjunwang@ncrcnd.org.cn