 Yang Li
 Zhen Zhang2†
- 1Department of Neurosurgery, The First People's Hospital of Yinchuan, Yinchuan, China
- 2Department of Neurosurgery, The Affiliated Yantai Yuhuangding Hospital of Qingdao University, Yantai, China
- 3Department of Neurosurgery, The Second People's Hospital of Yinchuan, Yinchuan, China
Objective: The purpose of this study was to identify potential therapeutic targets by examining the hub genes contributing to progression of intracranial aneurysm (IA) in patients with hypertension.
Methods: The bulk RNA sequencing (RNA-seq) datasets of hypertension and IA were obtained from the Gene Expression Omnibus (www.ncbi.nlm.nih.gov/geo) database. These data were then used to calculate disease-related differentially expressed genes (DEGs) at the individual level. An scRNA-seq dataset of patients with abdominal aortic aneurysms (AAA) was used to analyze monocyte/macrophage-related DEGs. On the basis of the DEG data related to monocytes and macrophages, a TF-genes network has been developed. Hub genes and core sub-networks have also been identified. Furthermore, the key genes have been validated in an external cohort.
Results: From combined monocyte and macrophage-derived DEGs from abdominal aortic aneurysms, five hub DEGs were detected, including IFI30, SERPINE1, HMOX1, IL24, and RUNX1. A total of 57 genes were found in the IA bulk RNA-seq dataset. A support vector machine-recursive feature elimination algorithm (SVM-RFE) was applied to further screen the seven genes (RPS4Y1, DDX3Y, RUNX1, CLEC10A, PLAC8, SLA, and LILRB3). RUNX1 was the hub gene that regulated NFKB1 in the monocyte/macrophage-related network. And RUNX1 is implicated in IA progression by regulating hematopoietic stem cell differentiation and abnormal platelet production, according to gene set enrichment analysis.
Conclusion: Among patients with hypertension, RUNX1 in monocytes and macrophages was associated with a higher risk of IA through its regulation of NFKB1.
Introduction
Intracranial aneurysm (IA) is a cerebrovascular disease caused by the limited dilation of cerebral arteries (1). Its incidence is approximately 3.2%, and it is higher in women than in men (2–4). IA ruptures and bleeding are associated with high morbidity rates and mortality rates (5). Subarachnoid hemorrhage (SAH) results from an IA rupture or bleeding, and accounts for 70–85% of all spontaneous SAHs (6). In addition, IA can induce intracerebral or subdural hematoma (7, 8). Hypertension is a common risk factor for IA as well as an independent risk factor for IA rupture (9–11). IA poses a significant risk to patients with hypertension. Therefore, IA progression in this patient group should be prevented.
The role played by monocytes/macrophages in the pathogenesis of IA has been demonstrated in recent studies. Development of IA involves complex pathophysiological processes, such as endothelial inflammatory responses triggered by altered hemodynamics and genetic factors (12, 13). Changes in cerebral artery hemodynamics can trigger a prolonged and excessive inflammatory response in the vessel wall, leading to the development, growth, and rupture of IA (13). Cell death in the vessel wall and destruction of the extracellular matrix can occur as a result of this chronic inflammation caused by the recruitment of monocytes/macrophages (14). During inflammation, monocytes can infiltrate the vessels and become macrophages, which modulates the immune response (15). Macrophages of the M1 type can release cytokines to increase the inflammatory response and recruit further macrophages (16). It is also possible for M1-type macrophages to remodel the blood vessels in addition to releasing cytokines (17). By inhibiting macrophage recruitment and accumulation in the vessel wall of individuals with IA, the incidence and size of IA in animal models will be significantly reduced (18). Monocytes and macrophages play an important role in IA pathogenesis, but the mechanism is not known.
Cells are the basic unit of life, which can communicate via two distinct pathways (paracrine and autocrine) to regulate metabolism, differentiation, and other biological functions (19). Monocytes and macrophages in a hypertensive microenvironment may cause IA through scRNA-seq analysis. The rapid development of single-cell sequence technologies has allowed previous studies to collect gene expression data at the single-cell level in recent years (20–24). The analysis of single cells can identify the mechanisms of cellular interactions and is essential for establishing the molecular regulation of diseases at the microscopic level (25–28). Single-cell RNA sequencing analysis revealed that megakaryocytes and a few monocyte subpopulations may significantly elevate cytokine levels in patients with severe coronavirus disease 2019 (29). We hypothesized that single-cell analysis could provide insight into possible mechanisms underlying the development of hypertension-induced IA.
This study examined hub genes that contribute to IA progression among patients with hypertension and identified potential therapeutic targets for preventing and reducing the risk of IA, thereby lowering the risk of neurovascular diseases including cerebral hemorrhage.
Methods
Data Acquisition
First, the Gene Expression Omnibus (GEO) database was searched for IA-related bulk and single-cell RNA-seq datasets. To investigate the possible role of hypertension in IA development, the keyword “Hypertension” was retrieved from the GEO dataset to obtain HT-related datasets. The filtering criteria for the datasets were as follows: First, bulk RNA-seq datasets were derived from human samples, and each dataset contained at least 10 samples. Second, single-cell RNA-seq datasets were assigned as the control design. Transcriptomic data from the peripheral blood mononuclear cells (PBMCs) of 11 patients with hypertension and 10 healthy controls (HCs) were collected from the GSE75360 dataset to analyze hypertension-related differentially expressed genes (DEGs) according to the set conditions (30). The mRNA transcriptomic data from 44 IA samples and 16 HC samples of the intracranial cortical artery from the GSE122897 dataset were used to analyze IA-related DEGs. The GSE13353 dataset contains 11 ruptured and 8 unruptured intracranial aneurysm samples, and this dataset was used as an external validation cohort in this study (31). To assess the transcription of AI-related genes at the single-cell level, we included a single-cell RNA-seq dataset (Gene Expression Omnibus accession no. GSE166676) with four cases of abdominal aortic aneurysm (AAA) and two cases of non-aneurysmal control (NAC) among patients with atherosclerotic occlusive disease after a cautious examination (32). The single-cell RNA sequencing (scRNA-seq) dataset contains transcriptomic data from 14,088 cells. All analyses and plots were created using R (version 4.0.2). Differences between groups were assessed using the Wilcoxon rank-sum test.
Quality Control and Data Merging of ScRNA-Seq Data
First, the R package Seurat (version 4.0) was used for the quality control of scRNA-seq data from AAA and NAC samples (33). The metrics used for quality control included the number of gene signatures detected in each cell, total RNA count, and proportion of mitochondrial and hemoglobin genes expressed. High-quality data from the scRNA-seq dataset were screened by removing cells containing <200 or > 2,500 genes as well as cells with > 10% of mitochondrial genes. Finally, we obtained 9,796 cells for subsequent analysis. The “SelectIntegrationFeatures” function was then used to identify the top 2,000 highly variable genes shared among the six samples. Further, the “FindIntegrationAnchors” function was then used to find the anchors from the highly variable genes. Finally, by applying the “IntegrateData” function, the scRNA-seq data from the six samples were combined for subsequent dimension reduction and clustering analysis.
Dimensionality Reduction, Clustering, and Annotation of scRNA-seq Data
The uniform manifold approximation and projection (UMAP) algorithm was used to analyze and visualize cell clustering (34). The top 30 principal components (PCs) were selected to further perform UMAP and clustering analysis. We first used SingleR (version 1.4) to predict the cell types of individual cell clusters (35). The Database of Immune Cell Expression (DICE) and Monaco Immune Cell Data were selected as the reference datasets to predict the types of immune cells in the IA single-cell dataset. Then, the cell type predictions were manually validated against the marker molecules of immune cells from the CellMarker (http://biocc.hrbmu.edu.cn/CellMarker/index.jsp) website to complete the final cell annotation.
Extraction and Differential Analysis of Target Cell Populations
According to a literature review, monocytes/macrophages play an essential role in IA progression (36). Therefore, we further included monocytes/macrophages for subsequent analysis. First, the RNA transcripts of all genes in the monocytes/macrophages between the AAA and NAC groups were subjected to differential expression analysis. Two approaches were used to identify DEGs between the two groups. The first approach applied the “FindMarker” function to identify DEGs between the two cell populations. The other approach used DESeq2 to the constructed pseudo-bulk RNA data after establishing the pseudo-bulk RNA-seq data for differential expression analysis. DEGs identified with these two approaches were combined as monocyte/macrophage-related DEGs.
Differential Analysis of Bulk RNA and Identification of Shared DEGs
Based on the type of bulk RNA-seq data, the limma or edgeR package was used for differential expression analysis. We applied the limma package for the differential analysis of FPKM-type RNA data and obtained IA-related DEGs (37). The R package “edgeR” was used to identify hypertension-related DEGs and to perform the differential analysis of count-type RNA data (38). DEGs were screened with a threshold of P < 0.05. Subsequently, we performed intersection analysis of IA-related DEGs, hypertension-related DEGs, and monocyte/macrophage-related DEGs to obtain shared DEGs, which were considered as genes of interest (GOIs).
Support Vector Machines–Recursive Feature (SVM-RFE) Elimination Model Construction and Variable Selection
Intersection analysis of IA-related DEGs and monocyte/macrophage-related DEGs revealed 57 shared DEGs. Then, using the bulk RNA-seq data for IA, we incorporated these 57 genes into the Support Vector Machines–Recursive Feature Elimination (SVM–RFE) model to predict the incidence of IA. This model can be applied to select the optimal number of variables that must be included in the model and can yield the most relevant variables for classification prediction (39).
TF-Gene Network Construction and Functional Pathway Enrichment Analysis
To explore the significant TF regulatory network in monocytes/macrophages, we applied the TRRUST (version 2.0) database to predict the TF–gene pairs corresponding to monocyte/macrophage-related DEGs (40). Cytoscape (version 3.9) was used to visualize this TF–gene network, and the Molecular Complex Detection plug-in was further used to identify the core sub-networks in this network (degree cutoff = 2, node score cutoff = 0.2, and max depth = 100).
To explore the potential pathways involved in DEGs, we used the clusterProfiler R package for Kyoto Encyclopedia of Genes and Genomes and Gene Ontology (GO) analysis as previous research (41, 42). Gene Set Enrichment Analysis (GSEA) was applied to analyze the functional pathways of enrichment of core genes at the individual and cellular levels. The “c2.cp.v7.2.symbols.gmt [Curated]” gene set downloaded from MSigDB Collections (https://www.gsea-msigdb.org/gsea/msigdb/) was used as the reference gene set. The filtering threshold for differences in functional pathways was set at P < 0.05 (43).
Results
Quality Control and Annotation Results for scRNA-seq Data
First, we performed quality control on the scRNA-seq data of arterial tissue. The Figure 1A shows the distribution of total NRA counts, the number of gene signatures, and the proportion of mitochondrial gene expression and hemoglobin-related gene expression in cells before filtration. Following the pre-defined filtering conditions, 9,796 cells were included in the subsequent analysis (Figure 1B). UMAP showed that each cell cluster overlapped between the two groups and between the six samples. Therefore, data integration eliminated the batch effect (Figures 1C,D). Data were reduced in dimension and clustered into 21 cell clusters (Figure 2A). Figures 2B,C show four and eight cell clusters annotated using the DICE and Monaco reference datasets, respectively. Among them, monocytes had a relatively large overlap between the two annotation methods. Subsequently, we applied cellular annotation with nine cellular marker genes from CellMarker, which were consistently expressed between the two groups (Figure 2D). Figures 3A,B illustrate the expression of these nine cell markers within each cluster of cells. Among them, CSF1R was used to annotate monocytes/macrophages, CD14 to annotate monocytes, CD68 to annotate macrophages, CD3D and CD2 to annotate T cells, PRF1, and KLRF1 to annotate NK cells, ITGAX to annotate dendritic cells, and CD19 to annotate B cells. Finally, four cell types were annotated by combining the cell annotation results of SingleR and CellMarker, including T cells, B cells, NK cells, and monocytes/macrophages (Figure 3C). A significant difference in the percentage of T cells was observed between the AAA and NAC groups (p 0.05) (Figure 3D). In addition, the proportion of monocytes/macrophages differed significantly between samples in the AAA group. Thus, monocytes/macrophages might be involved in the different stages of IA progression.
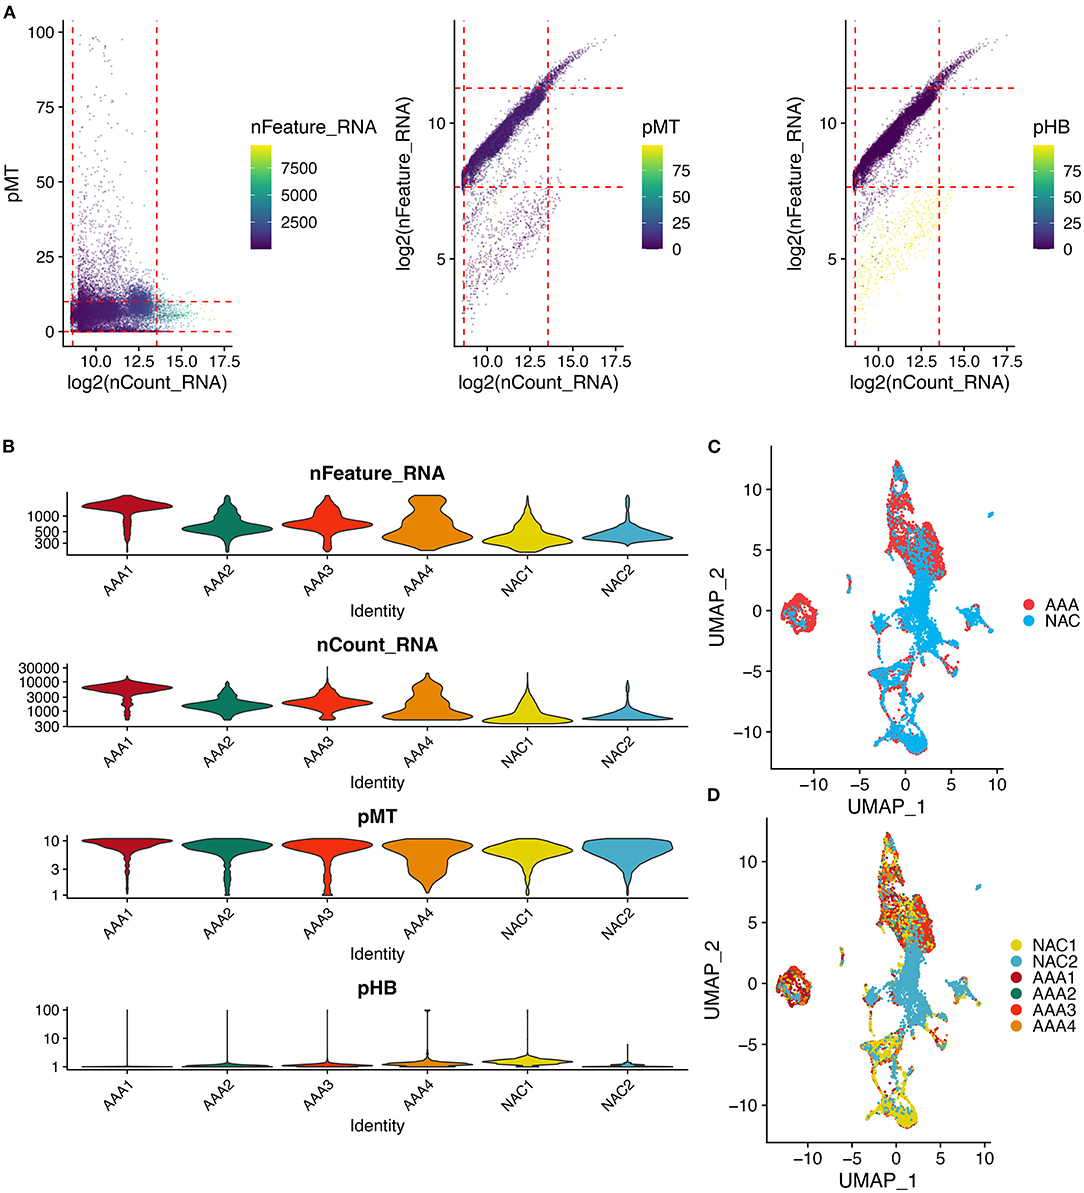
Figure 1. Quality control and cell clustering of single cell data. (A) Scatter plot of quality control metrics for scRNA-seq data. The red dashed line represents the threshold used to filter out high quality transcriptomic data. pMT: percent of mitochondrial counts; pHB: percent of hemoglobin RNA counts. (B) Violin plots showing the distribution of cell characteristics after quality control. (C,D). UMAPs show the results of cell clustering based on the top 30 principal components, color coded by (C) tissue type, or (D) patient.
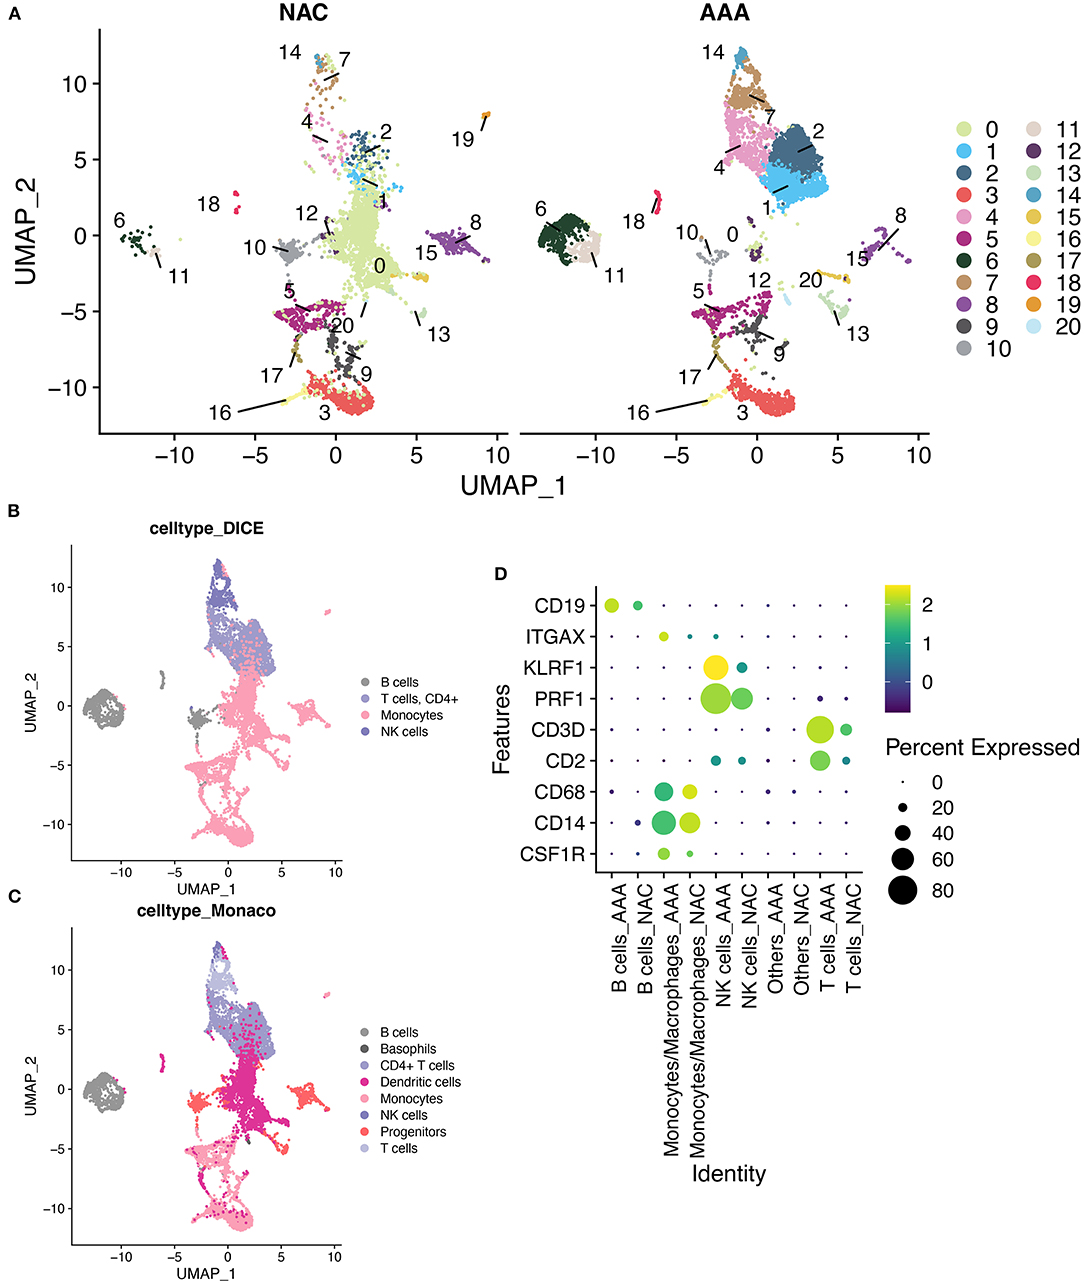
Figure 2. SingleR annotation of cell clusters. (A) The UMAPs show a distribution of 21 cell clusters in the AAA and NAC groups, respectively. (B). Application of cell annotation to the DICE reference dataset.DICE: Database of Immune Cell Expression (/eQTLs/Epigenomics). (C) Cell annotation using Monaco Immune Cell Data. (D) Heat map showing good concordance in the expression of cellular marker genes between AAA and NAC groups.
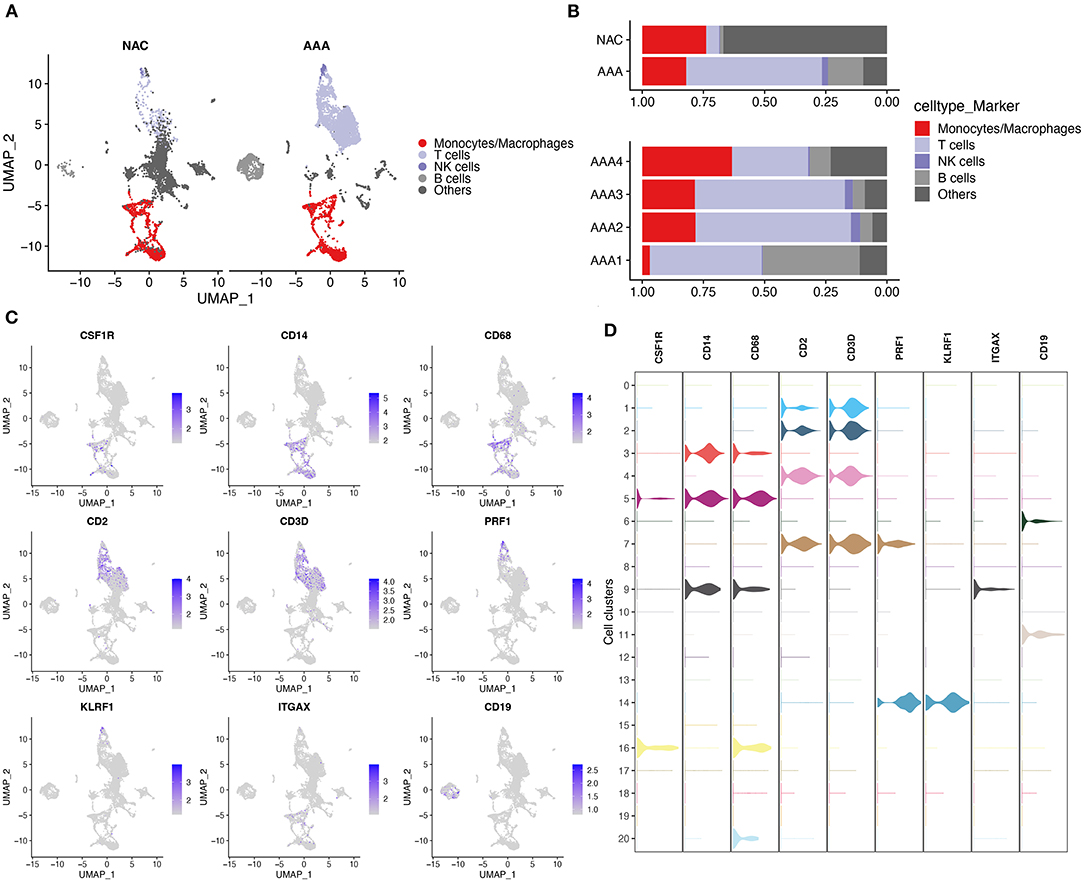
Figure 3. Cell annotation in conjunction with CellMarker. (A) UMAPs show the results of applying the marker genes in CellMaker to annotate cells. (B) The bars depict the percentage of each cell type in each tissue type and patient. (C) UMAPs show the expression of cellular marker genes in cells. (D) Violin diagram depicting cell marker gene expression in each cell cluster.
Results of Differential and Intersection Analyses
In total, 2,102 monocytes/macrophages were extracted and used for differential analysis between the AAA and NAC groups. Further, DESeq2 and FindMarker identified 419 and 539 DEGs, respectively, with a total of 869 genes after removal of intersections. Then, 2,550 and 3,079 DEGs were identified from the bulk RNA-seq data of HT and IA, respectively. These genes of interest (GOIs) were annotated in the volcano map (Figures 4A,B). The top 20 upregulated and downregulated DEGs in AAA identified by FindMarker and DESeq2, respectively, are shown in Figures 4C,D. To further explore the functional pathways that are jointly dysregulated in hypertension and IA, GO function enrichment analysis of the 95 DEGs common to HT and IA was performed. Figures 4E,F show the pathways that are jointly upregulated and downregulated in hypertension and IA, respectively. Finally, cross-tabulation analysis revealed that five GOIs, including IFI30, SERPINE1, HMOX1, IL24, and RUNX1, were found to be associated with hypertension, IA, and monocytes/macrophages (Figure 4G). And the differential expression of IFI30, SERPINE1, HMOX1, IL24, and RUNX1 were shown in the volcano plot (Figures 4A,B).
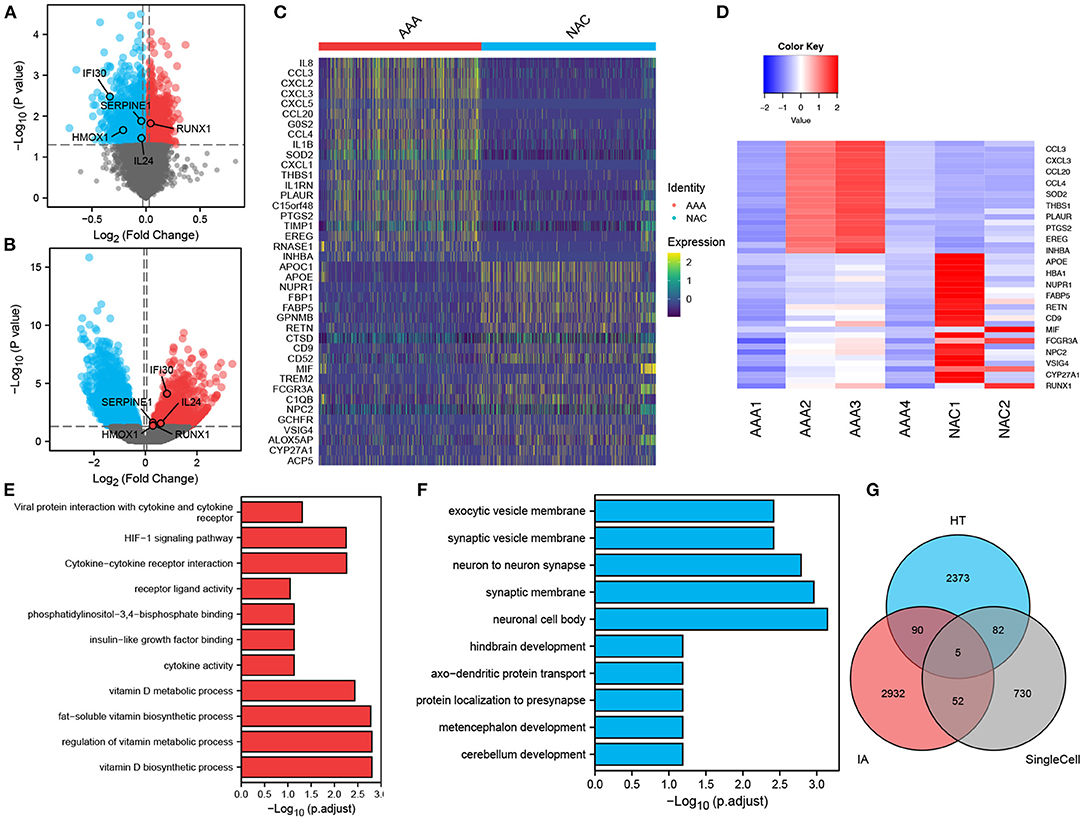
Figure 4. Differentially expressed genes and intersection analysis. (A,B) Volcano plots showing the results of tests for differentially expressed genes in (A) HT, and (B) IA, respectively, and the differences in expression of GOIs are marked in the plots. (C,D). Differentially expressed genes in monocytes/macrophages obtained by applying (C) FindMarker, or (D) DEGs. (E,F) Differential gene-enriched (E) up-regulation pathway and (F) down-regulation pathway shared in HT and IA. (G) Intersection analysis of HT-associated DEGs, IA-associated DEGs and monocytes/macrophages-associated DEGs revealed five GOIs.
SVM–RFE Analysis of the Expression Distribution of Hub Genes in the Bulk RNA of IA
In total, 57 genes were identified as shared DEGs in monocytes/macrophages from AAA and IA (Figure 4G). These DEGs were then further screened by applying SVM–RFE to the bulk RNA-seq dataset from IA. The variable screening results of the SVM–RFE algorithm showed that the IA prediction model constructed from seven gene features (RPS4Y1, DDX3Y, RUNX1, CLEC10A, PLAC8, SLA, and LILRB3) had the highest accuracy (Figure 5A), with an area under the curve (AUC) of 0.862 (Figure 5B). This seven-gene SVM model was validated by ROC analysis with the GSE13353 dataset as an external cohort (AUC: 0.812) (Figure 5C). Figures 5D,E depict the ROC curves for each of the seven genes (AUC: 0.601–0.817). The above studies suggest that these genes (RPS4Y1, DDX3Y, RUNX1, CLEC10A, PLAC8, SLA, and LILRB3) can predict the prevalence of IA. Figure 5F depicts the expression distribution of these seven genes in the bulk RNA of IA. By analyzing the heat map, RUNX1, CLEC10A, PLAC8, SLA, and LILRB3 were found to be highly expressed in IA, while RPS4Y1 and DDX3Y were lowly expressed in IA.
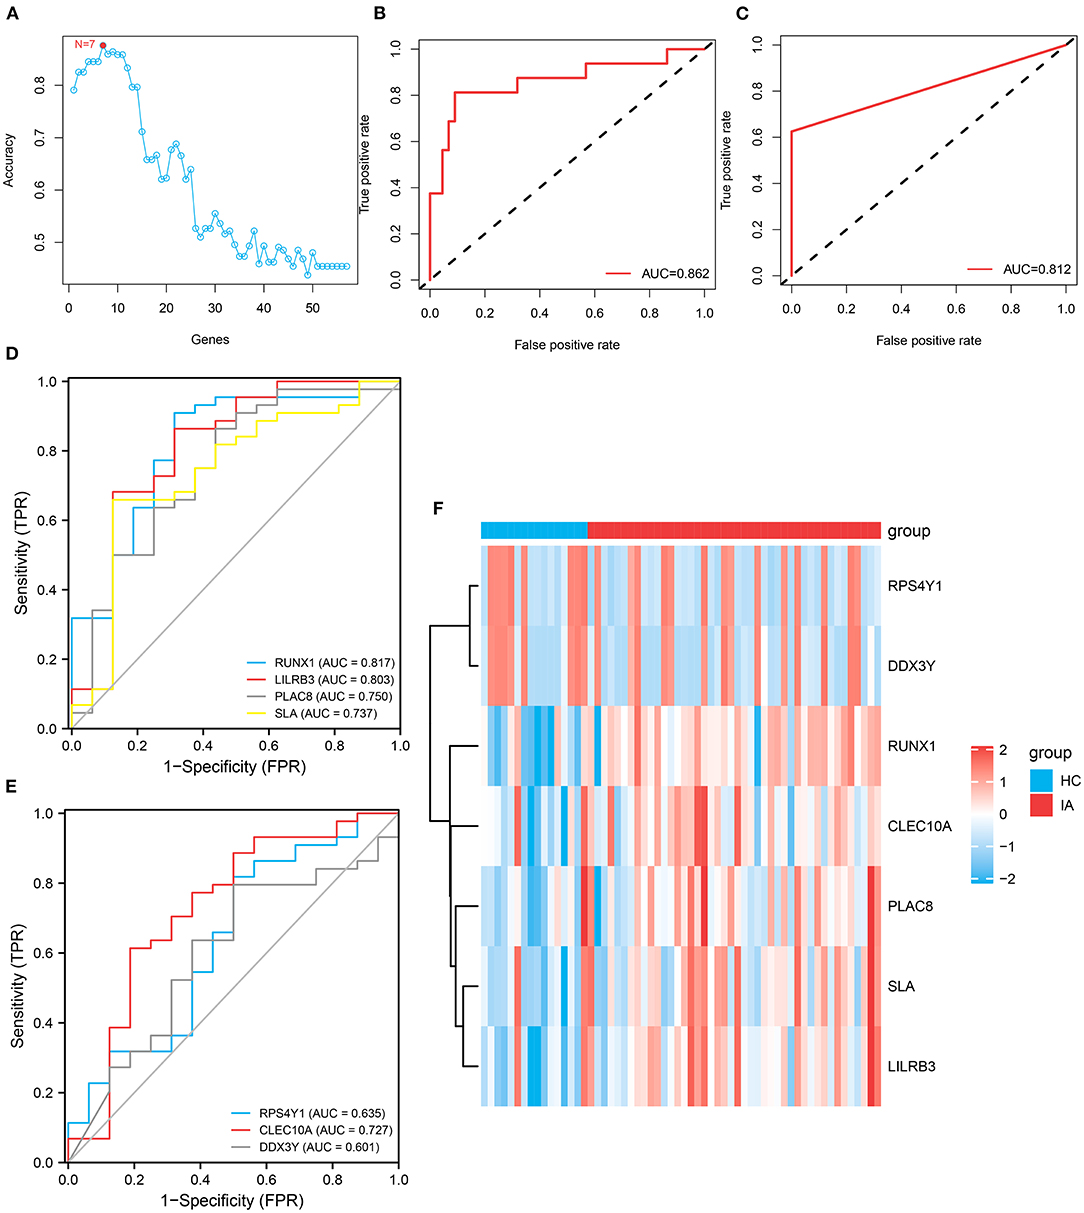
Figure 5. Construction and variable selection of the intracranial aneurysm prediction model using the Support Vector Machines–Recursive Feature Elimination (SVM–RFE) algorithm. (A) Broken line graph of the number of genes identified using the SVM–RFE model and the accuracy of the model. Hence, the highest accuracy can be achieved using the SVM model constructed from seven genes. (B) Receiver operating characteristic (ROC) curve based on the SVM model constructed from these seven genes, with an area under the curve (AUC) value of 0.862. (C) Validation of this seven-gene SVM model by ROC analysis with an external cohort. (D,E) ROC curves showing the AUCs of RUNX1, LILRB3, PLAC8, SLA, RPS4Y1, CLEC10A, and DDX3Y. (F) Heatmap depicts the expression distribution of these seven genes in the bulk RNA of IA.
RUNX1 As a Hub Gene in IA Progression Determined via Network Analysis and Intersection Analysis
We analyzed and constructed the TF regulatory network in monocytes and macrophages (Figure 6A). In addition, the intersection analysis of the seven genes and five GOIs used to build the IA prediction model revealed that RUNX1 was the hub gene (Figure 6B). In the PPI network, RUNX1 was responsible for regulating four downstream molecules. According to the core sub-network of this PPI network, NFKB1, regulated by RUNX1, is the hub gene of the entire network (Figure 6C). Therefore, RUNX1 was identified as a hub gene in the IA process by network analysis and crossover analysis.
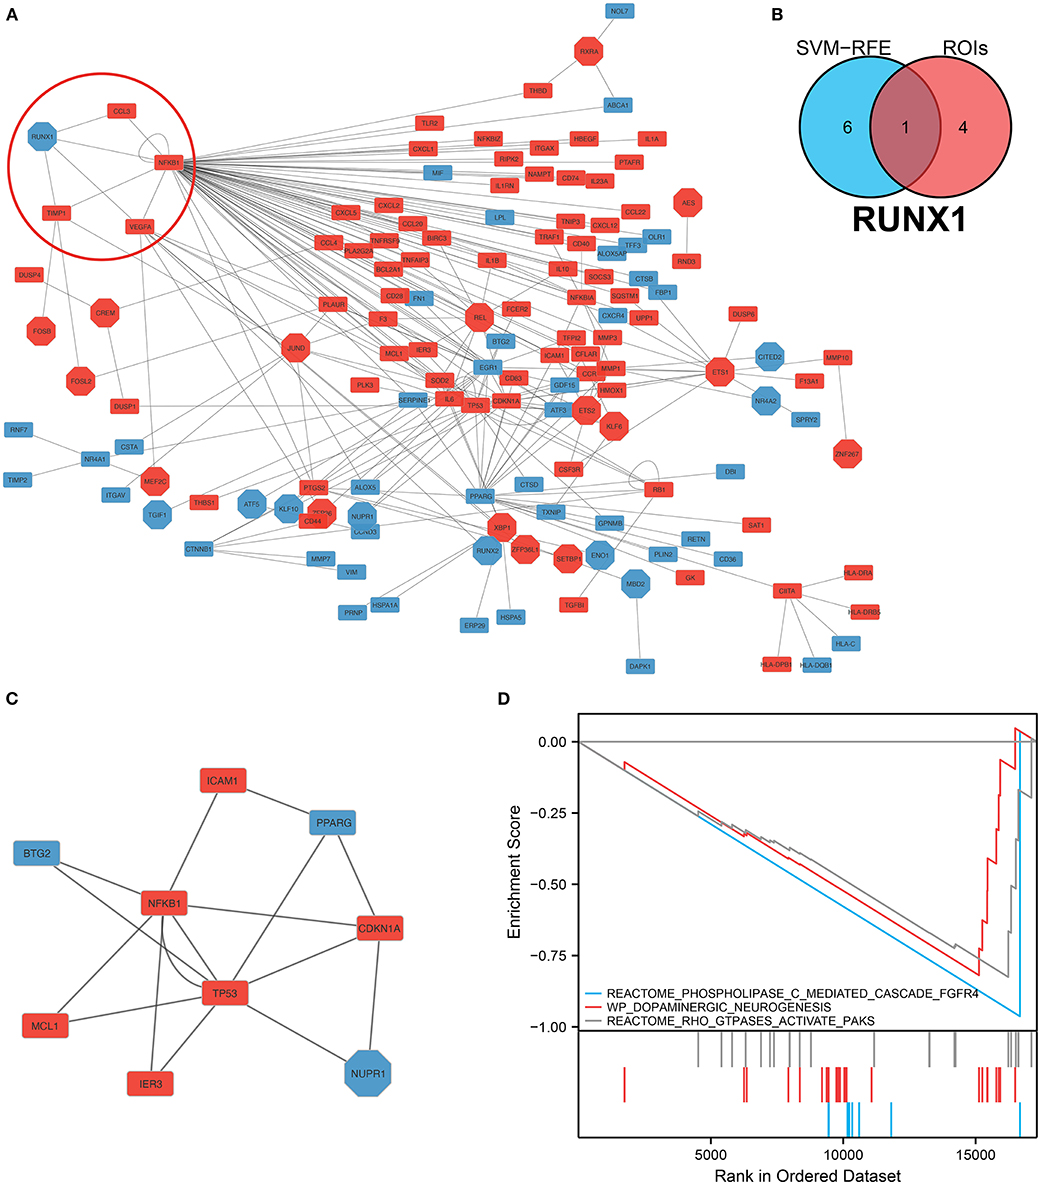
Figure 6. Construction of the protein–protein interaction network and hub gene screening. (A) TF-mRNA protein–protein interaction network in monocytes/macrophages. The red circles denote the RUNX1 and target genes. (B) Intersection analysis of the seven genes screened using the SVM–RFE model, and these five regions of interest yielded the hub gene RUNX1. (C) Sub-protein–protein interaction network showing that NFKB1, which is regulated by RUNX1, is the hub gene in this PPI network. (D) Gene Set Enrichment Analysis of RUNX1 at the single-cell level.
Correlation Between RUNX1 and IA Progression
We performed GSEA analysis of monocytes/macrophages in the single cell dataset. GSEA showed phospholipase C-mediated cascade FGFR4, dopaminergic neurogenesis, and RHO GTPases activate PAKs were downregulated in monocytes/macrophages upregulated with RUNX1 (Figure 6D). Based on GSE122897, GSEA was also further performed to explore the functional pathways enriched for RUNX1 at the individual level (Figure 7). Moreover, it revealed that in samples with upregulated RUNX1 expression, nonalcoholic fatty liver disease, oxidative phosphorylation, RUNX1 regulates the transcription of genes involved in the differentiation of HSCs and those involved in megakaryocyte differentiation, and platelet function pathway RUNX1 regulates genes involved in megakaryocyte differentiation and platelet function. Therefore, RUNX1 plays a complex role in IA progression. Further, it might be involved in IA progression via the regulation of HSC differentiation and platelet production and might play a potential regulatory role in oxidative phosphorylation.
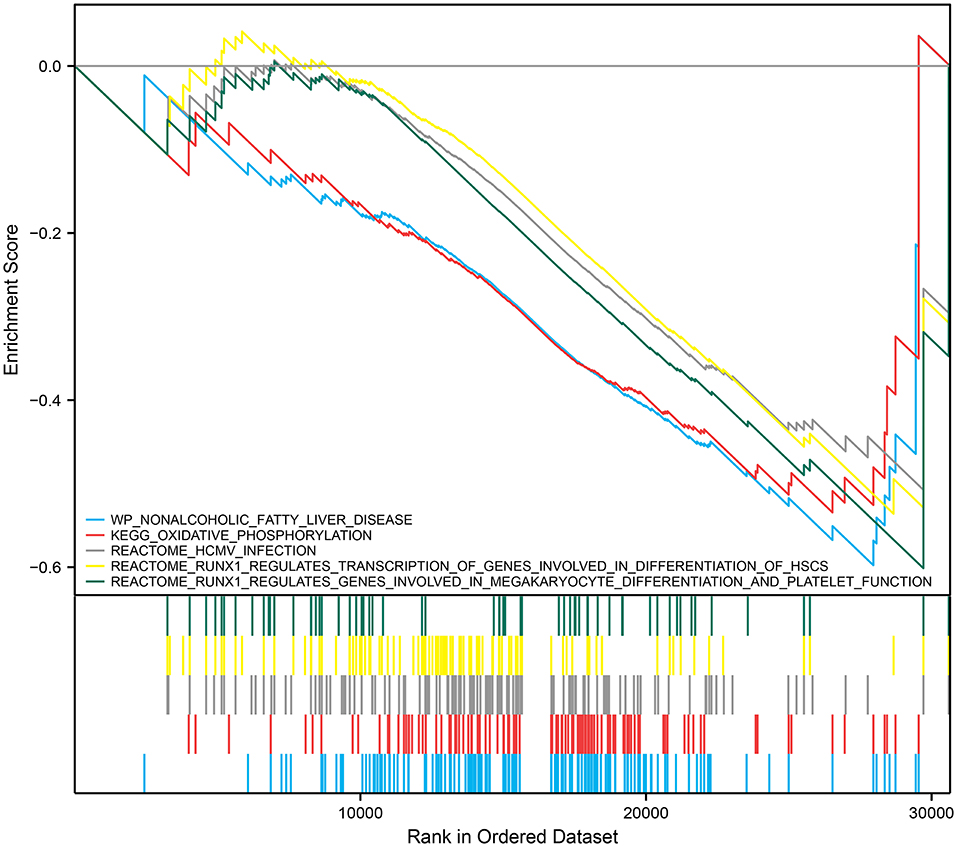
Figure 7. RUNX1 GSEA at the bulk RNA level.
Discussion
From cellular data, it is evident that RUNX1 contributes to the development of IA via its role in regulating NFKB1 in monocytes/macrophages within the hypertensive microenvironment. GSEA revealed that RUNX1 was associated with IA progression by regulating hematopoietic stem cell differentiation and platelet production.
In this study, scRNA-seq data were used to examine the transcriptional patterns of IA at the single-cell level. The risk mRNAs of IA were screened, and predictive models were established using the combined bulk RNA-seq data. Further, the IA-related TF-gene regulatory network was constructed. RUNX1 was identified as the hub gene, and it regulated four genes. And NFKB1 was found to be regulated by RUNX1. This finding was consistent with that of previous studies showing that NF-κB was involved in IA progression (44, 45). And we first identified the mechanism at the single-cell level.
RUNX1 was significantly expressed in the IA group (P < 0.001). GSEA revealed that phospholipase C-mediated cascade FGFR4, dopaminergic neurogenesis, and RHO GTPases activate PAKs were downregulated in monocytes/macrophages cells where RUNX1 was upregulated. Thus, RUNX1 plays a complex role in IA progression, possibly via the regulation of hematopoietic stem cell differentiation and platelet production. RUNX1 might be a hub gene between hypertension, IA, and DEGs in monocytes. Previous studies have found that RUNX1 is involved in hypertension progression to some extent. Further, it is an important hematopoietic transcription factor associated with thrombocytopenia and impaired platelet activation response and is correlated with vascular disease progression (46). RUNX1 is involved in endothelial cells and hematopoietic processes, thereby affecting endothelial function and inflammatory changes, and the abnormal expression of RUNX1 can induce hypertension (47). An experimental study has shown that the inhibition of RUNX1 expression decreases pulmonary hypertension progression in mice (47). In addition, it reduces vascular remodeling and macrophage recruitment, which play essential roles in hypertension progression (48, 49). Hypertension is a significant risk factor for IA progression.
The role of RUNX1 identified in related studies may be relevant to IA. RUNX1 is involved in regulating endothelial cell function and is a key transcriptional regulator of the conversion of endothelial to hematopoietic cells (47, 50). An early feature of IA is endothelial cell dysfunction and degeneration (51). Lilly et al. found that SOX7 interacted with RUNX1 at the protein level and inhibited the transcriptional activity of RUNX1, thereby regulating the conversion of endothelial to hematopoietic cells and maintaining arterial endothelium stability (52). RUNX1 can directly or indirectly regulate signal transduction pathways such as the TGF-β signaling pathway and the Wnt signaling pathway (53). TGF-β is associated with cerebral edema after subarachnoid hemorrhage and can be used as a prognostic indicator (54). Therefore, RUNX1 in the TGF-β signaling pathway may be correlated with the progression and prognosis of IA. Based on the functions played by RUNX1 in the progression of hypertension and IA, we hypothesized that RUNX1 promotes hypertension progression combined with IA.
A population-wide genomic study showed that NFKB1 is a susceptibility gene for primary hypertension (54). NFKB1 is involved in hypertension progression by affecting vascular endothelial function via the regulation of downstream NOS3 gene expression (55). It also promotes oxidative stress injury in gestational hypertensive mice, which contributes to hypertension pathogenesis (56–58). In addition, NF-κB is involved in the IA progression via several pathways. The activation of NF-κB in signaling pathways upregulates MCP-1 expression and participates in the apoptotic process in vascular smooth muscle cells. This phenomenon further reduces the elasticity of the cerebral vascular wall, making it less able to adapt to altered hemodynamics, promotes IA progression, and increases the risk of rupture (59–61). NF-κB elevates the transcription of various pro-inflammatory genes such as COX-2, CCL-2, MMP, and iNOS, and the inflammatory response is involved in the progression and rupture of IA (62, 63). Moreover, macrophage infiltration and NF-κB activation are reduced if macrophages are specifically absent or in the mutants of the NF-κB inhibitory protein. To the best of our knowledge, this study first identified the role of RUNX1 in monocytes/macrophages at the single-cell level in IA progression among patients with hypertension via the regulation of NFKB1.
The purpose of this study was to investigate the potential mechanisms of IA induction by monocytes and macrophages in the hypertensive microenvironment at the single-cell level using bioinformatics. RUNX1 and its regulated NFKB1 were identified as hub genes. RUNX1 may play a role in the progression of IA by regulating abnormalities in hematopoietic stem cell differentiation and platelet production. Identification of these two genes is an important step in understanding IA mechanisms in patients with hypertension. Moreover, it can facilitate further research about potential targets for preventing and reducing the risk of IA in patients with hypertension. There was no single-cell dataset available for IA assessment; therefore, the single-cell dataset (GSE166676) for AAA assessment was used instead. The dataset should be expanded in the future. Finally, neither cellular nor animal tests were conducted to investigate the signaling pathways of the identified hub genes. Further work is required to corroborate these findings.
Conclusion
RUNX1 in monocytes/macrophages is associated with the development of IA via the expression of NFKB1 among patients with hypertension. This potential role can lay the foundation for the further identification of molecular mechanisms underlying IA progression in patients with hypertension and can provide data about treatment targets in IA among patients with hypertension.
Data Availability Statement
Publicly available datasets were analyzed in this study. This data can be found here: National Center for Biotechnology Information (NCBI) Gene Expression Omnibus (GEO), https://www.ncbi.nlm.nih.gov/geo/, GSE75360 data set and GSE122897.
Ethics Statement
Ethical review and approval was not required for the study on human participants in accordance with the local legislation and institutional requirements. Written informed consent from the patients/participants or patients/participants' legal guardian/next of kin was not required to participate in this study in accordance with the national legislation and the institutional requirements.
Author Contributions
YL: software, validation, formal analysis, data curation, and writing—original draft. ZZ: software, validation, formal analysis, supervision, data curation, and writing—original draft. DL: conceptualization, methodology, supervision, writing—review and editing, and project administration. All authors contributed to the article and approved the submitted version.
Funding
This work was funded by Project of Ningxia Medical University (XZ2021025 to YL). This work was also supported by the Natural Science Foundation of Shandong Province (A study on the mechanism of temporal lobe epilepsy comorbid anxiety based on negative emotional information processing in amygdala activation and changes in the effective link of brain function. No. ZR2019BH043).
Conflict of Interest
The authors declare that the research was conducted in the absence of any commercial or financial relationships that could be construed as a potential conflict of interest.
Publisher's Note
All claims expressed in this article are solely those of the authors and do not necessarily represent those of their affiliated organizations, or those of the publisher, the editors and the reviewers. Any product that may be evaluated in this article, or claim that may be made by its manufacturer, is not guaranteed or endorsed by the publisher.
Supplementary Material
The Supplementary Material for this article can be found online at: https://www.frontiersin.org/articles/10.3389/fneur.2022.877801/full#supplementary-material
Abbreviations
AAA, Abdominal aortic aneurysm; IA, Intracranial aneurysm; RUNX1, Runt-related transcription factor 1; SAH, Subarachnoid hemorrhage, SVM-RFE, Support Vector Machines–Recursive Feature Elimination algorithm.
References
1. Bo L, Wei B, Wang Z, Li C, Gao Z, Miao Z. Bioinformatic analysis of gene expression profiling of intracranial aneurysm. Mol Med Report. (2017) 17:3473–80. doi: 10.3892/mmr.2017.8367
2. Vlak MH, Algra A, Brandenburg R, Rinkel GJ. Prevalence of unruptured intracranial aneurysms, with emphasis on sex, age, comorbidity, country, and time period: a systematic review and meta-analysis. Lancet Neurol. (2011) 10:626–36. doi: 10.1016/S1474-4422(11)70109-0
3. Thompson BG, Brown RD, Amin-Hanjani S, Broderick JP, Cockroft KM, Connolly ES, et al. Guidelines for the management of patients with unruptured intracranial aneurysms: a Guideline for healthcare professionals from the american heart association/American stroke association. Stroke. (2015) 46:2368–400. doi: 10.1161/STR.0000000000000070
4. Tada Y, Makino H, Furukawa H, Shimada K, Wada K, Liang EI, et al. Roles of estrogen in the formation of intracranial aneurysms in ovariectomized female mice. Neurosurgery.. (2014) 75:690–5. doi: 10.1227/NEU.0000000000000528
5. Jiranukool J, Thiarawat P, Galassi W. Prevalence of intracranial aneurysms among acute ischemic stroke patients. Surgical Neurol Int. (2020) 11:341. doi: 10.25259/SNI_506_2020
6. De Backer A. Handbook of neurosurgery. Acta Chirurgica Belgica. (2016) 116:269. doi: 10.1080/00015458.2016.1229422
7. Niemann DB, Wills AD, Maartens NF, Kerr RSC, Byrne JV, Molyneux AJ. Treatment of intracerebral hematomas caused by aneurysm rupture: coil placement followed by clot evacuation. J Neurosurg. (2003) 99:843–7. doi: 10.3171/jns.2003.99.5.0843
8. Zacharia BE, Hickman ZL, Grobelny BT, DeRosa P, Kotchetkov I, Ducruet AF, et al. Epidemiology of aneurysmal subarachnoid hemorrhage. Neurosurg Clin N Am. (2010) 21:221–33. doi: 10.1016/j.nec.2009.10.002
9. Long A, Bui HT, Barbe C, Henni AH, Journet J, Metz D, et al. Prevalence of abdominal aortic aneurysm and large infrarenal aorta in patients with acute coronary syndrome and proven coronary stenosis: a prospective monocenter study. Ann Vasc Surg. (2010) 24:602–8. doi: 10.1016/j.avsg.2009.12.010
10. Joviliano EE, Ribeiro MS, Tenorio EJ, MicroRNAs R. Current concepts on the pathogenesis of abdominal aortic aneurysm. Braz J Cardiovasc Surg. (2017) 32: 215–24. doi: 10.21470/1678-9741-2016-0050
11. Adewunmi T. A review on the effects of sleep duration on hypertension. Life Res. (2020) 3:39. doi: 10.53388/life2020-0125-303
12. Dietrich P. Genetischer einfluss bei intrakraniellen aneurysmen. Radiologe. (2020) 60:329–33. doi: 10.1007/s00117-020-00663-9
13. Kataoka H, Yagi T, Ikedo T, Imai H, Kawamura K, Yoshida K, et al. Histopathological changes in the early phase of the development of an intracranial aneurysm. Neurol Med Chir(Tokyo). (2020) 60:319–28. doi: 10.2176/nmc.st.2020-0072
14. Ikedo T, Minami M, Kataoka H, Hayashi K, Nagata M, Fujikawa R, et al. Dipeptidyl peptidase-4 inhibitor anagliptin prevents intracranial aneurysm growth by suppressing macrophage infiltration and activation. JAHA. (2017) 6:4777. doi: 10.1161/JAHA.116.004777
15. Muhammad S, Chaudhry SR, Dobreva G, Lawton MT, Niemelä M, Hänggi D. Vascular macrophages as therapeutic targets to treat intracranial aneurysms. Front Immunol. (2021) 12:630381. doi: 10.3389/fimmu.2021.630381
16. Liu Y, Fang S, Li X, Feng J, Du J, Guo L, et al. Aspirin inhibits lPS-induced macrophage activation via the nF-κB pathway. Sci Rep. (2017) 7:11549. doi: 10.1038/s41598-017-10720-4
17. Shao L, Qin X, Liu J, Jian Z, Xiong X, Liu R. Macrophage polarization in cerebral aneurysm: perspectives and potential targets. J Immunol Res. (2017) 2017:1–7. doi: 10.1155/2017/8160589
18. Aoki T, Saito M, Koseki H, Tsuji K, Tsuji A, Murata K, et al. Macrophage imaging of cerebral aneurysms with ferumoxytol: an exploratory study in an animal model and in patients. J Stroke Cerebrovasc Dis. (2017) 26:2055–64. doi: 10.1016/j.jstrokecerebrovasdis.2016.10.026
19. Maruoka M, Kedashiro S, Ueda Y, Mizutani K, Takai Y. Nectin-4 co-stimulates the prolactin receptor by interacting with sOCS1 and inhibiting its activity on the jAK2-STAT5a signaling pathway. J Biol Chem. (2017) 292:6895–909. doi: 10.1074/jbc.M116.769091
20. Efremova M, Vento-Tormo M, Teichmann SA, Vento-Tormo R. CellPhoneDB: inferring cell–cell communication from combined expression of multi-subunit ligand–receptor complexes. Nat Protoc. (2020) 15:1484–506. doi: 10.1038/s41596-020-0292-x
21. Jin S, Guerrero-Juarez CF, Zhang L, Chang I, Ramos R, Kuan C-H, et al. Analysis of cell-cell communication using cellchat. Nat Commun. (2021) 12:1088. doi: 10.1038/s41467-021-21246-9
22. Zhao X, Yang J, Yang C. The neuronal transcription factor creb3l1 potential upregulates ntrk2 in the hypertensive microenvironment to promote vascular smooth muscle cell-neuron interaction and prevent neurons from ferroptosis: a bioinformatic research of scRNA-seq data. DIS MARKERS. 11:8339759. doi: 10.1155/2022/8339759
23. Chen Y, Sun Y, Xu Y, Lin W-W, Luo Z, Han Z, et al. Single-cell integration analysis of heterotopic ossification and fibrocartilage developmental lineage: endoplasmic reticulum stress effector xbp1 transcriptionally regulates the notch signaling pathway to mediate fibrocartilage differentiation. Oxid Med Cel Longev. (2021) 2021:1–29. doi: 10.1155/2021/7663366
24. Lin W, Wang Y, Chen Y, Wang Q, Gu Z, Zhu Y. Role of calcium signaling pathway-Related gene regulatory networks in ischemic stroke based on multiple wGCNA and single-cell analysis. Oxid Med Cel Longev. (2021) 2021:1–35. doi: 10.1155/2021/8060477
25. Liu X, Gao W, Liu W. Identification of kLF6/PSGs and nPY-Related uSF2/CEACAM transcriptional regulatory networks via spinal cord bulk and single-Cell rNA-Seq analysis. Dis Markers. (2021) 2021:1–21. doi: 10.1155/2021/2826609
26. Kumar MP, Du J, Lagoudas G, Jiao Y, Sawyer A, Drummond DC, et al. Analysis of single-Cell rNA-Seq identifies cell-cell communication associated with tumor characteristics. Cell Reports. (2018) 25:1458–68.e4. doi: 10.1016/j.celrep.2018.10.047
27. Murray LMA, Krasnodembskaya AD. Concise review: intercellular communication via organelle transfer in the biology and therapeutic applications of stem cells. Stem Cells. (2019) 37:14–25. doi: 10.1002/stem.2922
28. Garofalo M, Villa A, Crescenti D, Marzagalli M, Kuryk L, Limonta P, et al. and cross-species tropism of cancer-derived extracellular vesicles. Theranostics.. (2019) 9:5681–93. doi: 10.7150/thno.34824
29. Ren X, Wen W, Fan X, Hou W, Su B, Cai P, et al. COVID-19 immune features revealed by a large-scale single-cell transcriptome atlas. Cell. (2021) 184:1895–913.e19. doi: 10.1016/j.cell.2021.01.053
30. Dluzen DF, Noren Hooten N, Zhang Y, Kim Y, Glover FE, Tajuddin SM, et al. Racial differences in microRNA and gene expression in hypertensive women. Sci Rep. (2016) 6:35815. doi: 10.1038/srep35815
31. Kurki MI, Häkkinen S-K, Frösen J, Tulamo R, von und zu Fraunberg M, Wong G, et al. Upregulated signaling pathways in ruptured human saccular intracranial aneurysm wall: an emerging regulative role of toll-Like receptor signaling and nuclear factor-κB, hypoxia-Inducible factor-1A, and eTS transcription factors. Neurosurgery. (2011) 68:1667–76. doi: 10.1227/NEU.0b013e318210f001
32. Davis FM, Tsoi LC, Melvin WJ, denDekker A, Wasikowski R, Joshi AD, et al. Inhibition of macrophage histone demethylase jMJD3 protects against abdominal aortic aneurysms. J Exp Med. (2021) 218:e20201839. doi: 10.1084/jem.20201839
33. Stuart T, Butler A, Hoffman P, Hafemeister C, Papalexi E, Mauck WM, et al. Comprehensive integration of single-vcell data. Cell. (2019) 177:1888–902.e21. doi: 10.1016/j.cell.2019.05.031
34. Becht E, McInnes L, Healy J, Dutertre C-A, Kwok IWH, Ng LG, et al. Dimensionality reduction for visualizing single-cell data using uMAP. Nat Biotechnol. (2018) 37:38–44. doi: 10.1038/nbt.4314
35. Aran D, Looney AP, Liu L, Wu E, Fong V, Hsu A, et al. Reference-based analysis of lung single-cell sequencing reveals a transitional profibrotic macrophage. Nat Immunol. (2019) 20:163–72. doi: 10.1038/s41590-018-0276-y
36. Raffort J, Lareyre F, Clément M, Hassen-Khodja R, Chinetti G, Mallat Monocytes Z. Macrophages in abdominal aortic aneurysm. Nat Rev Cardiol.. (2017) 14:457–71. doi: 10.1038/nrcardio.2017.52
37. Ritchie ME, Phipson B, Wu D, Hu Y, Law CW, Shi W, et al. limma powers differential expression analyses for rNA-sequencing and microarray studies. Nucleic Acids Res. (2015) 43:e47. doi: 10.1093/nar/gkv007
38. Robinson MD, McCarthy DJ, Smyth GK. edgeR: a bioconductor package for differential expression analysis of digital gene expression data. Bioinformatics. (2010) 26:139–40. doi: 10.1093/bioinformatics/btp616
39. Huang M-L, Hung Y-H, Lee WM, Li RK, Jiang B-R. SVM-RFE based feature selection and taguchi parameters optimization for multiclass sVM classifier. Sci World J. (2014) 2014:795624. doi: 10.1155/2014/795624
40. Han H, Cho J-W, Lee S, Yun A, Kim H, Bae D, et al. TRRUST v2: an expanded reference database of human and mouse transcriptional regulatory interactions. Nucleic Acids Re.s. (2018) 46:D380–6. doi: 10.1093/nar/gkx1013
41. Yu G, Wang L-G, Han Y, He Q-Y. clusterProfiler: an r Package for comparing biological themes among gene clusters. OMICS J Integr Biol. (2012) 16:284–7. doi: 10.1089/omi.2011.0118
42. Lu L, Kang X, Yi B, Jiang C, Yan X, Chen B, et al. Exploring the mechanism of yiqi qingre ziyin method in regulating neuropeptide expression for the treatment of atrophic rhinitis. Disease Mar. (2022) 2022:1–12. doi: 10.1155/2022/4416637
43. Subramanian A, Tamayo P, Mootha VK, Mukherjee S, Ebert BL, Gillette MA, et al. Gene set enrichment analysis: a knowledge-based approach for interpreting genome-wide expression profiles. PNAS. (2005) 102:15545–50. doi: 10.1073/pnas.0506580102
44. Sun X, Zheng X, Zhang X, Zhang Y, Luo G. Exosomal microRNA-23b-3p from bone marrow mesenchymal stem cells maintains t helper/Treg balance by downregulating the pI3k/Akt/NF-κB signaling pathway in intracranial aneurysm. Brain Research Bulletin. (2020) 165:305–15. doi: 10.1016/j.brainresbull.2020.09.003
45. Aoki T, Fr?sen J, Fukuda M, Bando K, Shioi G, Tsuji K, et al. Prostaglandin e [[sb]]2[[/s]] –EP2–NF-κB signaling in macrophages as a potential therapeutic target for intracranial aneurysms. Sci Signal. (2017) 10:eaah6037. doi: 10.1126/scisignal.aah6037
46. Mao G, Songdej N, Voora D, Goldfinger LE, Del Carpio-Cano FE, Myers RA, et al. Transcription factor rUNX1 regulates platelet pCTP. (Phosphatidylcholine transfer protein) : implications for cardiovascular events: differential effects of rUNX1 variants. Circulation. (2017) 136:927–39. doi: 10.1161/CIRCULATIONAHA.116.023711
47. Chen MJ, Yokomizo T, Zeigler BM, Dzierzak E, Speck NA. RUNX1 is required for the endothelial to haematopoietic cell transition but not thereafter. Nature. (2009) 457:887–91. doi: 10.1038/nature07619
48. Jeong E-M, Pereira M, So E-Y, Wu KQ, Del Tatto M, Wen S, et al. Targeting rUNX1 as a novel treatment modality for pulmonary arterial hypertension. Cardiovasc Res. (2022) 00:1. doi: 10.1093/cvr/cvac001
49. Luo F, Wu Y, Ding Q, Yuan Y, Jia W. Rs884225 polymorphism is associated with primary hypertension by compromising interaction between epithelial growth factor receptor. (EGFR) and miR-214. J Cell Mol Med. (2021) 25:3714–23. doi: 10.1111/jcmm.15976
50. Kurokawa M. AML1/RUNX1 as a versatile regulator of hematopoiesis: regulation of its function and a role in adult hematopoiesis. Int J Hematol. (2006) 84:136–12. doi: 10.1532/IJH97.06070
51. Liu P, Shi Y, Fan Z, Zhou Y, Song Y, Liu Y, et al. Inflammatory smooth muscle cells induce endothelial cell alterations to influence cerebral aneurysm progression via regulation of integrin and vEGF expression. Cell Transplant. (2019) 28:713–22. doi: 10.1177/0963689718815824
52. Lilly AJ, Costa G, Largeot A, Fadlullah MZH, Lie-A-Ling M, Lacaud G, et al. Interplay between sOX7 and rUNX1 regulates hemogenic endothelial fate in the yolk sac. Development. (2016) 1:140970. doi: 10.1242/dev.140970
53. Bae S-C, Kolinjivadi AM, Ito Y. Functional relationship between p53 and rUNX proteins. J Mol Cell Biol. (2019) 11:224–30. doi: 10.1093/jmcb/mjy076
54. Douglas MR, Daniel M, Lagord C, Akinwunmi J, Jackowski A, Cooper C, et al. High cSF transforming growth factor levels after subarachnoid haemorrhage: association with chronic communicating hydrocephalus. J Neurol Neurosurg Psychiatry. (2009) 80:545–50. doi: 10.1136/jnnp.2008.155671
55. Park J-Y, Farrance IKG, Fenty NM, Hagberg JM, Roth SM, Mosser DM, et al. NFKB1 promoter variation implicates shear-induced nOS3 gene expression and endothelial function in prehypertensives and stage i hypertensives. Am J Physiol Heart Circ Physiol. (2007) 293:H2320–7. doi: 10.1152/ajpheart.00186.2007
56. Guo Y, Liu Z, Wang M. NFKB1-mediated downregulation of microRNA-106a promotes oxidative stress injury and insulin resistance in mice with gestational hypertension. Cytotechnology. (2021) 73:115–26. doi: 10.1007/s10616-020-00448-x
57. Baradaran A, Nasri H, Rafieian-Kopaei M. Oxidative stress and hypertension: possibility of hypertension therapy with antioxidants. J Res Med Sci. (2014) 19:358–67.
58. Gryszczyńska B, Budzyń M, Begier-Krasińska B, Osińska A, Boruczkowski M, Kaczmarek M, et al. Association between advanced glycation end products, soluble rAGE receptor, endothelium dysfunction. evaluated by circulating endothelial cells and endothelial progenitor cells in patients with mild and resistant hypertension. IJMS. (2019) 20:3942. doi: 10.3390/ijms20163942
59. Staarmann B, Smith M, Prestigiacomo CJ. Shear stress and aneurysms: a review. Neurosurgical Focus. (2019) 47:E2. doi: 10.3171/2019.4.FOCUS19225
60. Chalouhi N, Atallah E, Jabbour P, Patel PD, Starke RM, Hasan D. Aspirin for the prevention of intracranial aneurysm rupture. Neurosurgery. (2017) 64:114–8. doi: 10.1093/neuros/nyx299
61. Chu C, Xu G, Li X, Duan Z, Tao L, Cai H, et al. Sustained expression of mCP-1 induced low wall shear stress loading in conjunction with turbulent flow on endothelial cells of intracranial aneurysm. J Cell Mol Med. (2021) 25:110–9. doi: 10.1111/jcmm.15868
62. Yoshida K, Uwano I, Sasaki M, Takahashi O, Sakai N, Tsuruta W, et al. Small unruptured aneurysm verification-prevention effect against growth of cerebral aneurysm study using statin. Neurol Med Chir(Tokyo). (2021) 61:442–51. doi: 10.2176/nmc.oa.2021-0017
Keywords: intracranial aneurysm (IA), hypertension, monocytes/macrophages, Runx1, NFKB1
Citation: Li Y, Zhang Z and Liu D (2022) Intracranial Aneurysms Induced by RUNX1 Through Regulation of NFKB1 in Patients With Hypertension-An Integrated Analysis Based on Multiple Datasets and Algorithms. Front. Neurol. 13:877801. doi: 10.3389/fneur.2022.877801
Received: 17 February 2022; Accepted: 22 April 2022;
Published: 17 May 2022.
Edited by:
Yuzhen Xu, Tongji University, ChinaReviewed by:
Yu Zeng, Second Affiliated Hospital of Guangdong Medical University, ChinaXinbing Liu, Changxing People's Hospital, China
Yang Jie, Second Affiliated Hospital of Shandong University of Traditional Chinese Medicine, China
Copyright © 2022 Li, Zhang and Liu. This is an open-access article distributed under the terms of the Creative Commons Attribution License (CC BY). The use, distribution or reproduction in other forums is permitted, provided the original author(s) and the copyright owner(s) are credited and that the original publication in this journal is cited, in accordance with accepted academic practice. No use, distribution or reproduction is permitted which does not comply with these terms.
*Correspondence: Donghua Liu, DhuaL@mau.edu.mk
†These authors have contributed equally to this work