Striatal Transcriptome and Interactome Analysis of Shank3-overexpressing Mice Reveals the Connectivity between Shank3 and mTORC1 Signaling
 Yeunkum Lee1,2
  Sun Gyun Kim3
  Bokyoung Lee1
  Yinhua Zhang1,2 Yoonhee Kim1 Shinhyun Kim1,2
  Eunjoon Kim3,4
  Hyojin Kang5*
  Kihoon Han1,2*
- 1Department of Neuroscience, College of Medicine, Korea University, Seoul, South Korea
- 2Department of Biomedical Sciences, College of Medicine, Korea University, Seoul, South Korea
- 3Center for Synaptic Brain Dysfunctions, Institute for Basic Science (IBS), Daejeon, South Korea
- 4Department of Biological Sciences, Korea Advanced Institute of Science and Technology (KAIST), Daejeon, South Korea
- 5HPC-enabled Convergence Technology Research Division, Korea Institute of Science and Technology Information, Daejeon, South Korea
Mania causes symptoms of hyperactivity, impulsivity, elevated mood, reduced anxiety and decreased need for sleep, which suggests that the dysfunction of the striatum, a critical component of the brain motor and reward system, can be causally associated with mania. However, detailed molecular pathophysiology underlying the striatal dysfunction in mania remains largely unknown. In this study, we aimed to identify the molecular pathways showing alterations in the striatum of SH3 and multiple ankyrin repeat domains 3 (Shank3)-overexpressing transgenic (TG) mice that display manic-like behaviors. The results of transcriptome analysis suggested that mammalian target of rapamycin complex 1 (mTORC1) signaling may be the primary molecular signature altered in the Shank3 TG striatum. Indeed, we found that striatal mTORC1 activity, as measured by mTOR S2448 phosphorylation, was significantly decreased in the Shank3 TG mice compared to wild-type (WT) mice. To elucidate the potential underlying mechanism, we re-analyzed previously reported protein interactomes, and detected a high connectivity between Shank3 and several upstream regulators of mTORC1, such as tuberous sclerosis 1 (TSC1), TSC2 and Ras homolog enriched in striatum (Rhes), via 94 common interactors that we denominated “Shank3-mTORC1 interactome”. We noticed that, among the 94 common interactors, 11 proteins were related to actin filaments, the level of which was increased in the dorsal striatum of Shank3 TG mice. Furthermore, we could co-immunoprecipitate Shank3, Rhes and Wiskott-Aldrich syndrome protein family verprolin-homologous protein 1 (WAVE1) proteins from the striatal lysate of Shank3 TG mice. By comparing with the gene sets of psychiatric disorders, we also observed that the 94 proteins of Shank3-mTORC1 interactome were significantly associated with bipolar disorder (BD). Altogether, our results suggest a protein interaction-mediated connectivity between Shank3 and certain upstream regulators of mTORC1 that might contribute to the abnormal striatal mTORC1 activity and to the manic-like behaviors of Shank3 TG mice.
Introduction
Bipolar disorder (BD), characterized by recurrent mood swings between depression and mania, is a highly heritable and chronic mental illness that affects approximately 2.5% of the population worldwide (Merikangas et al., 2011). Manic episodes are the defining feature of BD, and manic symptoms include hyperactivity, impulsivity, elevated mood, reduced anxiety and decreased need for sleep (Grande et al., 2016). These core symptoms suggest that a dysfunction of the striatum, the key component of the brain motor and reward systems, may be involved in the pathogenesis of manic disorder. This hypothesis is supported by structural and functional abnormalities observed in the striatum of the patients with BD (Strakowski et al., 1999; Blumberg et al., 2003; Wessa et al., 2007). However, the detailed molecular pathophysiology underlying striatal dysfunction in mania remains largely unknown.
The mammalian target of rapamycin (mTOR) pathway integrates various external signals and controls diverse cellular processes including translation, apoptosis, autophagy and energy metabolism (Laplante and Sabatini, 2012). The serine/threonine kinase mTOR forms two protein complexes, mTOR complex 1 (mTORC1) and mTORC2, which have different subunit compositions and cellular functions. The heterodimeric complex of tuberous sclerosis 1 (TSC1) and TSC2 is a critical upstream regulator of mTORC1 that functions as a guanosine triphosphatase (GTPase)-activating protein (GAP) for the small GTPase Ras homolog enriched in brain (Rheb; Huang and Manning, 2008). As the active (GTP-bound) form of Rheb directly binds and activates mTORC1, TSC1/TSC2 complex is a negative regulator of mTORC1 pathway. In the striatum, Ras homolog enriched in striatum (Rhes, encoded by Rasd2 gene), a small GTPase highly enriched in the striatal medium spiny neurons (MSNs), has roles similar to Rheb in directly binding and activating mTORC1 in a GTP-dependent manner (Subramaniam et al., 2011). The activity of Rhes is regulated by Ras guanyl releasing protein 1 (RasGRP1), a guanine nucleotide exchange factor (GEF), in the striatum (Shahani et al., 2016).
In the brain, the mTOR pathway is involved in various aspects of neuronal development and function including dendrite formation, axonal elongation and synapse formation and plasticity (Hoeffer and Klann, 2010; Takei and Nawa, 2014). This pathway has critical roles in normal brain function, as abnormalities in the expression and/or activity of its upstream and downstream components have been identified in numerous neurodevelopmental and neuropsychiatric disorders, including autism spectrum disorders (ASDs), drug addiction, intellectual disability (ID), major depressive disorder (MDD), and schizophrenia (SCZ; Costa-Mattioli and Monteggia, 2013). Specifically, it has been shown that mTORC1 pathway is compromised in the prefrontal cortex of patients with MDD (Jernigan et al., 2011). Furthermore, the therapeutic efficacy of a fast-acting antidepressant ketamine is dependent on the activation of mTORC1 pathway that increases the synthesis of excitatory synaptic proteins (such as PSD-95 and glutamate receptors) and the number of dendritic spines in the prefrontal cortex (Li et al., 2010; Abdallah et al., 2015). However, potential alterations of the mTOR pathway in the striatum of the patients with mania have been scarcely investigated.
Several pharmacological and genetic rodent models of mania have been generated and characterized, and these, even with some limitations, have provided important insights towards understanding the pathogenic mechanisms in mania (Chen G. et al., 2010; Kato et al., 2016; Logan and McClung, 2016). We recently reported that EGFP-Shank3 (SH3 and multiple ankyrin repeat domains 3)-overexpressing transgenic (TG) mice display manic-like behaviors at the adult stage (8 to 12-week-old), such as locomotor hyperactivity, hypersensitivity to amphetamine, increased acoustic startle response, reduced prepulse inhibition and abnormal circadian rhythms. Although some of the behavioral abnormalities of Shank3 TG mice could also be observed in mice modeling other disorders such as ASDs and SCZ, the Shank3 TG mice responded to valproic acid, a Food and Drug Administration (FDA)-approved drug for the treatment of manic or mixed episodes in BD (Han et al., 2013b). The Shank3 TG mice mildly overexpress Shank3 proteins (by approximately 50%) compared to wild-type (WT) mice, and thus, could potentially model human patients with SHANK3 gene duplications who usually have an additional copy of SHANK3 gene. Indeed, we could also identify several patients with SHANK3 gene duplications who were diagnosed with mania-like hyperkinetic disorders (Han et al., 2013b). These results altogether support the construct, face and predictive validity (Nestler and Hyman, 2010) of Shank3 TG mice to model human mania. However, importantly, it needs to be validated whether the SHANK3 duplication patients with mania-like hyperkinetic disorders indeed express higher Shank3 protein levels. It is also notable that SHANK3 duplications have been identified in patients with some other disorders including Asperger’s syndrome, SCZ, and attention deficit hyperactivity disorder (ADHD; Durand et al., 2007; Failla et al., 2007; Moessner et al., 2007). In addition to the behavioral phenotypes, we also showed abnormalities of synaptic actin cytoskeleton and dendritic spines in the hippocampus of Shank3 TG mice (Han et al., 2013b). Nevertheless, the hippocampus might not be the primary brain region mediating manic-like behaviors of Shank3 TG mice, especially considering that Shank3 is enriched in the striatum compared to other brain regions (Peça et al., 2011; Monteiro and Feng, 2017). Moreover, the identity of downstream signaling pathways that may be affected by altered synaptic actin cytoskeleton in Shank3 TG mice remains uninvestigated.
SHANK3 (also called ProSAP2 for proline-rich synapse-associated protein 2) gene encodes a core scaffold protein organizing the macromolecular protein complex of the neuronal excitatory postsynapse (Sheng and Kim, 2000; Dosemeci et al., 2016). In addition to duplications, deletions and various point mutations of SHANK3 gene have been causally associated with ASDs, ID and SCZ (Durand et al., 2007; Gauthier et al., 2010; Grabrucker et al., 2011; Jiang and Ehlers, 2013; Guilmatre et al., 2014; Leblond et al., 2014; Choi et al., 2015; Monteiro and Feng, 2017). Notably, several studies investigating Shank3 knock-out (KO) mice and Shank3 knock-down in neurons revealed that the loss of Shank3 expression results in changes of specific signaling pathways such as metabotropic glutamate receptor 5 (mGluR5) signaling (Verpelli et al., 2011; Wang et al., 2016; Vicidomini et al., 2017), and protein kinase B (PKB/Akt)-mTOR signaling (Bidinosti et al., 2016). Moreover, pharmacological treatments (mGluR5 modulators, insulin-like growth factor 1 (IGF1), or Cdc2-like kinase 2 (CLK2) inhibitor) targeting these pathways recued both synaptic and behavioral abnormalities caused by the loss of Shank3 expression (Bozdagi et al., 2013; Shcheglovitov et al., 2013; Bidinosti et al., 2016; Wang et al., 2016; Vicidomini et al., 2017). Therefore, it is conceivable that such signaling pathways might also be altered especially in the striatum of Shank3 TG mice, which could potentially provide an insight into the molecular pathophysiology underlying the striatal dysfunction in manic-like behaviors.
To address this issue, in this study, we performed a transcriptome (RNA sequencing) analysis on the striatal tissue of adult WT and Shank3 TG mice, the results of which suggested mTORC1 signaling as the primary molecular signature affected by Shank3 overexpression. Based on the transcriptome analysis, we examined mTORC1 activity in the striatum of Shank3 TG mice and found that it was decreased compared to that in WT mice. To understand the potential underlying mechanisms, we re-analyzed the previously reported protein interactome data, which revealed that 94 interactors were shared between Shank3 and upstream regulators of mTORC1 (TSC1, TSC2 and Rhes). Moreover, we found that several of the 94 common interactors were involved in regulating actin filaments (F-actin), the amount of which was increased in the dorsal striatum of Shank3 TG mice. By performing a comparison with the disease-associated gene sets, we found that these 94 common interactors were significantly associated with BD and SCZ, but not ASDs. Altogether, our results suggest a protein interaction-mediated connectivity between Shank3 and certain upstream regulators of mTORC1 that might contribute to the abnormal striatal mTORC1 activity and, at least in part, to the manic-like behaviors of Shank3 TG mice.
Materials and Methods
Mice
The enhanced green fluorescent protein (EGFP)-Shank3 TG mice used in this study have been described previously (Han et al., 2013b; Lee B. et al., 2017; Lee Y. et al., 2017). The WT and Shank3 TG mice were bred and maintained on a C57BL/6J background according to the Korea University College of Medicine Research Requirements, and all procedures were approved by the Committees on Animal Research at Korea University College of Medicine (KOREA-2016-0096). The mice were fed ad libitum and housed under a 12-h light-dark cycle.
RNA Sequencing and Analysis
The mice (12-week-old male WT and Shank3 TG, three mice per genotype) were deeply anesthetized with isoflurane and decapitated. The striatum was dissected from each brain using a brain matrix, immediately placed in RNAlater solution (Ambion), and stored at 4°C overnight. RNA extraction, library preparation, cluster generation, and sequencing were performed by Macrogen Inc. (Seoul, Korea). RNA samples for sequencing were prepared using a TruSeq RNA Sample Prep Kit v2 (Illumina) according to the manufacturer’s instructions. An Illumina’s HiSeq 2000 was used for sequencing to generate 101-bp paired-end reads (Supplementary Table S1). Raw data were submitted to the Gene Expression Omnibus (GEO) repository with accession GSE97544.
Pre-processing of raw reads was carried out using Trimmomatic (Bolger et al., 2014) (version 0.35, options: LEADING:3 TRAILING:3 MAXINFO:80:0.4 MINLEN:36), and the trimmed reads were mapped to the Mus musculus genome (GRCm38) using TopHat2 (Kim D. et al., 2013; version 2.1.0, default options). The gene-level read counts were calculated from the aligned reads using HTSeq Python package (Anders et al., 2015). Differential gene expression analysis was performed using DEseq2 package in R/Bioconductor (Love et al., 2014). Normalized read counts were computed by dividing the raw read counts by size factors and fitted to a negative binomial distribution. The P values were first corrected by applying an empirical estimation of the null distribution using the R fdrtool (v.1.2.15) package and then adjusted for multiple testing with the Benjamini–Hochberg correction. Genes with an adjusted P value of less than 0.05 were considered as differentially expressed.
Gene Set Enrichment Analysis (GSEA1; Subramanian et al., 2005) was used to determine whether a priori-defined gene sets would show statistically significant differences in expression between Shank3 TG and WT mice. Enrichment analysis was performed using GSEAPreranked (gsea2-2.2.2.jar) module on gene set collections H (Hallmark gene sets; 50 gene sets) downloaded from Molecular Signature Database (MSigDB) v5.12. Additionally, GSEA analysis was performed by using the sets of genes associated with psychiatric disease from the Psychiatric disorders Gene association NETwork (PsyGeNET) database (last update: Sept., 2016; Gutierrez-Sacristan et al., 2015). GSEAPreranked was applied using the list of all genes expressed, ranked by the fold change and multiplied by the inverse of the P value with recommended default settings (1000 permutations and a classic scoring scheme). The False Discovery Rate (FDR) was estimated to control the false positive finding of a given Normalized Enrichment Score (NES) by comparing the tails of the observed and null distributions derived from 1000 gene set permutations. The gene sets with an FDR of less than 0.05 were considered as significantly enriched.
Construction of Interactome Network
To build an interaction network, the sets of Shank3 (Han et al., 2013b), TSC1/TSC2 (Sakai et al., 2011) and Rhes (Shahani et al., 2016) interactomes were adopted. The network graphics were generated using Cytoscape (Shannon et al., 2003). To simplify the network, orphan nodes, defined as the nodes connecting with only one of the hub proteins (Shank3, TSC1/TSC2 and Rhes), were excluded from the graphics.
Gene Ontology (GO) and Kyoto Encyclopedia of Genes and Genomes (KEGG) Pathway Analysis
The Gene Ontology (GO) and Kyoto Encyclopedia of Genes and Genomes (KEGG) pathway analyses were performed using DAVID software (version 6.8; Huang Da et al., 2009). The set of 94 genes from Shank3-mTORC1 interactome was tested against a customized background of the entire mouse genome. Mouse gene names were converted to human homologs using the Mouse Genome Informatics (MGI) database3.
Disease Association Analysis
Gene-disease association data were retrieved from the PsyGeNET (Gutierrez-Sacristan et al., 2015) and Disease gene association NETwork (DisGeNET) databases (Piñero et al., 2015; last update: Sept., 2016). PsyGeNET database contains information relevant to psychiatric diseases and their associated genes integrated from the DisGeNET (Piñero et al., 2017) database, and data extracted from the literature by text mining, and further curated by the experts in the domain. Additionally, the genes associated with the risk for ASD were obtained from the Simons Foundation Autism Research Initiative (SFARI) database (syndromic and category 3 or above4). The enrichment of disease-associated genes was tested using the hypergeometric distribution test. Hypergeometric P values were calculated using the phyper (q: overlapped genes-1, m: Shank3-mTORC1 interactome, n: protein-coding genes in The HUGO Gene Nomenclature Committee (HGNC)—m, k: disease associated genes) function in R package, and were adjusted for multiple testing with the Benjamini and Hochberg test, as implemented in the Bioconductor’s q value package. Diseases with adjusted P values of less than 0.05 were considered as statistically significantly enriched.
RNA Purification and qRT-PCR
Real-time quantitative reverse transcription PCR (qRT-PCR) was performed as described previously (Han et al., 2013a; Kim et al., 2016; Lee B. et al., 2017). Briefly, total RNA was extracted from the striatum of 12-week-old mice using a miRNeasy minikit (Qiagen) according to the manufacturer’s instructions. Two micrograms of total RNA were used for cDNA synthesis using iScriptTM cDNA Synthesis Kit (Bio-Rad). Target mRNAs were detected and quantified by a real-time PCR instrument (CFX96 Touch, Bio-Rad) using SYBR Green master mix (Bio-Rad). The results were analyzed using the comparative Ct method normalized against the housekeeping gene Gapdh. The primer sequences for real-time PCR are as follows:
Mouse Shank3 forward 5′ TGGTTGGCAAGAGATCCAT 3′,
reverse 5′ TTGGCCCCATAGAACAAAAG 3′
Mouse Gpr85 forward 5′ ATGCAGCCGACAACATTTTGC 3′,
reverse 5′ CAGGTGGAGCCATTTTTGACA 3′
Mouse Clic6 forward 5′ CTCTGGGTTAGACTCTCAGGG 3′,
reverse 5′ GGTGCCTCTGTGTCCATGTT 3′
Mouse Plk5 forward 5′ CGGCACCCTTGTCAGAGATG 3′,
reverse 5′ TGGGGGAAAGGCAAACACAG 3′
Mouse Gapdh forward 5′ GGCATTGCTCTCAATGACAA 3′,
reverse 5′ CCCTGTTGCTGTAGCCGTAT 3′
Biochemistry and Antibodies for Western Blotting
Whole lysates of the mouse brain were prepared as described previously (Han et al., 2009, 2015). Briefly, the striatum and hippocampus of 12-week-old mice were homogenized in RIPA buffer (50 mM Tris-HCl pH 8.0, 150 mM NaCl, 0.1% SDS, 1% Triton X-100, 0.5% sodium deoxycholate) with freshly added protease and phosphatase inhibitors (Roche). Protein concentration was measured using Bradford Protein Assay (Bio-Rad). Brain lysates were heated in 1x NuPAGE LDS sample buffer (Invitrogen) containing a 1x NuPAGE reducing agent (Invitrogen). From each sample, 10~20 μg of proteins were loaded for Western blotting. Immunoprecipitation (IP) was performed as described previously (Han et al., 2013b; Lee Y. et al., 2017). The GFP-Trap beads (ChromoTek) were used to pull down EGFP-Shank3 proteins and their interactors. The antibodies used for Western blotting were Gapdh (Cell Signaling, #2118), GFP (NeuroMAb, #75-131), Homer1b/c (Santa Cruz, sc-20807), Rhes (Millipore, ABN31), Shank3 (Santa Cruz Biotechnology, sc-30193), phospho-mTOR (S2448, Cell Signaling, #2971), mTOR (Cell Signaling, #2983), and WAVE1 (NeuroMab, 75-048). Western blot images were acquired by ChemiDoc Touch Imaging System (Bio-Rad) and quantified using ImageJ software.
Immunohistochemistry and Image Analysis
For each immunohistochemistry (IHC) experiment, 5–7 pairs of 12-week-old WT and Shank3 TG mice from at least three different litters were used. The mice were deeply anesthetized with isoflurane and transcardially perfused with heparinized (20 units/ml) phosphate-buffered saline (PBS) followed by 4% paraformaldehyde (PFA) in PBS. Brains were extracted and post-fixed in 4% PFA overnight. After post-fixation, the brains were washed with PBS and cryoprotected with 30% sucrose in PBS for 48 h. Brains were frozen in O.C.T compound (SAKURA Tissue-Tek, 4583) and sectioned (60 μm) using a cryostat microtome (Leica, CM3050S). For each staining set, two sections were randomly selected from each mouse at a similar anterior posterior level. The following antibodies were used: GFP (Abcam, ab290, 1:500), neuronal nuclei (NeuN; Millipore, MAB377, 1:1000), rhodamine phalloidin (Molecular Probes, R415, 1 unit/200 μl), and Alexa Fluor-conjugated secondary antibodies (Jackson Immunoresearch, 111-585-003 and 115-585-003, 1:500). Confocal microscopy (Zeiss, LSM800) was used to acquire images (10× objective and 0.6× digital zoom) of the striatum (Bregma 0.13–1.7) from coronal sections. Whole regions were obtained by tile scanning and each frame was taken in Z-stacks of 5–10 slices (in total 45–55 μm thickness). Tiled Z-projection images were aligned and converted into a single flattened image using ZEN software from Zeiss. From each tiled image, randomly selected two regions of interests (ROIs) were analyzed for the dorsolateral (DL), dorsomedial (DM), and dorsoventral (DV; ventral part of the dorsal striatum) striatum using ImageJ software. All quantifications were carried out by operators blinded to the genotype.
Quantification and Statistical Analysis
Values from at least three independent experiments using were used for quantification and statistical analysis. This means that we performed at least three independent technical experiments, and we used different biological samples for each technical experiment. P values were calculated by two-tailed unpaired Student’s t-test unless otherwise specified, using GraphPad Prism 6 software. All data are presented as mean ± SEM. *P < 0.05; **P < 0.01; ***P < 0.001.
Results
Striatal Transcriptome Analysis of Shank3 TG Mice
To identify which signaling pathways were altered in the striatum of Shank3 TG mice, we performed transcriptome (RNA sequencing, RNA-seq) analysis with the striatal tissue from 12-week-old WT and Shank3 TG mice. Although most Shank3 proteins function at the excitatory postsynapse, and thus, are less likely to directly regulate broad gene transcription, we reasoned that this unbiased approach might (indirectly) reflect major signaling pathways affected by mild Shank3 overexpression. As expected, the overall changes in gene expression were mild in the striatum of Shank3 TG mice compared to that of WT mice (Figure 1A and Supplementary Table S2). After applying adjusted P values (<0.05, Benjamini–Hochberg correction), we could identify 22 up-regulated and 17 down-regulated genes in the Shank3 TG striatum (Supplementary Table S3); Shank3 (1.77 fold), G protein-coupled receptor 85 (Gpr85, 1.23 fold), and Chloride intracellular channel 6 (Clic6, 1.16 fold) were the top three up-regulated genes, while Polo like kinase 5 (Plk5, −1.28 fold), Immunoglobulin-like and fibronectin type III domain containing 1 (Igfn1, −1.19 fold), and Inhibitor of DNA binding 3 (Id3, −1.16 fold) were the top three down-regulated genes (Figure 1B), some of which were validated by qRT-PCR (Supplementary Table S3 and Supplementary Figure S1).
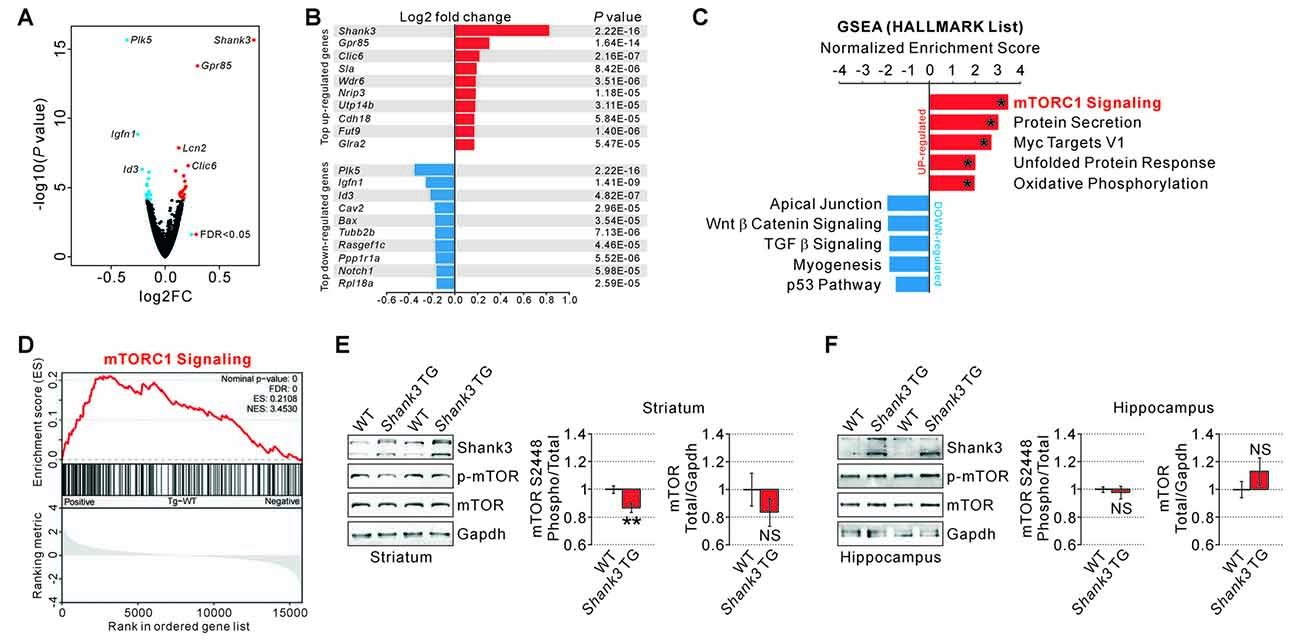
Figure 1. RNA-seq analyses and measurements of mammalian target of rapamycin complex 1 (mTORC1) activity in the SH3 and multiple ankyrin repeat domains 3 (Shank3) transgenic (TG) striatum. (A) Volcano plot for the striatal RNA-seq analysis of Shank3 TG mice. Differentially expressed genes (DEGs), defined by false discovery rate (FDR) < 0.05, are shown as blue (down-regulated) and red (up-regulated) circles. FC, fold change. The complete lists of RNA-seq analysis and DEGs are provided in the Supplementary Tables S2, S3. (B) List of top 10 up-regulated and down-regulated DEGs (based on the fold changes) from the striatal RNA-seq analysis of Shank3 TG mice. (C) The bar graph shows normalized enrichment scores (NES) of gene set enrichment analysis (GSEA) on the Hallmark gene sets for the striatal RNA-seq analysis of Shank3 TG mice. Asterisks indicate the gene sets with an FDR of less than 0.05. The complete list that contains the results of GSEA analysis is provided in Supplementary Table S4. (D) The enrichment plot of striatal RNA-seq analysis of Shank3 TG mice on the mTORC1 signaling gene set. The complete list of mTORC1 signaling genes within the Shank3 TG RNA-seq analysis is provided in Supplementary Table S5. (E) Representative Western blot images and quantifications show that mTORC1 activity measured by mTOR S2448 phosphorylation is decreased in the striatum of Shank3 TG mice. The total mTOR expression level is not significantly different between wild-type (WT) and Shank3 TG striatum. Data are presented as mean ± SEM (n = 10 animals per genotype; **P < 0.01, unpaired two-tailed Student’s t-test). (F) Normal mTORC1 activity and total mTOR protein levels in the hippocampus of Shank3 TG mice (n = 6 animals per genotype).
Next, we performed GSEA to identify biologically meaningful signatures in the Shank3 TG mice striatal RNA-seq data. We found that several biological pathways including “mTORC1 signaling”, “protein secretion”, “Myc targets V1”, “unfolded protein response (UPR)”, and “oxidative phosphorylation” were represented by the genes up-regulated in Shank3 TG striatum (Figure 1C and Supplementary Table S4). Among them, “mTORC1 signaling” was the top ranked pathway based on the NES (Figures 1C,D and Supplementary Tables S4, S5). Moreover, protein secretion, UPR, and oxidative phosphorylation are the cellular processes tightly coupled with mTORC1 signaling (Narita et al., 2011; Appenzeller-Herzog and Hall, 2012; Morita et al., 2013), which further supports the hypothesis that mTORC1 signaling may be the primary molecular signature in the RNA-seq analysis of Shank3 TG striatum. In contrast to the up-regulated genes, the genes down-regulated in Shank3 TG striatum depicted no significant enrichment in any specific biological pathways (Figure 1C and Supplementary Table S4).
Based on the results from GSEA, we directly investigated the striatal mTORC1 activity in Shank3 TG mice by measuring the phosphorylation level of mTOR S2448 residue. The phosphorylation of mTOR S2448 is predominantly associated with mTORC1 (Copp et al., 2009), and reflects its activation as S6 kinase, a downstream target of mTORC1, phosphorylates the residue in a feedback loop (Chiang and Abraham, 2005). We found that the phosphorylation level of mTOR S2448 normalized to total mTOR expression was significantly decreased by approximately 15% in the striatum of Shank3 TG mice compared to that of WT mice (Figure 1E). The total expression level of mTOR protein was not significantly altered in the striatum of Shank3 TG mice (Figure 1E). In contrast to the striatum, neither phospho nor total mTOR protein was altered in the hippocampus of Shank3 TG mice (Figure 1F). Altogether, these results suggest that mild overexpression of Shank3 decreases mTORC1 activity in the striatum of Shank3 TG mice.
Protein Interactome Analysis of Shank3 with the Upstream Regulators of mTORC1
What could be the mechanism underlying decreased mTORC1 activity in the striatum of Shank3 TG mice? The serine/threonine kinase PKB/Akt is a key positive upstream regulator of mTORC1 that directly phosphorylates and inhibits the TSC1/TSC2 complex (Laplante and Sabatini, 2012). However, in our original report describing the Shank3 TG mice, we showed that the activities of PKB/Akt and one of its downstream targets, glycogen synthase kinase 3 (GSK3), were normal in the striatum of Shank3 TG mice (Han et al., 2013b). Therefore, we decided to explore alternative targets.
We have previously generated a comprehensive Shank3 protein interactome consisting of about 400 proteins, by combining the results from yeast two-hybrid (Y2H) screening (Sakai et al., 2011) and in vivo IP followed by mass spectrometry analysis of the mixed hippocampal and striatal tissue isolated from Shank3 TG mice (Han et al., 2013b). As Shank3 is a core scaffold protein containing multiple protein-protein interaction (PPI) domains, it is possible that the functions of Shank3 in neurons could be largely mediated by the interacting proteins (Lee Y. et al., 2017). Notably, Sakai et al. (2011) have previously provided evidence supporting the PPI-mediated connectivity between Shank3 and mTORC1 pathway. Specifically, they showed that Shank3 and TSC1/TSC2 complex are highly connected by many interacting proteins identified by Y2H screening, and that Shank3 and TSC1 indeed form an in vivo protein complex in the mouse brain. In addition, Shahani et al. (2016) recently published a striatal in vivo protein interactome of Rhes, another upstream regulator of mTORC1, (“Rhesactome”) where Shank3 was identified as a Rhes interactor in the striatum. Therefore, we re-analyzed these interactomes (Shank3 in vivo + Y2H, TSC1 and TSC2 Y2H, and Rhes in vivo) side by side to elucidate the identity and the number of proteins interacting both with Shank3 and the upstream regulators of mTORC1. Notably, we found an overlap consisting of 94 proteins (about 24%) between the Shank3 interactome and either TSC1, TSC2, or Rhes interactome (Figures 2A–C and Supplementary Table S6). Among the 94 proteins, four interactors including Dynactin 2 (encoded by Dctn2), Ankyrin repeat domain 35 (Ankrd35), Pleckstrin homology like domain family B member 1 (Phldb1), and Protein interacting with C kinase 1 (Pick1) were shared by three proteins (either Shank3/TSC1/TSC2 or Shank3/TSC1/Rhes), and one interactor, α-actinin 2 (encoded by Actn2), was shared by all four proteins (Figures 2B,C).
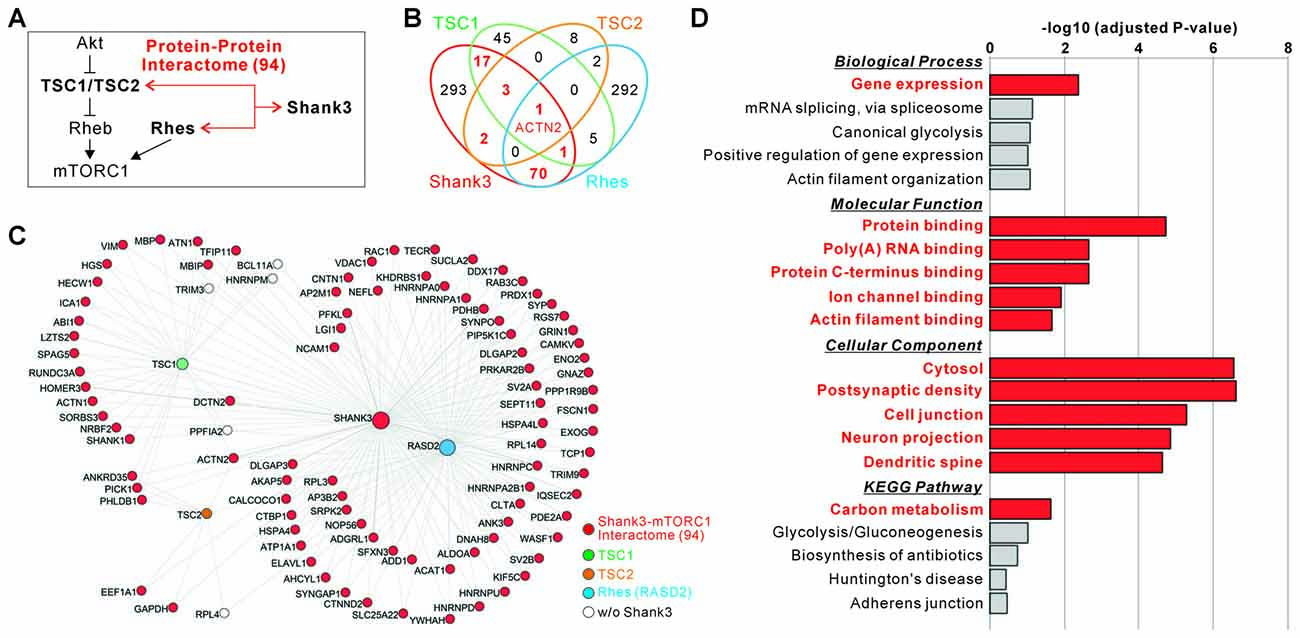
Figure 2. Protein interaction-mediated connectivity between Shank3 and upstream regulators of mTORC1. (A) The diagram shows a summary of protein interaction-mediated connectivity between Shank3 and the upstream regulators of mTORC1 (tuberous sclerosis 1, TSC1/TSC2 and Ras homolog enriched in striatum, Rhes). (B) The Venn diagram shows the number of interactors shared by Shank3, TSC1, TSC2 and Rhes proteins. The actin filament bundling protein, α-actinin 2 (ACTN2), is the only common interactor for all four proteins. (C) The interactome network of Shank3, TSC1/TSC2 and Rhes. To simplify the network, the orphan nodes, defined as nodes connected with only one of the hub proteins (Shank3, TSC1/TSC2 and Rhes), are excluded from the graphics. The nodes for 94 proteins of Shank3-mTORC1 interactome are colored in red. The complete list of interactomes for Shank3, TSC1, TSC2 and Rhes is provided in Supplementary Table S6. (D) Gene ontology (GO) and kyoto encyclopedia of genes and genomes (KEGG) pathway analyses of the 94 proteins of Shank3-mTORC1 interactome. Significant terms (Benjamini adjusted P value < 0.05) are in bold red. The complete list of analyses is provided in Supplementary Table S7.
To understand the representative biological functions or pathways of the 94 common interactors, we performed GO and KEGG pathway analysis. We found that terms including “gene expression” in the biological process category, “protein binding”, “poly(A) RNA binding”, “ion channel binding”, and “actin filament binding” in the molecular function category, and “cytosol”, “postsynaptic density”, “neuronal projection”, and “dendritic spine” in the cellular component category, and “carbon metabolism” in the KEGG pathway were significantly associated with these interactors (Figure 2D and Supplementary Table S7). Together, these results suggest a high connectivity between Shank3 and the upstream regulators of mTORC1, mediated by 94 common interacting proteins involved in defined biological pathways (for simplicity, we will refer to these 94 proteins as “Shank3-mTORC1 interactome”).
Actin-Related Proteins in the Shank3-mTORC1 Interactome
From the GO and KEGG pathway analysis, we could identify several molecular/biological functions of the 94 proteins from Shank3-mTORC1 interactome. Among them, we hypothesized that actin regulatory pathway might be important, because ACTN2, an actin filament bundling protein (Djinovic-Carugo et al., 1999), was identified as the only common interactor for Shank3, TSC1/TSC2, and Rhes. Moreover, PICK1, a common interactor for Shank3 and TSC1/TSC2, is also involved in regulating actin cytoskeleton by inhibiting the actin-nucleating Arp2/3 complex (Rocca et al., 2008). Previously, we generated a subnetwork of Shank3 interactome consisting of only 38 actin-related proteins from the original Shank3 interactome (Han et al., 2013b). We found that among the 38 actin-related interactors of Shank3, 11 proteins (approximately 29%) were shared with the Shank3-mTORC1 interactome (Figure 3A). Specifically, we noticed that the Wiskott-Aldrich syndrome protein family verprolin-homologous protein 1 (WAVE1, encoded by WASF1) and Abelson-interacting protein 1 (Abi1) proteins, the critical components of the WAVE regulatory complex (WRC), and Ras-related C3 botulinum toxin substrate 1 (Rac1), the upstream regulator of the WRC, were among these 11 proteins (Figure 3A). The WRC is an approximately 400 kDa heteropentameric protein complex that consists of WAVE, Abi, Cytoplasmic FMR1-interacting protein (Cyfip), Nck-associated protein (Nap) and Hematopoietic stem progenitor cell 300 (HSPC300) and activates the Arp2/3 complex to initiate actin polymerization and branching (Takenawa and Suetsugu, 2007; Chen Z. et al., 2010; Han et al., 2015).
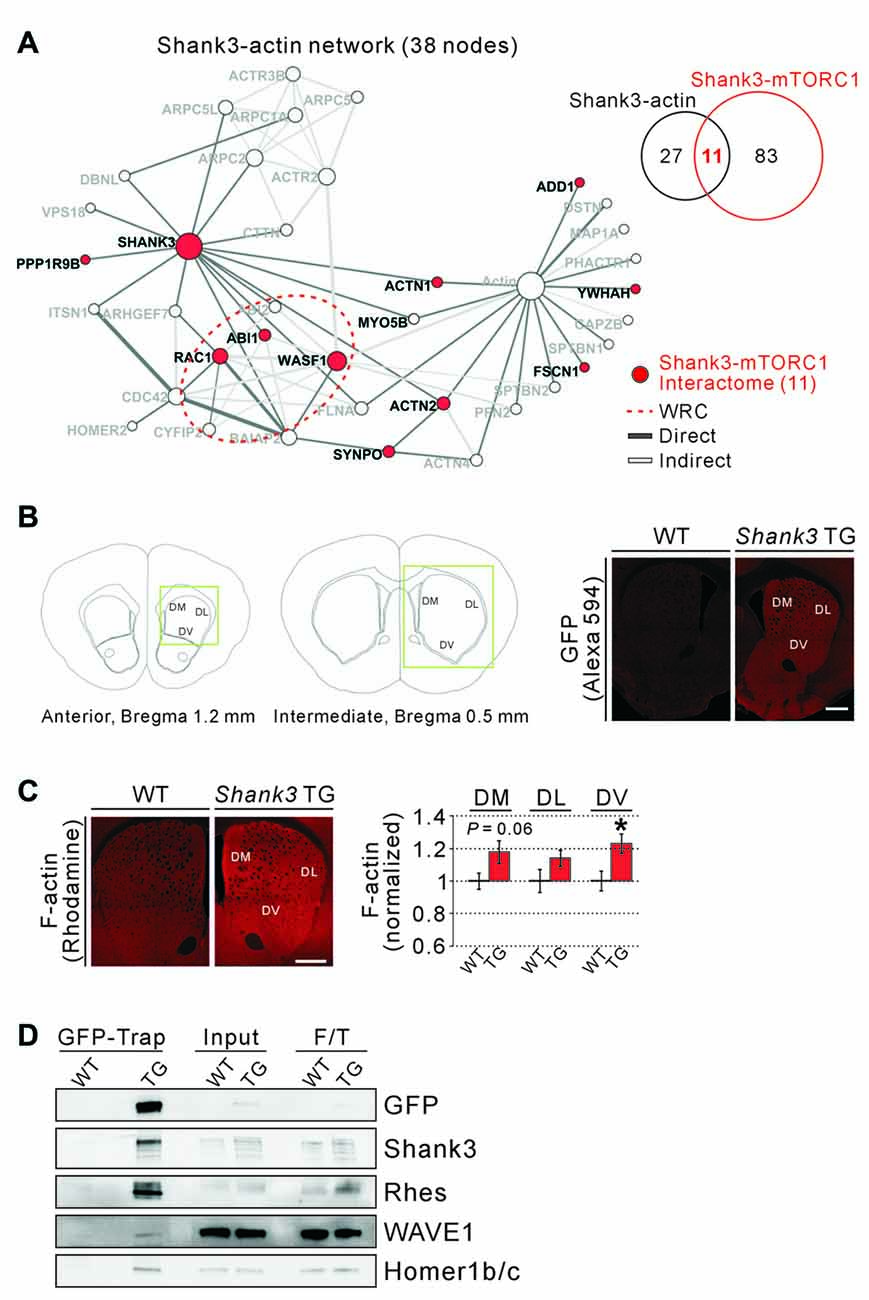
Figure 3. Actin-related proteins in the Shank3-mTORC1 interactome, and increased F-actin levels in the Shank3 TG striatum. (A) The actin-related subnetwork of Shank3 interactome where the 11 proteins shared by the Shank3-mTORC1 interactome are colored in red. The edges of the network are colored depending on the type of interactions (direct or indirect interaction). The red dotted circle indicates the components of wave regulatory complex (WRC; WASF1; Abelson-interacting protein 1 (ABI1), ABI2 and Cytoplasmic FMR1-interacting protein 2 (CYFIP2) and Ras-related C3 botulinum toxin substrate 1 (RAC1)). (B) The diagrams show the atlas of mouse brain coronal sections for the striatum, and the coordinates of the exact areas where immunohistochemistry (IHC) experiments were performed (left panel). The green boxes indicate regions of interests (ROIs). Representative IHC images show expression of the EGFP-Shank3 proteins in the dorsal striatum of Shank3 TG, but not WT, mice (right panel). DL, dorsolateral; DM, dorsomedial; DV, dorsoventral. Scale bar, 500 μm. (C) Representative IHC images and quantification show increased levels of F-actin in the DV, but not DM and DL, compartments of Shank3 TG striatum. Scale bar, 500 μm. Data are presented as mean ± SEM (n = 7 animals per genotype; *P < 0.05, unpaired two-tailed Student’s t-test). (D) Western blot images show co-immunoprecipitation (IP) of EGFP-Shank3, Rhes, WAVE1, and Homer1b/c proteins from the Shank3 TG, but not WT, synaptosomal lysate. For input and flow-through (F/T) lanes, 0.5% of total proteins were loaded.
This result prompted us to test whether the levels of polymerized actin (actin filament or F-actin) were increased in the striatum of Shank3 TG mice. We previously showed that synaptic F-actin levels were increased in the cultured hippocampal neurons of Shank3 TG mice (Han et al., 2013b). However, this has not been validated in vivo, especially in the striatum where Shank3 is enriched compared to other brain regions. For the analysis, we focused on the dorsal striatum, the area in which the functional and morphological changes of striatal synapses in the Shank3 KO mice have been mainly characterized (Peça et al., 2011; Peixoto et al., 2016; Wang et al., 2016; Jaramillo et al., 2017). In addition, the dorsal striatum is closely associated with motor and executive functions (Balleine and O’Doherty, 2010) both of which are defective in mania (Marvel and Paradiso, 2004). Nevertheless, to more precisely characterize F-actin changes, we subdivided the dorsal striatum into three subareas; DL, DM and DV compartments, characterized by distinct cellular compositions, synaptic inputs/outputs, and functional roles in controlling behavior (Steiner and Tseng, 2010; Ito and Doya, 2015; Matamales et al., 2016; Figure 3B).
First, we carefully set the scanning parameters for fluorescent confocal microscopy, because Shank3 TG mice express EGFP-tagged Shank3 proteins. Indeed, we found that under the scanning condition for Alexa Fluor 488, significant amount of signal was detected from the striatum of Shank3 TG, but not WT, mice (Supplementary Figure S2). Therefore, we decided to use Alexa Fluor 594 and rhodamine for IHC experiments. Next, we confirmed that the EGFP-Shank3 proteins from the transgene were expressed in all three striatal subareas of Shank3 TG mice (Figure 3B). Lastly, we measured F-actin levels by staining the striatal sections with rhodamine-conjugated phalloidin, and found that F-actin levels were significantly increased by approximately 23% in the DV compartment of Shank3 TG mice (Figure 3C). Trends for an increase were also observed in DL (P = 0.14) and DM (P = 0.06) compartments, but the differences were not statistically significant. As a control, the intensity of NeuN staining in the three subareas of the dorsal striatum in Shank3 TG mice was comparable to that in WT mice, suggesting a normal neuronal density in the Shank3 TG striatum (Supplementary Figure S3).
Previously, Sakai et al. (2011) validated the in vivo interactions of Shank3, TSC1 and α-actinin using mouse brain lysates. Therefore, we also tested for the existence of the in vivo protein complex consisting of Shank3, Rhes and WAVE1 in the synaptosomal lysate from Shank3 TG mice. We performed IP using the GFP-Trap beads to pull down EGFP-Shank3 and its interacting proteins from Shank3 TG mice, as described previously (Han et al., 2013b; Lee Y. et al., 2017), and found that Shank3, Rhes, WAVE1 and Homer1b/c (a known interactor of Shank3) proteins were pulled down together (Figure 3D). This result is consistent with the previous study of “Rhesactome”, in which the authors performed IP using Rhes antibodies to pull down endogenous Rhes proteins from the striatal lysate of WT mice, and identified Shank3 and WAVE1 proteins in the complex using mass spectrometry analysis (Shahani et al., 2016). Together, these results suggest that certain actin-related proteins may be involved in connecting Shank3 and the upstream regulators of mTORC1.
Associations of the Shank3-mTORC1 Interactome and Shank3 TG Transcriptome with the Disease
Recent studies have shown that the genes mutated in neurodevelopmental and neuropsychiatric disorders such as ASD or SCZ might also be highly interconnected at the protein level (De Rubeis et al., 2014; Fromer et al., 2014). In this regard, we reasoned that neuropsychiatric disorders affected by pathological Shank3-mTORC1 interactions might be identified as those significantly associated with the 94 proteins connecting Shank3 and the upstream regulators of mTORC1. We selected three established disease-associated gene sets; psychiatric disorder-associated PsyGeNET gene sets (Gutierrez-Sacristan et al., 2015), ASD-associated Simons Foundation Autism Research Initiative (SFARI) gene set5, and broad human disease-associated DisGeNET gene sets (Piñero et al., 2017) and compared these gene sets with the 94 genes of Shank3-mTORC1 interactome.
We found that among the eight major classes of psychiatric disorders in the PsyGeNET, “BDs and related disorders” and “SCZ spectrum and other psychiatric disorders” were significantly associated with the 94 genes of Shank3-mTORC1 interactome (adjusted P = 0.000186 for both, hypergeometric test; Figures 4A,B and Supplementary Table S8). Moreover, when compared with the entire subclasses (117 psychiatric disorders) of PsyGeNET, only four disorders including “SCZ”, “BD”, “manic” and “manic mood” were significantly associated with the 94 genes (Supplementary Table S8). It is considered that BD and SCZ have many aspects in common, such as risk genes, molecular and neuronal pathophysiology, and clinical symptoms (Berrettini, 2000; Benes and Berretta, 2001; Moskvina et al., 2009). In contrast to BD and SCZ, the association between ASDs (SFARI genes) and the 94 genes was not statistically significant (Figure 4A). Lastly, among the disease classes of DisGeNET, “SCZ”, “Down syndrome”, “Alzheimer’s disease”, “seizures” and “BD” were among the top disorders significantly associated with the 94 genes of Shank3-mTORC1 interactome (Figure 4A and Supplementary Table S9).
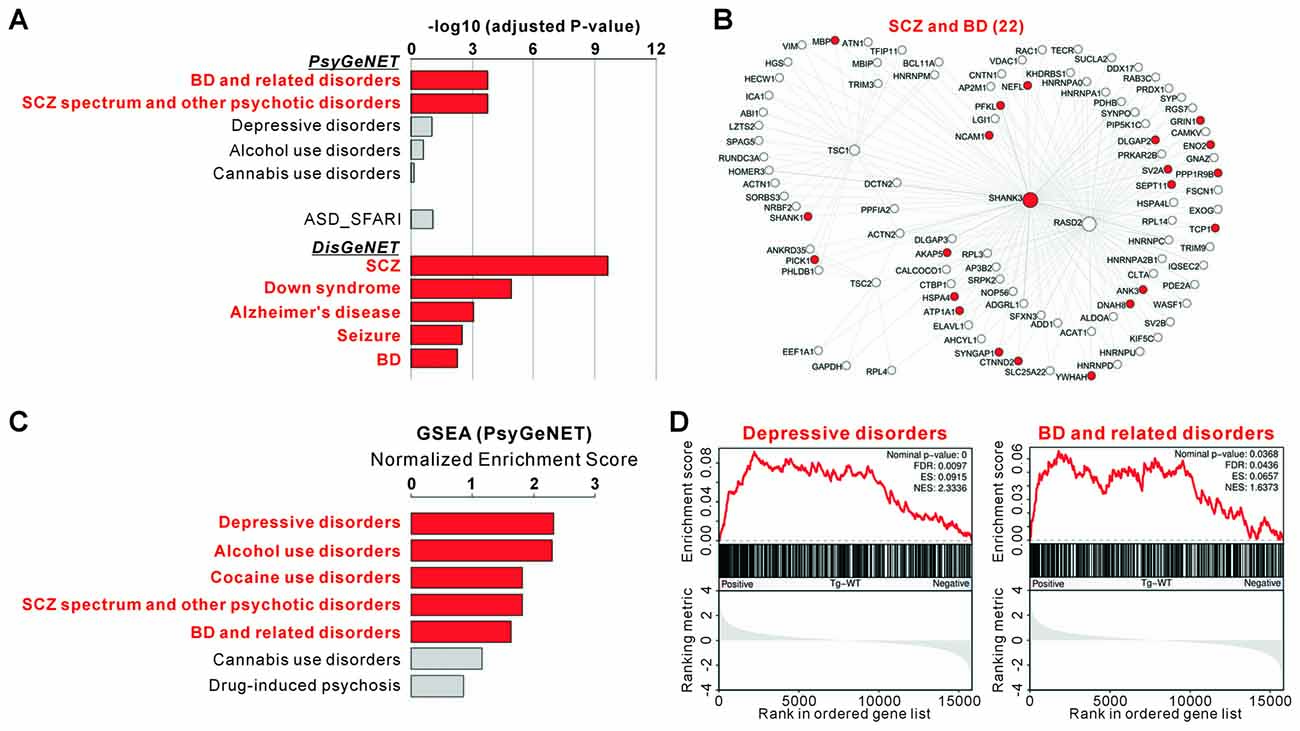
Figure 4. Associations of the Shank3-mTORC1 interactome and Shank3 TG striatal transcriptome with the disease. (A) Disease association analysis for the 94 genes in Shank3-mTORC1 interactome. Significant disease terms (Benjamini adjusted P value < 0.05) are in bold red. The complete analyses are provided in Supplementary Tables S8, S9. (B) The Shank3-mTORC1 interactome network with bipolar disorder (BD)- and schizophrenia (SCZ)-associated proteins from Psychiatric disorders Gene association NETwork (PsyGeNET) database colored in red. (C) The bar graph shows the Normalized Enrichment Scores (NESs) of GSEA on the PsyGeNET gene sets for the striatal RNA-seq analysis of Shank3 TG mice. Significant disease terms are in bold red. The complete list of GSEA is provided in Supplementary Table S10. (D) The enrichment plots showing the striatal RNA-seq analysis of Shank3 TG mice on the PsyGeNET gene sets of “depressive disorders” (left panel) and “BD and related disorders” (right panel).
The above mentioned result showing a significant association between Shank3-mTORC1 interactome and BD prompted us to test whether the overall transcriptomic change in the Shank3 TG striatum might also be associated with BD or other psychiatric disorders. We therefore preformed GSEA of the Shank3 TG RNA-seq results with the PsyGeNET gene sets. We found that more PsyGeNET gene sets were significantly associated with the RNA-seq results than with the Shank3-mTORC1 interactome. In addition to SCZ and BD, “depressive disorders”, “alcohol use disorders”, and “cocaine use disorders” gene sets were significantly represented by the genes up-regulated in the Shank3 TG striatum (Figures 4C,D and Supplementary Table S10). Together, these results suggest that both Shank3-mTORC1 interactome and striatal transcriptome of Shank3 TG mice may be associated with BD.
Discussion
The aim of this study was to elucidate the molecular pathophysiology underlying striatal dysfunction in mania. We performed striatal RNA-seq analysis of Shank3-overexpressing manic mouse model and identified mTORC1 signaling as the primary molecular signature. Based on the RNA-seq analysis, we examined mTORC1 activity and found that it was decreased in the striatum of Shank3 TG mice. Although the RNA-seq analysis revealed altered mTORC1 activity, we consider that the gene expression changes related to mTORC1 signaling could be a secondary or compensatory effect of decreased mTORC1 activity for several reasons. First, the GSEA revealed that mTORC1 signaling was depicted by the genes up-regulated in Shank3 TG striatum, which is opposite to the change of striatal mTORC1 activity. Second, Shank3 proteins mainly function at the excitatory postsynapse, and are thus less likely to directly regulate a group of genes specifically related to mTORC1 signaling. Notably, it was recently reported that Shank3 proteins can undergo synapse-to-nucleus shuttling in an activity-dependent manner, and that Shank3 localized in the nucleus may regulate the expression of several genes such as leucine rich repeat transmembrane neuronal 1 (Lrrtm1), synaptotagmin I (Syt1), and cystic fibrosis transmembrane conductance regulator homolog (Cftr; Grabrucker et al., 2014). However, none of these potential “Shank3 target genes” was listed among mTORC1 signaling-related genes from our RNA-seq analysis (Supplementary Table S5), suggesting that mTORC1 signaling-related genes in the striatum of Shank3 TG mice were not directly up-regulated by nuclear Shank3 proteins.
Although we did not characterize them in details, there were several interesting differentially expressed genes (DEGs) from the striatal RNA-seq analysis of Shank3 TG mice. For example, an up-regulated GPR85 (also called SREB2 for super-conserved receptor expressed in brain) gene, encoding a highly conserved G protein-coupled receptor, has been associated with SCZ (Matsumoto et al., 2008; Radulescu et al., 2013). Notably, the Gpr85 TG mice mildly overexpressing GPR85 proteins display some abnormal behaviors including impaired prepulse inhibition and decreased social interaction (Matsumoto et al., 2008), which were also seen in the Shank3 TG mice (Han et al., 2013b). Therefore, the effects from DEGs, together with decreased mTORC1 activity, might contribute to the behavioral phenotypes of Shank3 TG mice.
To understand the detailed mechanism underlying decreased mTORC1 activity in the Shank3 TG striatum, we re-analyzed the Shank3, TSC1/TSC2 and Rhes protein interactomes side by side. This was based on the previous reports showing the PPI-mediated connectivity between Shank3 and TSC1/TSC2 (Sakai et al., 2011), and the striatal in vivo Rhes protein complex (“Rhesactome”) containing Shank3 and several Shank3-interacting proteins (Shahani et al., 2016). Indeed, we could identify 94 proteins connecting Shank3 and the upstream regulators of mTORC1 (Shank3-mTORC1 interactome). However, one of the limitations of this interactome is not being strict enough to fully represent the in vivo connections among Shank3, TSC1/TSC2 and Rhes, because some of the interactions, especially those for TSC1/TSC2, were identified based only on in vitro Y2H screening. Nevertheless, Shank3-TSC1 (Sakai et al., 2011) and Shank3-Rhes (Figure 3D) interactions were validated in the mouse brain lysates, indicating the existence of protein complexes containing Shank3, TSC1/TSC2 and Rhes in vivo.
The mechanism underlying the decrease in mTORC1 activity in response to interactions between Shank3 and the upstream regulators of mTORC1 in the Shank3 TG striatum remains unclear. One possibility is that Shank3 overexpression might shift or sequester TSC1/TSC2 and Rhes proteins from mTORC1 regulatory complex to actin filaments-related complex and thereby disturb the maintenance of normal mTORC1 activity. In support of this hypothesis, we found that 11 of the 94 proteins from Shank3-mTORC1 interactome, including ACTN2, WAVE1, Abi and Rac1, were associated with actin filaments, and that levels of F-actin were increased in the dorsal striatum of Shank3 TG mice. Similarly, it was recently shown that, in the mouse striatum, RasGRP1 suppresses the inhibitory role of Rhes in amphetamine-induced dopamine receptor signaling, by promoting Rhes to form a specific protein complex (Shahani et al., 2016). Further biochemical and/or imaging analyses are necessary to fully understand the functional significance of Shank3-mTORC1 interactome in the regulation of the striatal mTORC1 activity. Moreover, we cannot exclude the possibility that altered mTORC1 activity might contribute to the increased F-actin levels in the striatum of Shank3 TG mice. It has been shown that mTORC1 and mTORC2 regulate motility and metastasis of colorectal cancer cells via modulating Ras homolog gene family, member A (RhoA) and Rac1 signaling (Gulhati et al., 2011).
It is notable that mTORC1 activity is also decreased in the neurons with reduced Shank3 expression, due to increased steady-state levels of CLK2 (Bidinosti et al., 2016). The CLK2 phosphorylates and activates the regulatory subunit of protein phosphatase 2A (PP2A) which in turn inactivates Akt, a positive regulator of mTORC1. However, this mechanism could not explain the decrease in mTORC1 activity in the striatum of Shank3 TG mice, where Akt activity was found to be normal (Han et al., 2013b). Thus, either loss or gain of Shank3 expression can induce a decrease in mTORC1 activity, most likely, via different mechanisms, the details of which will be an interesting topic for future research. Despite normal Akt activity in the Shank3 TG striatum, however, treatments with certain molecules that increase Akt activity such as IGF1, might possibly rescue the decreased striatal mTORC1 activity and some behavioral abnormalities in the Shank3 TG mice. Importantly, the treatment with IGF1 has already been shown as a promising potential therapeutic approach for the disorders caused by SHANK3 deficiency in model system studies and a pilot clinical trial (Bozdagi et al., 2013; Shcheglovitov et al., 2013; Kolevzon et al., 2014; Bidinosti et al., 2016).
By performing Western blot experiments, we found a mild (approximately 15%) decrease of mTORC1 activity in the striatum of Shank3 TG mice. While several types of neurons can be found in the striatum, MSNs, the GABAergic output neurons of the striatum, account for the majority (>90%) of the population. The MSNs can be further classified into D1 and D2-type neurons based on the type of dopamine receptor expressed and projection pathway (striatonigral direct pathway and striatopallidal indirect pathway, respectively; Calabresi et al., 2014). It has been reported that the excitatory synapses of MSNs in Shank3 KO mice show morphological and functional abnormalities (Peça et al., 2011; Peixoto et al., 2016; Wang et al., 2016; Jaramillo et al., 2017). However, these studies did not address whether D1 and D2-type MSNs could be differentially affected by the loss of Shank3 expression. Importantly, Wang et al. (2017) recently showed that several striatal synaptic functions are selectively impaired in the striatopallidal D2-type MSNs in a line of Shank3 KO (Shank3B KO) mice. In the same regard, the striatal mTORC1 activity of Shank3 TG mice may be preferentially, or even specifically, decreased in the D1 or D2-type MSNs, but this decrease may be masked by normal mTORC1 activity of the remaining neuronal populations. More comprehensive analyses regarding the activities of mTORC1 in different neuronal populations of the striatum of both Shank3 KO and TG mice will be important, especially considering that D1 and D2-type MSNs of the striatum have distinct, or even opposite, roles in controlling behavior (Kravitz et al., 2010).
Another important remaining issue is whether decreased striatal mTORC1 activity is causally associated with manic-like behaviors in Shank3 TG mice. This issue could be addressed by testing the effects of drugs, such as IGF1, that can increase mTORC1 activity on the manic-like behaviors of Shank3 TG mice. In this case, however, treatment during the development may be critical given the possibility that the decrease in mTORC1 activity starts during early development and chronically affects the striatum to finally result in an adult onset of manic-like behaviors. This is possible because at least Shank3 expression itself is increased starting at juvenile (approximately 3-week-old) stage in the Shank3 TG mice compared to WT mice (Han et al., 2013b).
We found that, unlike in the striatum, mTORC1 activity was normal in the hippocampus of Shank3 TG mice. However, we cannot exclude the possibility that mTORC1 activities in other brain regions, such as frontal cortex and cerebellum, could be altered and contribute to manic-like behaviors of Shank3 TG mice. Interestingly, it has been shown that intracerebroventricular injection of ouabain, an inhibitor of Na/K-ATPase, increases Akt and mTORC1 activities in the frontal cortex and causes manic-like behaviors in rats (Yu et al., 2010; Kim S. H. et al., 2013). Therefore, mTORC1 activities of different brain regions might have distinct, or even opposite, roles in causing manic-like behaviors. Even with these remaining issues, our bioinformatic analysis showed that both the genes belonging to Shank3-mTORC1 interactome and the up-regulated transcriptome of Shank3 TG striatum were significantly associated with the PsyGeNET BD genes (Figure 4). Therefore, investigating the role of these Shank3-related BD genes, together with mTORC1 signaling, in Shank3 TG mice might enable us to fully understand the molecular mechanisms of manic-like behaviors in these mice.
In conclusion, our results suggest a decrease in mTORC1 activity in the striatum of Shank3 TG mice that may be potentially mediated by the PPI-dependent connectivity between Shank3 and several upstream regulators of mTORC1. Decreased striatal mTORC1 activity might contribute to manic-like behaviors in Shank3 TG mice, but further investigation is needed to validate such hypothesis. Since both Shank3 and mTORC1 signaling are implicated in a broad spectrum of neurodevelopmental and neuropsychiatric disorders, the connectivity between these two proteins may be an important converging pathophysiological pathway as well as a potential therapeutic target for the treatment of various brain disorders.
Author Contributions
YL, SGK, BL, YZ, YK, SK and KH designed and performed the experiments. HK and KH analyzed and interpreted the data. EK discussed the project and provided reagents. YL, HK and KH wrote the article. All authors read and approved the manuscript.
Funding
This work was supported by the National Research Foundation of Korea (NRF) grant funded by the Korea Government Ministry of Science, ICT and Future Planning (MISP) (NRF-2015R1C1A1A01052794), by the Brain Research Program through the NRF funded by the MISP (NRF-2015M3C7A1028790), by the grant of the Korea Health Technology R&D Project through the Korea Health Industry Development Institute (KHIDI) funded by the Ministry of Health and Welfare, South Korea (HI16C0090), and by the Korea Institute of Science and Technology Information (K-17-L03-C02-S01).
Conflict of Interest Statement
The authors declare that the research was conducted in the absence of any commercial or financial relationships that could be construed as a potential conflict of interest.
Footnotes
- ^ http://software.broadinstitute.org/gsea
- ^ http://software.broadinstitute.org/gsea/msigdb
- ^ http://www.informatics.jax.org/homology.shtml
- ^ https://gene.sfari.org/autdb/GS_Home.do
- ^ https://gene.sfari.org/autdb/GS_Home.do
Supplementary Material
The Supplementary Material for this article can be found online at: https://www.frontiersin.org/article/10.3389/fnmol.2017.00201/full#supplementary-material
FIGURE S1 | Validation of differentially expressed genes in the striatum of Shank3 TG mice. The graph shows the results of qRT-PCR experiments validating an increase in the expression of Shank3, Gpr85 and Clic6, and a decrease in the expression of Plk5 in the striatum of Shank3 TG mice compared to WT mice. Data are presented as mean ± SEM (n = 4–6 animals per genotype; *P < 0.05, ***P < 0.001, unpaired two-tailed Student’s t-test).
FIGURE S2 | Detection of EGFP signal from the striatum of Shank3 TG mice. To test whether there was any background signal from the striatal sections of WT and Shank3 TG mice, we performed IHC experiments only with the secondary antibodies (Alexa Fluor 488 and 555). Under the scanning condition for Alexa Fluor 488, significant amount of signal (potentially from the EGFP-Shank3 proteins) was detected from the striatum of Shank3 TG, but not WT, mice. Meanwhile, no signal was detected for Alexa Fluor 555 from both WT and TG striatum. DIC, differential interference contrast.
FIGURE S3 | Normal NeuN intensity in the dorsal striatum of Shank3 TG mice. Representative IHC images and quantification show normal NeuN intensity in the DM, DL and DV compartments of Shank3 TG striatum. Scale bar, 500 μm. DL, dorsolateral; DM, dorsomedial; DV, dorsoventral. Data are presented as mean ± SEM (n = 5 animals per genotype; P > 0.05, unpaired two-tailed Student’s t-test).
References
Abdallah, C. G., Sanacora, G., Duman, R. S., and Krystal, J. H. (2015). Ketamine and rapid-acting antidepressants: a window into a new neurobiology for mood disorder therapeutics. Annu. Rev. Med. 66, 509–523. doi: 10.1146/annurev-med-053013-062946
Anders, S., Pyl, P. T., and Huber, W. (2015). HTSeq—a Python framework to work with high-throughput sequencing data. Bioinformatics 31, 166–169. doi: 10.1093/bioinformatics/btu638
Appenzeller-Herzog, C., and Hall, M. N. (2012). Bidirectional crosstalk between endoplasmic reticulum stress and mTOR signaling. Trends Cell Biol. 22, 274–282. doi: 10.1016/j.tcb.2012.02.006
Balleine, B. W., and O’Doherty, J. P. (2010). Human and rodent homologies in action control: corticostriatal determinants of goal-directed and habitual action. Neuropsychopharmacology 35, 48–69. doi: 10.1038/npp.2009.131
Benes, F. M., and Berretta, S. (2001). GABAergic interneurons: implications for understanding schizophrenia and bipolar disorder. Neuropsychopharmacology 25, 1–27. doi: 10.1016/S0893-133X(01)00225-1
Berrettini, W. H. (2000). Are schizophrenic and bipolar disorders related? A review of family and molecular studies. Biol. Psychiatry 48, 531–538. doi: 10.1016/s0006-3223(00)00883-0
Bidinosti, M., Botta, P., Kruttner, S., Proenca, C. C., Stoehr, N., Bernhard, M., et al. (2016). CLK2 inhibition ameliorates autistic features associated with SHANK3 deficiency. Science 351, 1199–1203. doi: 10.1126/science.aad5487
Blumberg, H. P., Martin, A., Kaufman, J., Leung, H. C., Skudlarski, P., Lacadie, C., et al. (2003). Frontostriatal abnormalities in adolescents with bipolar disorder: preliminary observations from functional MRI. Am. J. Psychiatry 160, 1345–1347. doi: 10.1176/appi.ajp.160.7.1345
Bolger, A. M., Lohse, M., and Usadel, B. (2014). Trimmomatic: a flexible trimmer for Illumina sequence data. Bioinformatics 30, 2114–2120. doi: 10.1093/bioinformatics/btu170
Bozdagi, O., Tavassoli, T., and Buxbaum, J. D. (2013). Insulin-like growth factor-1 rescues synaptic and motor deficits in a mouse model of autism and developmental delay. Mol. Autism 4:9. doi: 10.1186/2040-2392-4-9
Calabresi, P., Picconi, B., Tozzi, A., Ghiglieri, V., and Di Filippo, M. (2014). Direct and indirect pathways of basal ganglia: a critical reappraisal. Nat. Neurosci. 17, 1022–1030. doi: 10.1038/nn.3743
Chen, Z., Borek, D., Padrick, S. B., Gomez, T. S., Metlagel, Z., Ismail, A. M., et al. (2010). Structure and control of the actin regulatory WAVE complex. Nature 468, 533–538. doi: 10.1038/nature09623
Chen, G., Henter, I. D., and Manji, H. K. (2010). Translational research in bipolar disorder: emerging insights from genetically based models. Mol. Psychiatry 15, 883–895. doi: 10.1038/mp.2010.3
Chiang, G. G., and Abraham, R. T. (2005). Phosphorylation of mammalian target of rapamycin (mTOR) at Ser-2448 is mediated by p70S6 kinase. J. Biol. Chem. 280, 25485–25490. doi: 10.1074/jbc.m501707200
Choi, S. Y., Pang, K., Kim, J. Y., Ryu, J. R., Kang, H., Liu, Z., et al. (2015). Post-transcriptional regulation of SHANK3 expression by microRNAs related to multiple neuropsychiatric disorders. Mol. Brain 8:74. doi: 10.1186/s13041-015-0165-3
Copp, J., Manning, G., and Hunter, T. (2009). TORC-specific phosphorylation of mammalian target of rapamycin (mTOR): phospho-Ser2481 is a marker for intact mTOR signaling complex 2. Cancer Res. 69, 1821–1827. doi: 10.1158/0008-5472.can-08-3014
Costa-Mattioli, M., and Monteggia, L. M. (2013). mTOR complexes in neurodevelopmental and neuropsychiatric disorders. Nat. Neurosci. 16, 1537–1543. doi: 10.1038/nn.3546
De Rubeis, S., He, X., Goldberg, A. P., Poultney, C. S., Samocha, K., Cicek, A. E., et al. (2014). Synaptic, transcriptional and chromatin genes disrupted in autism. Nature 515, 209–215. doi: 10.1038/nature13772
Djinovic-Carugo, K., Young, P., Gautel, M., and Saraste, M. (1999). Molecular basis for cross-linking of actin filaments: structure of the α-actinin rod. Cell 98, 537–546. doi: 10.1016/s0092-8674(00)81981-9
Dosemeci, A., Weinberg, R. J., Reese, T. S., and Tao-Cheng, J. H. (2016). The postsynaptic density: there is more than meets the eye. Front. Synaptic Neurosci. 8:23. doi: 10.3389/fnsyn.2016.00023
Durand, C. M., Betancur, C., Boeckers, T. M., Bockmann, J., Chaste, P., Fauchereau, F., et al. (2007). Mutations in the gene encoding the synaptic scaffolding protein SHANK3 are associated with autism spectrum disorders. Nat. Genet. 39, 25–27. doi: 10.1038/ng1933
Failla, P., Romano, C., Alberti, A., Vasta, A., Buono, S., Castiglia, L., et al. (2007). Schizophrenia in a patient with subtelomeric duplication of chromosome 22q. Clin. Genet. 71, 599–601. doi: 10.1111/j.1399-0004.2007.00819.x
Fromer, M., Pocklington, A. J., Kavanagh, D. H., Williams, H. J., Dwyer, S., Gormley, P., et al. (2014). De novo mutations in schizophrenia implicate synaptic networks. Nature 506, 179–184. doi: 10.1038/nature12929
Gauthier, J., Champagne, N., Lafreniere, R. G., Xiong, L., Spiegelman, D., Brustein, E., et al. (2010). De novo mutations in the gene encoding the synaptic scaffolding protein SHANK3 in patients ascertained for schizophrenia. Proc. Natl. Acad. Sci. U S A 107, 7863–7868. doi: 10.1073/pnas.0906232107
Grabrucker, S., Proepper, C., Mangus, K., Eckert, M., Chhabra, R., Schmeisser, M. J., et al. (2014). The PSD protein ProSAP2/Shank3 displays synapto-nuclear shuttling which is deregulated in a schizophrenia-associated mutation. Exp. Neurol. 253, 126–137. doi: 10.1016/j.expneurol.2013.12.015
Grabrucker, A. M., Schmeisser, M. J., Schoen, M., and Boeckers, T. M. (2011). Postsynaptic ProSAP/Shank scaffolds in the cross-hair of synaptopathies. Trends Cell Biol. 21, 594–603. doi: 10.1016/j.tcb.2011.07.003
Grande, I., Berk, M., Birmaher, B., and Vieta, E. (2016). Bipolar disorder. Lancet 387, 1561–1572. doi: 10.1016/S0140-6736(15)00241-X
Guilmatre, A., Huguet, G., Delorme, R., and Bourgeron, T. (2014). The emerging role of SHANK genes in neuropsychiatric disorders. Dev. Neurobiol. 74, 113–122. doi: 10.1002/dneu.22128
Gulhati, P., Bowen, K. A., Liu, J., Stevens, P. D., Rychahou, P. G., Chen, M., et al. (2011). mTORC1 and mTORC2 regulate EMT, motility and metastasis of colorectal cancer via RhoA and Rac1 signaling pathways. Cancer Res. 71, 3246–3256. doi: 10.1158/0008-5472.CAN-10-4058
Gutierrez-Sacristan, A., Grosdidier, S., Valverde, O., Torrens, M., Bravo, A., Pinero, J., et al. (2015). PsyGeNET: a knowledge platform on psychiatric disorders and their genes. Bioinformatics 31, 3075–3077. doi: 10.1093/bioinformatics/btv301
Han, K., Chen, H., Gennarino, V. A., Richman, R., Lu, H. C., and Zoghbi, H. Y. (2015). Fragile X-like behaviors and abnormal cortical dendritic spines in Cytoplasmic FMR1-interacting protein 2-mutant mice. Hum. Mol. Genet. 24, 1813–1823. doi: 10.1093/hmg/ddu595
Han, K., Gennarino, V. A., Lee, Y., Pang, K., Hashimoto-Torii, K., Choufani, S., et al. (2013a). Human-specific regulation of MeCP2 levels in fetal brains by microRNA miR-483–5p. Genes Dev. 27, 485–490. doi: 10.1101/gad.207456.112
Han, K., Holder, J. L. Jr., Schaaf, C. P., Lu, H., Chen, H., Kang, H., et al. (2013b). SHANK3 overexpression causes manic-like behaviour with unique pharmacogenetic properties. Nature 503, 72–77. doi: 10.1038/nature12630
Han, K., Kim, M. H., Seeburg, D., Seo, J., Verpelli, C., Han, S., et al. (2009). Regulated RalBP1 binding to RalA and PSD-95 controls AMPA receptor endocytosis and LTD. PLoS Biol. 7:e1000187. doi: 10.1371/journal.pbio.1000187
Hoeffer, C. A., and Klann, E. (2010). mTOR signaling: at the crossroads of plasticity, memory and disease. Trends Neurosci. 33, 67–75. doi: 10.1016/j.tins.2009.11.003
Huang, J., and Manning, B. D. (2008). The TSC1-TSC2 complex: a molecular switchboard controlling cell growth. Biochem J. 412, 179–190. doi: 10.1042/bj20080281
Huang Da, W., Sherman, B. T., and Lempicki, R. A. (2009). Systematic and integrative analysis of large gene lists using DAVID bioinformatics resources. Nat. Protoc. 4, 44–57. doi: 10.1038/nprot.2008.211
Ito, M., and Doya, K. (2015). Distinct neural representation in the dorsolateral, dorsomedial and ventral parts of the striatum during fixed- and free-choice tasks. J. Neurosci. 35, 3499–3514. doi: 10.1523/jneurosci.1962-14.2015
Jaramillo, T. C., Speed, H. E., Xuan, Z., Reimers, J. M., Escamilla, C. O., Weaver, T. P., et al. (2017). Novel Shank3 mutant exhibits behaviors with face validity for autism and altered striatal and hippocampal function. Autism Res. 10, 42–65. doi: 10.1002/aur.1664
Jernigan, C. S., Goswami, D. B., Austin, M. C., Iyo, A. H., Chandran, A., Stockmeier, C. A., et al. (2011). The mTOR signaling pathway in the prefrontal cortex is compromised in major depressive disorder. Prog. Neuropsychopharmacol. Biol. Psychiatry 35, 1774–1779. doi: 10.1016/j.pnpbp.2011.05.010
Jiang, Y. H., and Ehlers, M. D. (2013). Modeling autism by SHANK gene mutations in mice. Neuron 78, 8–27. doi: 10.1016/j.neuron.2013.03.016
Kato, T., Kasahara, T., Kubota-Sakashita, M., Kato, T. M., and Nakajima, K. (2016). Animal models of recurrent or bipolar depression. Neuroscience 321, 189–196. doi: 10.1016/j.neuroscience.2015.08.016
Kim, D., Pertea, G., Trapnell, C., Pimentel, H., Kelley, R., and Salzberg, S. L. (2013). TopHat2: accurate alignment of transcriptomes in the presence of insertions, deletions and gene fusions. Genome Biol. 14:R36. doi: 10.1186/gb-2013-14-4-r36
Kim, S. H., Yu, H. S., Park, H. G., Ha, K., Kim, Y. S., Shin, S. Y., et al. (2013). Intracerebroventricular administration of ouabain, a Na/K-ATPase inhibitor, activates mTOR signal pathways and protein translation in the rat frontal cortex. Prog. Neuropsychopharmacol. Biol. Psychiatry 45, 73–82. doi: 10.1016/j.pnpbp.2013.04.018
Kim, Y., Zhang, Y., Pang, K., Kang, H., Park, H., Lee, Y., et al. (2016). Bipolar disorder associated microRNA, miR-1908–5p, regulates the expression of genes functioning in neuronal glutamatergic synapses. Exp. Neurobiol. 25, 296–306. doi: 10.5607/en.2016.25.6.296
Kolevzon, A., Bush, L., Wang, A. T., Halpern, D., Frank, Y., Grodberg, D., et al. (2014). A pilot controlled trial of insulin-like growth factor-1 in children with Phelan-McDermid syndrome. Mol. Autism 5:54. doi: 10.1186/2040-2392-5-54
Kravitz, A. V., Freeze, B. S., Parker, P. R., Kay, K., Thwin, M. T., Deisseroth, K., et al. (2010). Regulation of parkinsonian motor behaviours by optogenetic control of basal ganglia circuitry. Nature 466, 622–626. doi: 10.1038/nature09159
Laplante, M., and Sabatini, D. M. (2012). mTOR signaling in growth control and disease. Cell 149, 274–293. doi: 10.1016/j.cell.2012.03.017
Leblond, C. S., Nava, C., Polge, A., Gauthier, J., Huguet, G., Lumbroso, S., et al. (2014). Meta-analysis of SHANK mutations in autism spectrum disorders: a gradient of severity in cognitive impairments. PLoS Genet. 10:e1004580. doi: 10.1371/journal.pgen.1004580
Lee, Y., Kang, H., Lee, B., Zhang, Y., Kim, Y., Kim, S., et al. (2017). Integrative analysis of brain region-specific Shank3 interactomes for understanding the heterogeneity of neuronal pathophysiology related to SHANK3 mutations. Front. Mol. Neurosci. 10:110. doi: 10.3389/fnmol.2017.00110
Lee, B., Zhang, Y., Kim, Y., Kim, S., Lee, Y., and Han, K. (2017). Age-dependent decrease of GAD65/67 mRNAs but normal densities of GABAergic interneurons in the brain regions of Shank3-overexpressing manic mouse model. Neurosci. Lett. 649, 48–54. doi: 10.1016/j.neulet.2017.04.016
Li, N., Lee, B., Liu, R. J., Banasr, M., Dwyer, J. M., Iwata, M., et al. (2010). mTOR-dependent synapse formation underlies the rapid antidepressant effects of NMDA antagonists. Science 329, 959–964. doi: 10.1126/science.1190287
Logan, R. W., and McClung, C. A. (2016). Animal models of bipolar mania: the past, present and future. Neuroscience 321, 163–188. doi: 10.1016/j.neuroscience.2015.08.041
Love, M. I., Huber, W., and Anders, S. (2014). Moderated estimation of fold change and dispersion for RNA-seq data with DESeq2. Genome Biol. 15:550. doi: 10.1101/002832
Marvel, C. L., and Paradiso, S. (2004). Cognitive and neurological impairment in mood disorders. Psychiatr. Clin. North Am. 27, 19–36, vii–viii. doi: 10.1016/s0193-953x(03)00106-0
Matamales, M., Götz, J., and Bertran-Gonzalez, J. (2016). Quantitative imaging of cholinergic interneurons reveals a distinctive spatial organization and a functional gradient across the mouse striatum. PLoS One 11:e0157682. doi: 10.1371/journal.pone.0157682
Matsumoto, M., Straub, R. E., Marenco, S., Nicodemus, K. K., Matsumoto, S., Fujikawa, A., et al. (2008). The evolutionarily conserved G protein-coupled receptor SREB2/GPR85 influences brain size, behavior and vulnerability to schizophrenia. Proc. Natl. Acad. Sci. U S A 105, 6133–6138. doi: 10.1073/pnas.0710717105
Merikangas, K. R., Jin, R., He, J. P., Kessler, R. C., Lee, S., Sampson, N. A., et al. (2011). Prevalence and correlates of bipolar spectrum disorder in the world mental health survey initiative. Arch. Gen. Psychiatry 68, 241–251. doi: 10.1001/archgenpsychiatry.2011.12
Moessner, R., Marshall, C. R., Sutcliffe, J. S., Skaug, J., Pinto, D., Vincent, J., et al. (2007). Contribution of SHANK3 mutations to autism spectrum disorder. Am. J. Hum. Genet. 81, 1289–1297. doi: 10.1086/522590
Monteiro, P., and Feng, G. (2017). SHANK proteins: roles at the synapse and in autism spectrum disorder. Nat. Rev. Neurosci. 18, 147–157. doi: 10.1038/nrn.2016.183
Morita, M., Gravel, S. P., Chenard, V., Sikström, K., Zheng, L., Alain, T., et al. (2013). mTORC1 controls mitochondrial activity and biogenesis through 4E-BP-dependent translational regulation. Cell Metab. 18, 698–711. doi: 10.1016/j.cmet.2013.10.001
Moskvina, V., Craddock, N., Holmans, P., Nikolov, I., Pahwa, J. S., Green, E., et al. (2009). Gene-wide analyses of genome-wide association data sets: evidence for multiple common risk alleles for schizophrenia and bipolar disorder and for overlap in genetic risk. Mol. Psychiatry 14, 252–260. doi: 10.1038/mp.2008.133
Narita, M., Young, A. R., Arakawa, S., Samarajiwa, S. A., Nakashima, T., Yoshida, S., et al. (2011). Spatial coupling of mTOR and autophagy augments secretory phenotypes. Science 332, 966–970. doi: 10.1126/science.1205407
Nestler, E. J., and Hyman, S. E. (2010). Animal models of neuropsychiatric disorders. Nat. Neurosci. 13, 1161–1169. doi: 10.1038/nn.2647
Peça, J., Feliciano, C., Ting, J. T., Wang, W., Wells, M. F., Venkatraman, T. N., et al. (2011). Shank3 mutant mice display autistic-like behaviours and striatal dysfunction. Nature 472, 437–442. doi: 10.1038/nature09965
Peixoto, R. T., Wang, W., Croney, D. M., Kozorovitskiy, Y., and Sabatini, B. L. (2016). Early hyperactivity and precocious maturation of corticostriatal circuits in Shank3B−/− mice. Nat. Neurosci. 19, 716–724. doi: 10.1038/nn.4260
Piñero, J., Bravo, À., Queralt-Rosinach, N., Gutiérrez-Sacristán, A., Deu-Pons, J., Centeno, E., et al. (2017). DisGeNET: a comprehensive platform integrating information on human disease-associated genes and variants. Nucleic Acids Res. 45, D833–D839. doi: 10.1093/nar/gkw943
Piñero, J., Queralt-Rosinach, N., Bravo, À., Deu-Pons, J., Bauer-Mehren, A., Baron, M., et al. (2015). DisGeNET: a discovery platform for the dynamical exploration of human diseases and their genes. Database (Oxford) 2015:bav028. doi: 10.1093/database/bav028
Radulescu, E., Sambataro, F., Mattay, V. S., Callicott, J. H., Straub, R. E., Matsumoto, M., et al. (2013). Effect of schizophrenia risk-associated alleles in SREB2 (GPR85) on functional MRI phenotypes in healthy volunteers. Neuropsychopharmacology 38, 341–349. doi: 10.1038/npp.2012.184
Rocca, D. L., Martin, S., Jenkins, E. L., and Hanley, J. G. (2008). Inhibition of Arp2/3-mediated actin polymerization by PICK1 regulates neuronal morphology and AMPA receptor endocytosis. Nat. Cell Biol. 10, 259–271. doi: 10.1038/ncb1688
Sakai, Y., Shaw, C. A., Dawson, B. C., Dugas, D. V., Al-Mohtaseb, Z., Hill, D. E., et al. (2011). Protein interactome reveals converging molecular pathways among autism disorders. Sci. Transl. Med. 3:86ra49. doi: 10.1126/scitranslmed.3002166
Shahani, N., Swarnkar, S., Giovinazzo, V., Morgenweck, J., Bohn, L. M., Scharager-Tapia, C., et al. (2016). RasGRP1 promotes amphetamine-induced motor behavior through a Rhes interaction network (“Rhesactome”) in the striatum. Sci. Signal. 9:ra111. doi: 10.1126/scisignal.aaf6670
Shannon, P., Markiel, A., Ozier, O., Baliga, N. S., Wang, J. T., Ramage, D., et al. (2003). Cytoscape: a software environment for integrated models of biomolecular interaction networks. Genome Res. 13, 2498–2504. doi: 10.1101/gr.1239303
Shcheglovitov, A., Shcheglovitova, O., Yazawa, M., Portmann, T., Shu, R., Sebastiano, V., et al. (2013). SHANK3 and IGF1 restore synaptic deficits in neurons from 22q13 deletion syndrome patients. Nature 503, 267–271. doi: 10.1038/nature12618
Steiner, H., and Tseng, K.-Y. (Eds). (2010). Handbook of Basal Ganglia Structure and Function: A Decade of Progress San Diego/Amsterdam: Elsevier/Academic Press.
Strakowski, S. M., Delbello, M. P., Sax, K. W., Zimmerman, M. E., Shear, P. K., Hawkins, J. M., et al. (1999). Brain magnetic resonance imaging of structural abnormalities in bipolar disorder. Arch. Gen. Psychiatry 56, 254–260. doi: 10.1001/archpsyc.56.3.254
Subramaniam, S., Napolitano, F., Mealer, R. G., Kim, S., Errico, F., Barrow, R., et al. (2011). Rhes, a striatal-enriched small G protein, mediates mTOR signaling and L-DOPA-induced dyskinesia. Nat. Neurosci. 15, 191–193. doi: 10.1038/nn.2994
Subramanian, A., Tamayo, P., Mootha, V. K., Mukherjee, S., Ebert, B. L., Gillette, M. A., et al. (2005). Gene set enrichment analysis: a knowledge-based approach for interpreting genome-wide expression profiles. Proc. Natl. Acad. Sci. U S A 102, 15545–15550. doi: 10.1073/pnas.0506580102
Takei, N., and Nawa, H. (2014). mTOR signaling and its roles in normal and abnormal brain development. Front. Mol. Neurosci. 7:28. doi: 10.3389/fnmol.2014.00028
Takenawa, T., and Suetsugu, S. (2007). The WASP-WAVE protein network: connecting the membrane to the cytoskeleton. Nat. Rev. Mol. Cell Biol. 8, 37–48. doi: 10.1038/nrm2069
Verpelli, C., Dvoretskova, E., Vicidomini, C., Rossi, F., Chiappalone, M., Schoen, M., et al. (2011). Importance of Shank3 protein in regulating metabotropic glutamate receptor 5 (mGluR5) expression and signaling at synapses. J. Biol. Chem. 286, 34839–34850. doi: 10.1074/jbc.M111.258384
Vicidomini, C., Ponzoni, L., Lim, D., Schmeisser, M. J., Reim, D., Morello, N., et al. (2017). Pharmacological enhancement of mGlu5 receptors rescues behavioral deficits in SHANK3 knock-out mice. Mol. Psychiatry 22:784. doi: 10.1038/mp.2016.70
Wang, X., Bey, A. L., Katz, B. M., Badea, A., Kim, N., David, L. K., et al. (2016). Altered mGluR5-Homer scaffolds and corticostriatal connectivity in a Shank3 complete knockout model of autism. Nat. Commun. 7:11459. doi: 10.1038/ncomms11459
Wang, W., Li, C., Chen, Q., van der Goes, M. S., Hawrot, J., Yao, A. Y., et al. (2017). Striatopallidal dysfunction underlies repetitive behavior in Shank3-deficient model of autism. J. Clin. Invest. 127, 1978–1990. doi: 10.1172/JCI87997
Wessa, M., Houenou, J., Paillère-Martinot, M. L., Berthoz, S., Artiges, E., Leboyer, M., et al. (2007). Fronto-striatal overactivation in euthymic bipolar patients during an emotional go/nogo task. Am. J. Psychiatry 164, 638–646. doi: 10.1176/appi.ajp.164.4.638
Keywords: Shank3, mTORC1, striatum, mania, Rhes
Citation: Lee Y, Kim SG, Lee B, Zhang Y, Kim Y, Kim S, Kim E, Kang H and Han K (2017) Striatal Transcriptome and Interactome Analysis of Shank3-overexpressing Mice Reveals the Connectivity between Shank3 and mTORC1 Signaling. Front. Mol. Neurosci. 10:201. doi: 10.3389/fnmol.2017.00201
Received: 26 April 2017; Accepted: 08 June 2017;
Published: 28 June 2017.
Edited by:
Michael R. Kreutz, Leibniz Institute for Neurobiology, GermanyReviewed by:
Andreas Martin Grabrucker, University of Limerick, IrelandMichael J. Schmeisser, Otto-von-Guericke University Magdeburg, Germany
Chiara Verpelli, Istituto di Neuroscienze (CNR), Italy
Copyright © 2017 Lee, Kim, Lee, Zhang, Kim, Kim, Kim, Kang and Han. This is an open-access article distributed under the terms of the Creative Commons Attribution License (CC BY). The use, distribution or reproduction in other forums is permitted, provided the original author(s) or licensor are credited and that the original publication in this journal is cited, in accordance with accepted academic practice. No use, distribution or reproduction is permitted which does not comply with these terms.
*Correspondence: Hyojin Kang, hjkang.kr@gmail.com
Kihoon Han, neurohan@korea.ac.kr