 Siyu Zuo
 Lei Wu
 Yi Wang
 Xiaoqin Yuan
- 1Department of Anatomy, Histology, and Embryology, Nanjing Medical University, Nanjing, China
- 2Department of Clinical Medicine, First Clinical Medicine College, Nanjing Medical University, Nanjing, China
- 3Key Laboratory for Aging and Disease, Nanjing Medical University, Nanjing, China
Colorectal cancer (CRC), a common tumor, is characterized by a high mortality rate. Long non-coding RNA maternally expressed gene 3 (MEG3) serves a regulatory role in the carcinogenesis and progression of several types of cancer; however, its role in CRC remains largely unknown. The aim of this study was to explore the regulatory role and mechanism(s) of MEG3 in CRC. The Warburg effect or aerobic glycolysis is characteristic of the metabolism of tumor cells. To determine the effect of MEG3 on glycolysis of CRC cells, we used an XF analyzer to perform glycolysis stress test assays and found that overexpression of MEG3 significantly inhibited glycolysis, glycolytic capacity, as well as lactate production in CRC cells, whereas knockdown of MEG3 produced the opposite effect. Mechanistically, overexpression of MEG3 induced ubiquitin-dependent degradation of c-Myc and inhibited c-Myc target genes involved in the glycolysis pathway such as lactate dehydrogenase A, pyruvate kinase muscle 2, and hexokinase 2. Moreover, we found that MEG3 can be activated by vitamin D and vitamin D receptor (VDR). Clinical data demonstrated that MEG3 was positively associated with serum vitamin D concentrations in patients with CRC. We found that 1,25(OH)2D3 treatment increased MEG3 expression, and knockdown of VDR abolished the effect of MEG3 on glycolysis. These results indicate that vitamin D-activated MEG3 suppresses aerobic glycolysis in CRC cells via degradation of c-Myc. Thus, vitamin D may have therapeutic value in the treatment of CRC.
Introduction
Colorectal cancer (CRC), the third most commonly diagnosed cancer, has a high cancer-related mortality rate worldwide (1, 2). In China, CRC is the fourth most common cancer, with 376,000 new patients diagnosed in 2015, leading to about 191,000 deaths (3). However, the molecular mechanisms underlying CRC progression are not fully understood. More research is needed to discover and develop effective biomarkers and targets for diagnosis and treatment of CRC. Recently, accumulating evidence has shown that long non-coding RNAs (lncRNAs), non-coding RNA transcripts longer than 200 nucleotides (4), are expressed differentially in various cancers including CRCs, suggesting that lncRNAs have roles in tumorigenesis and tumor metastasis (5–7). Among them, maternally expressed gene 3 (MEG3) has been reported to be aberrantly expressed in CRC and may act as a tumor suppressor (8–10). However, the mechanism of action of MEG3 in CRC requires further investigation.
It has been demonstrated that most cancer cells have altered energy metabolism characterized by glycolysis with lactate production and a higher uptake of glucose as the main source of energy even in the presence of oxygen, well-known as the “Warburg effect” (11, 12). Under normoxic conditions, glycolysis is commonly driven by c-Myc (13, 14), which upregulates glycolytic enzymes such as lactate dehydrogenase A (LDHA) and hexokinase 2 (HK2) (15–17). Many non-coding RNAs have been reported to be involved in the regulation of cancer metabolism (18). For example, lncRNA PVT1 promotes glycolysis and tumor progression by regulating the miR-497/HK2 axis in osteosarcoma (19), whereas lncRNA-MIF inhibits aerobic glycolysis and tumorigenesis by suppressing c-Myc and miR-586 in cancer cells (20).
In this study, we demonstrate that MEG3 activated by vitamin D and vitamin D receptor (VDR) suppresses activation of glycolysis by promoting c-Myc degradation under normoxic conditions.
Materials and Methods
Clinical Samples
A total of 80 CRC tissue samples and corresponding adjacent normal mucosal samples were collected at the First Affiliated Hospital of Nanjing Medical University. All samples were snap-frozen in liquid nitrogen immediately after collection and stored at −80°C until total RNA was extracted. The clinicopathological characteristics of the patients with CRC from whom the samples were obtained are summarized in Table 1. This project was approved by the Research Ethics Committee of Nanjing Medical University [Approval ID: (2016)640].
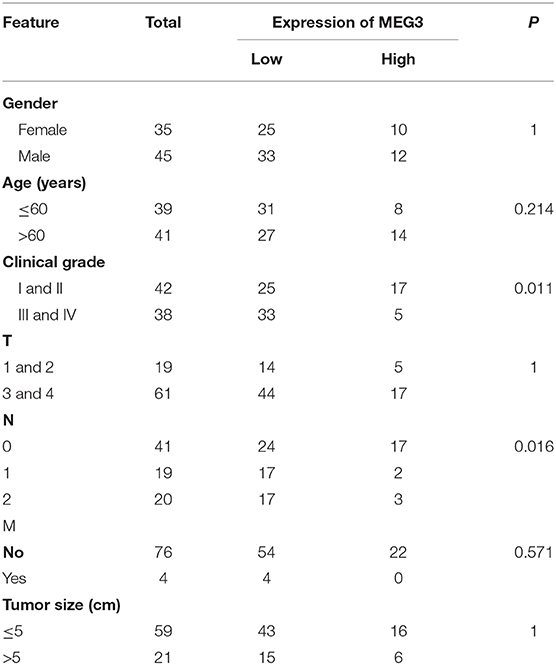
Table 1. Association of maternally expressed gene 3 (MEG3) expression with clinicopathological variables in patients with colorectal cancer (CRC) (n = 80).
Cell Culture
The human CRC cell lines DLD-1 and RKO were purchased from the Shanghai Institute of Cell Biology, Chinese Academy of Sciences (Shanghai, China), and were maintained in RPMI-1640 (HyClone, Logan, UT, USA), supplemented with 10% fetal bovine serum (FBS; Gibco, Grand Island, NY, USA), 100 U/ml penicillin, and 0.1 mg/ml streptomycin (Gibco). All cell lines were cultured in a humidified incubator of 5% CO2 at 37°C. Cells were collected for further studies after treatment with cycloheximide (CHX) and MG132 (MedchemExpress, Monmouth Junction, NJ, USA) for various periods of time.
RNA Extraction and Real-Time Polymerase Chain Reaction
Total RNA was extracted from frozen tissues with TRIzol reagent (Invitrogen, Grand Island, NY, USA) and reverse transcribed to complementary DNA (cDNA) by using a PrimeScript™ 1st Strand cDNA Synthesis Kit (Takara Bio, Shiga, Japan) according to the user's manual. Real-time polymerase chain reaction (RT-PCR) was performed with gene-specific primers to determine the relative expression of genes of interest using SYBR green reagents (Takara Bio) in an ABI 7300 sequence detector (Applied Biosystems, Foster City, CA, USA). Glyceraldehyde 3-phosphate dehydrogenase (GAPDH) or ACTIN mRNA was used for normalization. The PCR primers used in this study are listed in Table S1.
Small Interfering RNA and Plasmid Transfection
The cDNAs encoding MEG3 and VDR were synthesized and cloned into the pcDNA3.1 vector to construct pcDNA-MEG3 and pcDNA-VDR vector, respectively. Empty pcDNA3.1 vector was used as the control. The small interfering RNA (siRNA) targeting MEG3 (siRNA-MEG3) and negative control siRNA (siRNA-NC) were synthesized by RiboBio (Guangzhou, China). The siRNA sequences for MEG3 were as follows: MEG3 siRNA1: sense: 5′-GGAUGGCACUUGACCUAGA-3′, antisense: 5′-UCUAGGUCAAGUGCCAUCC-3′; siRNA2: sense: 5′-GAACCAUUCUGUUAUUCUU-3′, antisense: 5′-AAGAAUAACAGAAUGGUUC-3′; and siRNA3: sense: 5′-GGUUAAGUCUCUUGAAAGA-3′, antisense: 5′-UCUUUUCAAGAGACUUAACC-3′. The target sequence of VDR-specific short hairpin RNA (shRNA) (sh-VDR) was: 5′-TCCAGTTCGTGAATGAT-3′. A non-silencing shRNA (sh-NC) oligonucleotide was used as a negative control. DLD-1 or RKO cells were transfected with plasmid vectors using Lipofectamine 2000 (Invitrogen) and transfected with siRNA using Lipofectamine RNAiMAX (Invitrogen, Waltham, MA, USA), according to the manufacturer's protocol.
CCK8 Assays
Cell proliferation was detected using a Cell Counting Kit 8 (Donjindo, Kumamoto, Japan). Briefly, cells (3 × 10³) transfected with either siRNA or plasmid were seeded into 96-well plates, and cell growth was determined every 24 h for 4 days in accordance with the manufacturer's protocol. The absorbance at a wavelength of 450 nm was measured using a microplate reader (Bio-Tek, Winooski, VT, USA).
Colony Formation Assays
Transfected cells with siRNA or plasmid were seeded in six-well plates at 600 cells per well and 1,000 cells per well, respectively, and cultured for 10–15 days with replacement with new medium every 3 days. Colonies were fixed, stained with crystal violet, and photographed. For each treatment group, wells were counted in triplicate.
Transwell Assays
Cell migration and invasion assays were carried out using 24-well Transwell chambers with 8-μm pore size polycarbonate membrane (Corning, NY, USA). A total of 6 × 10⁴ or 8 × 10⁴ cells in 200 μl serum-free medium were seeded in the upper chambers coated without or with Matrigel (BD Biosciences, NY, USA) for migration or invasion assays, respectively, after which 600 μl medium with 10% fetal bovine serum (FBS) (20% FBS for invasion assays) was added to the lower chambers. The cells on the upper surfaces of the membranes were removed 36–48 h later. Cells on the bottom surfaces of the membranes were fixed, stained with 0.1% crystal violet, and counted in five fields using a Zeiss microscope (Melville, NY, USA).
Western Blot Analysis
Lysates from cells were separated by sodium dodecyl sulfate (SDS)-polyacrylamide gel electrophoresis, transferred onto polyvinylidene fluoride (PVDF) membranes (PerkinElmer, Boston, MA, USA), and blotted with primary antibodies, followed by horseradish peroxidase (HRP)-conjugated secondary antibody. The primary antibodies used were anti-c-Myc and anti-HK2 (Abcam, Cambridge, MA, USA) and anti-PKM2 (Affinity Biosciences, OH, USA); and anti-LDHA, anti-GAPDH, and anti-actin (Santa Cruz, CA, USA); and anti-FBXW7 (ABclonal, Wuhan, China).
Glycolysis Stress Test
The extracellular acidification rate (ECAR) was measured using a Seahorse XF96 Analyzer Glycolysis (Seahorse Bioscience, Santa Clara, USA) according to the manufacturer's protocol. Briefly, DLD-1 or RKO cells in 10% FBS RPMI-1640 were seeded in XF 96-well plates and incubated at 37°C in a 5% CO2 humidified atmosphere overnight. The cells were then incubated in the glycolysis stress test medium without glucose, and the ECAR was measured. Following this, D-glucose (10 mM), oligomycin (1 μM), and 2-deoxyglucose (100 mM) were added into the wells at the indicated time points; meanwhile, corresponding ECARs were assessed. The ECAR values are presented as the mean ± SD of experimental triplicates. The key variables of glycolysis and glycolytic capacity were analyzed using XF Glycolysis Stress Test software.
Lactate Production Assay
CRC cells transfected with siRNA or plasmid or treated with vitamin D were cultured, and the culture medium was collected 24 h later. Lactate production was quantitated using a lactate assay kit (Jiancheng, Nanjing, China) according to the manufacturer's instructions. Total viable cell numbers were used for normalization.
Serum Vitamin D Measurement
Serum 25(OH)D3 concentrations were measured by chemiluminescence using an ADVIA Centaur Vitamin D Total (VitD) Assay kit (Siemens Healthineers, Erlangen, Germany) according to the manufacturer's instructions.
In vivo Ubiquitination Assay
In vivo ubiquitination assays were performed according to a previously described protocol (7). Briefly, DLD-1 or RKO cells in six-well plates were transfected with 1 μg pcDNA-Ub-HA of ubiquitin-HA fusion protein (a gift from Dr. Xinjin Lin, Fujian Medical University, Fujian, China), 1 μg pcDNA-c-Myc with Flag tag at the C-terminal (Genechem, Shanghai, China), together with 40 pmol MEG3 siRNA or 1 μg pcDNA-MEG3. Twenty-four hours after transfection, the cells were treated with 30 μM MG132 (Sigma Aldrich) for 6 h and then lysed with RIPA lysis buffer. The cell lysates were then incubated with anti-HA magnetic beads (Bimake, Houston, TX, USA) overnight at 4°C. After washing, the proteins were eluted with SDS sample buffer. Eluted proteins were analyzed by Western blotting with anti-Flag (Sigma) antibody.
Statistical Analysis
All data are presented as mean ± SEM. Student's t-test was used to compare data between two groups. Overall survival curves were plotted using the Kaplan–Meier method and analyzed with the log-rank test. Correlations were analyzed with Pearson r analysis. The clinicopathological characteristics of the 80 patients with CRC were subjected to logistic regression analysis. P < 0.05 was considered to denote statistical significance.
Results
MEG3 Is Downregulated in CRC and Associated With Tumor Prognosis
Downregulation of MEG3 has been observed in CRC tissues (8, 21). To further confirm this, we used RT-qPCR to measure MEG3 expression in 80 CRC samples and the matched samples of adjacent normal mucosa. Consistent with others' findings, we found that there was significantly lower expression of MEG3 in CRC tissues (P < 0.05) than the corresponding adjacent normal mucosa (Figure 1A). Low expression of MEG3 was significantly associated with advanced CRC clinical stage (P < 0.05) (Figure 1B). However, in our study, there was no significant association between the level of MEG3 expression and various other clinical variables such as sex, age, and tumor size (Table 1). We also examined the relationship between MEG3 expression and clinical outcomes, including overall survival. We divided the patients into two groups on the basis of the fold difference in expression of MEG3 in the tumor and the corresponding adjacent normal tissue: MEG3-high group (fold difference >1, n = 22) and MEG3-low group (fold difference <1, n = 58) and then performed a Kaplan–Meier survival analysis and log-rank tests. We found that overall survival was significantly poorer in the MEG3-low group than that in the MEG3-high group (P < 0.05) (Figure 1C). These results indicate that MEG3 expression is associated with cancer progression and poorer prognosis in patients with CRC.
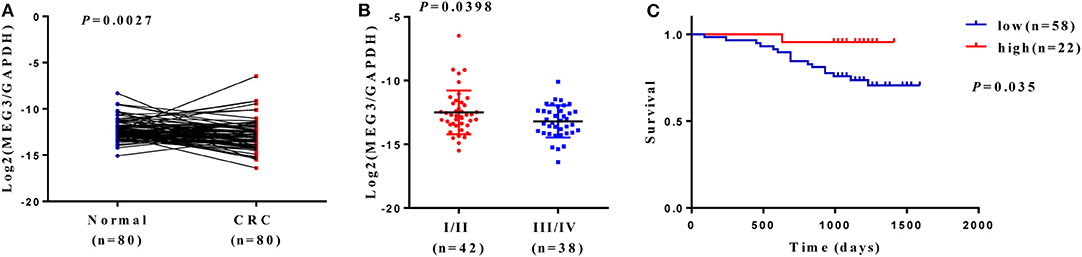
Figure 1. Maternally expressed gene 3 (MEG3) is downregulated in colorectal cancer (CRC) tissues, and low expression of MEG3 is associated with poor prognosis of patients with CRC. (A) Expression of MEG3 is significantly lower in CRC tissues than in corresponding non-tumor tissues (n = 80). MEG3 expression was quantitated by qRT-PCR and plotted with log2-MEG3/glyceraldehyde 3-phosphate dehydrogenase (GAPDH). (B) MEG3 expression is negatively correlated with advanced CRC stage. (C) Kaplan–Meier survival curves showing an association between low expression of MEG3 and short overall survival in patients with CRC.
MEG3 Inhibits Cell Proliferation and Invasion
We next investigated the effect of MEG3 in CRC cells. We first transfected pcDNA-MEG3 vector or specific MEG3 siRNAs into DLD-1 and RKO cells. As shown as Figure 2A, pcDNA-MEG3 transfection increased the expression of MEG3, whereas siRNAs specifically targeting MEG3 decreased its expression. We next investigated the effect of proliferation of MEG3 on CRC cell lines. Data from CCK-8 showed that MEG3 overexpression reduced the viability of DLD-1 and RKO cells. In contrast, knockdown of MEG3 significantly increased cell viability (Figure 2B). Colony formation assays revealed that an increase in MEG3 significantly inhibited cell proliferation in both DLD-1 and RKO cell lines (282 ± 44 for DLD-1/pcDNA-MEG3 vs. 506 ± 61 for DLD-1/pcDNA, P = 0.0412; 308 ± 17 for RKO/pcDNA-MEG3 vs. 494 ± 16 for RKO/pcDNA, P = 0.0014), whereas MEG3-decreased cells had the opposite effect (205 ± 12 for DLD-1/siRNA-MEG3-1 vs. 133 ± 1 for DLD-1/siRNA-NC, P = 0.0036 and 164 ± 10 for DLD-1/siRNA-MEG3-2 vs. 133 ± 1 for DLD-1/siRNA-NC, P = 0.0388; 134 ± 13 for RKO/siRNA-MEG3-1 vs. 77 ± 8 for RKO/siRNA-NC, P = 0.0171 and 101 ± 3 for RKO/siRNA-MEG3-2 vs. 77 ± 8 for RKO/siRNA-NC, P = 0.0402) (Figure 2C).
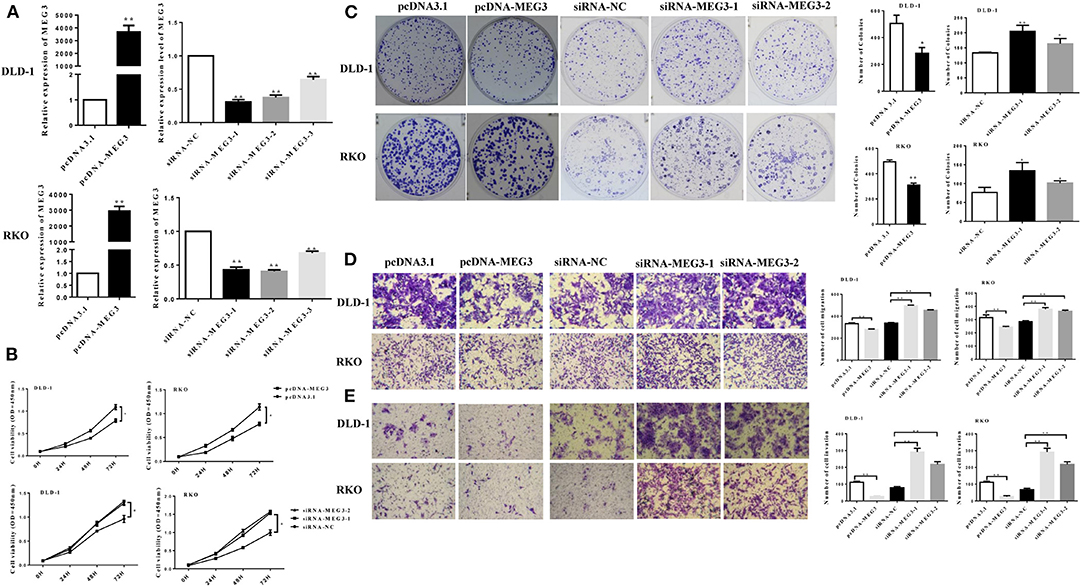
Figure 2. Maternally expressed gene 3 (MEG3) inhibits colorectal cancer (CRC) cell proliferation and invasion. (A) MEG3 expression as quantified by RT-qPCR in DLD-1 and RKO cells transfected with the indicated siRNAs or pcDNA-MEG3. (B) CCK-8 assays and (C) colony-forming growth assays were performed in DLD-1 and RKO cells transfected with MEG3 siRNAs or pcDNA-MEG3. Transwell assays were performed to detect the migration (D) and invasion (E) of MEG3 knockdown and overexpressing cells 36–48 h after transfection. Data are expressed as mean ± standard deviation from three independent experiments. *P < 0.05, **P < 0.01.
The effects of MEG3 on migration and invasion were then investigated. The results of the Transwell assays showed that overexpression of MEG3 significantly impaired CRC cell migratory and invasive ability, whereas knockdown of MEG3 strengthened these abilities compared with control cells (Figures 2D,E).
Taken together, the above data suggest that MEG3 inhibits CRC cell proliferation and invasion.
MEG3 Influences Glucose Metabolism in Colorectal Cancer Cells
Proliferation of tumor cells is reportedly usually accompanied by metabolic changes (11). Glycolysis is a hallmark of cancer cells. To investigate the role of MEG3 in glycolysis in CRC cells, we performed glycolysis stress test assays by using an XF analyzer to measure the ECAR. We found that MEG3 overexpression significantly inhibited glycolysis and glycolytic capacity in DLD-1 and RKO cells (Figure 3A), whereas MEG3 knockdown produced the opposite effect (Figure 3B). Moreover, we assessed cellular lactate production and found that MEG3 overexpression inhibited lactate production (Figure 3C), whereas knockdown of MEG3 by siRNA boosted lactate generation (Figure 3D). These data indicate that MEG3 inhibits glucose metabolism in CRC cells.
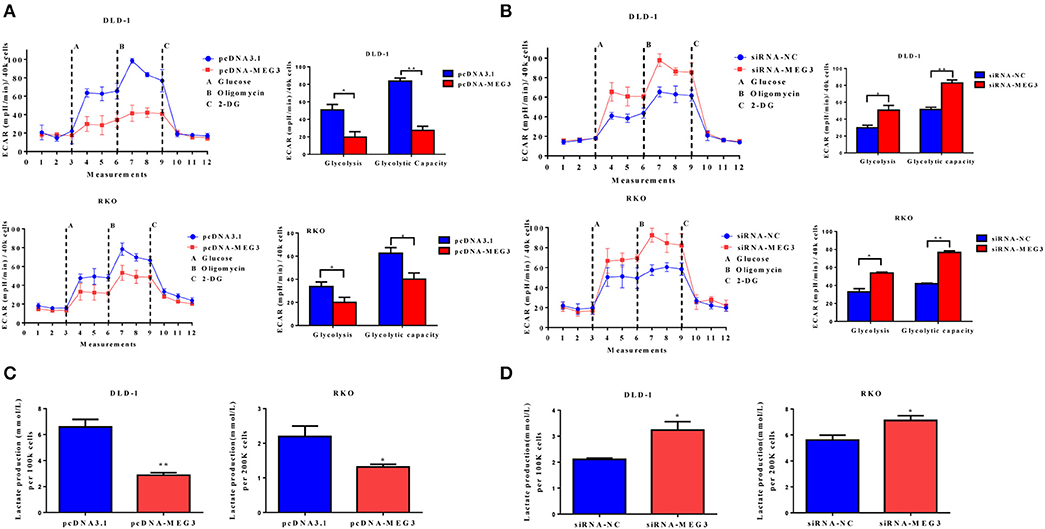
Figure 3. Maternally expressed gene 3 (MEG3) influences glucose metabolism in colorectal cancer (CRC) cells. The extracellular acidification rate (ECAR) was measured by glycolysis stress tests in CRC cell lines with MEG3 overexpression (A) and in those with MEG3 knockdown (B). Lactate production was measured in the culture medium of CRC cell lines with strong expression of MEG3 (C) and weak expression of MEG3 (D). Data are expressed as mean ± standard deviation from three independent experiments. *P < 0.05, **P < 0.01.
MEG3 Reduces c-Myc Protein Stability
Previous studies have demonstrated that c-Myc is primarily responsible for metabolic reprogramming of cancer cells (13). We therefore next investigated whether c-Myc participates in MEG3-mediated inhibition of glycolysis. As shown in Figure 4A, we found that MEG3 overexpression inhibited amounts of c-Myc protein and its targeted genes (HK2, PKM2, LDHA), whereas MEG siRNA did the opposite. The results of RT-qPCR indicated that amounts of mRNA of HK2, PKM2, and LDHA decreased in MEG3-overexpressed cells, whereas c-Myc did not change (Figure 4B), suggesting that MEG3 decreases c-Myc expression in the protein level. To verify this, we performed CHX treatment and found that the half-life of c-Myc in pcDNA3.1 is longer than that in pcDNA-MEG3 (59.19 ± 3.39 min for DLD-1/pcDNA3.1 vs. 37 ± 4.2 min for DLD-1/pcDNA-MEG3, P = 0.0021; 31.34 ± 1.34 min for RKO/pcDNA3.1 vs. 17.15 ± 2.58 min for RKO/ pcDNA-MEG3, P = 0.001) (Figure 4C). These data showed that MEG3 overexpression reduced the c-Myc stability. To determine whether MEG3 affects proteasomal degradation of c-Myc, we performed In vivo ubiquitination by transfecting pcDNA-Ub-HA and pcDNA-c-Myc together with pcDNA-MEG3 into DLD-1 or RKO cells in which we immunoprecipitated ubiquitin with anti-HA antibody and detected it by anti-Flag. We found that overexpression of MEG3 increased polyubiquitination of c-Myc (Figure 4D). Treatment with MG132, a proteasome inhibitor to inhibit protein degradation through proteasome-dependent pathway, rescued c-Myc protein expression (Figure 4E), suggesting that MEG3 affects c-Myc stability in proteasome-dependent degradation. Numerous studies have shown that E3 ubiquitin ligase of FBXW7 controls proteasome-mediated degradation of c-Myc (22). We therefore measured the expression of FBXW7 in MEG3 overexpression and MEG3-knockdown cells and found that MEG3 induced the expression of FBXW7 (Figure 4F). Meanwhile, knockdown of MEG3 reversed the FBXW7 level induced by MEG3 overexpression in CRC cells (Figure 4G). These results indicate that MEG3 may contribute to inhibiting glycolysis through promoting c-Myc degradation by increasing the amounts of FBXW7.
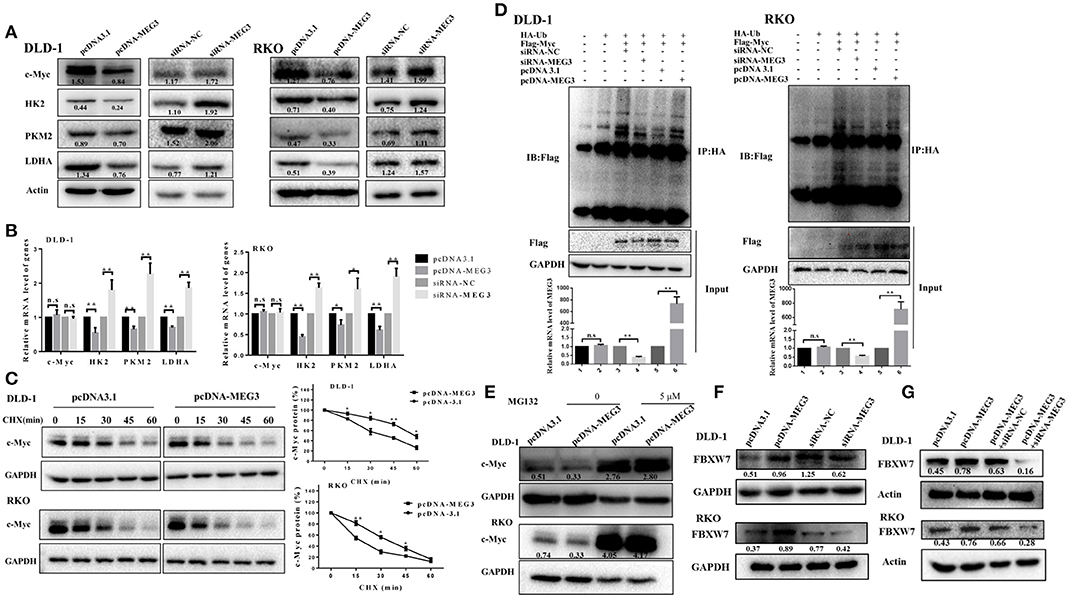
Figure 4. Maternally expressed gene 3 (MEG3) promotes c-Myc protein degradation. Expression levels of c-Myc, HK2, PKM2, and LDHA were detected by Western blot (A) and qRT-PCR (B) analysis in MEG3 overexpression and knockdown colorectal cancer (CRC) cell lines. (C) MEG3 overexpression CRC cell lines were treated with 100 μg/ml of cycloheximide (CHX) and harvested at the indicated time points. c-Myc protein was detected by Western blot analysis, quantified by densitometry, and plotted against time to determine c-Myc stability. (D) CRC cells were transfected with pcDNA-c-Myc in combination with pcDNA-MEG3 in the presence of the HA-ubiquitin plasmid as indicated at the top. The cells were treated with MG132 (30 μM) for 6 h before harvesting, and the cell lysates were subjected to immunoprecipitation using anti-HA antibody. Ubiquitinated proteins were detected by Western blot with the anti-Flag antibody. (E) CRC cell lines that strongly express MEG3 were treated with 5 μM of MG132 for 12 h, and c-Myc protein was detected by Western blot. (F) Expression of FBXW7 was detected by Western blot in CRC cells that strongly and weakly expressed MEG3. (G) Level of FBXW7 was measured by Western blot in the pcDNA-MEG3 cells with MEG3 knockdown. Data are expressed as mean ± standard deviation from three independent experiments. *P < 0.05, **P < 0.01.
MEG3 Activated by Vitamin D Through Vitamin D Receptor
A previous study has shown that vitamin D can promote MEG transcription through binding VDR (10). To further investigate this, we first measured serum concentrations of vitamin D [25(OH)2D3] in samples from CRC patients and found that these concentrations correlate positively with MEG3 expression in CRC tissues (Figure 5A). To further determine the effect of vitamin D on MEG3 expression, qRT-PCR analysis was performed and showed that amounts of MEG3 increased with vitamin D treatment and VDR overexpression but decreased with VDR knockdown (Figures 5B–D). Above all, our clinical and cellular data suggest that MEG3 expression is indeed positively regulated by vitamin D through VDR.
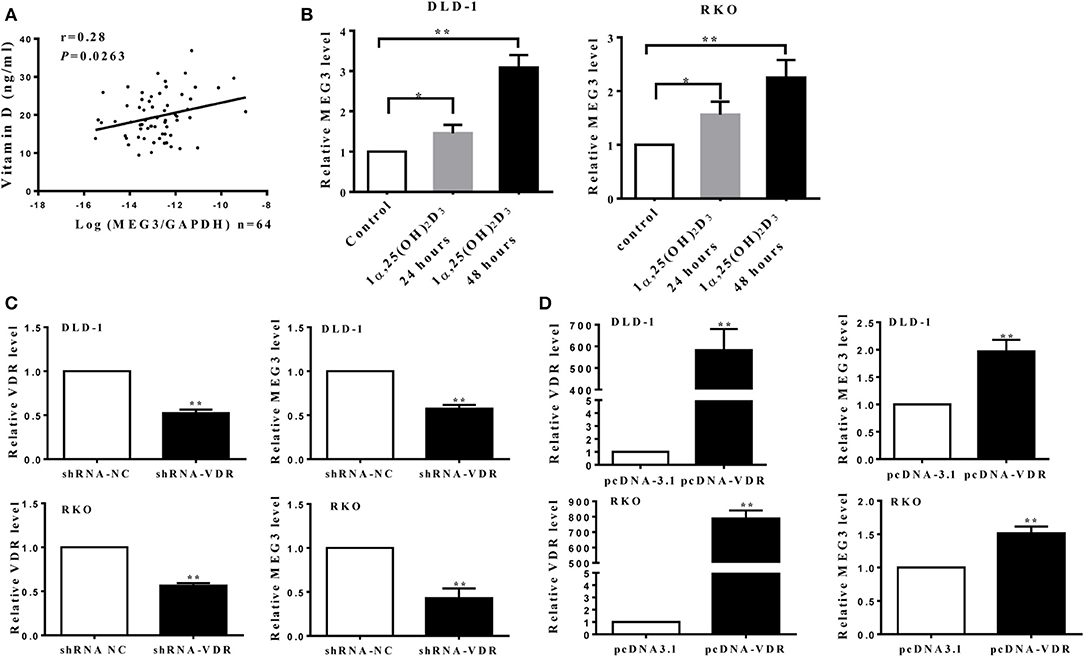
Figure 5. Maternally expressed gene 3 (MEG3) is activated by vitamin D through vitamin D receptor (VDR). (A) Levels of MEG3 expression in colorectal cancer (CRC) tissues and serum concentrations of vitamin D were examined in 64 CRC patients, and the correlation between MEG3 and vitamin D was analyzed. (B) MEG3 expression was measured with qRT-PCR after treatment with active vitamin D of 1α,25(OH)2D3 (20 nM) at the indicated times. MEG3 expression was detected by qRT-PCR in CRC cells transfected with shRNA-VDR (C) or pcDNA-VDR (D). Data are expressed as mean ± standard deviation from three independent experiments. *P < 0.05, **P < 0.01.
Vitamin D Receptor Knockdown Abolishes the Effect of MEG3 on Glucose Metabolism
To further determine whether vitamin D or VDR affects the effects of MEG3 on glucose metabolism, we performed glycolysis stress assays and lactate production assays. As shown in Figure 6A, both in DLD-1 and RKO cells, VDR knockdown greatly reversed MEG3 overexpression-induced inhibition of glycolysis and glycolytic capacity. Lactate production also increased consistently after VDR knockdown in MEG3-overexpressed cells (Figure 6B). Previous studies have shown that vitamin D decreases glycolysis in various cancers, including CRC (23–25). We speculated whether MEG3 mediated vitamin D-induced inhibition of glycolysis. To investigate this possibility, we treated MEG3-knockdown cells with vitamin D and performed glycolysis stress assays and lactate production assays. The results showed that vitamin D treatment inhibited significantly the glycolysis and glycolytic capacity and decreased the lactate production of CRC cells (Figures 6C,D). These inhibitions are partially rescued by MEG3 knockdown (Figures 6C,D). These data implicate that vitamin D inhibits glycolysis in CRC cells partially through the VDR/MEG3 pathway.
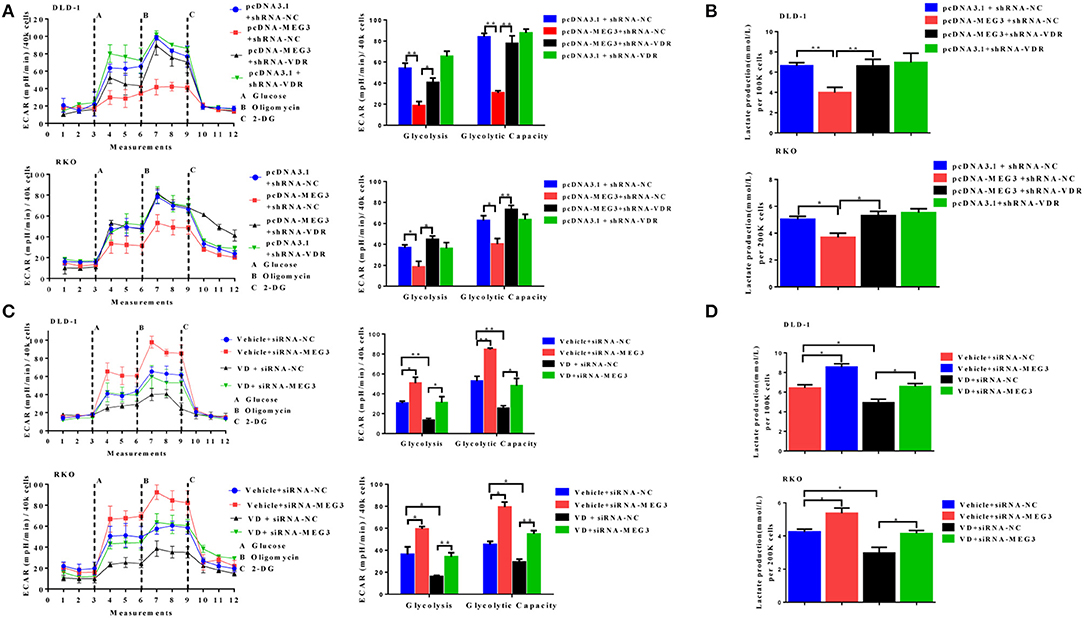
Figure 6. Vitamin D receptor (VDR) knockdown abolishes the effect of maternally expressed gene 3 (MEG3) on glucose metabolism. The extracellular acidification rate (ECAR) (A, left panel) and lactate production (B) were measured in colorectal cancer (CRC) cell lines with MEG3 overexpression and weak VDR expression (pcDNA-MEG3 + shRNA-VDR) or with MEG3 overexpression and base VDR expression (pcDNA-MEG3 + shRNA-NC). CRC cells with low expression of MEG3 were treated with 1α,25(OH)2D3 (vitamin D) (VD + siRNA-MEG3) or vehicle (Vehicle + siRNA-MEG3), and the ECAR (C, left panel) and lactate production (D) were measured. Glycolysis and glycolytic capacity were analyzed using XF Glycolysis Stress Test software (right panels of A,C). Data are expressed as mean ± standard deviation from three independent experiments. *P < 0.05, **P < 0.01.
Discussion
CRC had the third highest annual age-standardized incidence (2009–2013) worldwide, being 40.7 per 100,000 people with a mortality rate (2010–2014) of 14.8 per 100,000 persons (1, 2). However, the molecular mechanisms that underlie CRC tumorigenesis are yet to be fully elucidated. There is increasing evidence that lncRNAs acting as oncogenes or anti-oncogene factors have functions in tumorigenesis and tumor metastasis in CRC cells (5, 8, 26, 27).
MEG3 is aberrantly expressed in multiple types of cancers and is assumed as a tumor suppressor (10, 28, 29). MEG3 participates in carcinogenesis and cancer progression by regulating gene expression through chromatin modification, transcription, and posttranscriptional procession. For example, MEG3, as a competing endogenous RNA, reduces the invasiveness of human bladder cancer cells by competing with PHLPP2 mRNA for miR-27a (30); MEG3 inhibits the proliferation of epithelial ovarian cancer cells by regulating ATG3 activity and inducing autophagy (31); and MEG3 inhibits the proliferation and invasion of gallbladder cancer by associating with EZH2 and promoting its ubiquitination (32). Some recent studies have reported that the amounts of MEG3 are significantly reduced in tissue and serum from patients with CRC and that this can serve as a prognostic marker in such patients (8, 28, 33). However, the role of MEG3 in CRC remains largely unknown. In the present study, we also found that MEG3 expression was lower in tumor tissue than adjacent normal tissues from patients with CRC (Figure 1A). We identified downregulation of MEG3 in advanced stages of CRC, and this was closely associated with poor overall survival of the patients (Figures 1B,C). Functional studies demonstrated that MEG3 inhibited CRC cell proliferation, migration, and invasion (Figure 2), which is consistent with previous studies. Moreover, we found that MEG3 inhibited glycolysis in CRC cells (Figure 3).
Increased glycolysis is the main source of energy in cancer cells, which use this metabolic pathway to generate ATP (34), this being known as the Warburg effect because it was first described by Otto Warburg in the 1920s (35). Many studies have found that lncRNAs can regulate the Warburg effect to influence the growth and survival of cancer cells (36–38). The mechanism of lncRNA-mediated regulation is complex; however, many studies have found that lncRNAs can affect genes involved in glucose metabolism. It has been extensively documented that the oncogene of c-Myc is a key regulator of the Warburg effect by directly activating several glycolytic genes, including LDHA, PKM2, and others (39–41). Several studies have shown that lncRNAs regulate processes of glycolysis in cancer by altering amounts of c-Myc and, more specifically, by modifying the transcriptional patterns on c-Myc target genes. For example, lncRNA GLCC1 promotes glucose metabolism in CRC cells by protecting c-Myc from ubiquitination via direct interaction with heat shock protein (HSP)90 chaperone (42). LINC01123 promotes non-small-cell lung carcinoma (NSCLC) cell proliferation and aerobic glycolysis by increasing c-Myc mRNA expression with sponging miR-199a-5p (43). In the current study, we found that MEG3 inhibited c-Myc expression and its target glycolytic genes including HK2, PKM2, and LDHA (Figures 4A,B). Expression of c-Myc is largely posttranslationally regulated by E3 ubiquitin ligase, which binds c-Myc to promote its degradation. In the current study, we found that MEG3 inhibited the expression of c-Myc by promoting its ubiquitination, further increasing its degradation (Figures 4C–E). Moreover, the increase in ubiquitination of c-Myc that was induced by MEG3 may result from upregulation of FBXW7 (Figure 4F). However, how MEG3 regulates FBXW7 is not clear and requires further study.
Multiple studies have consistently shown an inverse association between serum vitamin D concentrations and risk of CRC (44–46). Our previous study also showed that vitamin D-deficient mice develop colonic inflammation (47). In the current study, we found a positive correlation between serum vitamin D concentration and MEG3 expression in patients with CRC (Figure 5A); to the best of our knowledge, we are the first to document a correlation between MEG3 and serum vitamin D. In addition, we showed that MEG3 can be induced by vitamin D via VDR transcription factor (Figures 5B–D), which is consistent with previous research (10). Moreover, VDR knockdown and MEG3 knockdown retard inhibition of glycolysis induced by MEG3 or vitamin D, respectively (Figures 6A–D). Interestingly, we found that glycolysis and glycolytic capacity and lactate production were consistently lower in VD + siRNA-MEG3 compared to vehicle + siRNA-MEG3 cells. Considering that vitamin D could regulate many genes by binding VDR, it might be possible that additional inhibitory mechanisms are involved in the glycolysis inhibited by vitamin D. Our data suggest that MEG3 activated by vitamin D is partly responsible for the anti-CRC effect of vitamin D.
In conclusion, in this study, we found that MEG3 is significantly decreased in CRC tissues and is positively associated with serum vitamin D concentrations in patients with CRC, indicating that it is a potential prognostic biomarker and therapeutic target for CRC. Vitamin D-activated MEG3 suppresses aerobic glycolysis of CRC cells via degrading c-Myc, suggesting that vitamin D may have therapeutic value in the treatment of CRC.
Thus, the present data indicate that the anticancer function of vitamin D may be executed via the VDR/MEG3 pathway.
Data Availability Statement
The raw data supporting the conclusions of this article will be made available by the authors, without undue reservation, to any qualified researcher.
Ethics Statement
The studies involving human participants were reviewed and approved by the Research Ethics Committee of Nanjing Medical University [Approval ID: (2016)640]. The patients/participants provided their written informed consent to participate in this study.
Author Contributions
XY designed the study and wrote the manuscript. SZ and LW developed the methodology and performed the analyses. YW collected the data.
Funding
This work was supported by the National Natural Science Foundation of China (No. 81572386) and the Natural Science Foundation of Jiangsu Province (No. BK20191353).
Conflict of Interest
The authors declare that the research was conducted in the absence of any commercial or financial relationships that could be construed as a potential conflict of interest.
Acknowledgments
We thank Dr. Trish Reynolds from Liwen Bianji, Edanz Group China (www.liwenbianji.cn/ac), for editing the English text of a draft of this manuscript.
Supplementary Material
The Supplementary Material for this article can be found online at: https://www.frontiersin.org/articles/10.3389/fonc.2020.00274/full#supplementary-material
References
1. Siegel RL, Miller KD, Fedewa SA, Ahnen DJ, Meester RGS, Barzi A, et al. Colorectal cancer statistics, 2017. CA Cancer J Clin. (2017) 67:177–93. doi: 10.3322/caac.21395
2. Arnold M, Sierra MS, Laversanne M, Soerjomataram I, Jemal A, Bray F. Global patterns and trends in colorectal cancer incidence and mortality. Gut. (2017) 66:683–91. doi: 10.1136/gutjnl-2015–310912
3. Chen W, Zheng R, Baade PD, Zhang S, Zeng H, Bray F, et al. Cancer statistics in China, 2015. CA Cancer J Clin. (2016) 66:115–32. doi: 10.3322/caac.21338
4. Kapranov P, Cheng J, Dike S, Nix DA, Duttagupta R, Willingham AT, et al. RNA maps reveal new RNA classes and a possible function for pervasive transcription. Science. (2007) 316:1484–8. doi: 10.1126/science.1138341
5. Huang FT, Chen WY, Gu ZQ, Zhuang YY, Li CQ, Wang LY, et al. The novel long intergenic noncoding RNA UCC promotes colorectal cancer progression by sponging miR-143. Cell Death Dis. (2017) 8:e2778. doi: 10.1038/cddis.2017.191
6. Bian Z, Zhang J, Li M, Feng Y, Wang X, Zhang J, et al. LncRNA-FEZF1-AS1 promotes tumor proliferation and metastasis in colorectal cancer by regulating PKM2 signaling. Clin Cancer Res. (2018) 24:4808–19. doi: 10.1158/1078–0432.CCR-17–2967
7. Zhou Q, Hou Z, Zuo S, Zhou X, Feng Y, Sun Y, et al. LUCAT1 promotes colorectal cancer tumorigenesis by targeting the ribosomal protein L40-MDM2-p53 pathway through binding with UBA52. Cancer Sci. (2019) 110:1194–207. doi: 10.1111/cas.13951
8. Wang W, Xie Y, Chen F, Liu X, Zhong LL, Wang HQ, et al. LncRNA MEG3 acts a biomarker and regulates cell functions by targeting ADAR1 in colorectal cancer. World J Gastroenterol. (2019) 25:3972–84. doi: 10.3748/wjg.v25.i29.3972
9. Dong X, Wang J, Li T, Xu YP, Li SY. Down regulation of lncRNA MEG3 promotes colorectal adenocarcinoma cell proliferation and inhibits the apoptosis by up-regulating TGF-beta1 and its downstream sphingosine kinase 1. Eur Rev Med Pharmacol Sci. (2018) 22:8265–72. doi: 10.26355/eurrev_201812_16522
10. Zhu Y, Chen P, Gao Y, Ta N, Zhang Y, Cai J, et al. MEG3 activated by vitamin D inhibits colorectal cancer cells proliferation and migration via regulating clusterin. EBioMedicine. (2018) 30:148–57. doi: 10.1016/j.ebiom.2018.03.032
11. Pavlova NN, Thompson CB. The emerging hallmarks of cancer metabolism. Cell Metab. (2016) 23:27–47. doi: 10.1016/j.cmet.2015.12.006
12. Ganapathy-Kanniappan S, Geschwind JF. Tumor glycolysis as a target for cancer therapy: progress and prospects. Mol Cancer. (2013) 12:152. doi: 10.1186/1476–4598-12–152
13. Miller DM, Thomas SD, Islam A, Muench D, Sedoris K. c-Myc and cancer metabolism. Clin Cancer Res. (2012) 18:5546–53. doi: 10.1158/1078–0432.CCR-12–0977
14. Xiang S, Gu H, Jin L, Thorne RF, Zhang XD, Wu M. LncRNA IDH1-AS1 links the functions of c-Myc and HIF1alpha via IDH1 to regulate the warburg effect. Proc Natl Acad Sci USA. (2018) 115:E1465–74. doi: 10.1073/pnas.1711257115
15. Shim H, Dolde C, Lewis BC, Wu CS, Dang G, Jungmann RA, et al. c-Myc transactivation of LDH-A: implications for tumor metabolism and growth. Proc Natl Acad Sci USA. (1997) 94:6658–63. doi: 10.1073/pnas.94.13.6658
16. Osthus RC, Shim H, Kim S, Li Q, Reddy R, Mukherjee M, et al. Deregulation of glucose transporter 1 and glycolytic gene expression by c-Myc. J Biol Chem. (2000) 275:21797–800. doi: 10.1074/jbc.C000023200
17. Kim JW, Gao P, Liu YC, Semenza GL, Dang CV. Hypoxia-inducible factor 1 and dysregulated c-Myc cooperatively induce vascular endothelial growth factor and metabolic switches hexokinase 2 and pyruvate dehydrogenase kinase 1. Mol Cell Biol. (2007) 27:7381–93. doi: 10.1128/MCB.00440–07
18. Kornfeld JW, Bruning JC. Regulation of metabolism by long, non-coding RNAs. Front Genet. (2014) 5:57. doi: 10.3389/fgene.2014.00057
19. Song J, Wu X, Liu F, Li M, Sun Y, Wang Y, et al. Long non-coding RNA PVT1 promotes glycolysis and tumor progression by regulating miR-497/HK2 axis in osteosarcoma. Biochem Biophys Res Commun. (2017) 490:217–24. doi: 10.1016/j.bbrc.2017.06.024
20. Zhang P, Cao L, Fan P, Mei Y, Wu M. LncRNA-MIF, a c-Myc-activated long non-coding RNA, suppresses glycolysis by promoting Fbxw7-mediated c-Myc degradation. EMBO Rep. (2016) 17:1204–20. doi: 10.15252/embr.201642067
21. Wu X, Li J, Ren Y, Zuo Z, Ni S, Cai J. MEG3 can affect the proliferation and migration of colorectal cancer cells through regulating miR-376/PRKD1 axis. Am J Transl Res. (2019) 11:5740–51.
22. Yeh CH, Bellon M, Nicot C. FBXW7: a critical tumor suppressor of human cancers. Mole Cancer. (2018) 17:115. doi: 10.1186/s12943–018-0857–2
23. Santos JM, Khan ZS, Munir MT, Tarafdar K, Rahman SM, Hussain F. Vitamin D3 decreases glycolysis and invasiveness, and increases cellular stiffness in breast cancer cells. J Nutr Biochem. (2018) 53:111–20. doi: 10.1016/j.jnutbio.2017.10.013
24. Abu El Maaty MA, Alborzinia H, Khan SJ, Buttner M, Wolfl S. 1,25(OH)2D3 disrupts glucose metabolism in prostate cancer cells leading to a truncation of the TCA cycle and inhibition of TXNIP expression. Biochim Biophys Acta Mol Cell Res. (2017) 1864:1618–30. doi: 10.1016/j.bbamcr.2017.06.019
25. Abu El Maaty MA, Strassburger W, Qaiser T, Dabiri Y, Wolfl S. Differences in p53 status significantly influence the cellular response and cell survival to 1,25-dihydroxyvitamin D3-metformin cotreatment in colorectal cancer cells. Mol Carcinog. (2017) 56:2486–98. doi: 10.1002/mc.22696
26. Zhang Z, Zhou C, Chang Y, Zhang Z, Hu Y, Zhang F, et al. Long non-coding RNA CASC11 interacts with hnRNP-K and activates the WNT/beta-catenin pathway to promote growth and metastasis in colorectal cancer. Cancer Lett. (2016) 376:62–73. doi: 10.1016/j.canlet.2016.03.022
27. Xu M, Xu X, Pan B, Chen X, Lin K, Zeng K, et al. LncRNA SATB2-AS1 inhibits tumor metastasis and affects the tumor immune cell microenvironment in colorectal cancer by regulating SATB2. Mole Cancer. (2019) 18:135. doi: 10.1186/s12943–019-1063–6
28. Kong H, Wu Y, Zhu M, Zhai C, Qian J, Gao X, et al. Long non-coding RNAs: novel prognostic biomarkers for liver metastases in patients with early stage colorectal cancer. Oncotarget. (2016) 7:50428–36. doi: 10.18632/oncotarget.10416
29. Chen X, Qu J. Long non-coding RNA MEG3 suppresses survival, migration, and invasion of cervical cancer. Onco Targets Ther. (2018) 11:4999–5007. doi: 10.2147/OTT.S167053
30. Huang C, Liao X, Jin H, Xie F, Zheng F, Li J, et al. MEG3, as a competing endogenous RNA, Binds with miR-27a to promote PHLPP2 protein translation and impairs bladder cancer invasion. Mol Ther Nucleic Acids. (2019) 16:51–62. doi: 10.1016/j.omtn.2019.01.014
31. Xiu YL, Sun KX, Chen X, Chen S, Zhao Y, Guo QG, et al. Upregulation of the lncRNA Meg3 induces autophagy to inhibit tumorigenesis and progression of epithelial ovarian carcinoma by regulating activity of ATG3. Oncotarget. (2017) 8:31714–25. doi: 10.18632/oncotarget.15955
32. Jin L, Cai Q, Wang S, Wang S, Mondal T, Wang J, et al. Long noncoding RNA MEG3 regulates LATS2 by promoting the ubiquitination of EZH2 and inhibits proliferation and invasion in gallbladder cancer. Cell Death Dis. (2018) 9:1017. doi: 10.1038/s41419–018-1064–1
33. Liu H, Ye D, Chen A, Tan D, Zhang W, Jiang W, et al. A pilot study of new promising non-coding RNA diagnostic biomarkers for early-stage colorectal cancers. Clin Chem Lab Med. (2019) 57:1073–83. doi: 10.1515/cclm-2019–0052
34. Gill KS, Fernandes P, O'Donovan TR, McKenna SL, Doddakula KK, Power DG, et al. Glycolysis inhibition as a cancer treatment and its role in an anti-tumour immune response. Biochim Biophys Acta. (2016) 1866:87–105. doi: 10.1016/j.bbcan.2016.06.005
35. Warburg O. On the origin of cancer cells. Science. (1956) 123:309–14. doi: 10.1126/science.123.3191.309
36. Zhao L, Ji G, Le X, Wang C, Xu L, Feng M, et al. Long noncoding RNA LINC00092 acts in cancer-associated fibroblasts to drive glycolysis and progression of ovarian cancer. Cancer Res. (2017) 77:1369–82. doi: 10.1158/0008–5472.CAN-16–1615
37. Malakar P, Stein I, Saragovi A, Winkler R, Stern-Ginossar N, Berger M, et al. Long noncoding RNA MALAT1 regulates cancer glucose metabolism by enhancing mTOR-mediated translation of TCF7L2. Cancer Res. (2019) 79:2480–93. doi: 10.1158/0008–5472.CAN-18–1432
38. Shankaraiah RC, Veronese A, Sabbioni S, Negrini M. Non-coding RNAs in the reprogramming of glucose metabolism in cancer. Cancer Lett. (2018) 419:167–74. doi: 10.1016/j.canlet.2018.01.048
39. Stine ZE, Walton ZE, Altman BJ, Hsieh AL, Dang CV. MYC, Metabolism, and cancer. Cancer Discov. (2015) 5:1024–39. doi: 10.1158/2159–8290.CD-15–0507
40. Fernandez PC, Frank SR, Wang L, Schroeder M, Liu S, Greene J, et al. Genomic targets of the human c-Myc protein. Genes Dev. (2003) 17:1115–29. doi: 10.1101/gad.1067003
41. Dang CV, Le A, Gao P. MYC-induced cancer cell energy metabolism and therapeutic opportunities. Clin Cancer Res. (2009) 15:6479–83. doi: 10.1158/1078–0432.CCR-09–0889
42. Tang J, Yan T, Bao Y, Shen C, Yu C, Zhu X, et al. LncRNA GLCC1 promotes colorectal carcinogenesis and glucose metabolism by stabilizing c-Myc. Nat Commun. (2019) 10:3499. doi: 10.1038/s41467–019-11447–8
43. Hua Q, Jin M, Mi B, Xu F, Li T, Zhao L, et al. LINC01123, a c-Myc-activated long non-coding RNA, promotes proliferation and aerobic glycolysis of non-small cell lung cancer through miR-199a-5p/c-Myc axis. J Hematol Oncol. (2019) 12:91. doi: 10.1186/s13045–019-0773-y
44. Ma Y, Zhang P, Wang F, Yang J, Liu Z, Qin H. Association between vitamin D and risk of colorectal cancer: a systematic review of prospective studies. J Clin Oncol. (2011) 29:3775–82. doi: 10.1200/JCO.2011.35.7566
45. Feldman D, Krishnan AV, Swami S, Giovannucci E, Feldman BJ. The role of vitamin D in reducing cancer risk and progression. Nat Rev Cancer. (2014) 14:342–57. doi: 10.1038/nrc3691
46. Yuan C, Sato K, Hollis BW, Zhang S, Niedzwieck D, Ou FS, et al. Plasma 25-Hydroxyvitamin D levels and survival in patients with advanced or metastatic colorectal cancer: findings from CALGB/SWOG 80405 (Alliance). Clin Cancer Res. (2019) 25:7497–505. doi: 10.1158/1078–0432.CCR-19–0877
Keywords: colorectal cancer, maternally expressed gene 3 (MEG3), glycolysis, c-Myc, vitamin D
Citation: Zuo S, Wu L, Wang Y and Yuan X (2020) Long Non-coding RNA MEG3 Activated by Vitamin D Suppresses Glycolysis in Colorectal Cancer via Promoting c-Myc Degradation. Front. Oncol. 10:274. doi: 10.3389/fonc.2020.00274
Received: 03 December 2019; Accepted: 17 February 2020;
Published: 11 March 2020.
Edited by:
Ondrej Slaby, Brno University of Technology, CzechiaReviewed by:
Vivek Kumar Mishra, University of California, San Francisco, United StatesAmedeo Columbano, University of Cagliari, Italy
Copyright © 2020 Zuo, Wu, Wang and Yuan. This is an open-access article distributed under the terms of the Creative Commons Attribution License (CC BY). The use, distribution or reproduction in other forums is permitted, provided the original author(s) and the copyright owner(s) are credited and that the original publication in this journal is cited, in accordance with accepted academic practice. No use, distribution or reproduction is permitted which does not comply with these terms.
*Correspondence: Xiaoqin Yuan, yuanxq@njmu.edu.cn
†These authors have contributed equally to this work