 Wei Xue1†
 Junfeng Zhang1†
 Haipeng Tong1
 Tian Xie1
 Xiao Chen1
 Bo Zhou1
 Pengfei Wu2
 Peng Zhong3
 Xuesong Du1
 Yu Guo1
 Youyuan Yang1
 Heng Liu1,4
 Jingqin Fang1
 Shunan Wang1
 Hao Wu1
 Kai Xu1
 Weiguo Zhang1,5*
- 1Department of Radiology, Daping Hospital, Army Medical University, Chongqing, China
- 2Department of Neurosurgery, Daping Hospital, Army Medical University, Chongqing, China
- 3Department of Pathology, Daping Hospital, Army Medical University, Chongqing, China
- 4Department of Radiology, PLA Rocket Force Characteristic Medical Center, Beijing, China
- 5Chongqing Clinical Research Centre of Imaging and Nuclear Medicine, Chongqing, China
Neovascularization is required in high-grade glioma (HGG). The objective of this study was to explore neovascularization-related genes and their corresponding MRI biomarkers during the early-growth stage of HGG. Tumor tissues from 30 HGG patients underwent perfusion MRI scanning prior to surgery were used to establish orthotopic xenograft models, pathologically analyze the tumor vasculature and perform transcriptome sequencing. The cases were divided into two groups based on whether the xenograft was successfully established. Microvascular density and BMPER, CXCL10, and HOXA9 expression of surgical specimens in the xenograft-forming group was significantly elevated and the microvascular diameter was significantly reduced, in vitro inhibition of BMPER, CXCL10, or HOXA9 in the glioma stem cell significantly suppressed its tube formation abilities. The in vivo experiment showed that BMPER was highly expressed in the early tumor growth phase (20 days), CXCL10 and HOXA9 expression was elevated with tumor progress, and spatially associated with tumor vasculature. Perfusion weighted MRI (PWI-MRI) derived parameters, rCBV, rCBF, Ktrans, and Vp, were also increased in the xenograft-forming group. In conclusion BMPER, CXCL10, and HOXA9 promote early tumor growth and progression by stimulating neovascularization of primary HGG. The rCBV, rCBF, Ktrans, and Vp can be used as imaging biomarkers to predict the expression statuses of these genes.
Introduction
Gliomas are the most common primary brain tumors in adults, accounting for over 70% of primary malignant brain tumors (1). Gliomas at World Health Organization (WHO) grades III and IV are referred to as high-grade gliomas and are highly malignant and progress rapidly. Although therapeutic strategies are constantly being developed, patients' prognoses remain poor (2).
Glioma neovascularization is required for tumor growth and closely related to tumor initiation, progression, metastasis, and relapse (3, 4). During the glioma early-growth phase, activated tumor cells are believed to first organize into cuffs around normal blood vessels to obtain nutrients (5) and generate massive tumor blood vessels by promoting endothelial cell proliferation by secreting vascular endothelial growth factor (VEGF), angiopoietin-2 (ANG-2), and stromal cell-derived factor 1 (SDF-1α) (6) and recruiting circulating endothelial progenitors (7) to provide essential nutrients for tumor growth and progression. Upregulation of the VEGF signaling pathway is the most important factor promoting neovascularization in gliomas. However, inhibiting VEGF only transiently suppresses tumor neovascularization and slows tumor growth but does not effectively improve glioma patients' overall survival (8, 9). This suggests that multiple angiogenic pathways play important roles in glioma neovascularization. For example, VEGF-independent endothelial transdifferentiation of tumor cells is another important approach by which gliomas acquire blood vessels (10). Therefore, other genes and pathways that promote glioma neovascularization must be investigated to progress treatment of gliomas. However, genes have specific temporal and spatial effects and usually play different roles during different tumor initiation and progression stages. The roles of neovascularization-related genes must be investigated during each stage of glioma progression to accurately treat patients and predict their prognoses.
Perfusion weighted magnetic resonance imaging is an effective means to non-invasively detect blood vessels and flow in tumors in vivo. Using the changes in signal intensity of the contrast agent in the blood vessels over time, dynamic susceptibility contrast (DSC)-MRI technology can calculate cerebral blood volume (CBV) and cerebral blood flow (CBF) (11). Dynamic contrast-enhanced (DCE)-MRI technology uses two compartment models and can calculate Ktrans, which reflects the permeability of newly generated blood vessels in the tissue, Vp, which reflects plasma volume, Ve, which reflects the volume of extracellular space out of the blood vessel, and Kep, which reflects the reflux rate of the contrast agent via the changes in contrast agent signal intensity over time in the blood vessels and extravascular spaces (12). These MRI parameters show changes in blood vessel structures and functions in the tumor region, which can be used to monitor the tumor response to treatment (13). These parameters are also related to the molecular characteristics and genetic phenotypes of tumors. A study confirmed that Ktrans is related to the O6-methylguanine-DNA methyltransferase (MGMT) methylation status of glioblastomas (14) and relative CBV (rCBV) can predict the isocitrate dehydrogenase 1 (IDH1) mutation statuses in astrocytomas (15). Studies have also confirmed that mRNA expression levels are associated with MRI characteristics (16). These findings have important value for clinically and non-invasively screening specific gene expression within tumors.
Cell line tumor models have been widely applied in glioma research. However, as this research progresses, the consistency in stably passaging glioma cell lines and the authenticity reflecting the glioma's physiological and pathological features are questioned (17, 18). Compared with cell line tumor models, patient-derived orthotopic xenograft tumor models can more accurately reflect the histological and genetic properties of the original tumors and more realistically simulate the occurrence, progression and drug responses of the original tumor (19). Chi et al. screened third-generation mutation genes related to the malignant progression of IDH-mutant gliomas by comparing gene expression differences in the tumor tissues that could or could not generate a patient-derived xenograft (PDX) model (20). This finding provides new potential for targeted treatment of glioma patients. We found that in high-grade glioma surgical specimens, the microvascular density (MVD) was significantly increased, and microvascular diameters were significantly reduced in tumor tissues that could generate PDX models, suggesting that abundant neovascularization might play an important role in tumor occurrence and progression. Therefore, in this study, we screened neovascularization-relevant genes that were closely associated with early growth and progression in high-grade gliomas by analyzing the gene expression differences in tumor tissues that could or could not successfully establish PDX models. We also investigated whether imaging biomarkers could predict relevant gene expression. Our study provides new targets and novel detection ideas for antiangiogenic treatment against glioma.
Materials and Methods
Clinical Case Collection and Experimental Animals
After obtaining informed consent, this study collected 30 surgical specimens from 30 patients with primary high-grade glioma who underwent surgery at Daping Hospital during 2016.5–2017.10. Each tumor specimen was divided into three portions under sterile conditions. The first portion was used to extract primary tumor cells, which were used to establish orthotopic xenograft models. The second portion was embedded in paraffin to pathologically analyze the tumor vascular, and the third was used for transcriptome sequencing. Research was approved by the Human Research Ethics Committees of Daping Hospital, Army Medical University (Chongqing, China).
All non-obese diabetic-severe-combined immunodeficiency (NOD-SCID) nude mice used in this study were purchased from the Department of Experimental Animals (Daping Hospital, Army Medical University, Chongqing, China). All animal use protocols were performed according to the EU Directive 2010/63/EU for animal experiments and were approved by the Animal Use Subcommittee of Daping Hospital, Army Medical University.
Magnetic Resonance Scanning and Data Processing of Human
MRI scans were performed on a 3.0 Tesla MRI scanner (Magnetom Verio, Siemens Medical Solutions, Erlangen, Germany) with an 16-channel head coil. The conventional MRI included axial and sagittal T1-weighted, T2-weighted, and axial fluid-attenuated inversion recovery (FLAIR) sequences. Sequence parameters were as follows: T1WI, TR/TE = 250/2.67 ms, SL = 5 mm, FOV = 230 × 230 mm; T2WI, TR/TE = 4,900/96 ms, SL = 5 mm, FOV = 230 × 230 mm; FLAIR, TR/TE = 8,000/94 ms, SL = 5 × 230 mm, FOV = 380 × 380 mm. DSC-MR imaging: The spin-echo echo-planar imaging parameters were as follows: TR = 1,500 ms, SL = 4 mm, TE = 30 ms, FOV = 230 × 230 mm, matrix = 128 × 128, FA = 90°, and NEX = 1.0. During 90 consecutive scans, 0.1 mmol/kg gadopentetate was injected through the basilic vein or median cubital vein at 4 mL/s at the 9th phase. DCE-MR imaging: Two sets of T1-weighted images were scanned with the T1-vibe sequence (TR/TE = 5.08/1.74 ms, FOV = 260 × 260 mm, matrix = 138 × 192, slice thickness = 5 mm, flip angle (FA) = 2° and 15°), and then 75 consecutive scans were performed using the T1-twist sequence (TR/TE = 4.82/1.88 ms, matrix = 138 × 192, slice thickness = 3.6 mm, FOV = 260 × 260 mm, FA = 12°) at a time interval of 5.3 s. At the 6th phase, the gadopentetate was injected via the basilic vein or median cubital vein at a rate of 4 ml/s and a dose of 0.1 mmol/kg. DSC-MRI was performed in 18 cases and DCE-MRI in 19 cases, seven of them underwent scanning of both sequences.
A Siemens syngo MR Workstation, and syngoMMWP software (version: VE36A) was used to analyze the DSC-MRI data. A compartment model was selected as the hemodynamic model (21), the arterial input function (AIF) was calculated using the middle cerebral artery, and the time and signal intensity curve of the brain were obtained by AIF. Then, the software calculated CBV and CBF map. The CBV and CBF values of tumor were quantifed as the average voxelwise of those parameters in whole tumor region, then CBV and CBF values of the contralateral healthy brain tissues were measured. The rCBV and rCBF values of the tumor were calculated from the ratio of the tumor area and healthy brain tissue.
DCE-MRI data were imported into a GE workstation, and OmniKinetics (version: 2.0) software was used for the analysis. The relaxivity of gadopentetate was 4.0 s−1mM−1 (r1 = 4.0) in our study, and it was used to control for the effect of tissue characteristics in the process of calculating Ktrans, VP, Ve, and Kep by the software. In order to calculate the T10 value of the voxel of the tumor and normal brain tissue (T10, the T1 value of the voxel before the injection, T10 = 1/R10). Multi flip angle (2° and 15°) scanning were performed before the multi-phase dynamic scanning. The specific calculation method was as follows: the signal value S0 was obtained from the T1 mapping scanning, the TR value of the sequence and the flip angleα was brought in equation S(t) = S0(1–e−[TR/T1(t)]sinα)/(1–e−[TR/T1(t)]cosα), before injection, S(t) = S0, so as to calculate T10, then R10 was calculated and the baseline value of R10 was obtained (22).
An Extend-Tofts model was selected as the hemodynamic model (23). The AIF was calculated by placing an ROI on the middle cerebral artery, and the time and signal intensity curve of brain were obtained from the AIF. According to the dynamic change of the signal intensity of tumor area before and after the injection of the gadopentetate, the software calculated Ktrans, VP, Ve, and Kep map. The Ktrans, VP, Ve, and Kep values of tumor were quantifed as the average voxelwise of those parameters in whole tumor region. All MRI data were measured by two radiologist who were blind to the experimental groupings.
Orthotopic Xenograft Glioma Model Establishment and Glioma Stem-Cell Culturing
Fresh glioma tissue was rinsed with phosphate-buffered saline (PBS), cut into ~1-mm3 pieces, digested in papain (Worthington, USA) at 37°C for ~15 min, filtered through a 200-μm filter, and centrifuged at 300 g for 3 min. After discarding the supernatant, the pellet was resuspended in PBS so that the cell density was ~104 cells/μl. Five microliters of cell suspension was aspirated with a micro-injector, and the needle was vertically inserted at 1.8 mm posterior and 2.2 mm to the right of the intersection between the midline and posterior canthus line of the brain in the NOD-SCID nude mice. The needle was first inserted to ~3.5 mm and withdrawn to 0.5 mm. The cell suspension was slowly injected (at ~1 μl/min), and the needle was withdrawn after ~10 min. The remaining cells were resuspended in Dulbecco's modified Eagle's medium (DMEM)/F-12 (Gibco, Carlsbad, CA, USA) supplemented with N-2 (Gibco), B-27 (Gibco), epidermal growth factor (EGF; 20 ng/ml; Sigma, USA) and basic fibroblast growth factor (bFGF; 20 ng/ml; Peprotech, USA) and cultured in an incubator containing 5% CO2 at 37°C. The orthotopic xenograft models from each patient was established in 5 mice (male, 4–6 weeks), a total of 150 mice were used. Mice were randomly assigned by the staffs of department of experimental animals who were blinded to the experimental design and the animal numbers were chosen by a statistical power calculation. All animals entered into the procedures survived to the end, gave analyzable data, and were actually included in the analyses.
The Monitoring of PDXs in NOD-SCID Mouse
Tumor growth was monitored using a Bruker 7.0T small animal MRI imager, BioSpec 70/20 USR (Bruker, Ettlingen, Germany). The scanning sequence was TurboRARE-T2 WI (TR/TE = 4,000 ms/45 ms, FOV = 25 mm × 25 mm, thickness 0.5 mm). Magnetic resonance scanning was performed every 2 weeks for the first 3 months after the injection of primary tumor cells, and then about once a month. Mice were performed a magnetic resonance scanning and sacrificed when they showed clinical signs that determine the impending death, such as emaciation, weakness or spinal curvature. If no xenograft was observed at the endpoint, it was concluded that PDX was not established.
Transcriptome Sequencing and Screening of Differentially Expressed Genes
Glioma tissue was freshly collected for transcriptome sequencing (Wuhan Seqhealth). The surgical specimens were divided into two groups, a xenograft-forming group and a non-xenograft-forming group, according to whether they formed xenograft in the NOD-SCID nude mouse brains. Differences in mRNA expression between both groups were compared. In detail, RNA was extracted from the glioma tissue using TRIzol reagent (Invitrogen, USA). After removing the rRNA and double-stranded RNA, the RNA was reverse-transcribed into double-stranded cDNA. Polymerase chain reaction (PCR) was performed to amplify and establish the RNA library, which was inspected for quality. After passing the quality inspection, the RNA library was sequenced on an Illumina sequencer. To analyze the differentially expressed genes, gene expression levels were determined by reads per kilobase per million reads (RPKM) and subjected to sample biological repeat correlation testing. Differentially expressed angiogenesis-related genes were screened between the xenograft-forming and non-xenograft-forming groups (fold change >2, P < 0.05).
Immunohistochemical Staining and Blood Vessel Quantification
Immunohistochemical staining were performed as described previously (24). The antibodies used was raised in rabbits against human CD34 (Abeam, Cambridge, UK). Two-micron-thick serial sections were used for immunohistochemical staining after dewaxing in xylene. Antigen retrieval was performed in a boiling EDTA solution (pH 9.0) for 2.5 min, and then slices were washed with PBS after natural cooling. H2O2 (10%) and goat serum were used to block endogenous peroxidase activity and non-specific antigens, respectively. Each slice was incubated overnight with solution containing the primary antibody at 4°C. Specimens were then washed with PBS and incubated with HRP-conjugated goat anti-rabbit secondary antibodies at 37°C for 30 min. DAB was used to visualize antigens.
Five fields were randomly selected under 100× light microscopy. The number, diameters and areas of the CD34-positive lumens were measured, and the average values were used as the tumor microvascular density, diameter, and area for each case. All pathological data for the tissues were measured by two highly experienced staff members who were blind to the experimental groupings.
Paraffin-embedded xenograft were subjected to hematoxylin and eosin (HE) and immunohistochemical staining. The antibodies used was raised in rabbits against human CD34, GFAP, BMPER (bone morphogenetic protein endothelial cell precursor–derived regulator), CXCL10 (chemokine ligand-10), and HOXA9 (homeobox A9) (Abeam, Cambridge, UK).
Immunofluorescence Staining of Glioma Stem Cell Spheres
We successfully cultured two cases with glioma stem cell spheres from the glioma surgical specimens: DP3321 and DP7857. The glioma stem cell spheres were cultured in suspension and plated onto poly-L-lysine (PLL)-coated 96-well plates. After removing the medium, the stem cell spheres were fixed in 4% paraformaldehyde for 20 min, permeabilized in 0.3% Triton X-100 for 10 min, blocked in 5% bovine serum albumin for 1 h, and incubated in corresponding primary antibody at 4°C overnight. After washing with PBS, the samples were incubated in the dark at room temperature for 2 h and then incubated in 4′, 6-diamidino-2-phenylindole (DAPI) for 5 min. After washing with PBS, the samples were observed under fluorescence microscopy. CD133, Nestin, Sox2, and GFAP antibodies (Abcam, Cambridge, UK) were used for immunofluorescence staining.
In vitro siRNA Inhibition Experiment
Glioma stem cell spheres were digested with 0.05% trypsin to single-cell suspensions, and 3 × 10⁵ cells were plated into each well in 6-well plates containing 2 ml of culture medium. Cells were cultured in an incubator containing 5% CO2 at 37°C for 12 h. Intracellular BMPER, CXCL10, and HOXA9 expression was suppressed with siRNA (Ribobio, Guangdong, China), respectively. The siRNA target sequence for BMPER was GGAGAGATGTGGTCCTCTA, for CXCL10 was GTCCACGTGTTGAGATCAT and for HOXA9 was TCCTCCAGTTGATAGAGAA. Cells were divided into five groups: siBMPER, siCXCL10, siHOXA9, negative control (NC), and blank control (BC). Five microliters of 20 μM siRNA (Ribobio) stock solution was diluted with 120 μl of 1× riboFECT™ CP Buffer (Ribobio) and mixed gently. Next, 12 μl of riboFECT™ CP Reagent (Ribobio) was added to the diluted siRNA solution, mixed gently by pipetting, incubated for 0–15 min at room temperature and added to the already prepared 6-well plates. After mixing, cells were cultured in the incubator. After 48 h, part of the cells were used for real-time quantitative PCR (qRT-PCR) and western blots to determine the effects of siRNA inhibition. The remaining cells were used to determine their tube formation capacity.
RNA Isolation and qRT-PCR
Total RNA was extracted using TRIzol reagent (Invitrogen, USA). A Nanodrop 2000 spectrometer was used to determine RNA concentration. One microgram total RNA was used to synthesize cDNA with a Transcriptor First Strand cDNA Synthesis Kit (Roche, Switzerland) after the removal of residual DNA with a TURBO DNA-free Kit (Thermo, USA). Subsequently, qRT-PCR was performed using FastStart Essential DNA Green Master Mix (Roche, Switzerland) and the LightCycler 96 System (Roche, Switzerland). The expression level of genes was analyzed and normalized to GAPDH. The fold change in gene expression was evaluated using the 2−ΔΔCT method. The sequences of the PCR primer pairs are as follows: BMPER, forward 5′- AAGAGTGCCTCCTACGAGTG-3′ and reverse 5′-CTGCCTTTCACACAAGCACA-3′; CXCL10, forward 5′-GTGGCATTCAAGGAGTACCTC-3′ and reverse 5′- TGATGGCCTTCGATTCTGGATT-3′; HOXA9, forward 5′-ACTTTGTCCCTGACTGACTATG-3′ and reverse 5′- AGGGTCTGGTGTTTTGTATAGG-3′; GAPDH, forward 5′-CTCCTCCACCTTTGACGC-3′ and reverse 5′- CCACCACCCTGTTGCTGT-3′.
Western Blot Analysis
Protein extraction and western blots were performed as described previously (25). Cells were washed with cold PBS and lysed with RIPA buffer. Samples were quantifed using a protein assay (Micro BCA; Termo Fisher Scientific) and subjected to SDS/PAGE. Then the same amount of protein was transferred to polyvinylidene difluoride membranes and probed overnight at 4°C with antibodies for BMPER, CXCL10, HOXA9, and GAPDH (Abcam), respectively. After incubation with horseradish peroxidase-conjugated secondary antibodies, blots were visualized with an enhanced chemiluminescence detection kit (Roche Diagnostics, Basel, Switzerland).
Tube Formation Assay
Matrigel (Corning, Bedford, USA) was thawed, and tips and 96-well plates were precooled at 4°C. The Matrigel was diluted with PBS at a 1:1 ratio and added to precooled 96-well plates at 55 μl per well. The plates were incubated in an incubator containing 5% CO2 at 37°C for 1 h. Glioma cell spheres transfected with siRNA were digested with 0.05% trypsin and resuspended in DMEM supplemented with 10% fetal bovine serum. Cells were added to Matrigel-coated 96-well plates at 5 × 10⁴ cells per well and cultured in an incubator containing 5% CO2 at 37°C for 6 h. Five fields were randomly selected under 100× light microscopy, and blood vessel-like structures were counted. The average number was used as the number of blood vessels in the cells. The blood vessel-like structures were counted by two experienced staff members who were blinded to the experimental groupings.
Monitoring the Blood Vessel-Related Gene Expression in PDXs
The in situ tumor model was established using DP3321. Tumor growth was monitored using a Bruker 7.0T small animal MRI imager, Biospin 70/20 (Bruker, Ettlingen, Germany). The scanning sequence was TurboRARE-T2 WI sagittal view (TR/TE = 4,000 ms/45 ms, FOV = 25 mm × 25 mm, thickness 0.5 mm). Tumor growth curves were calculated from the largest cross-section of the tumor in the sagittal view. Xenograft specimens were collected at the early stages (20, 30, and 40 days) and late stage (80 days) of tumor growth and were stained for GFAP, CD34, BMPER, CXCL10, and HOXA9 to determine the relationships between BMPER, CXCL10, and HOXA9 expression at different tumor stages and tumor neovascularization.
Statistical Analysis
SPSS 19.0 (IBM, Armonk, NY, USA) was used for the statistical analysis, and data are represented as the means ± SD. The data with normal distribution (Shapiro-Wilk test) and homogeneity of variance (F-test) were tested by two sample t-test, otherwise by wilcoxon rank sum test. The diagnostic threshold (cutoff value) was acquired from a receiver operating characteristic (ROC) curve to assess differential neovascularization-related gene expression in the tumors. Image features and pathological results reproducibility were assessed using the intraclass correlation coefficient (ICC). A value of P < 0.05 was considered significant and P-values were adjusted for multiple comparisons by Bonferroni-adjusted.
Results
Establishment of Patient-Derived Orthotopic Xenograft Glioma Models
Surgical specimens from 30 patients with primary high-grade gliomas were collected (14 cases of WHO grade III gliomas and 16 cases of WHO grade IV glioblastomas). Orthotopic xenograft glioma models were successfully established from 9 cases. Totally, the PDX was established in 45 mice (9 × 5 = 45) and the PDX was not established in 105 mice (21 × 5 = 105) (1 case of WHO grade III glioma and 8 cases of WHO grade IV glioblastoma) (Figure 1).
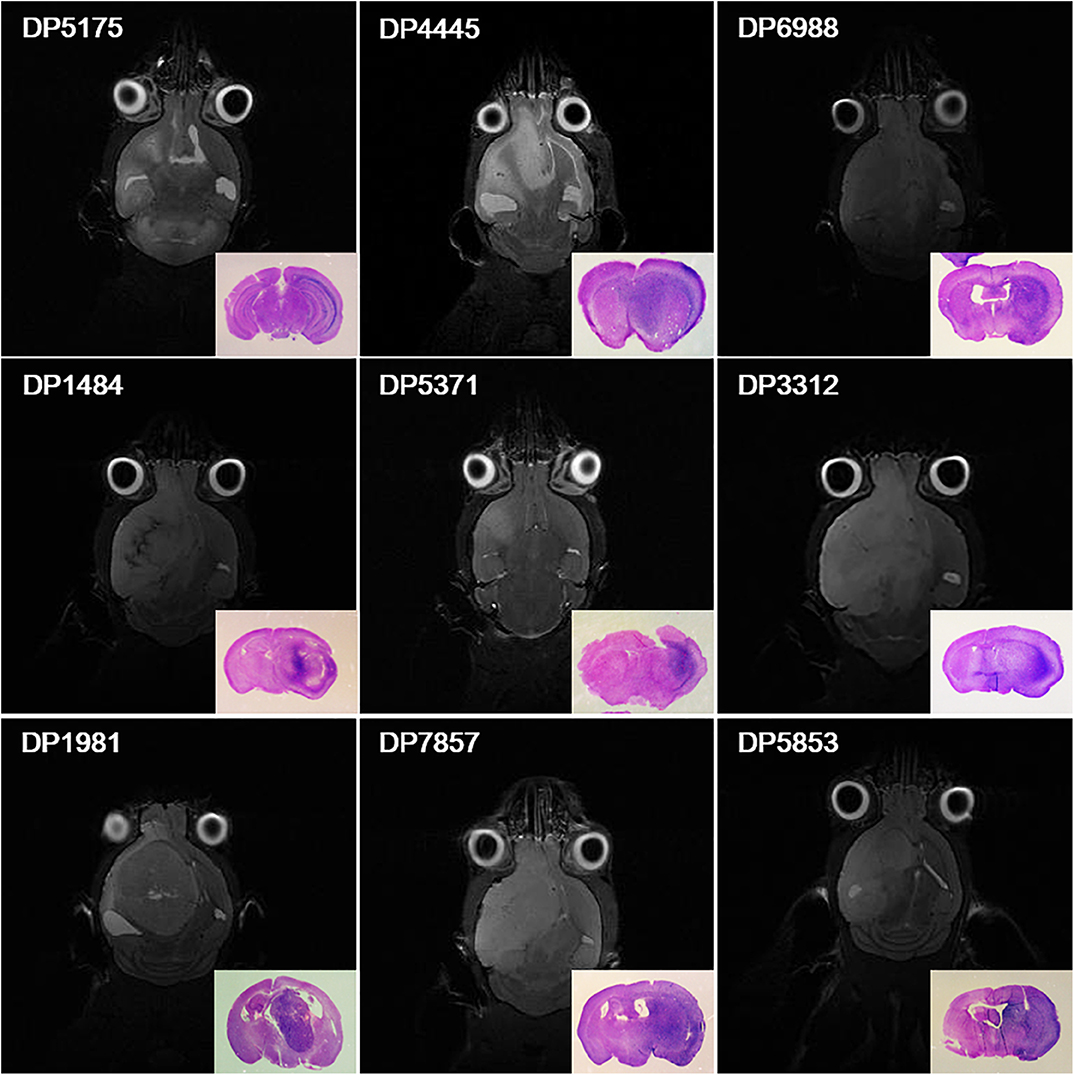
Figure 1. Orthotopic xenograft glioma models were established for 9 cases. Magnetic resonance cerebral coronal T2-weighted imaging and HE staining of the corresponding axial sections of the brain tissues (bottom right corner) showed that primary glioma cells from 9 cases formed xenografts in NOD-SCID nude mice.
Relationship Between the Microvascular Status of the Glioma Surgical Specimens and the Ability to Form Orthotopic Xenograft Glioma Models
The ability of glioma surgical specimens to form xenografts was associated with microvascular density and diameter in the tumor tissue. Tumor tissues that could form xenografts had a higher microvascular density (P = 0.003) and a smaller mean microvascular diameter (P = 0.019), however, no association was found between the ability of glioma surgical specimens to form xenografts and microvascular area (95% CI: −735.960–7533.477) (Figure 2; Table 1). The reproducibility of the histopathological results were assessed using the intraclass correlation coefficient (ICC = 0.924).
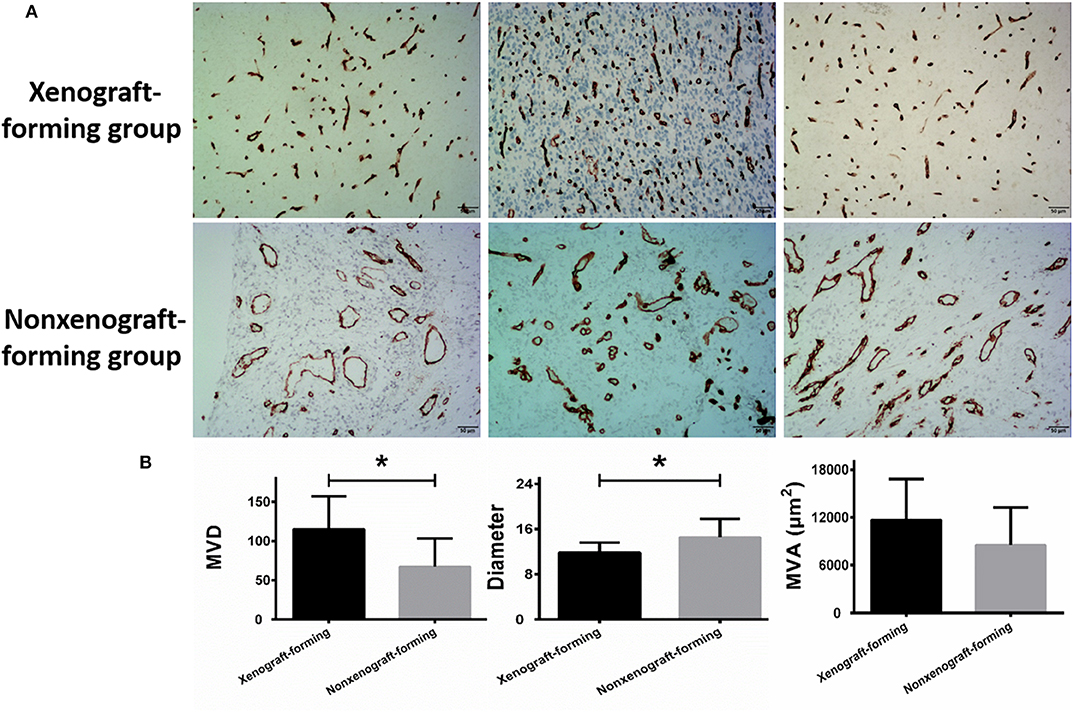
Figure 2. Microvascular analysis of glioma surgical specimens. (A) CD34 immunohistochemical staining, the upper row represents CD34 staining of 3 surgical specimens in the xenograft-forming group, and the lower row represents CD34 staining of 3 surgical specimens in non-xenograft-forming group. (B) Microvascular analysis of 9 surgical specimens in xenograft-forming group and 21 surgical specimens in non-xenograft-forming group. Compared with the non-xenograft-forming group, the microvessels from the tumor surgical specimens of the xenograft-forming group had higher microvessel density (MVD) and smaller diameters. The microvascular area (MVA) did not differ significantly between the two groups. Data are presented as the mean±SD. *P < 0.05.
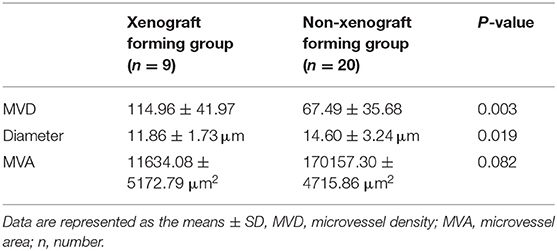
Table 1. Histopathological analysis of the glioma surgical specimens.
Differential Expression Analysis of Neovascularization-Related Genes in Surgical Specimens Between the Xenograft-Forming and Non-xenograft-Forming Groups
In the two glioma surgical specimen groups, the expression levels of BMPER, CXCL10 and HOXA9 in the surgical specimens that could form xenografts were significantly higher than those in the surgical specimens that could not form xenografts. However, no significant differences were detected in the expression of genes that promote tumor angiogenesis (VEGF, PDGF, SDF1, and HIF1) (Table 2). We used immunohistochemical staining to evaluate the activation of VEGF. VEGF was positively expressed in tumor vascular hotspots in both groups, but there was no significant difference in the area of the VEGF positive region between the two groups (Supplementary Material 1).
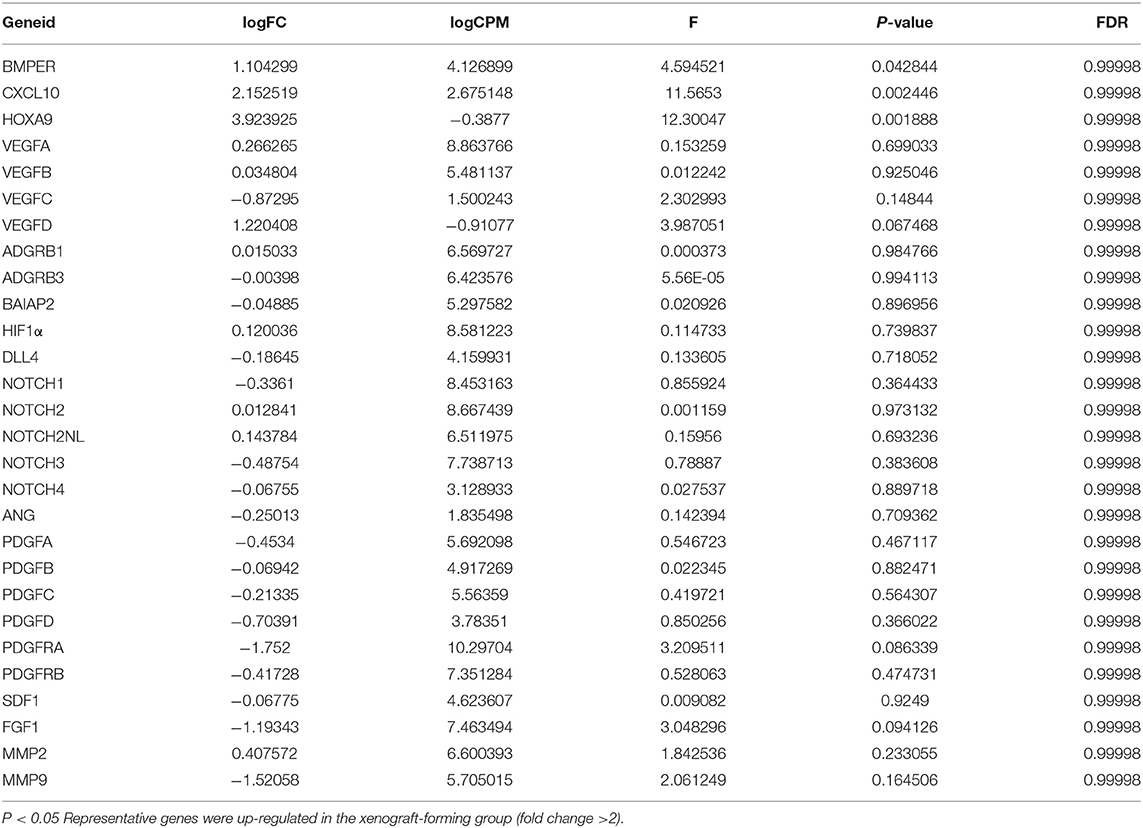
Table 2. Differential expression analysis of neovascularization-related genes in surgical specimens between the xenograft-forming and non-xenograft-forming groups.
In vitro Inhibition of BMPER, CXCL10, or HOXA9 Expression Reduced the Angiogenic Capacity of Tumor Cells
Immunofluorescence staining of the 2 cases of primary tumor stem cell spheres (DP3321 and DP7857) showed that the glioma tumor cell marker GFAP and the glioma tumor stem cell markers CD133, Nestin, and Sox2 were all positive (Figure 3), confirming that the extracted primary cells were stem cells originating from gliomas. We inhibited the expression of BMPER, CXCL10, and HOXA9 using siRNA in the 2 cases of glioma stem cell spheres. The inhibition efficiencies were detected by WB and qRT-PCR (Figure 4). Compared with the black control group, the siBMPER, siCXCL10, and siHOXA9 expression levels in DP3321 were 46.32, 49.71, and 43.64%, respectively, and the siBMPER, siCXCL10, and siHOXA9 expression levels in DP7857 were 53.21, 47.46, and 46.31%, respectively. After inhibition, the tube formation capacities of DP3321 and DP7857 were significantly reduced (Figure 5; Table 3). Consistency in the measurement results was determined using the intraclass correlation coefficient (ICC) test, with ICC = 0.963.
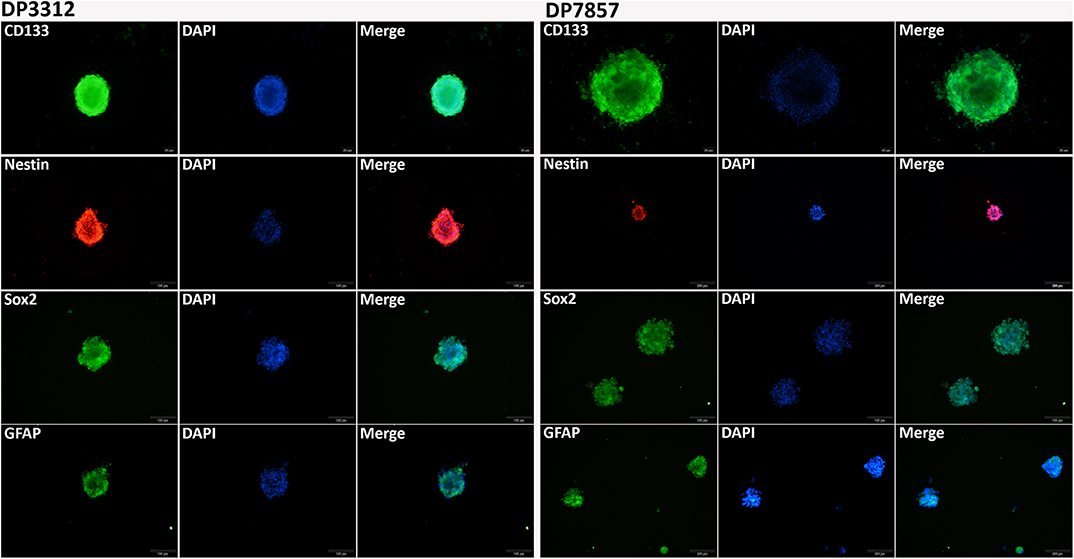
Figure 3. Immunofluorescence staining of the glioma stem cell spheres. Immunofluorescence staining of DP3321 (left) and DP7857 (right), from two glioblastoma cases, showed that the stem cell markers CD133, Nestin, and Sox2 and the astrocyte marker GFAP were all positive.
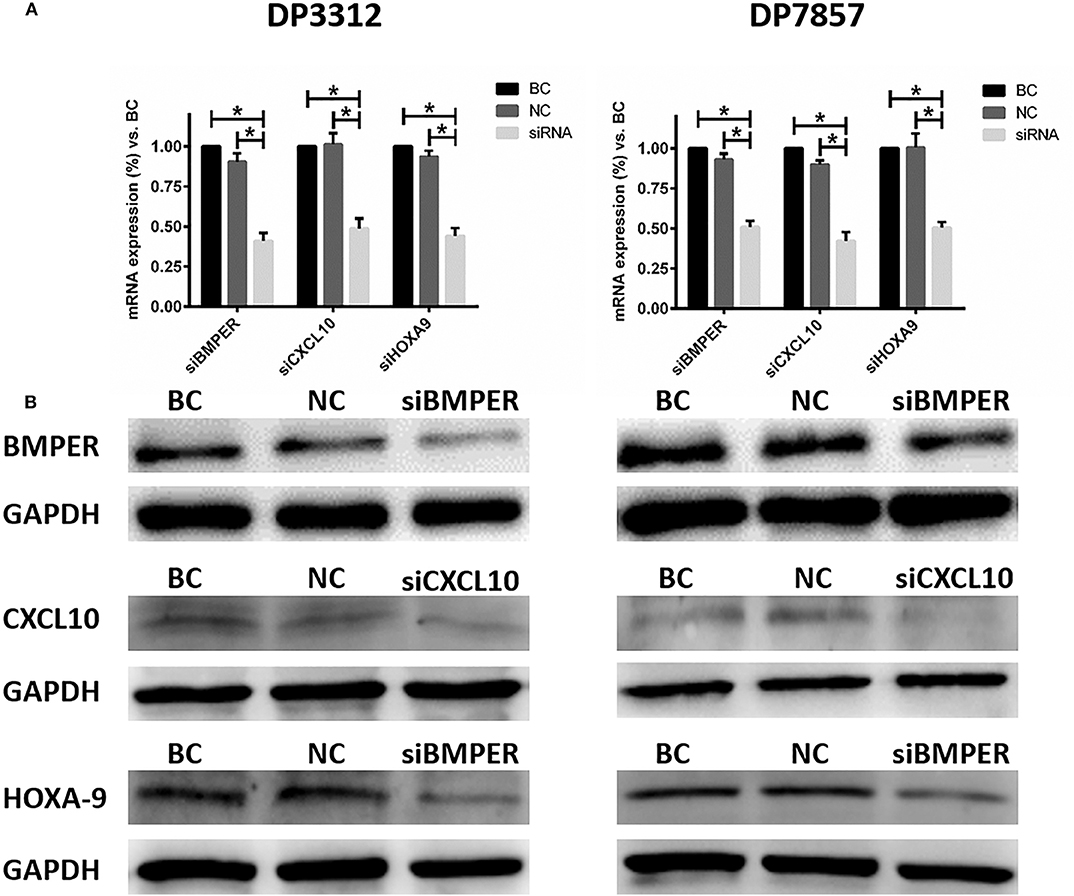
Figure 4. Suppressing BMPER, CXCL10, and HOXA9 expression in the glioma stem cell spheres from cases DP3312 (left) and DP7857 (right) by siRNA. (A) Examination (qRT-PCR) of the mRNA expression of corresponding genes after suppression by siRNA. BC, blank control; NC, negative control. Data are presented as the mean ± SD. *P < 0.05. (B) Examination (western blot) of corresponding protein expression after suppression by siRNA.
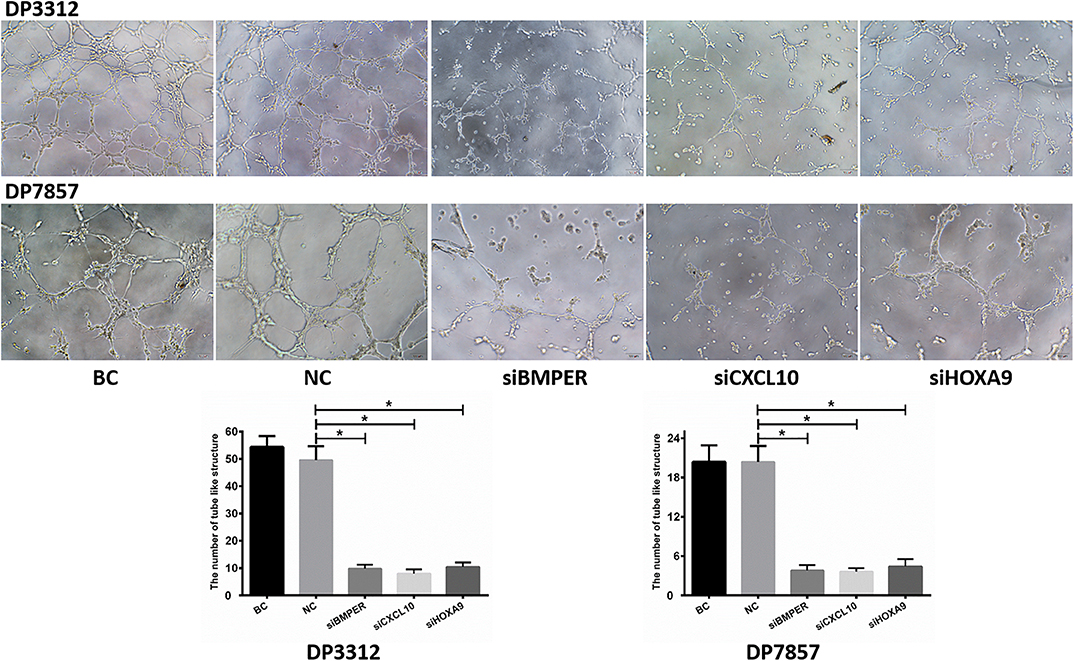
Figure 5. In vitro tube formation assay. Suppressing BMPER, CXCL10, and HOXA9 expression in the glioma stem cell spheres from cases DP3312 and DP7875 by siRNA significantly reduced the tumor cells' in vitro tube formation ability. BC, blank control; NC, negative control. Data are presented as the mean ± SD. *P < 0.05.
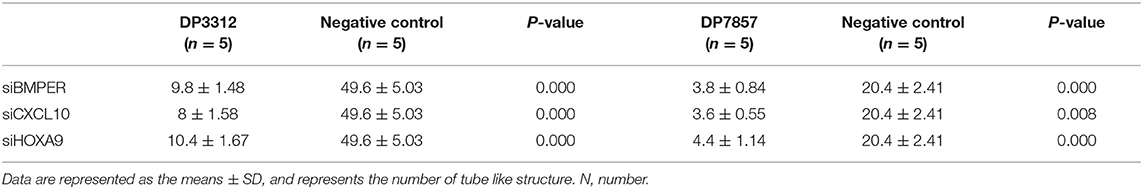
Table 3. In vitro inhibition of BMPER, CXCL10, or HOXA9 expression reduced the ability of tumor cells to form tube like structure.
Expression of BMPER, CXCL10, and HOXA9 in the Orthotopic Xenograft Glioma Models
We used DP3321 to establish orthotopic xenograft models in NOD-SCID nude mice. The first day after model establishment was used as the first day of tumor growth to calculate the tumor growth curve (Figure 6A). The relationships between BMPER, CXCL10, and HOXA9 expression and the tumor blood vessels were determined in the early- (20, 30, and 40 days) and late-tumor growth stages (80 days) (Figures 6B,C). On day 20 of tumor growth, BMPER was highly expressed, while CXCL10, HOXA9 and the tumor blood vessel marker CD34 were lowly expressed. On day 30, BMPER was highly expressed, CXCL10 and HOXA9 were lowly expressed, and CD34 was elevated. On day 40, BMPER expression was reduced, while CXCL10 and HOXA9 expression was elevated, which was spatially correlated with CD34 expression. In the late-tumor growth stage, BMPER, CXCL10, and HOXA9 were all lowly expressed, while CD34 was highly expressed.
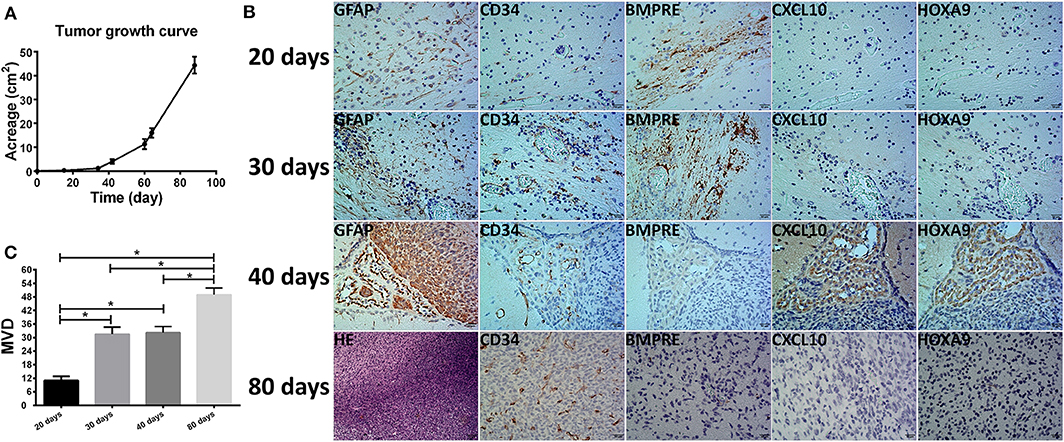
Figure 6. Relationship between the tumor microvessels in the orthotopic xenograft glioma models and BMPER, CXCL10, and HOXA9 expression. (A) Tumor growth curve of primary glioma stem cell sphere DP3312 after in situ xenografting in NOD-SCID nude mice. (B) Tumor microvessels during different xenograft growth stages and their relationships with BMPER, CXCL10, and HOXA9 expression. On day 20 of tumor growth, BMPER was highly expressed, while CXCL10, HOXA9 and tumor vascular marker CD34 were poorly expressed. On day 30, BMPER was highly expressed, CXCL10 and HOXA9 were poorly expressed, and CD34 expression was elevated. On day 40, BMPER expression was reduced, and CCXL10 and HOXA9 expression was elevated, indicating a spatial association with CD34 expression. In the tumor end stage, BMPER, CXCL10, and HOXA9 were all poorly expressed, while CD34 was highly expressed. (C) Microvascular densities of the xenograft at different growth stages (days 20, 30, 40, and 80). The value of P < 0.008 was considered significant after Bonferroni-adjusted. *P < 0.05.
Relationship Between Perfusion MRI Derived Parameters of Patients and the Ability to Form Orthotopic Xenograft Glioma Models
We analyzed the perfusion MRI derived parameters in the 30 cases and measured the DSC-MRI derived parameters rCBV, rCBF, and the DCE-MRI derived parameters Ktrans, Vp, Ve, and Kep in each tumor case. Consistency in the measurement results was determined using the intraclass correlation coefficient (ICC) test, with ICC = 0.874. Our results showed that the DSC-MRI parameter rCBV, rCBF, and the DCE-MRI parameters Ktrans and Vp of cases that could form xenografts were significantly higher than those of cases that could not form xenografts (P = 0.014, P = 0.018, P = 0.001, P = 0.003, respectively) (Table 4). A ROC curve was used to further analyze the diagnostic efficacy of tumor rCBV, rCBF, Ktrans, and Vp in determining whether the tumor tissues could form xenografts. The optimal diagnostic threshold of rCBV in determining whether the tumor tissues could form xenografts was 1.481, the area under the curve was 0.861, and the sensitivity and specificity were 100.00 and 75.00%, respectively. The optimal diagnostic threshold of rCBF in determining whether the tumor tissues could form xenografts was 1.289, the area under the curve was 0.847, and the sensitivity and specificity were 100.00 and 75.00%, respectively. The optimal diagnostic threshold of Ktrans in determining whether the tumor tissues could form xenografts was 0.209, the area under the curve was 0.957, and the sensitivity and specificity were 100.00 and 92.86%, respectively. The optimal diagnostic threshold of Vp in determining whether the tumor tissues could form xenografts was 0.139, the area under the curve was 0.871, and the sensitivity and specificity were 80.00 and 85.71%, respectively (Figure 7). Transcriptome sequencing results confirmed that the expression levels of BMPER, CXCL10, and HOXA9 in the cases that could form orthotopic xenograft glioma models were significantly higher than those in the cases that could not form xenografts (Table 2). Therefore, the perfusion MRI scanning parameters rCBV, Ktrans, and Vp can be used as imaging biomarkers to predict BMPER, CXCL10, and HOXA9 expression and further guide treatment.
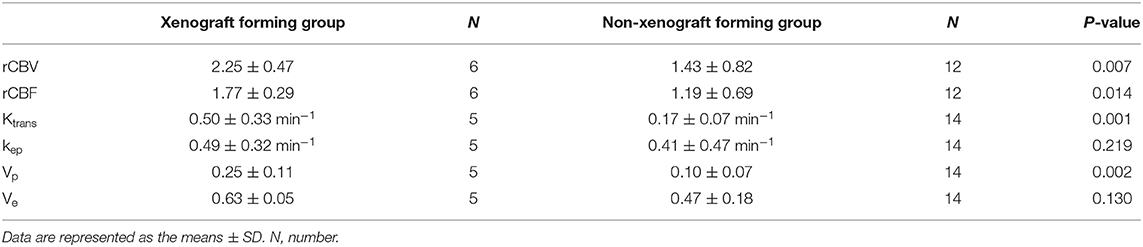
Table 4. The differences of perfusion MRI derived parameters between xenograft forming group and non-xenograft forming group in human.
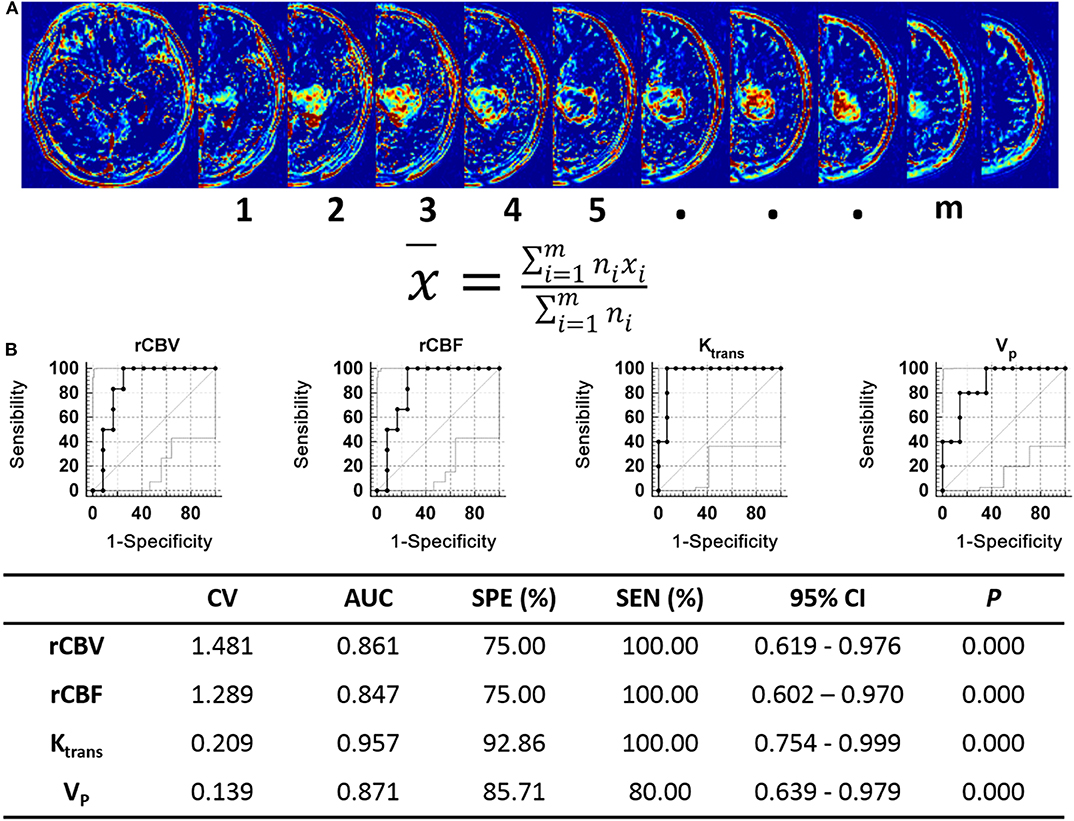
Figure 7. Analysis of perfusion MRI-derived parameters in human. (A) The Ktrans, VP, Ve, Kep, rCBV, and rCBF values of tumor were quantifed as the average voxelwise of those parameters in whole tumor region. The tumor areas of each slices were selected as the ROIs, x represents the values of Ktrans, VP, Ve, Kep rCBV, or rCBF of each ROI, n represents the number of voxel included in ROIs, m represents the number of ROIs. (B) ROC curve analysis of the perfusion MRI scanning parameters with significant differences between the xenograft-forming group and the non-xenograft-forming group.
Discussion
Abundant neovascularization is an important feature in high-grade gliomas. The newly generated tumor blood vessels have incomplete structure and function (26), leading to the specialized tumor microenvironment characterized by hypoxia, low PH and high interstitial pressure, which is closely related to the glioma's immunologic escape and treatment resistance (27). However, although anti-angiogenic treatments targeting multiple proangiogenic factors have achieved some effects, the preset goals remain unmet. This is mainly because glioma neovascularization is a complicated pathological process regulated by multiple factors and pathways whose expression levels are temporally and spatially specific (4). Early glioma diagnosis and treatment can significantly improve patients' prognoses (28). Therefore, investigating neovascularization-related molecules during the early growth phase of glioma has important significance for antiangiogenic glioma treatment.
In this study, we collected surgical specimens from 30 cases of high-grade gliomas and extracted primary tumor cells, which were then injected into the brains of nude mice to simulate the early growing process of activated tumor cells in the brain. Our results showed that orthotopic xenograft glioma models were successfully established from surgical specimens from 9 cases. Pathological analysis of the blood vessels from the surgical specimens of these 30 cases showed that the specimens that formed xenografts had more active neovascularization, their microvascular density was significantly increased, and their microvascular diameters were significantly reduced. These results indicate that neovascularization plays an important role in the early growing process of high-grade gliomas.
Previous studies have confirmed that glioma tumor stem cells are similar to normal neural stem cells and have the potential of self-renewal and multidirectional differentiation (29). They can transdifferentiate into endothelial cells and release multiple cytokines and chemokines to promote angiogenesis (30, 31). In glioblastomas, up to 60% of endothelial cells have the same genetic mutations as tumor cells, suggesting that many tumor blood vessels originate from tumor cells (32). Some studies reported that tumor cell transdifferentiation to endothelial cells is induced by VEGF and VEGF receptor 2 (VEGFR2) (33). However, some studies have also reported VEGF-independent transdifferentiation (10), which is one reason why anti-VEGF signaling-pathway drugs cannot extend glioma patient survival. In return, endothelial cells and tumor vasculature also play an important role in the self-renewal and tumorigenesis of cancer stem cells (34). Through transcriptome sequencing analysis of glioma surgical specimens, this study found that genes that promote tumor angiogenesis, such as VEGF, PDGF, FGF, and HIF1α, were not differentially expressed between the two tumor specimen groups, but the BMPER, CXCL10, and HOXA9 expression levels in the surgical specimens that could form orthotopic xenografts were significantly higher than those in the specimens that could not form orthotopic xenografts. In the in vitro experiments, we found that primary glioma stem cell spheres (DP3321 and DP7857) had extremely high tube formation capacities and that inhibiting BMPER, CXCL10, or HOXA9 expression significantly reduced the angiogenic capacities of the tumor cells, indicating that these three genes can promote tumor-derived neovascularization in primary high-grade gliomas obviously.
Previous studies showed that BMPER, CXCL10, and HOXA9 promote tumor angiogenesis and tumorigenesis in lung cancer, colon cancer, basal cell carcinoma, ovarian cancer, and liver tumor (35–38). Other studies also showed that CXCL10 and HOXA9 expression levels were elevated in some glioma tissues (39, 40). In our study, tumor growth curves of xenografts were analyzed to confirm that in the early stages of tumorigenesis, BMPER was highly expressed, while CXCL10, HOXA9, and CD34 were lowly expressed. Later, BMPER was continuously highly expressed, which significantly increased CD34-positive blood vessels in tumor regions. Along with further tumor progression, BMPER expression was gradually reduced, while CXCL10 and HOXA9 expression was gradually elevated, which was spatially associated with CD34 expression. These results indicate that in the early-growth stage of primary high-grade glioma, BMPER promotes tumor growth by promoting tumor angiogenesis, and, along with further tumor progression, CXCL10 and HOXA9 expression levels are gradually increased, thus playing a role in promoting tumor growth by promoting tumor angiogenesis. Therefore, BMPER, CXCL10, and HOXA9 can be used as novel targets for antiangiogenic treatment of primary high-grade gliomas.
Accurately detecting target gene expression levels is the key to individualized and targeted tumor treatments. However, gene sequencing is invasive, time-consuming and costly; thus, popularizing it in clinical practice is difficult. Therefore, accurate, reliable, convenient and non-invasive biomarkers must be determined to reflect target gene expression. Previous studies have confirmed that both DSC-MRI and DCE-MRI can non-invasively reflect the blood flow and structural and functional vascular changes in the tumor region (41), and correlate with the molecular characteristics and genetic phenotypes of tumors (42). In this study, we found that the DSC-MRI parameter rCBV, rCBF, and the DCE-MRI parameters Ktrans and Vp in cases that could form orthotopic xenograft glioma models were significantly higher than those in cases that could not form orthotopic xenograft glioma models. Increases in both rCBV, rCBF, and Vp indicated increased blood flow volume and increased Ktrans indicated increased vascular permeability in the tumor regions in cases that formed xenografts. The newly generated tumor blood vessels have high permeability due to their incomplete structure. Therefore, increased Ktrans also indirectly reflected abundant neovascularization in the tumor region. The differences in the above perfusion MRI derived parameters between the xenograft-forming and non-xenograft-forming groups were consistent with the vascular tissue pathological analysis, confirming the accuracy of the MRI scanning. Some of the values of Ve and Vp were physiologically implausible in our study, it was more likely that the assumption of Extended-Tofts model as a well-mixed compartment was not valid, especially in tumor tissue, suggesting that the Extended-Tofts model may not be completely valid in this setting and more applicable pharmacokinetic models should be studied. ROC curve analysis indicated that the scanning parameters rCBV, rCBF, Ktrans, and Vp of the DSC-MRI and DCE-MRI can be used as imaging markers to predict the expression statuses of BMPER, CXCL10, and HOXA9 in tumor tissue, which can guide the antiangiogenic treatment of primary high-grade gliomas.
We followed 30 patients with primary high-grade glioma. Four were lost to follow-up, and 1 died of other causes. Among the remaining 25 patients, the ability of the tumor tissue to form an orthotopic xenograft glioma model was not significantly associated with the patients' prognoses. This outcome may be due to the different postoperative therapeutic strategies among patients. Among the patients we followed, few underwent routine radiotherapy or chemotherapy after surgery. Most underwent no standard treatments, and a few received no treatment after surgery. Therefore, clinical studies with larger sample sizes are required to determine the association between patients' prognoses and the BMPER, CXCL10, and HOXA9 expression statuses, which was a limitation of this study. Further study about the mechanisms by which these three genes regulate neovascularization, and their relationship with VEGF or other neovascularization related pathways will be the next step of our research. Additionally, changes in tumor growth and progression after inhibiting BMPER, CXCL10, and HOXA9 expression in the xenografts should also be studied.
In summary, in primary high-grade gliomas, BMPER, CXCL10, and HOXA9 expression can promote early-phase tumor growth and further progression by increasing tumor neovascularization. Of these, BMPER mainly played a role in the early-growth phase of tumors, while CXCL10 and HOXA9 mainly played roles in tumor progression. These findings provide novel targets for antiangiogenic glioma treatment. We also found that the DSC-MRI and DCR-MRI scanning parameters rCBV, rCBF, Vp, and Ktrans could be used as imaging biomarkers to non-invasively predict BMPER, CXCL10, and HOXA9 expression in tumor tissue, which provides an effective means of diagnosing, treating, and monitoring primary high-grade glioma.
Data Availability Statement
The original contributions presented in the study are publicly available. This data can be found here: the NCBI Gene Expression Omnibus (GSE148292).
Ethics Statement
The studies involving human participants were reviewed and approved by Ethics Committees of Daping Hospital, Army Medical University. The patients/participants provided their written informed consent to participate in this study. The animal study was reviewed and approved by Ethics Committees of Daping Hospital, Army Medical University.
Author Contributions
WZ and XC conceived and designed the experiments. WX and JZ performed the experiments and wrote the first draft of the manuscript. BZ, YY, and HL performed clinical case collection. XD and YG performed the MRI scanning. JF and SW performed MRI data post-processing and analysis. PW and KX performed surgical samples collection. PZ and HW performed histopathological analysis. HT and TX performed transcriptome sequencing.
Funding
This work was supported by the National Natural Science Foundation of China (Grant Nos. 81571660 and 81871421). Clinical Scientific Foundation of Institute of Surgery Research, Daping Hospital, Third Military Medical University (2014YLC03).
Conflict of Interest
The authors declare that the research was conducted in the absence of any commercial or financial relationships that could be construed as a potential conflict of interest.
Supplementary Material
The Supplementary Material for this article can be found online at: https://www.frontiersin.org/articles/10.3389/fonc.2020.00711/full#supplementary-material
References
1. Gusyatiner O, Hegi ME. Glioma epigenetics: from subclassification to novel treatment options. Semin Cancer Biol. (2018) 51:50–8. doi: 10.1016/j.semcancer.2017.11.010
2. Ostrom QT, Bauchet L, Davis FG, Deltour I, Fisher JL, Langer CE, et al. The epidemiology of glioma in adults: a “state of the science” review. Neuro Oncol. (2014) 16:896–913. doi: 10.1093/neuonc/nou087
3. Cuddapah VA, Robel S, Watkins S, Sontheimer H. A neurocentric perspective on glioma invasion. Nat Rev Neurosci. (2014) 15:455–65. doi: 10.1038/nrn3765
4. Jhaveri N, Chen TC, Hofman FM. Tumor vasculature and glioma stem cells: contributions to glioma progression. Cancer Lett. (2016) 380:545–51. doi: 10.1016/j.canlet.2014.12.028
5. Hardee ME, Zagzag D. Mechanisms of glioma-associated neovascularization. Am J Pathol. (2012) 181:1126–41. doi: 10.1016/j.ajpath.2012.06.030
6. Saxena S, Jha S. Role of NOD- like receptors in glioma angiogenesis: insights into future therapeutic interventions. Cytokine Growth Factor Rev. (2017) 34:15–26. doi: 10.1016/j.cytogfr.2017.02.001
7. Guo XB, Deng X, Wei Y. Hematopoietic substrate-1-associated protein X-1 regulates the proliferation and apoptosis of endothelial progenitor cells through Akt pathway modulation. Stem Cells. (2018) 36:406–19. doi: 10.1002/stem.2741
8. Chinot OL, Wick W, Mason W, Henriksson R, Saran F, Nishikawa R, et al. Bevacizumab plus radiotherapy-temozolomide for newly diagnosed glioblastoma. N Engl J Med. (2014) 370:709–22. doi: 10.1056/NEJMoa1308345
9. Gilbert MR, Dignam JJ, Armstrong TS, Wefel JS, Blumenthal DT, Vogelbaum MA, et al. A randomized trial of bevacizumab for newly diagnosed glioblastoma. N Engl J Med. (2014) 370:699–708. doi: 10.1056/NEJMoa1308573
10. Soda Y, Marumoto T, Friedmann-Morvinski D, Soda M, Liu F, Michiue H, et al. Transdifferentiation of glioblastoma cells into vascular endothelial cells. Proc Natl Acad Sci USA. (2011) 108:4274–80. doi: 10.1073/pnas.1016030108
11. Brighi C, Puttick S, Rose S, Whittaker AK. The potential for remodelling the tumour vasculature in glioblastoma. Adv Drug Deliv Rev. (2018) 136–7:49–61. doi: 10.1016/j.addr.2018.10.001
12. Sung YS, Park B, Choi Y, Lim HS, Woo DC, Kim KW, et al. Dynamic contrast-enhanced MRI for oncology drug development. J Magn Reson Imaging. (2016) 44:251–64. doi: 10.1002/jmri.25173
13. Kong Z, Yan C, Zhu R, Wang J, Wang Y, Wang Y, et al. Imaging biomarkers guided anti-angiogenic therapy for malignant gliomas. Neuroimage Clin. (2018) 20:51–60. doi: 10.1016/j.nicl.2018.07.001
14. Ahn SS, Shin NY, Chang JH, Kim SH, Kim EH, Kim DW, et al. Prediction of methylguanine methyltransferase promoter methylation in glioblastoma using dynamic contrast-enhanced magnetic resonance and diffusion tensor imaging. J Neurosurg. (2014) 121:367–73. doi: 10.3171/2014.5.JNS132279
15. Tan W, Xiong J, Huang W, Wu J, Zhan S, Geng D. Noninvasively detecting Isocitrate dehydrogenase 1 gene status in astrocytoma by dynamic susceptibility contrast MRI. J Magn Reson Imaging. (2017) 45:492–9. doi: 10.1002/jmri.25358
16. Jamshidi N, Diehn M, Bredel M, Kuo MD. Illuminating radiogenomic characteristics of glioblastoma multiforme through integration of MR imaging, messenger RNA expression, and DNA copy number variation. Radiology. (2014) 270:1–2. doi: 10.1148/radiol.13130078
17. Voskoglou-Nomikos T, Pater JL, Seymour L. Clinical predictive value of the in vitro cell line, human xenograft, and mouse allograft preclinical cancer models. Clin Cancer Res. (2003) 9:4227–39.
18. Lee J, Kotliarova S, Kotliarov Y, Li A, Su Q, Donin NM, et al. Tumor stem cells derived from glioblastomas cultured in bFGF and EGF more closely mirror the phenotype and genotype of primary tumors than do serum-cultured cell lines. Cancer Cell. (2006) 9:391–403. doi: 10.1016/j.ccr.2006.03.030
19. Joo KM, Kim J, Jin J, Kim M, Seol HJ, Muradov J, et al. Patient-specific orthotopic glioblastoma xenograft models recapitulate the histopathology and biology of human glioblastomas in situ. Cell Rep. (2013) 3:260–73. doi: 10.1016/j.celrep.2012.12.013
20. Wakimoto H, Tanaka S, Curry WT, Loebel F, Zhao D, Tateishi K, et al. Targetable signaling pathway mutations are associated with malignant phenotype in IDH-mutant gliomas. Clin Cancer Res. (2014) 20:2898–909. doi: 10.1158/1078-0432.CCR-13-3052
21. Shiroishi MS, Castellazzi G, Boxerman JL, D'Amore F, Essig M, Nguyen TB, et al. Principles of T2 *-weighted dynamic susceptibility contrast MRI technique in brain tumor imaging. J Magn Reson Imaging. (2015) 41:296–313. doi: 10.1002/jmri.24648
22. Khalifa F, Soliman A, El-Baz A, Abou El-Ghar M, El-Diasty T, Gimel'farb G, et al. Models and methods for analyzing DCE-MRI: a review. Med Phys. (2014) 41:124301. doi: 10.1118/1.4898202
23. Heye AK, Culling RD, Valdes Hernandez Mdel C, Thrippleton MJ, Wardlaw JM. Assessment of blood-brain barrier disruption using dynamic contrast-enhanced MRI. Syst Rev Neuroimage Clin. (2014) 6:262–74. doi: 10.1016/j.nicl.2014.09.002
24. Xue W, Du X, Wu H, Liu H, Xie T, Tong H, et al. Aberrant glioblastoma neovascularization patterns and their correlation with DCE-MRI-derived parameters following temozolomide and bevacizumab treatment. Sci Rep. (2017) 7:13894. doi: 10.1038/s41598-017-14341-9
25. Chen X, Xie T, Fang J, Xue W, Kang H, Tong H, et al. Dynamic MR imaging for functional vascularization depends on tissue factor signaling in glioblastoma. Cancer Biol Ther. (2018) 19:416–26. doi: 10.1080/15384047.2018.1423924
26. Soda Y, Myskiw C, Rommel A, Verma IM. Mechanisms of neovascularization and resistance to anti-angiogenic therapies in glioblastoma multiforme. J Mol Med. (2013) 91:439–48. doi: 10.1007/s00109-013-1019-z
27. Kane JR. The role of brain vasculature in glioblastoma. Mol Neurobiol. (2019) 56:6645–53. doi: 10.1007/s12035-019-1561-y
29. Galli R, Binda E, Orfanelli U, Cipelletti B, Gritti A, De Vitis S, et al. Isolation and characterization of tumorigenic, stem-like neural precursors from human glioblastoma. Cancer Res. (2004) 64:7011–21. doi: 10.1158/0008-5472.CAN-04-1364
30. Thirant C, Galan-Moya EM, Dubois LG, Pinte S, Chafey P, Broussard C, et al. Differential proteomic analysis of human glioblastoma and neural stem cells reveals HDGF as a novel angiogenic secreted factor. Stem Cells. (2012) 30:845–53. doi: 10.1002/stem.1062
31. Mei X, Chen YS, Chen FR, Xi SY, Chen ZP. Glioblastoma stem cell differentiation into endothelial cells evidenced through live-cell imaging. Neuro Oncol. (2017) 19:1109–18. doi: 10.1093/neuonc/nox016
32. Ricci-Vitiani L, Pallini R, Biffoni M, Todaro M, Invernici G, Cenci T, et al. Tumour vascularization via endothelial differentiation of glioblastoma stem-like cells. Nature. (2010) 468:824–8. doi: 10.1038/nature09557
33. Yao X, Ping Y, Liu Y, Chen K, Yoshimura T, Liu M, et al. Vascular endothelial growth factor receptor 2 (VEGFR-2) plays a key role in vasculogenic mimicry formation, neovascularization and tumor initiation by Glioma stem-like cells. PLoS ONE. (2013) 8:e57188. doi: 10.1371/annotation/aed5b555-b826-4591-8aa6-284ad888627d
34. Brooks LJ, Parrinello S. Vascular regulation of glioma stem-like cells: a balancing act. Curr Opin Neurobiol. (2017) 47:8–15. doi: 10.1016/j.conb.2017.06.008
35. Lo BKK, Yu M, Zloty D, Cowan B, Shapiro J, McElwee KJ. CXCR3/ligands are significantly involved in the tumorigenesis of basal cell carcinomas. Am J Pathol. (2010) 176:2435–46. doi: 10.2353/ajpath.2010.081059
36. Heinke J, Kerber M, Rahner S, Mnich L, Lassmann S, Helbing T, et al. Bone morphogenetic protein modulator BMPER is highly expressed in malignant tumors and controls invasive cell behavior. Oncogene. (2012) 31:2919–30. doi: 10.1038/onc.2011.473
37. Ko SY, Naora H. Adaptation of ovarian cancer cells to the peritoneal environment: multiple mechanisms of the developmental patterning gene HOXA9. Cancer Cell Microenviron. (2014) 1:e379.
38. Ling CC, Ng KT, Shao Y, Geng W, Xiao JW, Liu H, et al. Post-transplant endothelial progenitor cell mobilization via CXCL10/CXCR3 signaling promotes liver tumor growth. J Hepatol. (2014) 60:103–9. doi: 10.1016/j.jhep.2013.08.017
39. Costa BM, Smith JS, Chen Y, Chen J, Phillips HS, Aldape KD, et al. Reversing HOXA9 oncogene activation by PI3K inhibition: epigenetic mechanism and prognostic significance in human glioblastoma. Cancer Res. (2010) 70:453–62. doi: 10.1158/0008-5472.CAN-09-2189
40. Liu C, Luo D, Reynolds BA, Meher G, Katritzky AR, Lu B, et al. Chemokine receptor CXCR3 promotes growth of glioma. Carcinogenesis. (2011) 32:129–37. doi: 10.1093/carcin/bgq224
41. Zhang J, Liu H, Tong H, Wang S, Yang Y, Liu G, et al. Clinical applications of contrast-enhanced perfusion MRI techniques in gliomas: recent advances and current challenges. Contrast Media Mol Imaging. (2017) 2017:7064120. doi: 10.1155/2017/7064120
Keywords: high-grade glioma, neovascularization, BMPER, CXCL10, HOXA9, PWI-MRI
Citation: Xue W, Zhang J, Tong H, Xie T, Chen X, Zhou B, Wu P, Zhong P, Du X, Guo Y, Yang Y, Liu H, Fang J, Wang S, Wu H, Xu K and Zhang W (2020) Effects of BMPER, CXCL10, and HOXA9 on Neovascularization During Early-Growth Stage of Primary High-Grade Glioma and Their Corresponding MRI Biomarkers. Front. Oncol. 10:711. doi: 10.3389/fonc.2020.00711
Received: 17 September 2019; Accepted: 15 April 2020;
Published: 05 May 2020.
Edited by:
Michelangelo Campanella, Royal Veterinary College (RVC), United KingdomReviewed by:
Luigi Fattore, Sapienza University, ItalyJohn Charles Waterton, University of Manchester, United Kingdom
Copyright © 2020 Xue, Zhang, Tong, Xie, Chen, Zhou, Wu, Zhong, Du, Guo, Yang, Liu, Fang, Wang, Wu, Xu and Zhang. This is an open-access article distributed under the terms of the Creative Commons Attribution License (CC BY). The use, distribution or reproduction in other forums is permitted, provided the original author(s) and the copyright owner(s) are credited and that the original publication in this journal is cited, in accordance with accepted academic practice. No use, distribution or reproduction is permitted which does not comply with these terms.
*Correspondence: Weiguo Zhang, wgzhang01@163.com
†These authors have contributed equally to this work