 Zhuofei Li
 Guoqing Lv
- Department of Gastroinerstinal Surgery, Peking University Shenzhen Hospital, Shenzhen, China
Background: The difficulties of early diagnosis of colorectal cancer (CRC) result in a high mortality rate. The ability to predict the response of a patient to surgical resection or chemotherapy may be of great value for clinicians when planning CRC treatments. Metabolomics is an emerging tool for biomarker discovery in cancer research. Previous reports have indicated that the metabolic profile of individuals can be significantly altered between CRC patients and healthy controls. However, metabolic changes in CRC patients at different treatment stages have not been explored.
Methods: To this end, we performed nuclear magnetic resonance (NMR)-based metabolomic analysis to determine metabolite aberrations in CRC patients before and after surgical resection or chemotherapy. In general, a total of 106 urine samples from four clinical groups, namely, healthy volunteers (n = 31), presurgery CRC patients (n = 25), postsurgery CRC patients (n = 25), and postchemotherapy CRC patients (n = 25), were collected and subjected to further analysis.
Results: In the present study, we identified five candidate metabolites, namely, N-phenylacetylglycine, succinate, 4-hydroxyphenylacetate, acetate, and arabinose, in CRC patients compared with healthy individuals, three of which were reported for the first time. Furthermore, approximately ten metabolites were uniquely identified at each stage of CRC treatment, serving as good candidates for biomarker panel selection.
Conclusion: In summary, these potential metabolite candidates may provide promising early diagnostic and monitoring approaches for CRC patients at different anticancer treatment stages.
Introduction
Colorectal cancer (CRC) is becoming a major public health concern. It is ranked as the third most frequently diagnosed cancer, making it responsible for nearly 10% of all cancer-caused deaths worldwide (1, 2). Studies have demonstrated that lifestyle (e.g., dietary risks and drinking issues), genetic (e.g., deactivation of tumor suppressor genes), and environmental (e.g., commensal microbiome) factors will greatly impact the chance of gastrointestinal tumor initiation (3–8). Unfortunately, the overall low survival rate for CRC, with a 5-year postoperative survival rate of less than 50%, is due to the high risk of tumor recurrence after surgery (9). Early localized adenomas (stage I or II) could be effectively removed by rectal resection, and over 90% of patients survived (10). For patients with late stages of CRC (stage III or IV), chemotherapy is incorporated to improve the survival rate (11). However, one group of patients did not respond to chemotherapy, and some of them developed severe side effects from this treatment (12). Thus, establishing a method to predict whether a patient will suffer the aforementioned consequences of chemotherapy would be of great value to doctors when planning timely and appropriate therapies for CRC patients.
Given that the progression of CRC is dependent on both local and systemic inflammatory responses, these indices have been used to develop CRC-specialized screening markers or scoring systems, namely, the single neutrophil-to-lymphocyte ratio (NLR), lymphocyte-to-monocyte ratio (LMR) (13–15), CRC tumor markers (CA19-9 and CEA), modified Glasgow Prognostic Score (mGPS, albumin, and C-reactive protein in serum) (16, 17), systemic inflammation score (SIS, serum albumin, and LMR) (18), and fecal-based testing (19, 20). However, the lack of sensitivity of these methods makes early diagnosis of CRC challenging (21). Therefore, the development of a more effective, noninvasive, and high-throughput method for disease-progress surveillance is necessary. In particular, metabolomics is considered a potential diagnostic method to quantitatively compare changes in low-molecular-weight compounds among different clinical groups (22). This approach has been used as a diagnostic tool for a variety of human diseases, such as cardiovascular diseases (23), diabetes (24), and respiratory disease (25), and has been extensively applied to cancer studies (26). In particular, a number of studies using tissue or biofluid samples have demonstrated changes in metabolite profiles between CRC patients and healthy controls (27). For example, significant changes in lactate, amino acids, fatty acids, carboxylic acids, and urea cycle-related metabolites have been reported when comparing tissue specimens between CRC patients and healthy controls (28–31). Furthermore, CRC morbidity was found to be associated with dysregulated glycolysis, urea cycle, tricarboxylic acid (TCA) cycle, pyrimidine and polyamine metabolism, and gut flora metabolism by using both serum and urine samples (32, 33). In addition, studies for detecting the connection between metabolomic changes and adenomatous polyps, a precursor of CRC, have been conducted (34). Intriguingly, most of these studies have been performed using serum samples (35–37) rather than urine samples (38, 39). Urine has advantages in metabolomics research due to its relatively sterile and simple context that is largely free from interfering proteins, ease in obtaining large volumes, and the existence of a large number of small molecules (over 2,650 species with a molecular weight <2,000 Da) (40).
Although an increasing number of investigations have been carried out to show the association between specific metabolites and the diagnosis of CRC (41, 42), the utilization of metabolomics for presurgical, postsurgical, and postchemotherapy comprehensive monitoring of CRC has rarely been discussed. In this study, we used a highly reproducible nuclear magnetic resonance (NMR)-based metabolomic approach to compare urine metabolic changes among four clinical groups, namely, healthy volunteers, CRC patients prior to surgery (stage II or III), and CRC patients after surgery or chemotherapy. High-resolution quantifications of over 50 metabolites were then analyzed. Their potential as diagnostic markers along with primary therapeutic intervention has been evaluated. The results from this pilot study suggested that progressive variations in urine metabolite profiles generated from an unbiased high-throughput approach could be a valuable tool for the identification of biomarkers along with the most appropriate CRC treatments.
Materials and Methods
Patients and Healthy Volunteers
In general, patients diagnosed with phase II/III tumor progression at the location of the ascending, descending, sigmoid, and rectal colon were enrolled for this analysis, including surgery and chemotherapy as a package. There were no comorbidities or nodal involvement in these enrolled cases. Specifically, the age of the patients ranged from 18 to 75 years, and tumor dimensions ranged from 2.8 to 6.5 cm. Furthermore, patients with other types of tumors, inflammatory bowel disease, or long-term treatment with antibiotics were excluded from this study. Subsequently, urine samples from 106 individuals from the four clinical groups were sampled in the morning, at the Peking University Shenzhen Hospital, China. For surgery and chemotherapy groups, urine samples were collected at the second day after treatment and before breakfast. Twenty-five samples were obtained from each group of CRC patients, including presurgery (Group A), postoperative (Group B), and postchemotherapy (Group C) samples. Due to several reasons, some patients could not finish both surgery and chemotherapy. Thus, additional individuals with similar clinical diagnostics and treatments were then enrolled in Groups B and C (Table 1). In addition, 31 samples were enrolled from healthy volunteers (Group N). For Group B patients, radical resection for CRC was performed, and for Group C patients, a chemotherapeutic protocol containing 5’-fluorouracil 400–1,250 mg/m2 was applied for 21 days/cycle, with 6–8 cycles per treatment according to the treatment plan of each patient. The basic characteristics of these clinical groups, such as BMI, age, sex, and diagnosis of CRC, are summarized in Table 1. This study was approved by the Ethics Committee of the Peking University Shenzhen Hospital, China. Informed consent was obtained from all subjects in this study.
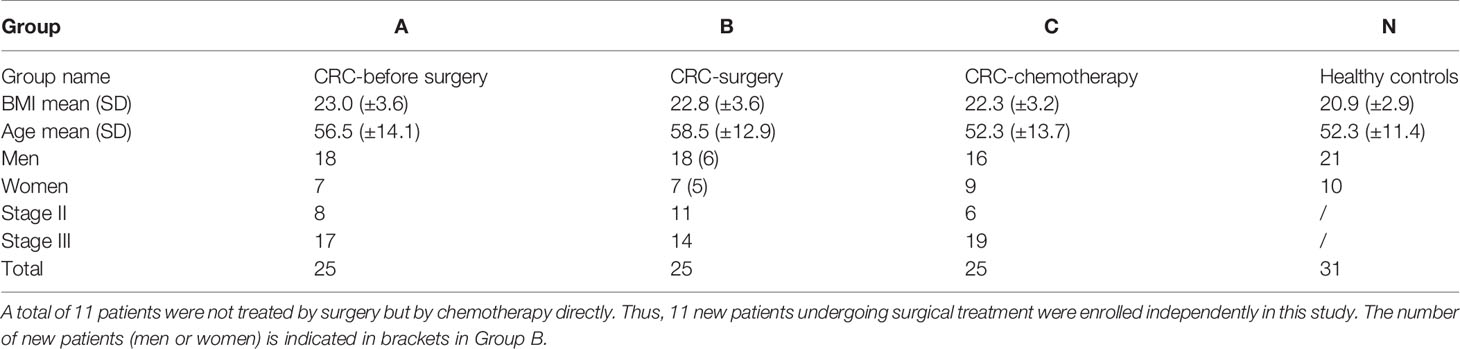
Table 1 Characteristics of subjects in each clinical group.
Sample Preparation for Metabolite Extraction
Urine samples were collected and immediately frozen at −80°C to prevent disturbance until further shipment and analysis. A final concentration of 0.025% sodium azide was added to the samples prior for sample extraction. For metabolite extraction, samples were centrifuged at 13,000 rpm for 2 min, and a 450-μl aqueous layer was transferred to a clean 2-ml centrifuge tube for subsequent NMR analysis. In addition, the pH value of each aqueous layer was measured and calibrated according to the internal ion concentration database of Chenomx NMR Suit 8.1 (Chenomx Inc., Edmonton, Canada) prior to NMR analysis.
Pretreatment of Samples and Acquisition of NMR Spectra
Generally, 50 μl of sodium trimethylsilylpropanesulfonate (DSS) standard solution (Anachro, Canada) in D2O was added to each sample. Samples were then mixed well before being transferred to 5-mm NMR tubes (Norell, USA). Spectra were collected using a Bruker AV III 600 MHz spectrometer (1H frequency: 600.13 MHz; Bruker, Germany). The first increment of a 2D-1H, 1H-NOESY pulse sequence was utilized for the acquisition of 1H-NMR data and for suppressing the solvent signal. Experiments used a 100-ms mixing time along with 990-ms presaturation (~80 Hz gammaB1). Spectra were collected at 25°C, with a total of 128 scans over a period of 15 min with a 12-ppm spectral width.
Processing of NMR Spectra for Metabolite Quantification
The collected free induction decay (FID) signal was automatically zero-filled and Fourier-transformed in the processing module of Chenomx NMR Suit 8.1 (Chenomx Inc., Edmonton, Canada). The data were then carefully phased and baseline-corrected by experienced technicians in the Chenomx Processor. All spectra were referenced to the internal standard DSS and analyzed by experienced analysts against the Chenomx Compound Library. In general, a total of 75 high quality spectra were identified. Among these 75 spectra, approximately 50 metabolites were further identified and quantified (Figure S1 and Table S1). All metabolite concentration information was exported to Excel and normalized by weight across all parallel samples before inclusion in the bioinformatic analysis.
Statistics and Other Analyses Used in This Study
For quantified metabolites among the four clinical groups, a nonsupervised principal component analysis (PCA) was first carried out to observe group classification and screen potential outliers using the PCA Methods Bioconductor package. In addition, the unit-variance-scaled data were used to conduct a supervised partial least-squares discriminant analysis (PLS-DA) using the PLS package for the maximization of group variations. Furthermore, parameters such as interpretability (R2) and predictability (Q2) were used to monitor the quality of the proposed model. Primary metabolites were selected to view metabolite shifts among groups. Subsequently, a third random forest test was conducted for further comparisons using the randomForest R package. Additionally, after testing the datasets for normality, two-tailed Student’s t test was used as well for group comparisons between groups using SPSS 19.0 (IBM; USA). Significant findings between the two groups were determined using a P-value <0.05 after adjustment for multiple comparisons. Plots were made using the ggplot2 package, and the Ward method was used for clustering analysis, as shown in Figure 2 and Figure S2. Finally, pathway enrichment analysis was carried out using MetaboAnalyst tools to locate the overrepresented pathways between the two comparison groups (43).
Results
Characteristics of Clinical Groups and Experimental Setup
In this study, four clinical groups were designed for metabolomic analysis. Three groups of CRC patients were compared with 31 healthy individuals (Group N). Specifically, Group A contained 25 individuals diagnosed with stage II or III CRC before surgical resection. The postsurgery group (Group B) enrolled 25 CRC patients who were treated through surgical procedures. Group C was a group of 25 CRC patients who underwent chemotherapy treatment after surgery (Table 1). The initial aim of this study was to observe the metabolic changes in CRC patients along with CRC treatments. However, for several reasons, some individuals could not finish the entire treatment for sample collection. Alternatively, an additional 11 patients with similar CRC conditions and surgical treatment procedures were enrolled in Group B to calculate the corresponding parameters (age, sex, and CRC stages, among others), are shown in Table 1.
The overall experimental design is summarized in Figure 1. Urine samples were collected from the aforementioned clinical groups for metabolite extraction and subsequent NMR identification. The spectral data were further analyzed using the Chenomx NMR suite for metabolite quantification purposes. Furthermore, a series of statistical analyses, such as a nonsupervised principal component analysis (PCA), a multivariate statistical method denoted as supervised partial least-squares discriminant analysis (PLS-DA), random forest test, and Student’s t test, were conducted to unravel the potential variations and biomarker discovery among the four clinical groups.
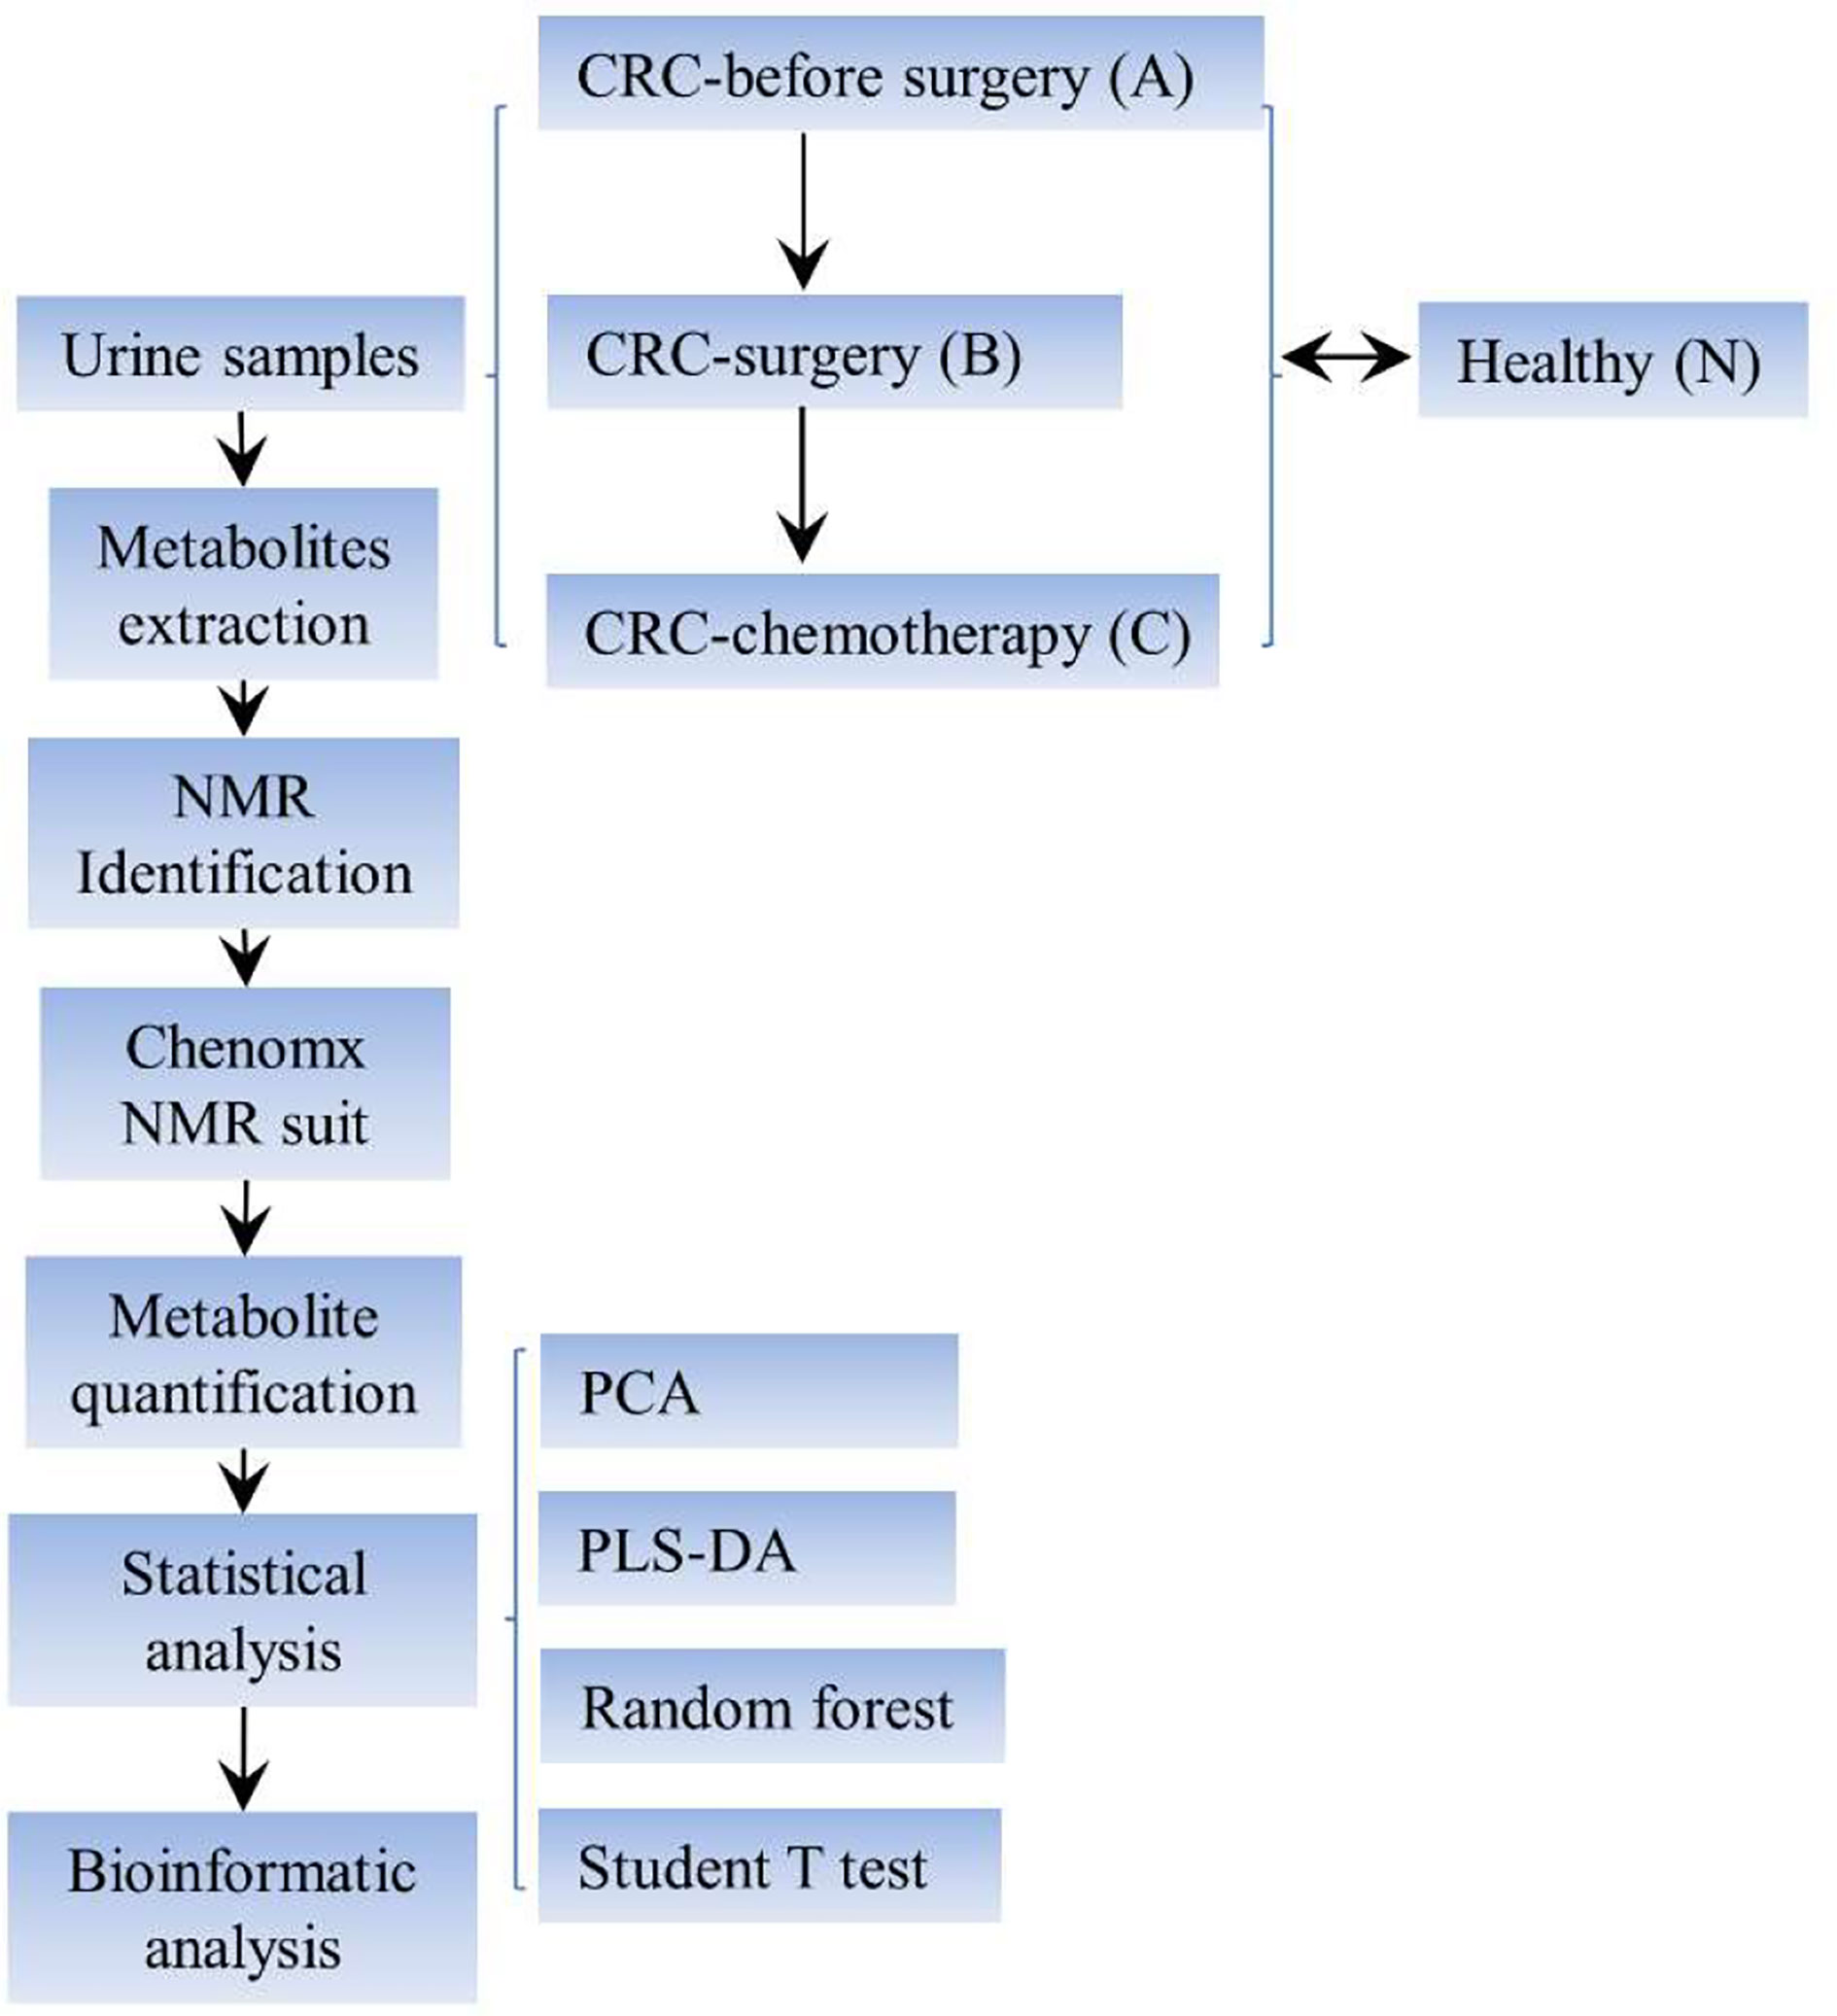
Figure 1 Schematic view of the experimental setup of this study. CRC, colorectal cancer; NMR, nuclear magnetic resonance; PLS-DA, partial least squares discriminant analysis.
Characteristics of Metabolite Profiling and Quantification
In general, over 50 metabolites belonging to diverse metabolic classes, namely, amino acids and derivatives, amine and ammonium compounds, organic acids, sugars, alcohols, nucleic acid components, and other cofactors, were identified in the urine samples from these 106 individuals (Table S1). The overall amount of each metabolite is presented in the form of a heatmap for each individual (Figure 2). Clustering analysis suggested that healthy individuals have a similar composition of urine metabolites, whereas different groups of CRC patients have large variations in metabolite distribution or abundance (Figure S2).
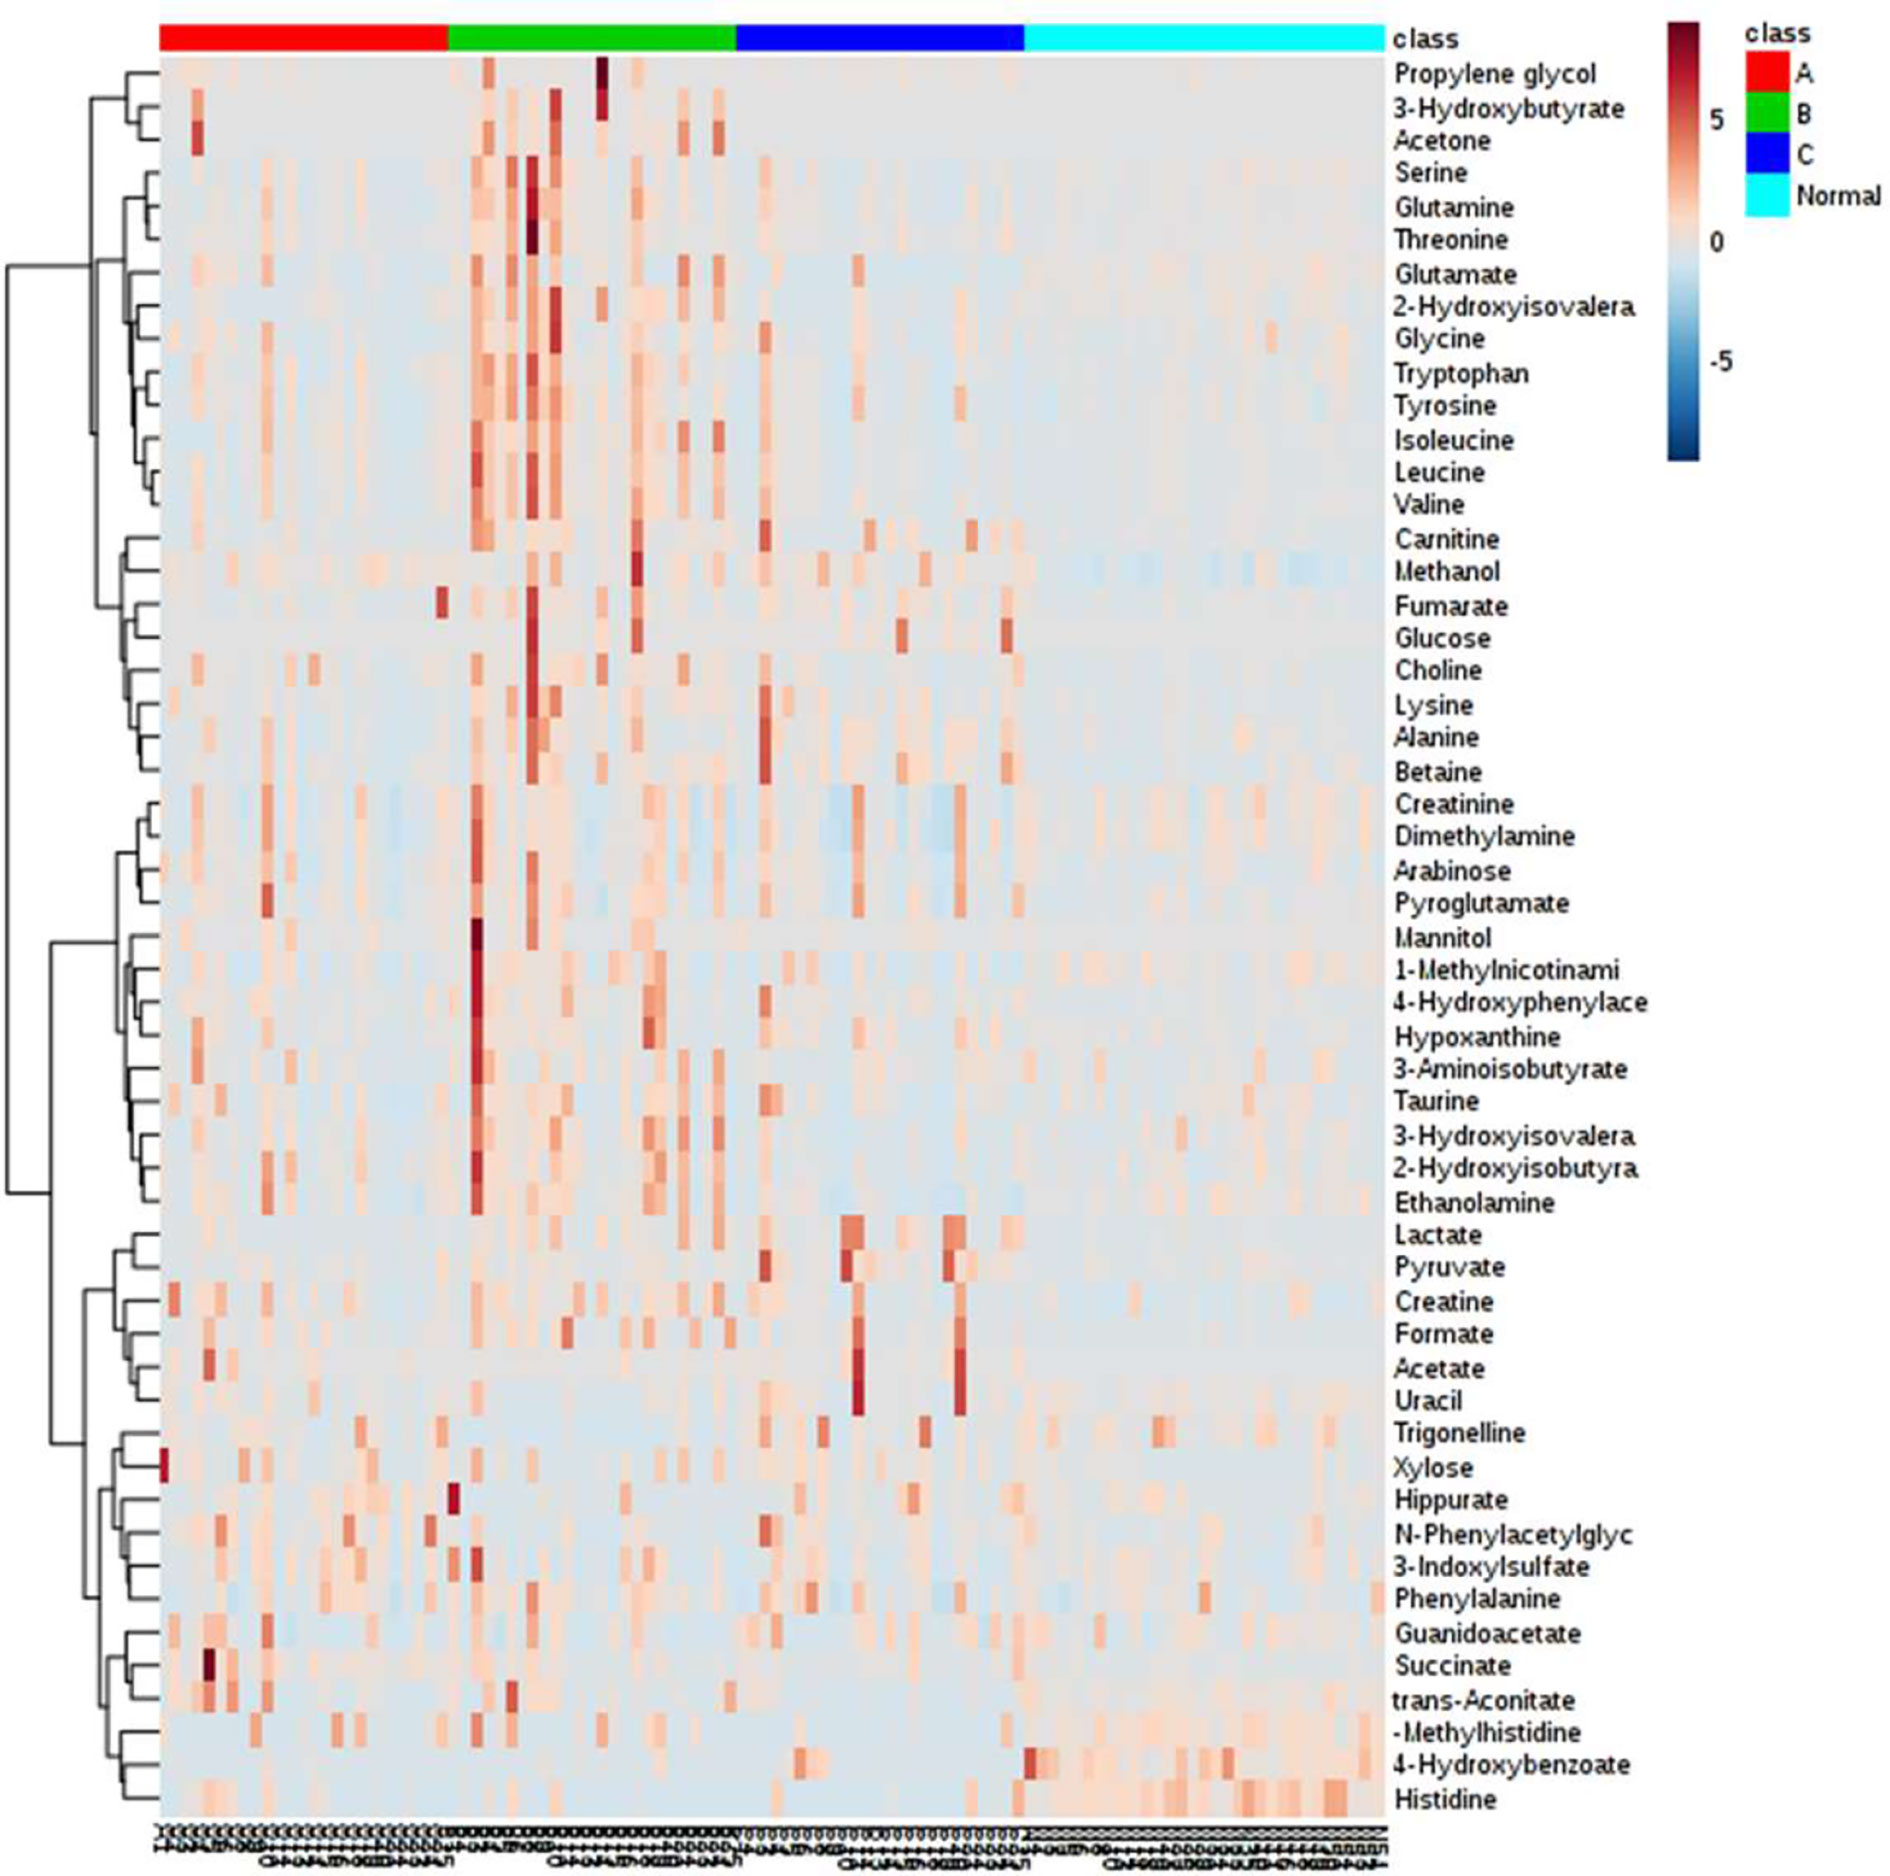
Figure 2 Heatmap representation of all metabolites detected in this study among the four clinical groups. Metabolites with similar profiles among the four clinical groups are clustered on the y-axis of this heatmap.
Statistical Analysis of Metabolic Profiles Among Clinical Groups
To further reveal the features of metabolic profiles among the four clinical groups, multiple statistical analyses were performed on this dataset (Figure 3). The initial PCA did not suggest a difference between healthy individuals and the three groups of CRC patients (Figure 3A). Thus, a supervised partial least-squares PLS-DA method for multivariate analysis was subsequently conducted. The results of this analysis indicated that the metabolic profiles of healthy volunteers were distinct from those of CRC patients in the remaining three groups (Figure 3B). Meanwhile, postoperative patients were more diverse in their metabolic profiles than the CRC patients in the other two groups (Figure 3B). In addition, a third method, that is, random forest estimation, was applied to show similar separation patterns between the three CRC groups and healthy individuals. Subsequently, the top 15 metabolites showing significant differences among the four clinical groups were presented using PLS-DA and random forest approaches (Figures 3D, E). Intriguingly, seven of these metabolites could be found on both lists, suggesting that statistical analysis may cause considerable variation in determining the target of interest. Because PLS-DA is a universal method used for metabolic profiling, subsequent analyses were based on this method. Additional Student’s t-tests were also applied for subsequent group comparisons.

Figure 3 Statistical comparison among the four clinical groups. (A) PCA, (B, D) PLS-DA, and (C, E) random forest tests were performed to identify group characteristics and potential metabolite biomarkers along with CRC treatment. Group A, CRC patients before surgery; Group B, CRC patients after surgery; Group C, CRC patients after chemotherapy; and Group N, healthy control group.
Group Comparisons Between Clinical Groups Identified Specific Metabolites as Potential Biomarkers for CRC Patients
Group comparisons for differentially accumulated metabolites between various CRC groups and healthy individuals were made to determine potential biomarkers associated with CRC. In particular, two metabolites, 4-hydroxybenzonate and histidine, were consistently present in all three comparison groups (e.g., A vs. N, B vs. N, and C vs. N) (Figure 4), showing low abundance in the groups of CRC patients at various treatment stages. In contrast, several metabolites, namely, N-phenylacetylglycine, succinate, 4-hydroxyphenylacetate, acetate, and arabinose, were uniquely upregulated in presurgery CRC patients versus healthy individuals, indicating their potential value in CRC biomarker discovery. However, validations of these biomarkers are needed using a larger cohort. Furthermore, the VIP scores of B vs. N and C vs. N were much larger than those of A vs. N, suggesting significant changes in certain metabolites in these two comparison groups. In addition, it is known that after surgery cancer biomarkers can change as a consequence, which is consistent in our findings. However, what are the potential usage of these identified metabolites remains to be further investigated.
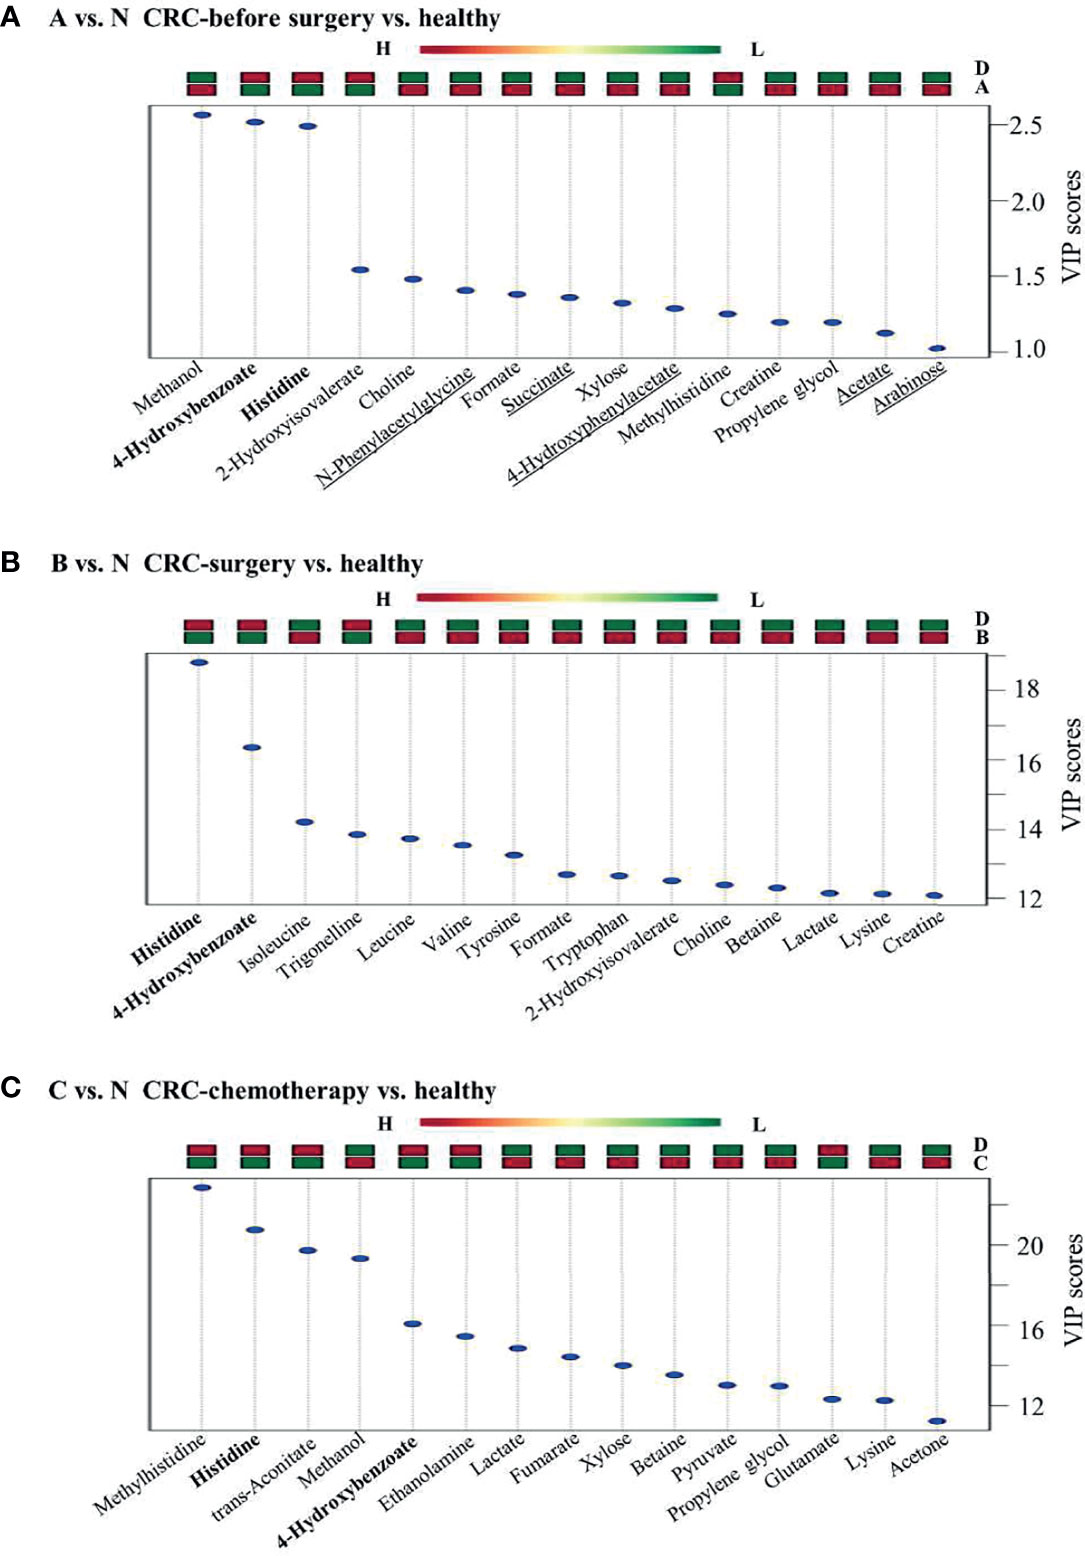
Figure 4 Group comparisons among the three pairs of clinical groups. (A) CRC patients versus healthy controls, (B) CRC surgery versus healthy controls, and (C) CRC chemotherapy versus healthy controls. Metabolites found in all three comparison groups are shown in bold. Metabolites uniquely identified in panel (A) are underlined. Up or downregulation of each metabolite is presented above the figure by using color bars.
Comparisons Between Untreated and Treated CRC Groups Identified Specific Metabolites Associated With CRC Therapy
To further understand the metabolic changes during CRC treatments, group comparisons between CRC patient groups at various treatment stages were conducted. Generally, each comparison group showed a distinct pattern of metabolic change. Many metabolites were uniquely present in each comparison group (Figure 5). For example, 9 out of 15 metabolites from B vs. A, 10 out of 15 metabolites from C vs. A, and 11 out of 15 metabolites from C vs. B were uniquely regulated in each comparison group (Figure 5), suggesting that specific metabolic features are associated with different treatment stages of CRC. Specifically, three metabolites, namely, glucose, lysine, and lactate, were upregulated after either surgical resection or chemotherapy compared with CRC patients before treatment (Figures 5A, B), implying the possible value of these metabolites to indicate the effectiveness of CRC treatments. Specifically, the presence of D-lactate and glucose is commonly linked to diabetes. The underlying mechanism of the elevation of these metabolites in both treatment groups remains to be elucidated. Furthermore, histidine was characterized in three previous comparison groups against healthy controls, whereas this metabolite was not discriminant in comparison groups such as B vs. A and C vs. A, suggesting its potential as a CRC biomarker to differentiate CRC patients from healthy individuals. The authenticity of these metabolites to serve as biomarkers will be evaluated in large population studies from multiple centres in the future.

Figure 5 Group comparisons between the two groups alone with CRC clinical treatment. (A) CRC patients before surgery versus healthy controls, (B) CRC patients after surgery versus before surgery, and (C) CRC patients after chemotherapy versus after surgery.
Unique Metabolic Pathways Were Enriched Between Different Comparison Groups
Pathway enrichment analysis was subsequently performed to elucidate representative metabolic pathways among different comparison groups. Similar to the metabolite changes, different metabolic pathways were enriched in comparison groups, such as A vs. N and C vs. B (Figure 6), suggesting that the differentially regulated metabolites detected in each comparison group belong to different metabolic pathways. In particular, among the top 20 enriched pathways, only four were present in both aforementioned comparison groups: beta-alanine metabolism, ammonia recycling, phospholipid biosynthesis, and phosphatidylcholine biosynthesis. In addition, no enrichment results were obtained from comparison groups B vs. A (Figure 5A).
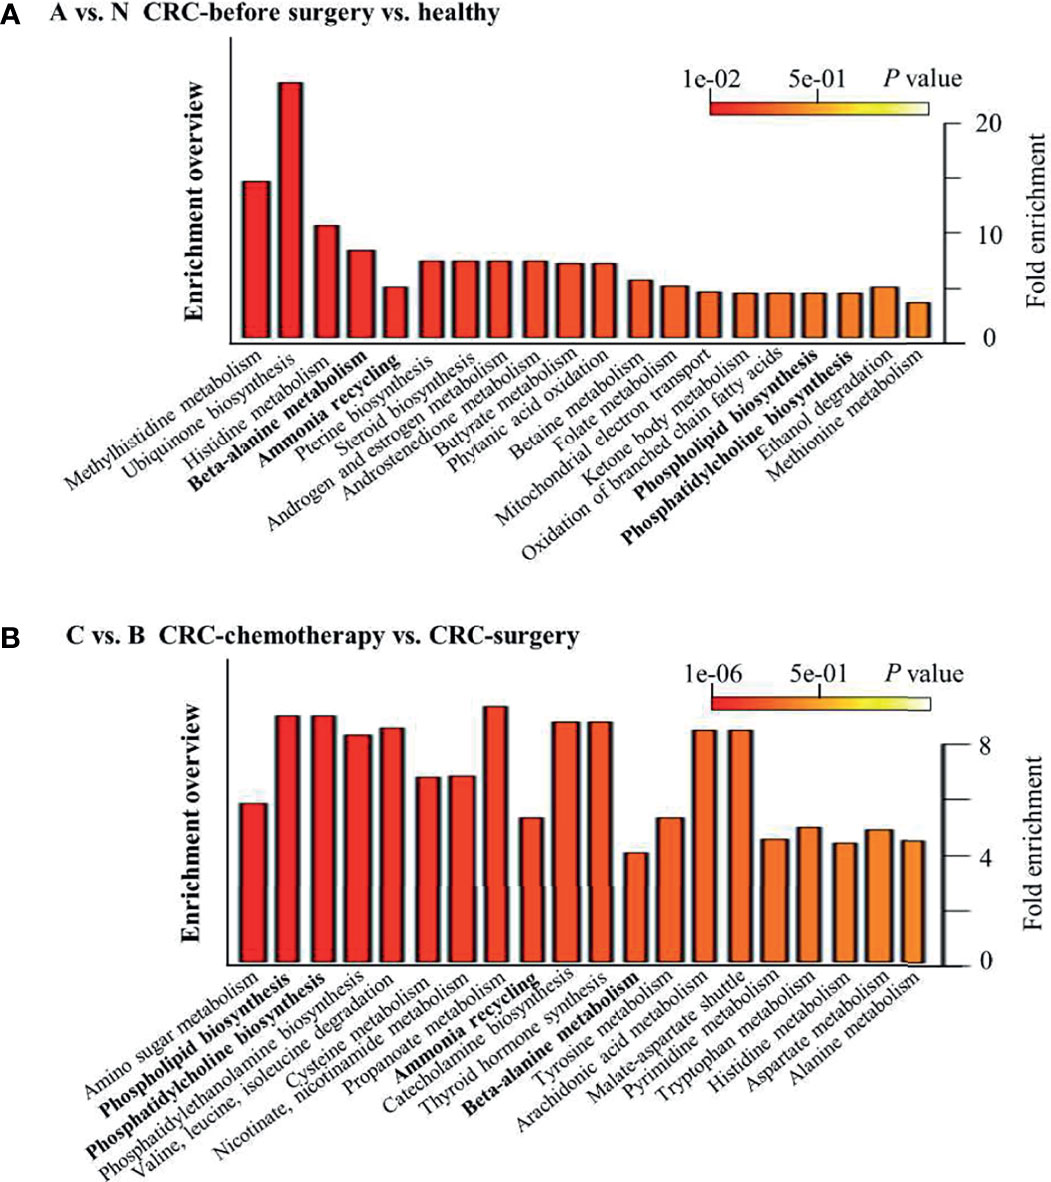
Figure 6 Top 20 enriched pathways between selected clinical groups. (A) CRC patients versus healthy controls and (B) CRC patients after chemotherapy versus patients after surgery.
Discussion
Along with the development of metabolomic methods, novel perspectives, such as early CRC diagnosis and monitoring of treatment procedures, can be offered by clinicians (44). The current investigation examined urine metabolic profiles as an approach for evaluating potential biomarker combinations for the early diagnosis of CRC and patient responses to radical resection or chemotherapy. The goal of this study was to obtain preliminary insights into metabolic variations during the aforementioned situations, providing an additional tool for clinical counseling.
Metabolomic Data Obtained in Different Treatment Stages Facilitate Biomarker Ddiscovery in CRC Patients
In this study, candidate metabolites for CRC patients at different stages of treatment (presurgery and postsurgery) were chosen according to PLS-DA analysis. Interestingly, we found that the incorporation of other stages of CRC treatment could eliminate false-positive identification in biomarker discovery. For example, a previous study demonstrated that higher activity of histidine decarboxylase might decarboxylate histidine, thus decreasing its level in CRC patients in comparison to healthy control groups (22, 45). However, the level of histidine was observed to be significantly altered in both comparison groups, that is, the postsurgery and postchemotherapy groups, suggesting that it is not a good candidate for biomarker discovery in CRC. Furthermore, opposite results of histidine alteration between the postsurgery and presurgery groups were documented in urine samples of CRC patients (33), suggesting that clinical procedures such as nutritional supplementation of amino acids may affect urine metabolic profiles. Thus, the selection of metabolites that are uniquely present in presurgery CRC patients versus healthy controls is a better approach towards biomarker discovery in patients. Here, five metabolites, namely, N-phenylacetylglycine, succinate, 4-hydroxyphenylacetate, acetate, and arabinose, were upregulated in CRC patients compared with healthy individuals, and none of them were present in the other comparison groups. In particular, besides succinate and hydroxyphenylacetate, N-phenylacetylglycine, acetate, and arabinose have not been reported previously, indicating their potential role as biomarkers of CRC. Furthermore, succinate from the tricarboxylic acid cycle has long been identified as being associated with CRC (38), suggesting the validity of our approach for biomarker screening.
In addition to biomarker discovery between CRC patients and healthy volunteers, the metabolic profiles of CRC patients at different treatment stages provided valuable information for monitoring the efficacy of a certain treatment, such as radical resection or chemotherapy. First, three metabolites (glucose, lysine, and lactate) identified in comparison groups C vs. N and B vs. N (Figures 5A, B) served as common metabolic candidates for cancer treatment. Higher glucose levels have been reported previously in serum samples of CRC patients (46). In our study, the level glucose was increased in CRC patients after either surgical resection or chemotherapy. Furthermore, consistent with a previous report (47), lysine was consistently found to be at a lower level in presurgery CRC patients than in patients after surgery. Our study also suggested that chemotherapy could affect lysine levels in urine samples through a similar pattern of surgical operation. In addition, elevated lactate levels have been observed in numerous tumour tissues (32). However, both surgical resection and chemotherapy were able to further increase lactate levels, which requires further investigation. Nevertheless, the reliability of these metabolic indicators also requires further examination in a large-scale study. Additionally, nine and ten metabolites were identified as unique features of B vs. A and C vs. A, respectively (Figures 5A, B). Some of these metabolites, namely, creatinine, 3-aminoisobutyrate, and taurine, were first reported to be associated with CRC and its different treatment stages, providing novel targets for further investigation.
Factors Affecting Urine Metabolic Profiles in CRC Patients
Tumor tissues have been demonstrated to have higher metabolic status, thus affecting numerous primary metabolic processes. Some of these variations can be detected in urine samples. The significantly changed metabolites identified in this study are more likely the result of altered metabolic status in CRC patients compared with healthy individuals. However, other factors may also influence the urine metabolic profile in CRC patients. For example, tyrosine identified in comparison group C vs. B (Figure 5C) may serve as a precursor for p-cresol and hydroxyphenylacetate, which are aromatic compounds involved in microbial metabolism (e.g., in Clostridium difficile) (47, 48). Clostridium spp. are common gut commensal microbes in healthy individuals (10). Intriguingly, 4-hydroxyphenylacetate was identified as a potential biomarker for CRC in this study, suggesting the involvement of gut microbiota in affecting urine metabolite composition. Furthermore, both the procedures involved in surgical operation and the chemicals used in chemotherapy have a large impact on the gut ecosystem microbial composition. Thus, the relationship between urine metabolomics and gut microbiome variation associated with CRC patients would be an interesting research topic in the future.
Limitations of the Statistics and Analytical Methods Used in This Study
One important thing we need to discuss is that the application of a statistical model will greatly affect the final outcomes for feature metabolite determination. For example, PLS-DA and random forest analysis provided two lists of significantly changed metabolites among the four clinical groups (Figures 3D, E). Furthermore, only 7 out of 15 compounds were present on both lists. Specifically, PLS-DA is a supervised method that can improve group separation for biomarker identification (49). It has been used in numerous metabolomic studies for biomarker screening in CRC patients (33, 38). Although both methods could separate healthy individuals from CRC patients at different treatment stages, discrepancies were observed in the final list of candidate metabolites. Furthermore, we also used two methods, namely, PLS-DA and Student’s t-test, to analyze the group comparison data (Table S2). Interestingly, the outcomes of significantly altered metabolites were almost the same in some comparison groups, whereas some comparison groups showed a completely different metabolite list obtained by these two methods. Thus, the underlying mechanism of these phenomena remains to be elucidated. Studies aiming to address this issue would be greatly helpful for future metabolic biomarker identification. Furthermore, in addition to the small sample size and relatively low sensitivity of NMR spectrometry (33, 50), the present study could be further improved by incorporating other omics approaches, namely, proteogenomics (51, 52), metagenomics (53, 54), and proteomics (55), to further expand the functional relationship between these metabolites and host metabolic functions.
Conclusion
In this pilot study, we identified a panel of potential biomarkers from urine metabolites of Chinese CRC patients obtained at different treatment stages. Some of these compounds were reported for the first time in CRC studies. These outcomes reveal the value of this noninvasive and high-throughput strategy as a complementary diagnostic and monitoring tool for CRC. We hope the metabolites identified here could be developed into a simple urine test that is applicable in clinical practice, thus having a major salutary effect on CRC mortality.
Data Availability Statement
The original contributions presented in the study are included in the article/Supplementary Material. Further inquiries can be directed to the corresponding author.
Ethics Statement
The studies involving human participants were reviewed and approved by the Peking University Shenzhen Hospital. The patients/participants provided their written informed consent to participate in this study.
Author Contributions
GL designed the experiments, and ZL and XD conducted them. JL, JZ, YL and XJ analyzed the data. ZL wrote the manuscript, and GL critically commented and revised it.
Funding
This work was supported by grants from the San Ming Project of Shenzhen, China, and the Municipal Health Planning Commission Fund of Shenzhen, China (No. SZXJ 2018084).
Conflict of Interest
The authors declare that the research was conducted in the absence of any commercial or financial relationships that could be construed as a potential conflict of interest.
Publisher’s Note
All claims expressed in this article are solely those of the authors and do not necessarily represent those of their affiliated organizations, or those of the publisher, the editors and the reviewers. Any product that may be evaluated in this article, or claim that may be made by its manufacturer, is not guaranteed or endorsed by the publisher.
Supplementary Material
The Supplementary Material for this article can be found online at: https://www.frontiersin.org/articles/10.3389/fonc.2021.574318/full#supplementary-material
References
1. Ferlay J, Soerjomataram I, Ervik M, Dikshit R, Eser S, Mathers C, et al. GLOBOCAN 2012 V1.0, Cancer Incidence and Mortality Worldwide. IARC Cancer Base no. 11 [Internet]. International Agency for Research on Cancer, Lyon (2013).
2. Jemal A, Bray F, Center MM, Ward E, Forman D. Global Cancer Statistics . CA A Cancer J Clin (2011) 61(2):69–90. doi: 10.3322/caac.20107
3. Vogelstein B, Kinzler KW. Cancer Genes and the Pathways They Control. Nat Med (2004) 10(8):789–99. doi: 10.1038/nm1087
4. Nugent FW, Haggitt RC, Gilpin PA. Cancer Surveillance in Ulcerative Colitis. Gastroenterology (2005) 92(8):928–36. doi: 10.1002/bjs.5106
5. Huxley RR, Ansary-Moghaddam A, Clifton P, Parr CL, Czernichow S, Woodward M. The Impact of Dietary and Lifestyle Risk Factors on Risk of Colorectal Cancer: A Quantitative Overview of the Epidemiological Evidence. Int J Cancer (2009) 125(1):171–80. doi: 10.1002/ijc.24343
6. Larsson SC, Rafter J, Holmberg L, Bergkvist L, Wolk A. Red Meat Consumption and Risk of Cancers of the Proximal Colon, Distal Colon and Rectum: The Swedish Mammography Cohort. Int J Cancer (2005) 113(5):829–34. doi: 10.1002/ijc.20658
7. Cheesman SE, Neal JT, Mittge E, Seredick BM, Guillemin K. Epithelial Cell Proliferation in the Developing Zebrafish Intestine Is Regulated by the Wnt Pathway and Microbial Signaling via Myd88. Proc Natl Acad Sci U States America (2011) 108 Suppl 1(Supplement_1):4570. doi: 10.1073/pnas.1000072107
8. Brenner H, Kloor M, Pox CP. Colorectal Cancer. Lancet (2014) 383(9927):1490–502. doi: 10.1016/S0140-6736(13)61649-9
9. Guo W, Jiang C, Yang L, Li T, Liu X, Jin M, et al. Quantitative Metabolomic Profiling of Plasma, Urine, and Liver Extracts by 1H NMR Spectroscopy Characterizes Different Stages of Atherosclerosis in Hamsters. J Proteome Res (2016) 15(10):3500–10. doi: 10.1021/acs.jproteome.6b00179
10. Deng X, Li Z, Li G, Li B, Jin X, Lyu G. Comparison of Microbiota in Patients Treated by Surgery or Chemotherapy by 16S rRNA Sequencing Reveals Potential Biomarkers for Colorectal Cancer Therapy. Front Microbiol (2018) 9:1607. doi: 10.3389/fmicb.2018.01607
11. Yu T, Guo F, Yu Y, Sun T, Ma D, Han J, et al. Fusobacterium Nucleatum Promotes Chemoresistance to Colorectal Cancer by Modulating Autophagy. Cell (2017) 170(3):548–63. doi: 10.1016/j.cell.2017.07.008
12. Dykstra M, Switzer N, Eisner R, Tso V, Foshaug RR, Ismond KP, et al. Urine Metabolomics as a Predictor of Patient Tolerance and Response to Adjuvant Chemotherapy in Colorectal Cancer. Mol Clin Oncol (2017) 7(5):767–70. doi: 10.3892/mco.2017.1407
13. Guthrie GJK, Charles KA, Roxburgh CSD, Horgan PG, Mcmillan DC, Clarke SJ. The Systemic Inflammation-Based Neutrophil–Lymphocyte Ratio: Experience in Patients With Cancer. Crit Rev Oncol Hematol (2013) 88(1):218–30. doi: 10.1016/j.critrevonc.2013.03.010
14. Kwon H, Kim S, Oh SY, Lee S, Lee JH, Choi HJ, et al. Clinical Significance of Preoperative Neutrophil-Lymphocyte Versus Platelet-Lymphocyte Ratio in Patients With Operable Colorectal Cancer. Biomarkers (2012) 17(3):216–22. doi: 10.3109/1354750X.2012.656705
15. Chan JCY, Chan D, Diakos CI, Engel A, Pavlakis N, Gill AJ, et al. The Lymphocyte-to-Monocyte Ratio is a Superior Predictor of Overall Survival in Comparison to Established Biomarkers of Resectable Colorectal Cancer. Ann Surg (2017) 265(3):539–46. doi: 10.1097/SLA.0000000000001743
16. Leitch EF, Chakrabarti M, Crozier JEM, Mckee RF, Anderson JH, Horgan PG, et al. Comparison of the Prognostic Value of Selected Markers of the Systemic Inflammatory Response in Patients With Colorectal Cancer. Br J Cancer (2007) 97(9):1266–70. doi: 10.1038/sj.bjc.6604027
17. Park J, Watt DG, Roxburgh CSD, Horgan PG, Mcmillan DC. Colorectal Cancer, Systemic Inflammation, and Outcome: Staging the Tumor and Staging the Host. Ann Surg (2016) 263(2):326–36. doi: 10.1097/SLA.0000000000001122
18. Suzuki Y, Okabayashi K, Hasegawa H, Tsuruta M, Shigeta K, Kondo T, et al. Comparison of Preoperative Inflammation-Based Prognostic Scores in Patients With Colorectal Cancer. Ann Surg (2016) 267(3):527–31. doi: 10.1097/SLA.0000000000002115
19. Li Y, He K, Zhu W. Correlation Between Invasive Microbiota in Margin-Surrounding Mucosa and Anastomotic Healing in Patients With Colorectal Cancer. World J Gastrointest Oncol (2019) 11(9):717–28. doi: 10.4251/wjgo.v11.i9.717
20. Erben V, Bhardwaj M, Schrotzking P, Brenner H. Metabolomics Biomarkers for Detection of Colorectal Neoplasms: A Systematic Review. Cancers (2018) 10(8):246. doi: 10.3390/cancers10080246
21. Berkovich L, Shpitz B, Ghinea R, Greemland I, Kravtsov V, Kidron D, et al. Evaluation of Peritoneal CEA Levels Following Colorectal Cancer Surgery. J Surg Oncol (2014) 110(4):458–62. doi: 10.1002/jso.23676
22. Chen JL, Fan J, Yan LS, Guo HQ, Xiong JJ, Ren Y, et al. Urine Metabolite Profiling of Human Colorectal Cancer by Capillary Electrophoresis Mass Spectrometry Based on MRB. Gastroenterol Res Pract (2012) 2012:125890. doi: 10.1155/2012/125890
23. Zhao L, Ling W, Xinjian Q, Ruomeng L, Shimi L, Dongsheng W. A Metabonomics Profiling Study on Phlegm Syndrome and Blood-Stasis Syndrome in Coronary Heart Disease Patients Using Liquid Chromatography/Quadrupole Time-of-Flight Mass Spectrometry. Evidence-Based Complement Altern Med (2014) 2014:385102. doi: 10.1155/2014/385102
24. Wu T, Xie G, Ni Y, Liu T, Yang M, Wei H, et al. Serum Metabolite Signatures of Type 2 Diabetes Mellitus Complications. J Proteome Res (2015) 14(1):447–56. doi: 10.1021/pr500825y
25. Fanos V, Cristina Pintus M, Lussu M, Atzori L, Noto A, Stronati M, et al. Urinary Metabolomics of Bronchopulmonary Dysplasia (BPD): Preliminary Data at Birth Suggest it is a Congenital Disease. J Matern Fetal Neonat Med (2014) 27(S2):39–45. doi: 10.3109/14767058.2014.955966
26. Spratlin JL, Serkova NJ, Eckhardt SG. Clinical Applications of Metabolomics in Oncology: A Review. Clin Cancer Res (2009) 15(2):431–40. doi: 10.1158/1078-0432.CCR-08-1059
27. Hu J, Tang H, Zhang Q, Fan J, Hong J, Gu J, et al. Prediction of Gastric Cancer Metastasis Through Urinary Metabolomic Investigation Using GC/MS. World J Gastroenterol (2011) 17(6):727–34. doi: 10.3748/wjg.v17.i6.727
28. Chae YK, Kang W, Kim SH, Joo JE, Han JK, Hong BW. Combining Information of Common Metabolites Reveals Global Differences Between Colorectal Cancerous and Normal Tissues. Bull Korean Chem Soc (2010) 31(2):379–83. doi: 10.5012/bkcs.2010.31.02.379
29. Denkert C, Budczies J, Weichert W, Wohlgemuth G, Scholz M, Kind T, et al. Metabolite Profiling of Human Colon Carcinoma – Deregulation of TCA Cycle and Amino Acid Turnover. Mol Cancer (2008) 7(1):72–2. doi: 10.1186/1476-4598-7-72
30. Hirayama A, Kami K, Sugimoto M, Sugawara M, Toki N, Onozuka H, et al. Quantitative Metabolome Profiling of Colon and Stomach Cancer Microenvironment by Capillary Electrophoresis Time-of-Flight Mass Spectrometry. Cancer Res (2009) 69(11):4918–25. doi: 10.1158/0008-5472.CAN-08-4806
31. Piotto M, Moussallieh F, Dillmann B, Imperiale A, Neuville A, Brigand C, et al. Metabolic Characterization of Primary Human Colorectal Cancers Using High Resolution Magic Angle Spinning 1H Magnetic Resonance Spectroscopy. Metabolomics (2009) 5(3):292–301. doi: 10.1007/s11306-008-0151-1
32. Qiu Y, Cai G, Su M, Chen T, Zheng X, Xu Y, et al. Serum Metabolite Profiling of Human Colorectal Cancer Using GC–TOFMS and UPLC–QTOFMS. J Proteome Res (2009) 8(10):4844–50. doi: 10.1021/pr9004162
33. Qiu Y, Cai G, Su M, Chen T, Liu Y, Xu Y, et al. Urinary Metabonomic Study on Colorectal Cancer. J Proteome Res (2010) 9(3):1627–34. doi: 10.1021/pr901081y
34. Wang W, Feng B, Li X, Yin P, Gao P, Zhao X, et al. Urinary Metabolic Profiling of Colorectal Carcinoma Based on Online Affinity Solid Phase Extraction-High Performance Liquid Chromatography and Ultra Performance Liquid Chromatography-Mass Spectrometry. Mol Biosyst (2010) 6(10):1947–55. doi: 10.1039/c004994h
35. Farshidfar F, Weljie AM, Kopciuk KA, Buie WD, Maclean AR, Dixon E, et al. Serum Metabolomic Profile as a Means to Distinguish Stage of Colorectal Cancer. Genome Med (2012) 4(5):42–2. doi: 10.1186/gm341
36. Kondo Y, Nishiumi S, Shinohara M, Hatano N, Ikeda A, Yoshie T, et al. Serum Fatty Acid Profiling of Colorectal Cancer by Gas Chromatography/Mass Spectrometry. Biomarkers Med (2011) 5(4):451–60. doi: 10.2217/bmm.11.41
37. Leichtle AB, Nuoffer J, Ceglarek U, Kase J, Conrad T, Witzigmann H, et al. Serum Amino Acid Profiles and Their Alterations in Colorectal Cancer. Metabolomics (2012) 8(4):643–53. doi: 10.1007/s11306-011-0357-5
38. Cheng Y, Xie G, Chen T, Qiu Y, Zou X, Zheng M, et al. Distinct Urinary Metabolic Profile of Human Colorectal Cancer. J Proteome Res (2012) 11(2):1354–63. doi: 10.1021/pr201001a
39. Ma YL, Qin HL, Liu WJ, Peng JY, Huang L, Zhao XP, et al. Ultra-High Performance Liquid Chromatography–Mass Spectrometry for the Metabolomic Analysis of Urine in Colorectal Cancer. Digest Dis Sci (2009) 54(12):2655–62. doi: 10.1007/s10620-008-0665-4
40. Bouatra S, Aziat F, Mandal R, An CG, Wilson MR, Knox C, et al. The Human Urine Metabolome. PloS One (2013) 8(9):e73076. doi: 10.1371/journal.pone.0073076
41. Sideris M, Papagrigoriadis S. Molecular Biomarkers and Classification Models in the Evaluation of the Prognosis of Colorectal Cancer. Anticancer Res (2014) 34(5):2061–8.
42. Zhang A, Sun H, Yan G, Wang P, Han Y, Wang X. Metabolomics in Diagnosis and Biomarker Discovery of Colorectal Cancer. Cancer Lett (2014) 345(1):17–20. doi: 10.1016/j.canlet.2013.11.011
43. Chong J, Soufan O, Li C, Caraus I, Li S, Bourque G, et al. MetaboAnalyst 4.0: Towards More Transparent and Integrative Metabolomics Analysis. Nucleic Acids Res (2018) 46(W1):W486–94. doi: 10.1093/nar/gky310.Citedin:Pubmed
44. Chen L, Zhang C, Gui Q, Chen Y, Yang Y. Ultra−performance Liquid Chromatography Coupled With Quadrupole Time−of−Flight Mass Spectrometry−Based Metabolic Profiling of Human Serum Prior to and Following Radical Resection of Colorectal Carcinoma. Mol Med Rep (2015) 12(5):6879–86. doi: 10.3892/mmr.2015.4289
45. Garcia-Caballero M, Neugebauer E, Campos R, Castro IND, Vara-Thorbeck C. Increased Histidine Decarboxylase (HDC) Activity in Human Colorectal Cancer: Results of a Study on Ten Patients. Agents Actions (1988) 23(3-4):357–60. doi: 10.1007/BF02142587
46. Qiu Y, Cai G, Su M, Chen T, Zheng X, Xu Y, et al. Serum Metabolite Profiling of Human Colorectal Cancer Using GC-TOFMS and UPLC-QTOFMS. J Proteome Res (2009) 8(10):4844–50. doi: 10.1021/pr04162
47. Liesenfeld DB, Habermann N, Toth R, Owen RW, Frei E, Bohm J, et al. Changes in Urinary Metabolic Profiles of Colorectal Cancer Patients Enrolled in a Prospective Cohort Study (ColoCare). Metabolomics (2015) 11(4):998–1012. doi: 10.1007/s11306-014-0758-3
48. Selmer T, Andrei PI. P-Hydroxyphenylacetate Decarboxylase From Clostridium Difficile. FEBS J (2001) 268(5):1363–72. doi: 10.1046/j.1432-1327.2001.02001.x
49. Lu G, Wang J, Zhao X, Kong H, Xu G. Study on Gender Difference Based on Metabolites in Urine by Ultra High Performance Liquid Chromatography/Time of Flight Mass Spectrometry. Chin J Chromatogr (2006) 24(2):109–13. doi: 10.1016/S1872-2059(06)60005-9
50. Deng L, Fang H, Tso VK, Sun Y, Foshaug RR, Krahn SC, et al. Clinical Validation of a Novel Urine-Based Metabolomic Test for the Detection of Colonic Polyps on Chinese Population. Int J Colorectal Dis (2017) 32(5):741–3. doi: 10.1007/s00384-016-2729-9
51. Zhu F, Chen M, Ye N, Shi L, Ma K, Yang J, et al. Proteogenomic Analysis Reveals Alternative Splicing and Translation as Part of the Abscisic Acid Response in Arabidopsis Seedlings. Plant J (2017) 91(3):518–33. doi: 10.1111/tpj.13571
52. Chen M, Zhu F, Gao B, Ma K, Zhang Y, Fernie AR, et al. Full-Length Transcript-Based Proteogenomics of Rice Improves its Genome and Proteome Annotation. Plant Physiol (2020) 182(3):1510–26. doi: 10.1104/pp.19.00430
53. Gehrig JL, Venkatesh S, Chang HW, Hibberd MC, Kung VL, Cheng J, et al. Effects of Microbiota-Directed Foods in Gnotobiotic Animals and Undernourished Children. Science (2019) 365(6449):eaau4732. doi: 10.1126/science.aau4732
54. Zhao Y, Zhou J, Liu J, Wang Z, Chen M, Zhou S. Metagenome of Gut Microbiota of Children With Nonalcoholic Fatty Liver Disease. Front Pediatr (2019) 7:518. doi: 10.3389/fped.2019.00518
Keywords: chemotherapy, colorectal cancer, metabolomics, prognostic value, surgery
Citation: Li Z, Deng X, Luo J, Lei Y, Jin X, Zhu J and Lv G (2022) Metabolomic Comparison of Patients With Colorectal Cancer at Different Anticancer Treatment Stages. Front. Oncol. 11:574318. doi: 10.3389/fonc.2021.574318
Received: 19 June 2020; Accepted: 05 November 2021;
Published: 04 February 2022.
Edited by:
Tuuli Käämbre, National Institute of Chemical Physics and Biophysics, EstoniaReviewed by:
Luigi Atzori, University of Cagliari, ItalyPaula Guedes De Pinho, University of Porto, Portugal
Copyright © 2022 Li, Deng, Luo, Lei, Jin, Zhu and Lv. This is an open-access article distributed under the terms of the Creative Commons Attribution License (CC BY). The use, distribution or reproduction in other forums is permitted, provided the original author(s) and the copyright owner(s) are credited and that the original publication in this journal is cited, in accordance with accepted academic practice. No use, distribution or reproduction is permitted which does not comply with these terms.
*Correspondence: Guoqing Lv, lgq_bdsy@163.com