 Yi-Chun Cheng1Li-Yu Su1Li-Han Chen2
 Tzu-Pin Lu3,4Eric Y. Chuang4,5,6Mong-Hsun Tsai4,7
 Li-Ling Chuang8,9*
 Liang-Chuan Lai1,4*
- 1Institute of Physiology, College of Medicine, National Taiwan University, Taipei, Taiwan
- 2Institute of Fisheries Science, College of Life Science, National Taiwan University, Taipei, Taiwan
- 3Institute of Epidemiology and Preventive Medicine, National Taiwan University, Taipei, Taiwan
- 4Bioinformatics and Biostatistics Core, Center of Genomic and Precision Medicine, National Taiwan University, Taipei, Taiwan
- 5Graduate Institute of Biomedical Electronics and Bioinformatics, National Taiwan University, Taipei, Taiwan
- 6Collage of Biomedical Engineering, China Medical University, Taichung, Taiwan
- 7Institute of Biotechnology, National Taiwan University, Taipei, Taiwan
- 8School of Physical Therapy and Graduate Institute of Rehabilitation Science, College of Medicine, Chang Gung University, Taoyuan, Taiwan
- 9Department of Physical Medicine and Rehabilitation, Chang Gung Memorial Hospital, Taoyuan, Taiwan
Long non-coding RNAs (lncRNAs) have been found to participate in multiple genetic pathways in cancer. Also, mitochondria-associated lncRNAs have been discovered to modulate mitochondrial function and metabolism. Previously, we identified oxygen-responsive lncRNAs in MCF-7 breast cancer cells under different oxygen concentrations. Among them, a novel mitochondria-encoded lncRNA, mitochondrial oxygen-responsive transcript 1 (MTORT1), was chosen for further investigation. Nuclear, cytoplasmic, and mitochondrial fractionation assays were performed to evaluate the endogenous expression levels of MTORT1 in breast cancer cells. In vitro proliferation and migration assays were conducted to investigate the functions of MTORT1 in breast cancer cells by knockdown of MTORT1. RNA immunoprecipitation and luciferase reporter assays were used to examine the physical binding between MTORT1 and microRNAs. Our results showed that MTORT1 had low endogenous expression levels in breast cancer cells and was mainly located in the mitochondria. Knockdown of MTORT1 enhanced cell proliferation and migration, implying a tumor suppressor role of this novel mitochondrial lncRNA. MTORT1 served as sponge of miR-26a-5p to up-regulate its target genes, CREB1 and STK4. Our findings shed some light on the characterization, function, and regulatory mechanism of the novel hypoxia-induced mitochondrial lncRNA MTORT1, which functions as a microRNA sponge and may inhibit breast cancer progression. These data suggest that MTORT1 may be a candidate for therapeutic targeting of breast cancer progression.
Introduction
Solid tumors often acquire a state of limited oxygen and nutrients during tumor progression because of rapid tumor growth and poor vascular distribution. To adapt to the decreased oxygen availability, a series of genomic pathways are activated, mainly by hypoxia inducible factors (HIFs) (1). Signaling pathways of the genes induced by HIF-1 include epithelial-mesenchymal transition, apoptosis, angiogenesis, glycolysis, and others (2–4). The activation of these signaling pathways allows tumor cells to accommodate their hypoxic microenvironment, promoting malignant progression, and is partially responsible for their resistance to chemotherapy and radiation therapy (5, 6). Although hypoxia is an essential factor in cancer progression, its regulatory mechanisms are still not clear.
Cancer cells have been observed to undergo an increase in glycolysis and lactate production in the presence of high oxygen (7, 8). The impairment of aerobic respiration and a reliance on glycolytic metabolism in cancer cells might help cancer cells live in low oxygen conditions, like hypoxia. The model of aerobic glycolysis incorporates the biosynthesis of molecules and organelles to replicate new cells, because the intermediates of the glycolytic pathway are used in various biosynthetic pathways, such as nucleoside and amino acid generation (9). However, cancer cells still maintain a dynamic equilibrium between glycolysis and oxidative phosphorylation (10, 11). The cooperation of glycolysis and oxidative phosphorylation gives cancer cells more metabolic flexibility to survive in changing environments, like hypoxia, and can cause chemoresistance during chemotherapy (12). In addition, mitochondria are involved in other adaptive mechanisms, such as apoptosis, homeostasis, and innate immunity (12, 13). Although mitochondria play a central role in multiple functions in tumor progression, the mitochondria-related mechanisms remain unclear.
Non-coding RNAs, which have limited potential to translate, have been proposed in recent years to cause diseases such as cancer, due to their dysregulated expression (14). Among the non-coding RNAs, the RNA transcripts with lengths greater than 200 nucleotides are classified as long non-coding RNAs (lncRNAs). Expression of lncRNA has been found to be tissue-specific and is implicated in a variety of pathways, including tumorigenesis, cell cycle control, apoptosis, and migration (15, 16). Numerous studies have revealed different functions of lncRNA. For instance, lncRNAs act as microRNA (miRNA) sponges by interacting with the miRNAs to regulate post-transcriptional degradation of their mRNA targets. LncRNAs can also bind to transcription factors and prevent or assist with their location on the promoter of their target DNA. LncRNAs also modulate pre-mRNA splicing (17, 18).
In mitochondria, lncRNAs can be either mitochondria-encoded (mtlncRNAs) or nucleus-encoded (19). Three mtlncRNAs, lncND5, lncND6, and lncCyt b, are complementary to the mitochondrial genes ND5, ND6, and Cyt b, respectively (20). The function of these mtlncRNAs is to form duplexes with their respective complementary mRNAs to stabilize them or regulate their expression (21). In addition, the sense noncoding mitochondrial RNAs (SncmtRNAs) and anti-sense noncoding mitochondrial RNAs (ASncmtRNAs) are located in both the mitochondria and the nucleus, and are known as retrograde signals communicating between mitochondria and nucleus (21, 22). The discovery of mtlncRNAs suggested the complexity of molecular regulation in cells. However, the effects of mtlncRNAs in tumors are not fully understood.
Previously, our lab identified a set of oxygen-responsive lncRNAs in MCF-7 breast cancer cells (23), but many of their functions were unknown. The purpose of this study was to investigate the functional role and regulatory mechanism of a novel mtlncRNA, mitochondrial oxygen-responsive transcript 1 (MTORT1). We found that MTORT1 could inhibit the proliferation and migration of breast cancer cells, and could serve as a miRNA sponge to up-regulate the nucleus-encoded genes, CREB1 and STK4, by binding to miR-26a-5p.
Materials and Methods
Cell Culture and Treatments
Breast cancer cells (MCF-7, ZR-75-30, MDA-MB-231) and embryonic cells (HEK293T) were cultured in Dulbecco’s Modified Eagle Medium (DMEM) (GIBCO, Carlsbad, CA, USA) with 10% fetal bovine serum (FBS) (HyClone, Logan, UT, USA) and 1% penicillin-streptomycin-amphotericin solution (PS) (GIBCO). Human mammary epithelial cells (MCF-10A) were cultured in DMEM/Nutrient Mixture F-12 (GIBCO) with 5% horse serum, 20 ng/ml epidermal growth factor, 0.5 mg/ml hydrocortisone (Sigma, Saint Louis, MO, USA), 100 ng/ml cholera toxin (Sigma), 10 μg/ml insulin (Sigma), and 1% PS. The cells were incubated at 37°C in a humidified incubator with 5% CO2. To identify oxygen-responsive lncRNA, MCF-7 and MDA-MB-231 cells were cultured in a hypoxic chamber (InVivO2-200, Ruskinn Technology, Bridgend, UK) filled with 0.5% O2, 5% CO2 and 94.5% N2 for 24 h. After incubation under hypoxia, cells were moved to a humidified incubator with 21% O2 and 5% CO2 for 24 h to mimic re-oxygenation. In addition, MCF-7 cells were treated with 200 μM cobalt (II) chloride (CoCl2) (Sigma) to mimic hypoxic conditions.
Cell Line Authentication
Cell experiments were performed on cells that were passaged less than 20 times and were routinely tested for mycoplasma using PCR Mycoplasma Detection Kit (ABM Inc., Vancouver, Canada). The cell lines were purchased from and authenticated by the Bioresource Collection and Research Center, Food Industry Research and Development Institute (Hsinchu, Taiwan).
RNA Interference
To knock down MTORT1 expression, cells were transfected with three small interfering RNAs (siRNAs) (CCAUGAAUAUUGUACGGUATT, GCAAUCAACCCUCAACUAUTT, CCACCAUCCUCCGUGAAAUTT) (BIOTOOLS, New Taipei City, Taiwan) or the control siRNA (UUCUCCGAACGUGUCACGUTT) using Lipofectamine RNAiMAX (Invitrogen, Carlsbad, CA, USA) according to the manufacturer’s protocol. MCF-7 cells were seeded in 12-well plates at a density of 7 × 10⁴ cells/well and transfected with siRNA for 48 h; MDA-MB-231 were seeded 1.5 × 10⁵ cells in 6-wells and transfected with siRNA for 24 h. MTORT1 expression were checked by quantitative Reverse-Transcription-PCR (RT-PCR).
RNA Extraction, Reverse Transcription and Quantitative RT-PCR
Total RNA was extracted using NucleoZOL reagent (Machery-Nagel, Düren, Germany) according to the manufacturer’s protocol, and reverse-transcribed to complementary DNA (cDNA) by High-Capacity cDNA Reverse Transcription Kit (Applied Biosystems, Carlsbad, CA, USA). MiRNA was reverse-transcribed using SuperScript IV Reverse Transcriptase (Invitrogen) with the primers from Table 1. Complementary DNA acted as a template to measure gene expression by quantitative PCR with OmicsGreen qPCR MasterMix (OmicsBio, New Taipei City, Taiwan) with the primers in Table 1, performed on a StepOnePlus Real-Time PCR System (Thermo Fisher). Each reaction was done in triplicate, and the relative gene expression was normalized to 18S rRNA or U6 using the 2-ΔΔCt method.
Table 1 The primers for reverse transcription and quantitative RT-PCR.
Isolation of Mitochondrial, Cytoplasmic, and Nuclear Fractions
To determine the subcellular distribution of MTORT1, mitochondrial, cytoplasmic, and nuclear fractions were separated using a Cell Fractionation Kit (Abcam, Cambridge, England) according to the manufacturer’s instructions. In brief, 3.3 × 10⁶ cells were harvested by centrifugation at 300 × g for 3 min and resuspended in 1 ml 1× buffer A containing 0.0625% detergent I. After incubation for 10 min on a rotator at room temperature, samples were centrifuged at 5,000 × g for 1 min at 4°C. The supernatant was the cytosolic fraction. The pellets were resuspended in 1 ml 1× buffer A containing 2% detergent II and incubated for 15 min on a rotator at room temperature. Samples were centrifuged again at 5,000 × g for 1 min at 4°C. The supernatant was the mitochondrial fraction, and the pellet was the nuclear fraction. The RNA of these fractions was extracted using a HiYield™ Total RNA extraction kit (ArrowTec) according to the manufacturer’s instructions, reverse-transcribed, and measured by quantitative RT-PCR. The protein of these fractions was measured by western blotting.
Microarray Analysis
Total RNA from cells transfected with 100 nM siRNA against MTORT1 was amplified by an Illumina™ TotalPrep™ RNA Amplification Kit (Ambion) to revere-transcribe it to cDNA with a T7 promoter. When converting the single-stranded cDNA into a double-stranded cDNA, the second strand of cDNA was synthesized using DNA polymerase while the RNA was simultaneously degraded by RNase H. In vitro transcription was then conducted using the double-stranded cDNA as a template and T7 RNA polymerase to synthesize multiple copies of biotinylated complementary RNA (cRNA). After the cRNA was hybridized to Illumina Human HT-12 v4 BeadChips (Illumina) at 58°C for 16 h, the BeadChip was washed and stained with streptavidin-Cy3 dye. The intensity of the fluorescence across the surface of the chip was detected by the Illumina BeadArray Reader, and the results were analyzed using BeadStudio v3.1 software. After scanning, the intensity data from the BeadChips were analyzed using the commercial software Partek (Partek, St. Charles, MO, USA). The probe intensities were normalized by a quantile algorithm based on the intensity distribution across all chips. The gene expression profiles were evaluated by principal component analysis. The visual representation of expression profiles was generated by hierarchical clustering analysis using the Genesis 1.7.7 program (Graz University of Technology, Graz, Austria). Gene-gene interaction networks, biological functions, and pathways of these differentially expressed genes were analyzed by Ingenuity Pathway Analysis (Ingenuity Systems Inc., Redwood City, CA, USA). Microarray data from this study have been submitted to the GEO (Gene Expression Omnibus) database (accession number GSE157060).
RNA Immunoprecipitation (RIP)
To determine the interaction between MTORT1 and Argonaute 2 (AGO2), the Magna RIP Kit (Millipore) was used according to the manufacturer’s instructions. A total of 2 × 10⁷ cells was harvested with 0.05% trypsin-EDTA (GIBCO) and lysed in 100 μl RIP lysis buffer containing a proteinase inhibitor cocktail and RNase inhibitor (Millipore). The lysate was centrifuged at 13,000 × g for 10 min. Then, the supernatant was added to 900 μl RIP immunoprecipitation buffer with 2 μg anti-AGO2 antibodies (Boster Biological Technology, Pleasanton, CA, USA) that were pre-bound on magnetic beads for overnight agitation at 4°C. Ten percent of the supernatant was saved as input. Beads were washed 6 times with RIP wash buffer and treated with proteinase K at 55 °C for 30 min. RNA was extracted using NucleoZOL reagent (Machery-Nagel) and reverse-transcribed, and the relative gene expression level was measured by quantitative RT-PCR.
Luciferase Reporter Assay
To determine the binding effect of miR-26a-5p on MTORT1, HEK293T cells were seeded in 24-well plates at a density of 4 × 10⁴ cells/well and co-transfected with 50 ng pMIR-REPORT-MTORT1 or pMIR-REPORT-MTORT1 mutant, 0.025 nmol miR-26a-5p mimics (GE Healthcare Dharmacon, Lafayette, CO, USA), and 1 ng Renilla luciferase plasmid (pGL4.74 [hRluc/TK]) using jetPRIME (Polyplus-transfection, Illkirch, France). In addition, miRNA mimic cel-miR-67 (5’ - UCACAACCUCCUAGAAAGAGUAGA – 3’) (GE Healthcare Dharmacon) was used as the negative control. After 48 h, cells were lysed in 100 μl cell lysis buffer (92.8 mM K2HPO4, 9.2 mM KH2PO4 and 0.2% Triton X-100 in ddH2O), and the luciferase activity was measured using the Dual-Glo luciferase reporter assay system (Promega, Fitchburg, WI, USA).
MTT Assay
MCF-7 and MDA-MB-231 cells were seeded in 6-well plates at a density of 1.5 × 10⁵ cells/well. MCF-7 cells were transfected with siRNA for 48 h and MDA-MB-231 cells for 24 h. Then, MCF-7 and MDA-MB-231 cells were passaged and seeded in 96-well plates at a density of 5,000 cells/well. One hundred µl 3-(4,5-dimethylthiazol-2-yl)-2,5-diphenyltetrazolium bromide (MTT) (EMD Biosciences, San Diego, CA, USA) were added to each well and incubated for 1 h at 6, 24, 48, 72, and 96 hours after seeding. The absorbance was then measured using an enzyme-linked immunosorbent assay (ELISA) reader (Thermo Scientific) at 570 nm. The cell proliferation rate was normalized to the absorbance measured at 6 h.
Wound Healing Assay
MCF-7 and MDA-MB-231 cells were seeded in 6-well plates at a density of 1.5 × 10⁵ cells/well. MCF-7 cells were transfected with siRNA for 48 h and MDA-MB-231 cells for 24 h. Then, MCF-7 cells were passaged and seeded in the well of an Ibidi Culture-Insert (Ibidi, Martinsried, Germany) at a density of 2.5 × 10⁴ cells/well, and MDA-MB-231 cells were seeded at a density of 4 × 10⁴ cells/well. After cells were incubated overnight, the culture-inserts were removed gently with sterile tweezers to create a cell-free gap. The gap area was imaged by microscope at 0, 12, and 24 h and quantified using ImageJ 1.51 software (24).
Colony Formation Assay
MCF-7 and MDA-MB-231 cells were seeded in 6-well plates at a density of 1.5 × 10⁵ cells/well. MCF-7 cells were transfected with siRNA for 48 h and MDA-MB-231 cells for 24 h. Then, MCF-7 and MDA-MB-231 cells were passaged and seeded in 6-well plates at a density of 500 cells/well. After incubation for 2 weeks, cells were fixed with 800 μl fixing solution containing 75% methanol and 25% acetate (Sigma) and stained with 0.1% crystal violet (Sigma). Colonies with cell numbers greater than 50 were calculated and quantified using ImageJ 1.51 software.
Statistical Analysis
All results are presented as the means ± SDs from at least 3 independent experiments. All data were analyzed by Student’s t test to assess the differences between each group.
Results
Previously, our lab used next generation sequencing (NGS) technology to identify differentially expressed lncRNAs in breast cancer MCF-7 cells under normoxic, hypoxic, and re-oxygenated conditions (23). The expression data can be downloaded from Gene Expression Omnibus (GEO, GSE84167). Among the hypoxia responsive lncRNAs, one RNA transcript, NONHSAT135851.2 (http://www.noncode.org/show_rna.php?id=NONHSAT135851&version=2&utd=1#) according to the nomenclature in the NONCODE database (25), was significantly up-regulated under hypoxia and down-regulated under re-oxygenation. Because NONHSAT135851.2 was located in the human mitochondrial genome and had different expression levels under different oxygen concentrations, we renamed it mitochondrial oxygen responsive transcript 1 (MTORT1), which it is called hereafter.
First, we separated the mitochondrial, cytoplasmic, and nuclear fractions to determine the subcellular distribution of MTORT1 under normoxia (Figure 1A) or hypoxia (Figure 1B) in MCF-7 cells. As expected, the data showed that MTORT1 is mainly located in mitochondria. Next, we determined the endogenous expression of MTORT1 in breast cancer cells, including MCF-7 (luminal A), ZR-75-30 (luminal B) and MDA-MB-231 (triple negative) cells, and MCF-10A breast epithelial cells. The results showed that the expression of MTORT1 was lower in the breast cancer cells than in MCF-10A cells (Figure 1C), implying that MTORT1 might function as a tumor suppressor. Next, to validate that MTORT1 is a hypoxia-inducible lncRNA, quantitative RT-PCR was performed, resulting in similar changes in expression during hypoxia and re-oxygenation in MCF-7 and MDA-MB-231 cells (Figure 1D). In hypoxia mimic conditions, when cells were treated with CoCl2 under normoxia, the relative expression levels of MTORT1 were also up-regulated in MCF-7 and MDA-MB-231 cells (Figure 1E). Furthermore, we overexpressed HIF1A mutant and HIF2A mutant, which are resistant to O2-regulated prolyl hydroxylation in the oxygen-dependent degradation domain, and therefore resistant to VHL-mediated ubiquitination and degradation, to examine their effects on MTORT1 expression. HIF1A and HIF2A mRNA were successfully overexpressed under normoxia, and the relative expression levels of MTORT1 were also up-regulated in MCF-7 cells overexpressing the HIF-1α P402A/P564A mutant (Figure 1F) or the HIF-2α P405A/P531A mutant (Figure 1G). These results demonstrated that the mitochondrial lncRNA MTORT1 is an oxygen-responsive lncRNA that is up-regulated under hypoxia and down-regulated under re-oxygenation in breast cancer cells.
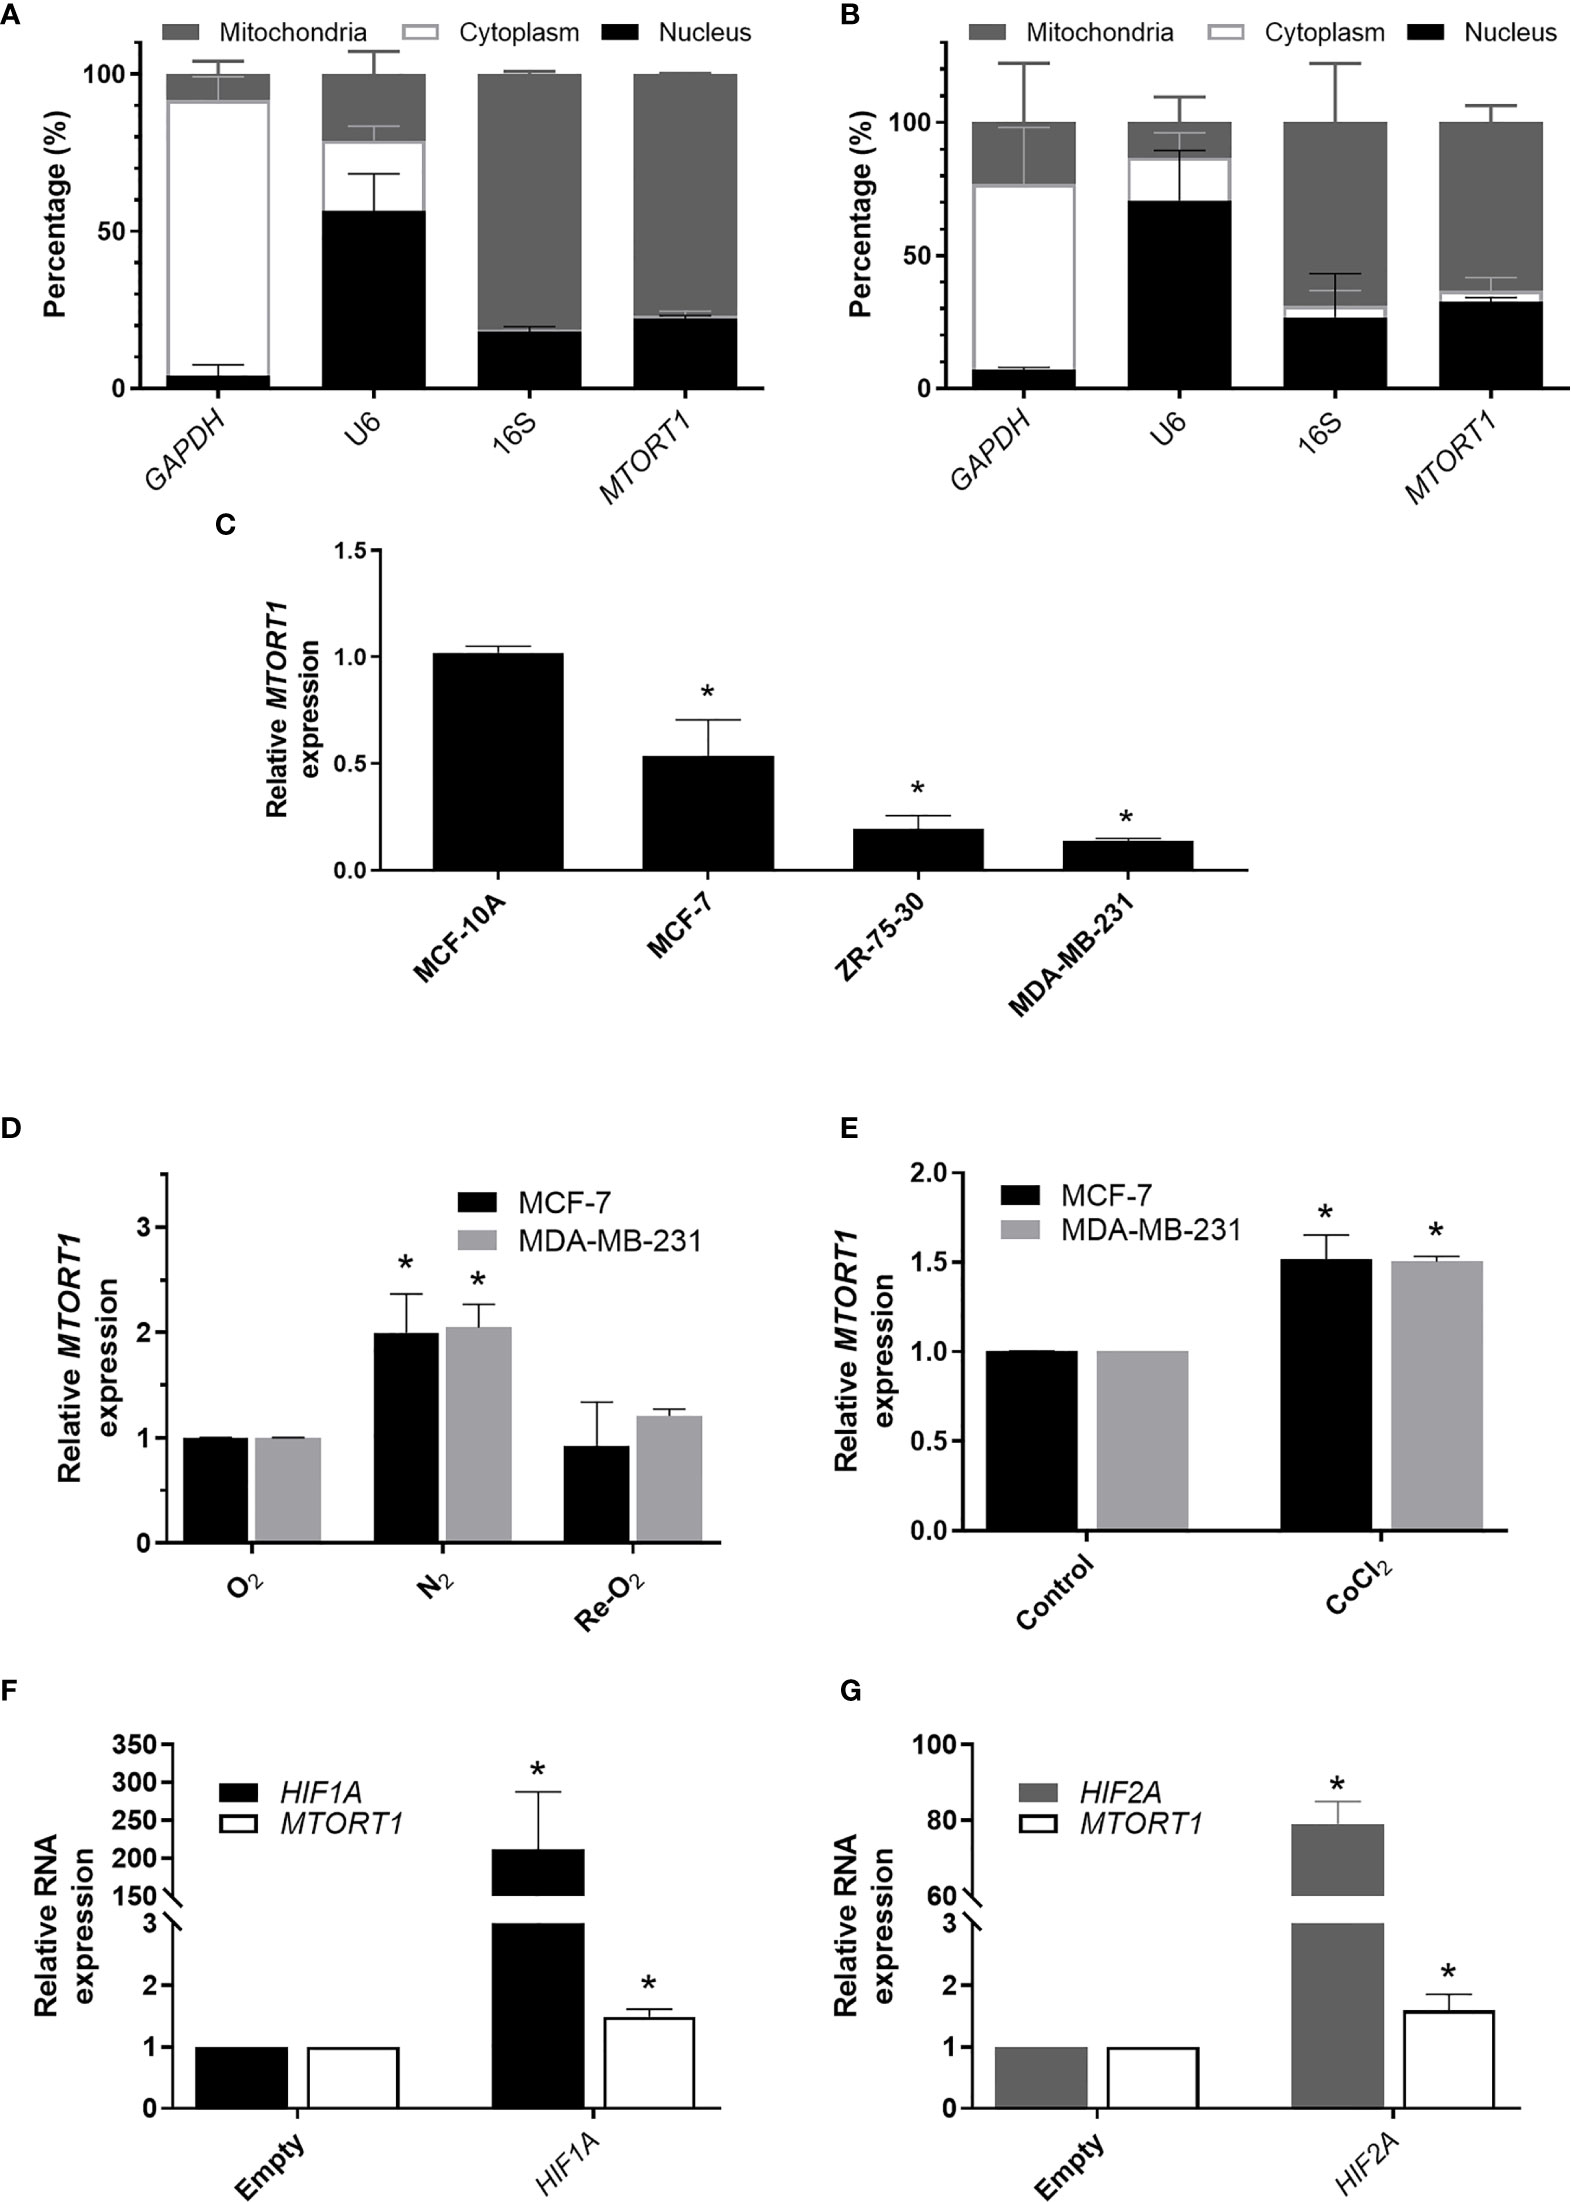
Figure 1 The mitochondrial lncRNA MTORT1 is up-regulated under hypoxia and down-regulated under re-oxygenation in breast cancer cells. (A, B) The subcellular distribution of MTORT1 in MCF-7 cells under normoxia (A) or hypoxia (B). Relative abundance of RNA was measured by quantitative RT-PCR and normalized to total RNA. GAPDH, a cytosolic marker; U6, a nuclear marker; 16S, a mitochondrial marker. (C) Relative endogenous expression levels of MTORT1 in breast cancer cells, including MCF-7, ZR-75-30, and MDA-MB-231 cells, and MCF-10A breast epithelial cells. The expression levels were measured by quantitative RT-PCR and normalized to 18S rRNA. The relative expression levels in each cell line were compared with MCF-10A. (D) Relative expression levels of MTORT1 in MCF-7 and MDA-MB-231 cells under different oxygen concentrations were measured by quantitative RT-PCR and normalized to 18S rRNA. The relative expression levels of each condition were compared with the normoxic group. (E) Relative expression levels of MTORT1 in MCF-7 and MDA-MB-231 cells treated with 200 μM CoCl2 for 24 h. (F) Relative expression levels of HIF-1A and MTORT1 in MCF-7 cells overexpressing HIF-1α P402A/P564A mutant, which is resistant to VHL-mediated ubiquitination and degradation. (G) Relative expression of HIF-2A and MTORT1 in MCF-7 cells overexpressing HIF-2α P405A/P531A mutant, which is resistant to VHL-mediated ubiquitination and degradation. The results are means ± SDs (n = 3). *P < 0.05.
Since MTORT1 was a novel lncRNA, in order to investigate its function, the genes affected downstream of MTORT1 were identified using microarrays. Total RNA was extracted from MCF-7 cells treated with siRNA against MTORT1 under normoxia. Differentially expressed genes were identified by Illumina Human HT−12 v4 Bead Chips. As shown in Figure 2A, MTORT1 RNA levels were successfully knocked down in MCF-7 cells. To illustrate the differing expression profiles between MTORT1-knockdown and control cells, principal component analysis was performed after quantile normalization. As shown in Figure 2B, the distribution between MTORT1-knockdown samples (red spots) and the controls (blue spots) was separate, indicating different expression profiles.
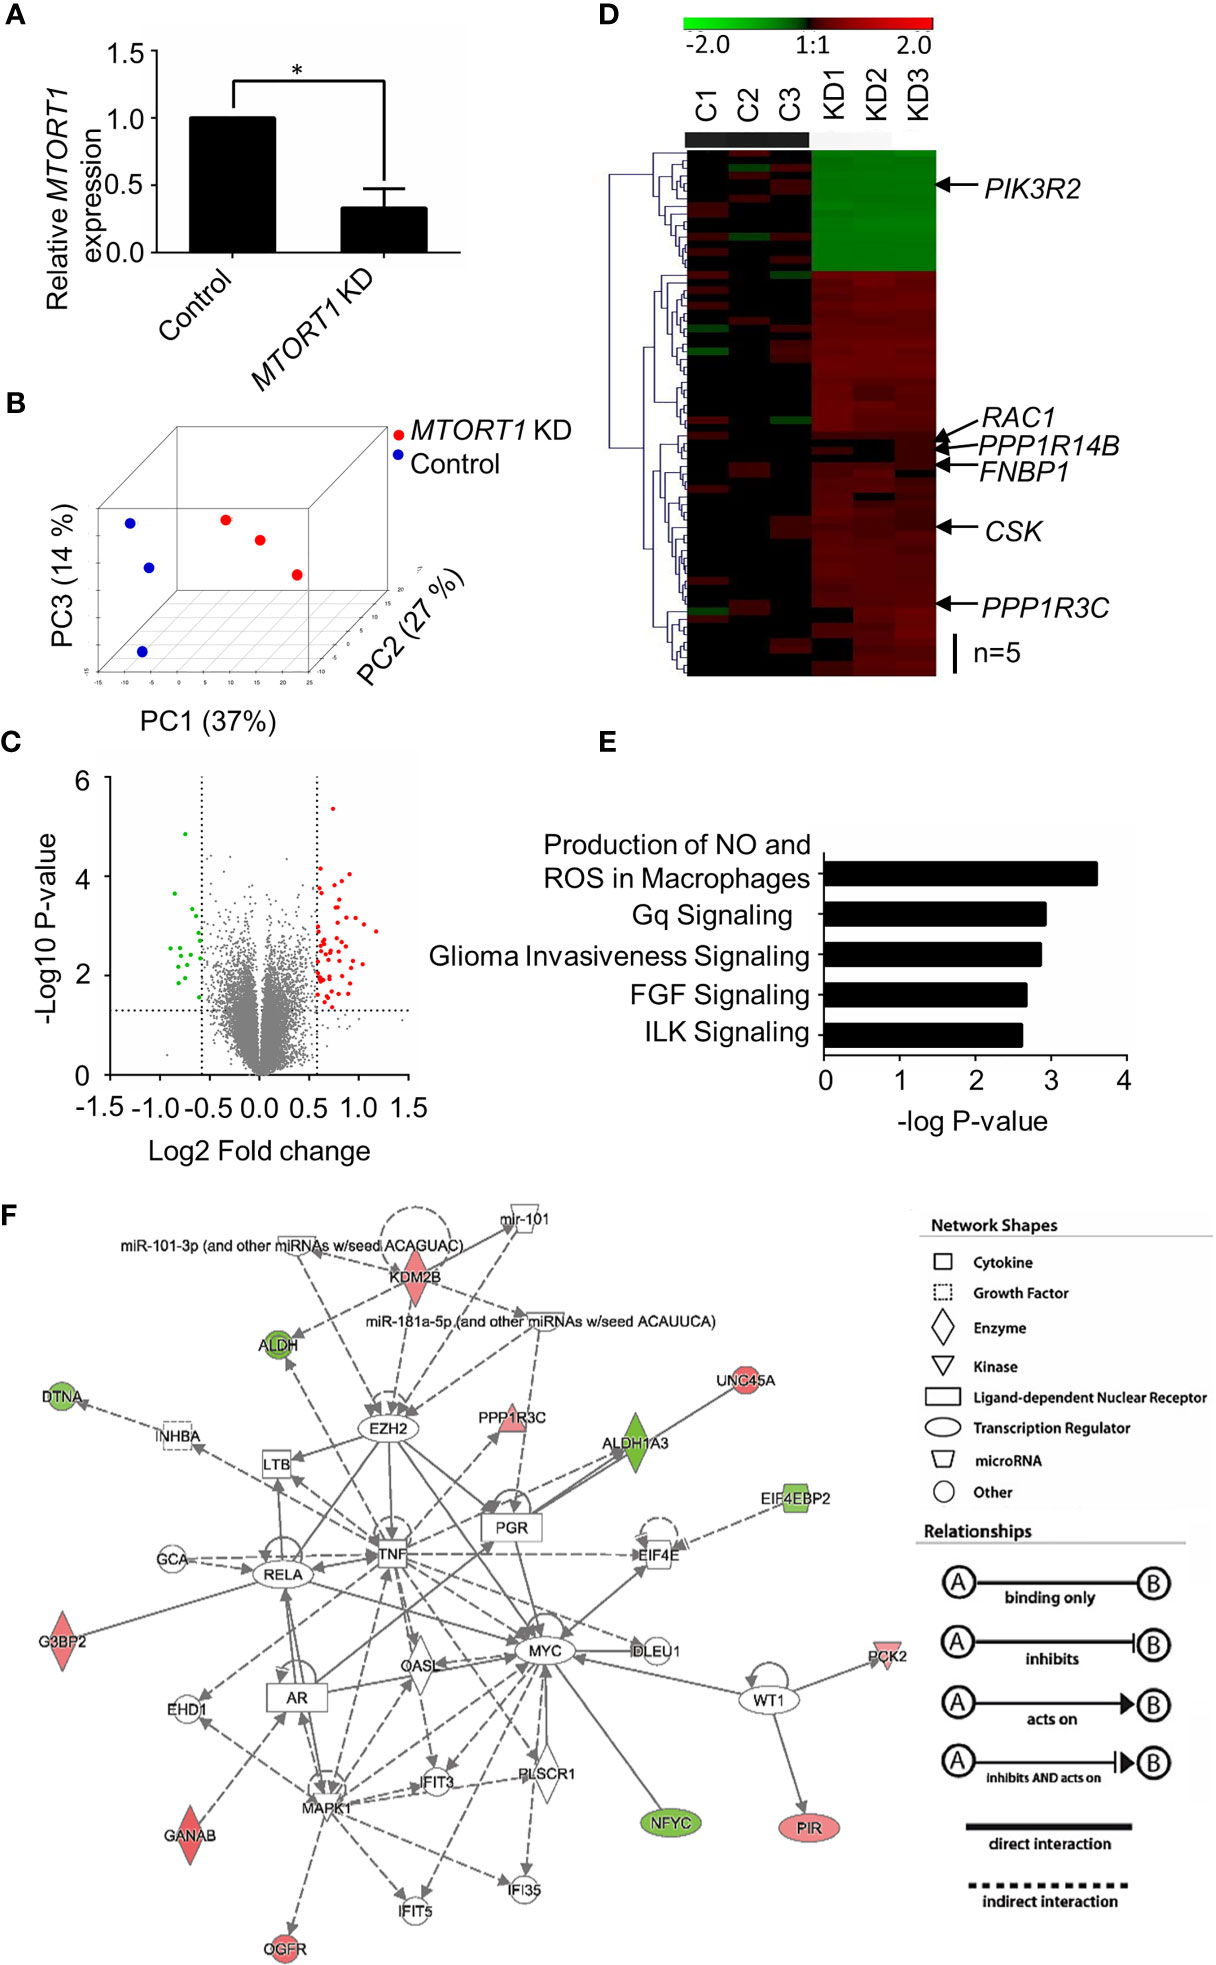
Figure 2 Identification of MTORT1-downstream genes by microarray analysis. (A) Relative expression levels of MTORT1 in MCF-7 cells treated with siRNA against MTORT1. Expression levels were measured by quantitative RT-PCR and normalized to 18S rRNA. *P < 0.05. (B) Principal component (PC) analysis of MTORT1 knockdown (KD) cells. PCs were plotted by the expression profiles of differentially expressed probes after quantile normalization. Each dot represents a sample. (C) Volcano plot of differentially expressed genes in MTORT1 knockdown cells. Red points: up-regulated genes in MTORT1 knockdown cells; green points: down-regulated genes; gray points: non-significant genes. (D) Heatmap and hierarchical cluster analysis of MTORT1-downstream genes. The labeled genes were validated by quantitative RT-PCR. Red color: up-regulated genes in MTORT1 knockdown cells; green color: down-regulated genes; black color, non-significant genes. (E) The top five canonical pathways that MTORT1-downstream genes were enriched in, according to Ingenuity Pathway Analysis. (F) Representative network of MTORT1-downstream genes involved in cellular development, cellular growth, and proliferation. Red shapes represent genes that were up-regulated in MTORT1 knockdown cells; green shapes represent down-regulated genes.
To determine differential gene expression, MTORT1-knockdown and control cells were examined by Student’s t test, and the criteria for MTORT1-downstream genes was fold change > 1.5 (log2 Fold change > 0.58) and a significant difference (P < 0.05) (Figure 2C). Sixty-nine genes met the criteria. Among these, 53 genes were up-regulated and 16 genes were down-regulated in MTORT1 knockdown cells (Figure 2D). The functions of these differentially expressed genes were analyzed by Ingenuity Pathway Analysis. As shown in Figure 2E, the top five pathways that MTORT1 is possibly involved in are Production of Nitric Oxide and Reactive Oxygen Species in Macrophages, Gq Signaling, Glioma Invasiveness Signaling, FGF Signaling, and ILK Signaling. In addition, network analysis showed that some of the MTORT1-regulated genes are involved in cellular development, cellular growth, and proliferation (Figure 2F).
To validate the results of the microarray analysis, the genes involved in the top 5 pathways and their interaction networks were measured by quantitative RT-PCR. The data of RT-PCR (Figure 3A) showed a similar pattern to those of microarray (Figure 2D) in MTORT1 knockdown cells. Since microarray Illumina Human HT−12 v4 Bead Chips did not contain probes for mitochondrial genes, their expression levels in MTORT1 knockdown cells were measured separately by quantitative RT-PCR. The results surprisingly revealed that only MTND-5 was down-regulated in MTORT1 knockdown cells (Figure 3B).
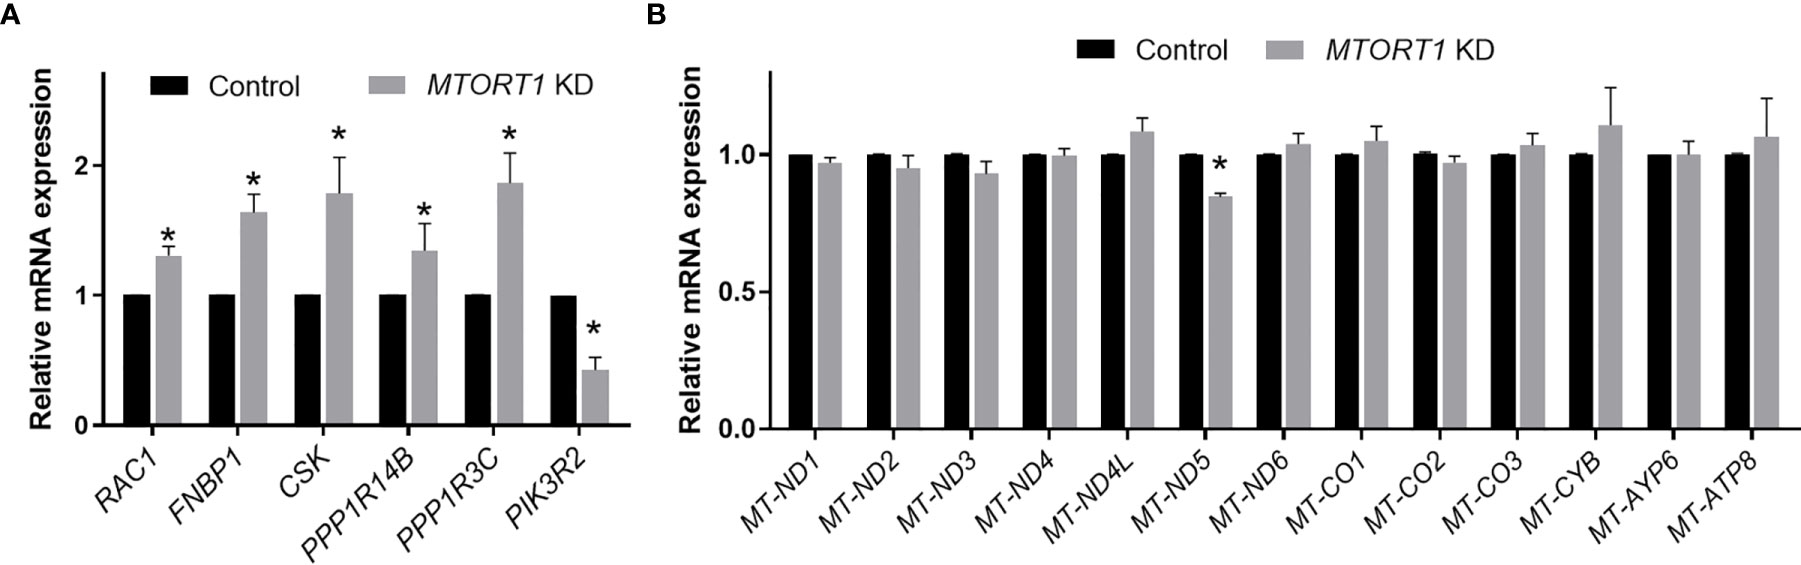
Figure 3 Expression profiles of MTORT1-downstream genes and mitochondrial genes in MTORT1 knockdown cells. Relative expression levels of selected MTORT1-dwonstream genes (A) and mitochondrial genes (B) in MCF-7 cells treated with siRNA against MTORT1 were measured by quantitative RT-PCR and normalized to 18S rRNA (A) or 16S rRNA (B). The results are means ± SDs (n = 3). *P < 0.05.
Since the results of the network analysis indicated that MTORT1-downstream genes were involved in cellular development, cellular growth, and proliferation (Figure 2F), the effects of MTORT1 on cell proliferation were determined by MTT assays. The data showed a significant increment of relative growth ratio in MCF-7 (Figure 4A) and MDA-MB-231 (Figure 4B) cells treated with siRNA against MTORT1. In addition, knockdown of MTORT1 facilitated colony formation in MCF-7 (Figure 4C) and MDA-MB-231 (Figure 4D) cells. These results indicated that MTORT1 has suppressive effects on cell proliferation and colony formation in breast cancer cells.
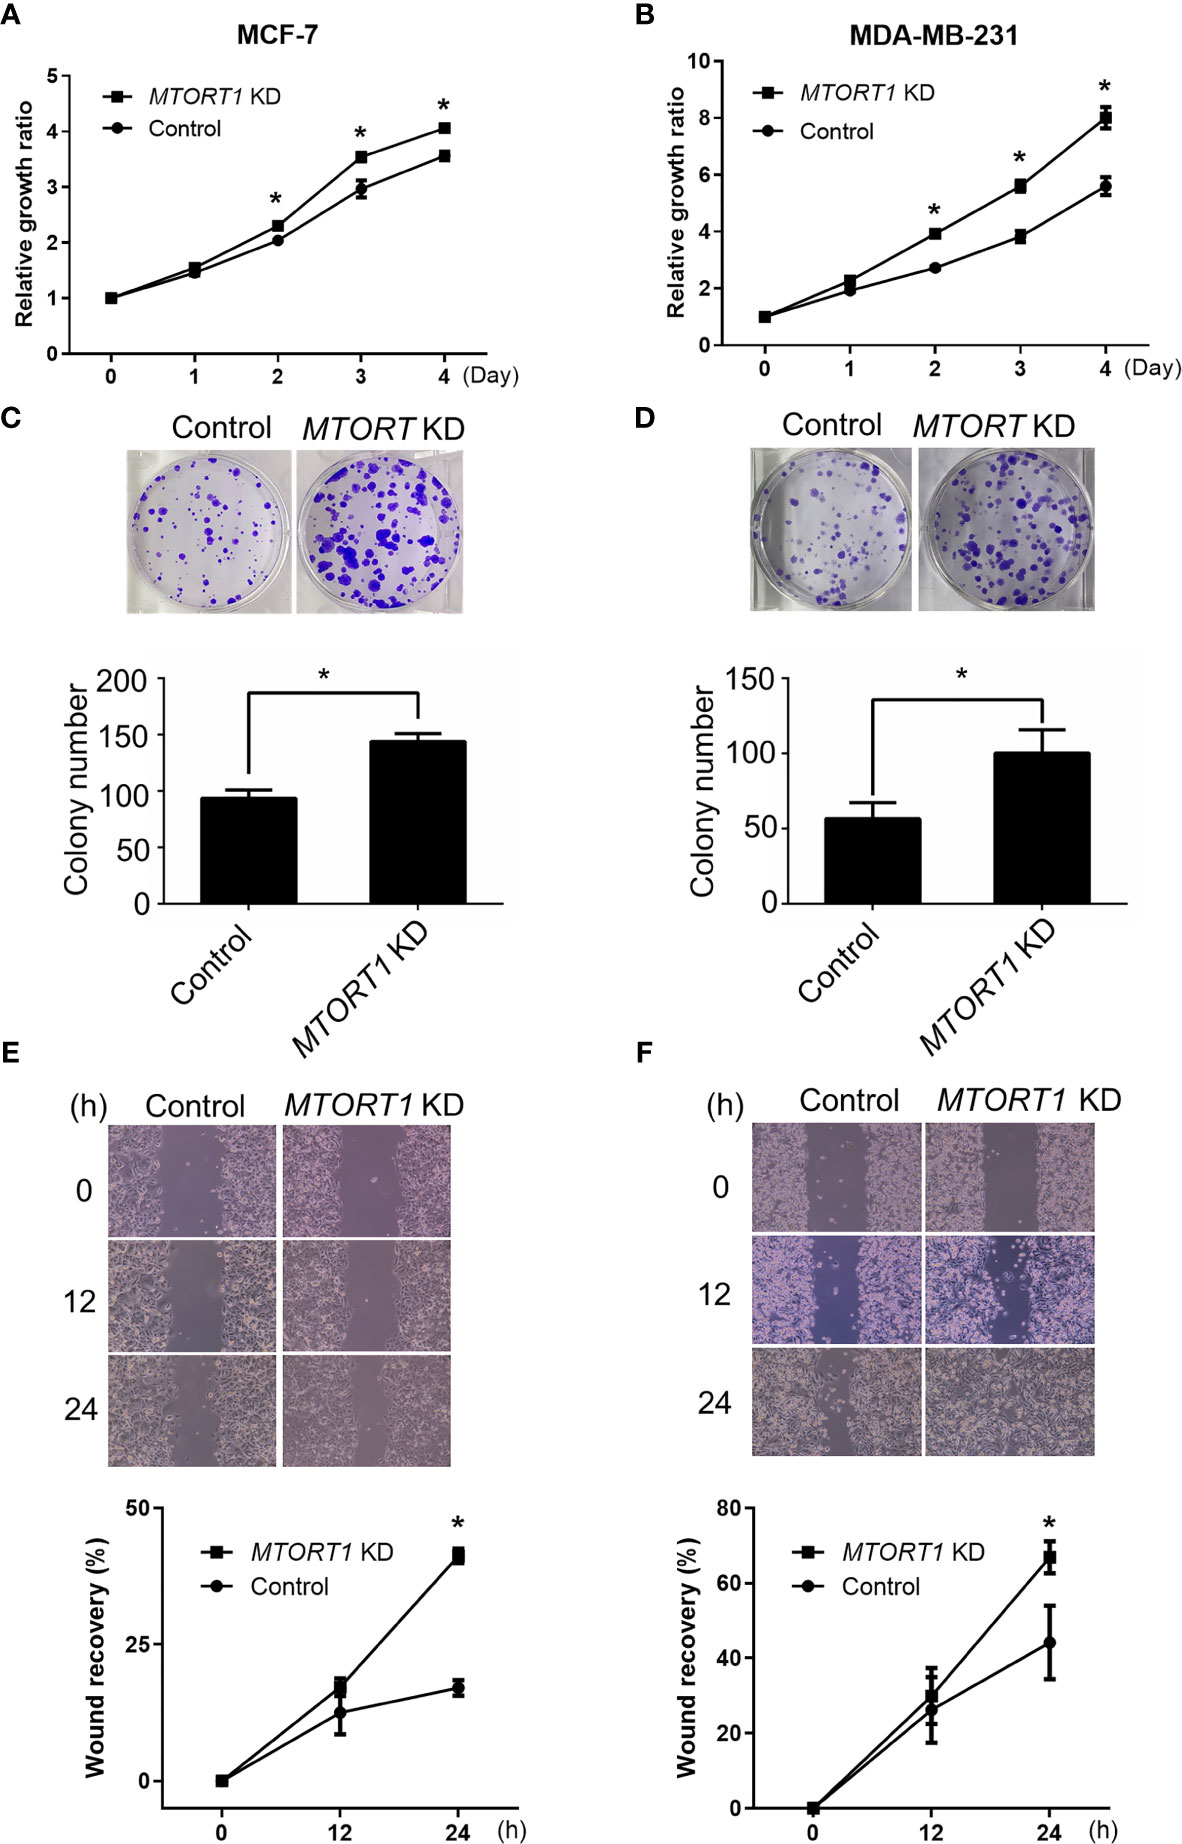
Figure 4 Knockdown of MTORT1 enhances cell proliferation, migration, and invasion. (A, B) Cell proliferation using MTT assays. Cell growth was measured in MCF-7 (A) and MDA-MB-231 (B) cells treated with siRNA against MTORT1. The growth ratio was normalized to day zero. (C, D) Colony formation assay. Top: Representative images were taken of MCF-7 (C) and MDA-MB-231 (D) cells. Bottom: Quantification of colony counts. Colonies with cell numbers greater than fifty were counted. (E, F) Wound healing assay. Top: Representative images were taken of MCF-7 (E) and MDA-MB-231 (F) cells. Bottom: Quantification of wound recovery. The gap area was imaged at 0, 12, and 24 h. The percentage of wound recovery was compared to the wound area at 0 h. The results are means ± SDs (n = 3). *P < 0.05.
Next, the effects of MTORT1 on cell mobility were examined by wound healing assays. The results revealed that knockdown of MTORT1 significantly promoted the migration ability of MCF-7 (Figure 4E) and MDA-MB-231 (Figure 4F) cells. These results suggested that MTORT1 inhibits cell migration.
Since RNA transcripts can function as miRNA sponges, we next explored whether the novel lncRNA MTORT1 had such a function. First, we predicted the miRNAs that MTORT1 possibly bound and their binding sites on MTORT1 using miRDB (26). Among the predicted miRNA candidates, the relative abundance of the miRNAs expressed in mitochondria were measured by quantitative RT-PCR. Among them, miR-181c was reported to localize mainly to the mitochondria (27), and was chosen as a positive control. As shown in Figure 5A, miR-26b-5p, miR-26a-5p, and miR-1297 were significantly (P < 0.05) enriched in the mitochondria of MCF-7 cells. Furthermore, the relative expression levels of miR-26a-5p and miR-1297 were up-regulated in MTORT1 knockdown cells (Figure 5B). These results indicated that MTORT1 might serve as a miRNA sponge for miR-26a-5p and miR-1297. To further explore this, we examined the interaction between MTORT1 and AGO2, an essential component of the RNA-induced silencing complex, which incorporates miRNA to interfere with RNA. RIP assays using anti-AGO2 antibody were performed, followed by quantitative RT-PCR. MTORT1 (Figure 5C), miR-26a-5p (Figure 5D), and miR-1297 (Figure 5E) were all significantly (P < 0.05) enriched in AGO2 immunoprecipitates as compared to those of IgG. Taken together, these results demonstrated that MTORT1 could serve as a miRNA sponge.
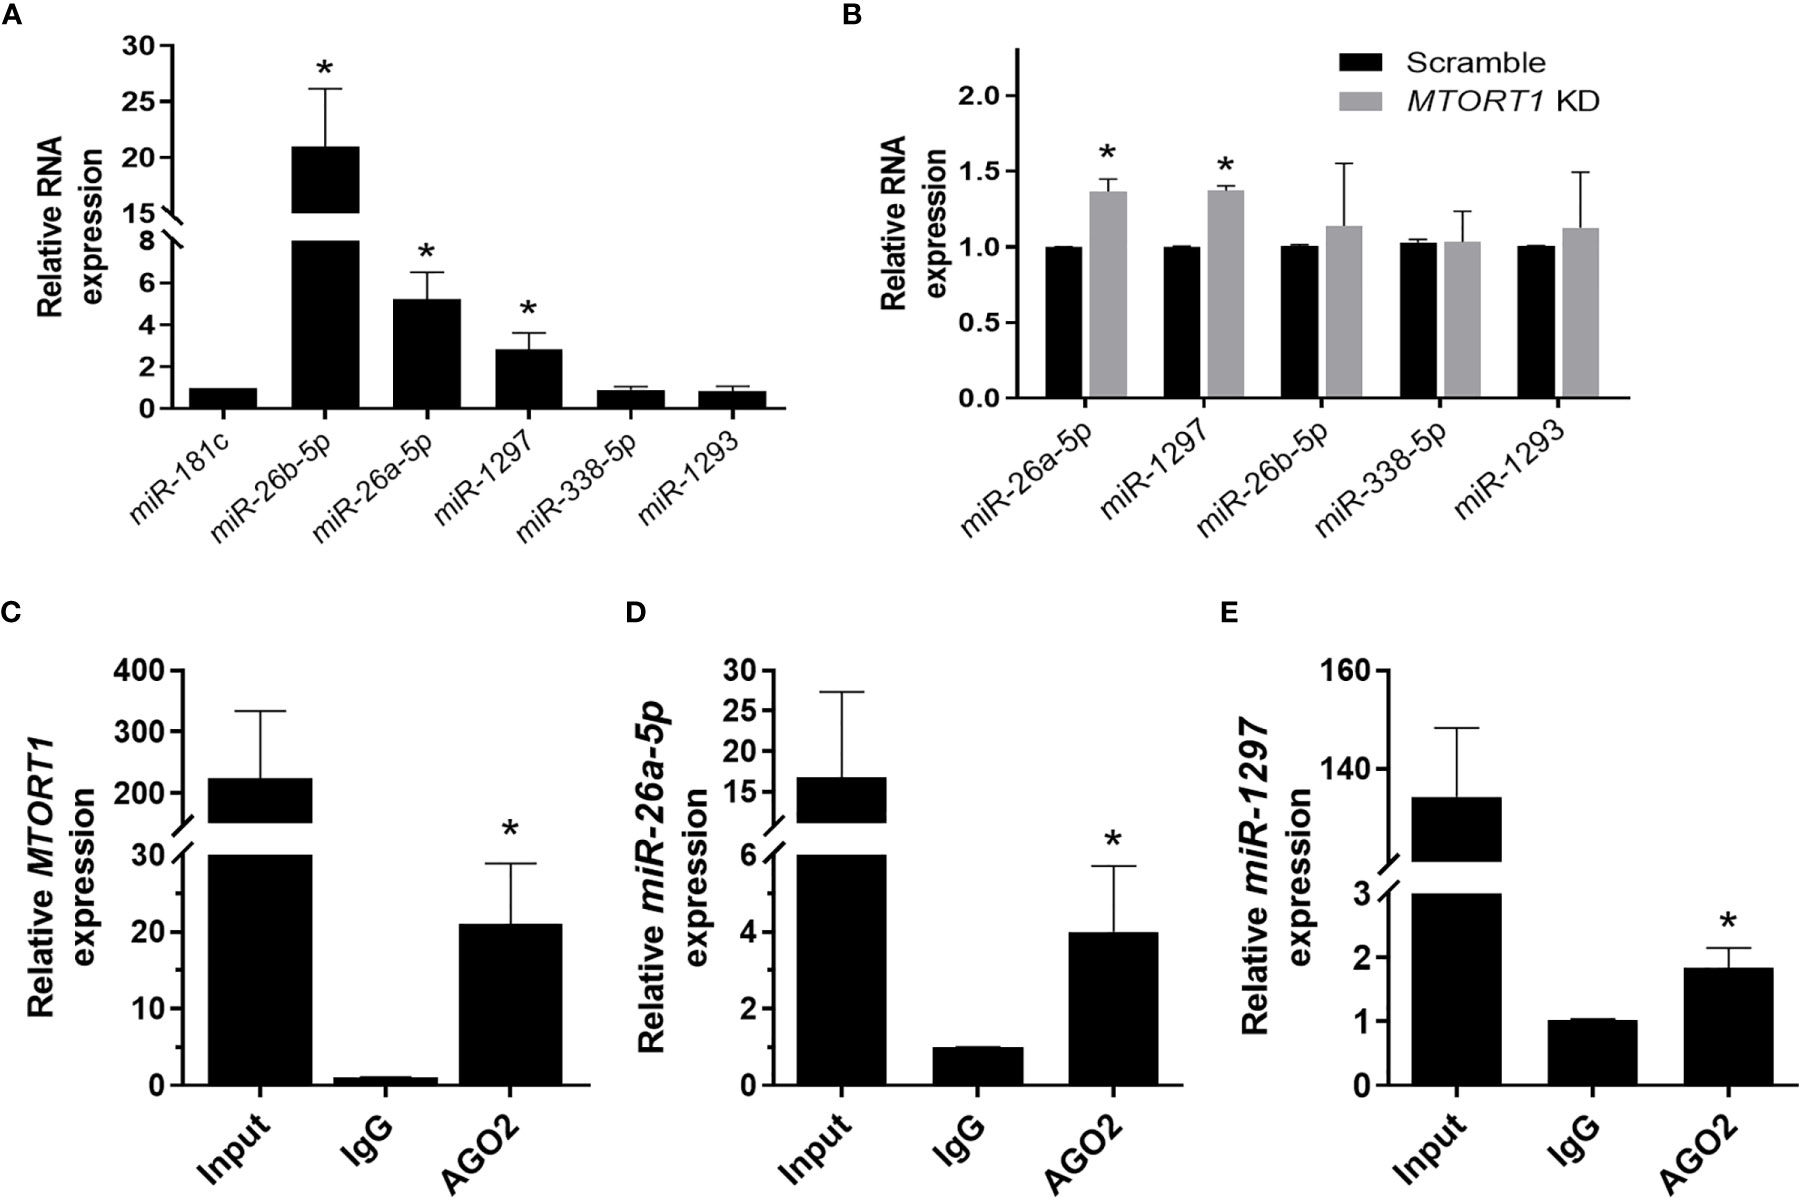
Figure 5 MTORT1 serves as a miRNA sponge. (A) Enrichment of miRNA candidates in mitochondria in MCF-7 cells. Candidates of miRNA were predicted using miRDB (26). Relative expression levels of miRNA were measured by quantitative RT-PCR and compared to that of miR-181c, which was reported as a mitochondrial miRNA. (B) Relative expression levels of miRNA candidates in MTORT1 knockdown cells were measured by quantitative RT-PCR and normalized to 18S rRNA. (C–E) RNA immunoprecipitation analysis of MTORT1 (C), miR-26a-5p (D), and miR-1297 (E) using antibody against AGO2 in MCF-7 cells. Relative expression levels of AGO2-enriched non-coding RNA were measured by quantitative RT-PCR and compared to those pulled down by IgG. The results are means ± SDs (n = 3). *P < 0.05.
Furthermore, to investigate the effects of the sponged miRNA on MTORT1, we chose miR-26a-5p for further experiments. First, MTORT1 was inserted into the 3’ UTR of the luciferase gene in the pMIR-REPORT vector, and the predicted binding site of miR-26a-5p (143-149 nt) was changed to its complementary bases (pMIR-REPORT-MTORT1 mutant) (Figure 6A). As shown in Figure 6B, overexpression of miR-26a-5p reduced the luciferase activity of pMIR-REPORT-MTORT1, whereas it failed to reduce the luciferase activity of the pMIR-REPORT-MTORT1 mutant (Figure 6B). Furthermore, MTORT1 was down-regulated in HEK293T cells overexpressing miR-26a-5p (Figure 6C). These data suggested the reciprocal inhibition of MTORT1 and miR-26a-5p.
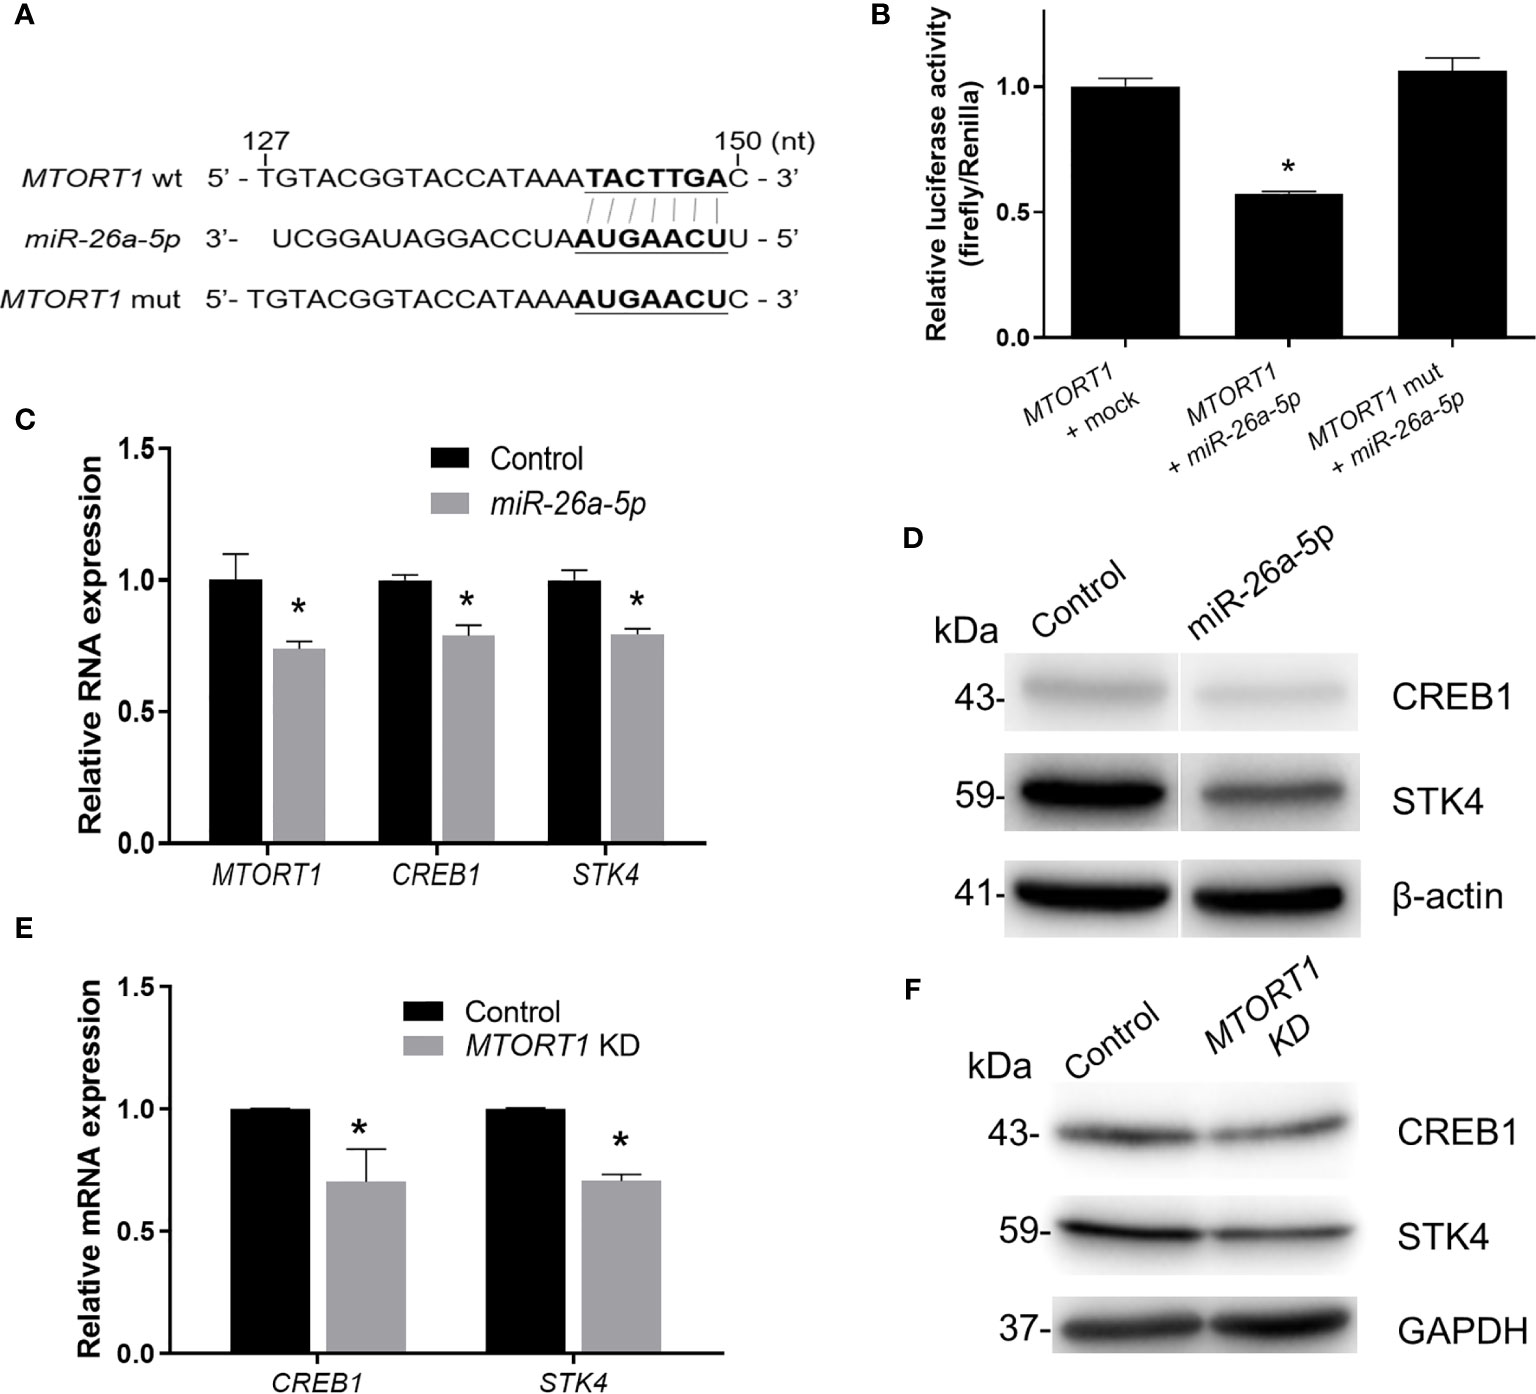
Figure 6 MTORT1 up-regulates CREB1 and STK4 by directly interacting with miR-26a-5p. (A) Schematic diagram of the 3’ UTR of firefly luciferase constructs showing the sequence of MTORT1 and the mutation of the miR-26a-5p binding site. The putative binding sequence was predicted by miRDB (26). wt, wild-type; mut, mutation. (B) Luciferase reporter assays in HEK-293T cells overexpressing miR-26a-5p. HEK293T cells were co-transfected with pMIR-REPORT-MTORT1 or its mutant (pMIR-REPORT-MTORT1 mutant), miR-26a-5p mimics, and Renilla luciferase plasmid (pGL4.74 [hRluc/TK]). Activity of firefly luciferase was normalized to the activity of Renilla luciferase. (C) Relative expression levels of MTORT1 in HEK293T cells overexpressing miR-26a-5p were measured by quantitative RT-PCR and normalized to 18S rRNA. Relative expression levels of miR-26a-5p downstream genes CREB1 and STK4 are also shown. (D) Western blotting of CREB1 and STK4 in HEK293T cells overexpressing miR-26a-5p. β-actin: loading control. (E) Relative expression levels of miR-26a-5p downstream genes, CREB1 and STK4, in MCF-7 cells treated with siRNA against MTORT1. The results are means ± SDs (n = 3). *P < 0.05. (F) Western blotting of CREB1 and STK4 in MCF-7 cells treated with siRNA against MTORT1. GAPDH: loading control.
In addition, we predicted the target genes of miR-26a-5p using TargetScan 7.2 (28). Further examining the predicted target genes and the results of MTORT1-downstream genes using microarray analysis (Figure 2D), we found that CREB1 and STK4 might be the target genes of miR-26a-5p. The relative expression levels and protein amounts of CREB1 and STK4 were down-regulated in HEK293T cells overexpressing miR-26a-5p (Figures 6C, D). Also, the mRNA and protein amounts of CREB1 and STK4 were down-regulated in MCF-7 cells treated with siRNA against MTORT1 (Figures 6E, F). Taken together, these results demonstrated that MTORT1 serves as a miRNA sponge to regulate CREB1 and STK4 by directly interacting with miR-26a-5p.
Discussion
In this study, we demonstrated that MTORT1 is up-regulated under hypoxia and down-regulated under re-oxygenation in breast cancer. MTORT1-downstream genes were identified in MCF-7 cells treated with siRNA against MTORT1 by microarray analysis. Sixty-nine genes were potentially regulated by MTORT1, and network analysis showed that MTORT1 was possibly involved in cellular growth and proliferation. Functional assays revealed that knockdown of MTORT1 enhanced cell proliferation and migration. Finally, RIP and luciferase reporter assays revealed that MTORT1 serves as sponge of miR-26a-5p to up-regulate its target genes, CREB1 and STK4.
In this study, we identified the oxygen-responsive mtlncRNA MTORT1, which was up-regulated under hypoxia (Figures 1D, E). Since MTORT1 is a novel mtlncRNA, no study has reported it before. Although it was mainly located in mitochondria, the fraction of MTORT1 in the nucleus under hypoxia (Figure 1B) was less than under normoxia (Figure 1A), implying that MTORT1 may serve as a retrograde signal, facilitating crosstalk between the mitochondria and the nucleus, like SncmtRNAs and ASncmtRNAs (21). MTORT1 was up-regulated in aerobic cells overexpressing HIF1A mutant and HIF2A mutant, suggesting that MTORT1 is regulated by HIF-1α and HIF-2α (Figures 1F, G). These results showed that MTORT1 may play a role under hypoxia. Therefore, to explore the function of MTORT1, we used microarrays to identify downstream genes of MTORT1. The top five pathways that MTORT1-downstream genes were involved in were production of nitric oxide and reactive oxygen species in macrophages, Gq signaling, glioma invasiveness signaling, FGF signaling, and ILK signaling (Figure 2E). The last four pathways are all involved in cancer progression. However, according to the network analysis, the differentially expressed genes involved in these pathways represent only about 5% of the total molecular content of each pathway. Examining the expression levels of mitochondrial mRNAs, only MT-ND5, encoding NADH dehydrogenase subunit 5 in a subunit of complex I, was down-regulated in MTORT1-knockdown cells (Figure 3B). These results suggested that MTORT1 may not have much effect at the transcriptional level and that it may instead play a role at other levels, such as post-transcription, translation, or post-translation.
Among the MTORT1-regulated genes, the network analysis showed some of them were involved in cellular growth and proliferation (Figure 2F). Functional assays revealed that knockdown of MTORT1 enhanced cell proliferation and migration (Figure 4), indicating that MTORT1 acts as a tumor suppressor.
The existence of regulatory mechanisms between miRNAs and lncRNAs has been reported previously. LncRNAs can act as miRNA sponges to decrease the miRNA levels. Conversely, miRNAs can decrease the expression of lncRNAs through a mechanism similar to RNA interference (29). The cooperation between lncRNAs and miRNAs modulates gene expression via complex post-transcriptional mechanisms (30). Here, we also found that MTORT1 could function as a miRNA sponge in mitochondria. Experimental validation showed that miR-26a-5p and miR-1297 were enriched in mitochondria (Figure 5A), up-regulated in MTORT1-knockdown cells (Figure 5B), and bound with MTORT1 in the RNA induced silencing complex (Figures 5C, E). Furthermore, luciferase reporter assays implied that miR-26a-5p could bind and inhibit MTORT1 (Figures 6B, C). These results indicated that MTORT1 served as a miRNA sponge and interacted with miR-26a-5p. However, how AGO2 and miR-26a-5p could selectively enter the mitochondria is still puzzling, and the mechanism of this relocation requires further investigation.
The expression levels of miR-26a-5p, CREB1, and STK4 from The Cancer Genome Atlas (TCGA) dataset were examined by using ENCORI (starbase.sysu.edu.cn). Although negative correlation between miR-26a-5p-CREB1 pair and miR-26a-5p - STK4 pair was observed in some cancers, there was no significant negative correlation in aggressive breast cancer tissues (data not shown). Reasons of this discrepancy may be due to the differences between cell line and clinical tissues. Another reason may be due to the malignancy of breast cancer. A less aggressive breast cell line MCF-7 was examined in this study; however, the aggressive breast cancer tissues were examined in TCGA. Therefore, more experiments are needed to explore the regulatory mechanism of CREB1 and STK4 regulated by miR-26a-5p.
In this study, we identified a novel oxygen-responsive lncRNA, MTORT1, in breast cancer MCF-7 cells and characterized the functions of MTORT1 and a regulatory mechanism of MTORT1 in mitochondria. However, there were some limitations in this study. In order to investigate MTORT1-downstream genes, using both overexpression and silencing of MTORT1 are optimal to reduce the false positives. However, when we tried to translocate MTORT1 containing the RP sequence into mitochondria (31), the efficiency of translocation was very low. Furthermore, the effects of the RP sequence, which was reported to be transported into mitochondria, in cancer cells outweighed the functions of MTORT1. Hence, siRNA were used to knock down MTORT1.
Conclusions
Our findings shed some light on the characterization, function, and regulatory mechanism of the novel hypoxia-induced mitochondrial lncRNA MTORT1. MTORT1-downstream genes are involved in cellular growth and proliferation of breast cancer cells. Lastly, MTORT1 may serve as sponge of miR-26a-5p to up-regulate its target genes, CREB1 and STK4. These data suggest that MTORT1 may be a candidate for developing novel therapeutic regimen to inhibit breast cancer progression.
Data Availability Statement
The datasets presented in this study can be found in online repositories. The names of the repository/repositories and accession number(s) can be found below: https://www.ncbi.nlm.nih.gov/geo/, GSE157060.
Ethics Statement
The study was approved by the Biosafety Committee of the College of Medicine, National Taiwan University [BG1050086].
Author Contributions
Y-CC, L-LC, and L-CL conceived and designed the experiments. Y-CC and L-YS performed the experiments. Y-CC, L-LC, and T-PL analyzed the data. L-HC, EC, and M-HT contributed reagents, materials, and/or analysis tools. Y-CC and L-CL wrote the paper. All authors reviewed the manuscript. All authors contributed to the article and approved the submitted version.
Funding
This work was supported by a grant from the Ministry of Science and Technology [MOST 109-2320-B-002-016-MY3, MOST-109-2314-B-182-030], and Chang Gung Memorial Hospital [CMRPD1H0611, CMRPD1I0141, CMRPD1I0142]. The funding source had no role in the design of this study and will not have any role in its execution or analysis, interpretation of the data, or the decision to publish the results.
Conflict of Interest
The authors declare that the research was conducted in the absence of any commercial or financial relationships that could be construed as a potential conflict of interest.
Acknowledgments
We thank Melissa Stauffer for editorial assistance. We also benefited from technical assistance from the Biomedical Resource Core at the 1st Core Facility Lab, NTU College of Medicine.
References
1. Sadri N, Zhang PJ. Hypoxia-Inducible Factors: Mediators of Cancer Progression; Prognostic and Therapeutic Targets in Soft Tissue Sarcomas. Cancers (2013) 5:320–33. doi: 10.3390/cancers5020320
2. Pugh CW, Gleadle J, Maxwell PH. Hypoxia and Oxidative Stress in Breast Cancer. Hypoxia Signalling Pathways. Breast Cancer Res (2001) 3:313–7. doi: 10.1186/bcr313
3. Tam SY, Wu VWC, Law HKW. Hypoxia-Induced Epithelial-Mesenchymal Transition in Cancers: Hif-1alpha and Beyond. Front Oncol (2020) 10:486. doi: 10.3389/fonc.2020.00486
4. Shi YH, Fang WG. Hypoxia-Inducible Factor-1 in Tumour Angiogenesis. World J Gastroenterol (2004) 10:1082–7. doi: 10.3748/wjg.v10.i8.1082
5. Span PN, Bussink J. The Role of Hypoxia and the Immune System in Tumor Radioresistance. Cancers (2019) 11:1555. doi: 10.3390/cancers11101555
6. Jing X, Yang F, Shao C, Wei K, Xie M, Shen H, et al. Role of Hypoxia in Cancer Therapy by Regulating the Tumor Microenvironment. Mol Cancer (2019) 18:157. doi: 10.1186/s12943-019-1089-9
7. Zong WX, Rabinowitz JD, White E. Mitochondria and Cancer. Mol Cell (2016) 61:667–76. doi: 10.1016/j.molcel.2016.02.011
8. Vander Heiden MG, Cantley LC, Thompson CB. Understanding the Warburg Effect: The Metabolic Requirements of Cell Proliferation. Science (2009) 324:1029–33. doi: 10.1126/science.1160809
9. Gatenby RA, Gillies RJ. Why do Cancers Have High Aerobic Glycolysis? Nat Rev Cancer (2004) 4:891–9. doi: 10.1038/nrc1478
10. Fogal V, Richardson AD, Karmali PP, Scheffler IE, Smith JW, Ruoslahti E. Mitochondrial p32 Protein is a Critical Regulator of Tumor Metabolism Via Maintenance of Oxidative Phosphorylation. Mol Cell Biol (2010) 30:1303–18. doi: 10.1128/MCB.01101-09
11. Rodriguez-Enriquez S, Carreno-Fuentes L, Gallardo-Perez JC, Saavedra E, Quezada H, Vega A, et al. Oxidative Phosphorylation is Impaired by Prolonged Hypoxia in Breast and Possibly in Cervix Carcinoma. Int J Biochem Cell Biol (2010) 42:1744–51. doi: 10.1016/j.biocel.2010.07.010
12. Fuhrmann DC, Brune B. Mitochondrial Composition and Function Under the Control of Hypoxia. Redox Biol (2017) 12:208–15. doi: 10.1016/j.redox.2017.02.012
13. West AP, Shadel GS, Ghosh S. Mitochondria in Innate Immune Responses. Nat Rev Immunol (2011) 11:389–402. doi: 10.1038/nri2975
14. Huo X, Han S, Wu G, Latchoumanin O, Zhou G, Hebbard L, et al. Dysregulated Long Noncoding RNAs (lncRNAs) in Hepatocellular Carcinoma: Implications for Tumorigenesis, Disease Progression, and Liver Cancer Stem Cells. Mol Cancer (2017) 16:165. doi: 10.1186/s12943-017-0734-4
15. Dhamija S, Diederichs S. From Junk to Master Regulators of Invasion: lncRNA Functions in Migration, EMT and Metastasis. Int J Cancer (2016) 139:269–80. doi: 10.1002/ijc.30039
16. Su J, Zhang E, Han L, Yin D, Liu Z, He X, et al. Long Noncoding RNA BLACAT1 Indicates a Poor Prognosis of Colorectal Cancer and Affects Cell Proliferation by Epigenetically Silencing of P15. Cell Death Dis (2017) 8:e2665. doi: 10.1038/cddis.2017.83
17. Fatima R, Akhade VS, Pal D, Rao SM. Long Noncoding RNAs in Development and Cancer: Potential Biomarkers and Therapeutic Targets. Mol Cell Ther (2015) 3:5. doi: 10.1186/s40591-015-0042-6
18. Huarte M. The Emerging Role of lncRNAs in Cancer. Nat Med (2015) 21:1253–61. doi: 10.1038/nm.3981
19. Zhao Y, Sun L, Wang RR, Hu JF, Cui J. The Effects of Mitochondria-Associated Long Noncoding RNAs in Cancer Mitochondria: New Players in an Old Arena. Crit Rev Oncol Hematol (2018) 131:76–82. doi: 10.1016/j.critrevonc.2018.08.005
20. Rackham O, Shearwood AM, Mercer TR, Davies SM, Mattick JS, Filipovska A. Long Noncoding RNAs are Generated From the Mitochondrial Genome and Regulated by Nuclear-Encoded Proteins. RNA (2011) 17:2085–93. doi: 10.1261/rna.029405.111
21. Dong Y, Yoshitomi T, Hu JF, Cui J. Long Noncoding RNAs Coordinate Functions Between Mitochondria and the Nucleus. Epigenet Chromatin (2017) 10:41. doi: 10.1186/s13072-017-0149-x
22. Landerer E, Villegas J, Burzio VA, Oliveira L, Villota C, Lopez C, et al. Nuclear Localization of the Mitochondrial ncRNAs in Normal and Cancer Cells. Cell Oncol (Dordr) (2011) 34:297–305. doi: 10.1007/s13402-011-0018-8
23. Lin HC, Yeh CC, Chao LY, Tsai MH, Chen HH, Chuang EY, et al. The Hypoxia-Responsive Lncrna NDRG-OT1 Promotes NDRG1 Degradation Via Ubiquitin-Mediated Proteolysis in Breast Cancer Cells. Oncotarget (2018) 9:10470–82. doi: 10.18632/oncotarget.23732
24. Schneider CA, Rasband WS, Eliceiri KW. Nih Image to ImageJ: 25 Years of Image Analysis. Nat Methods (2012) 9:671–5. doi: 10.1038/nmeth.2089
25. Fang S, Zhang L, Guo J, Niu Y, Wu Y, Li H, et al. NONCODEV5: A Comprehensive Annotation Database for Long non-Coding Rnas. Nucleic Acids Res (2018) 46:D308–14. doi: 10.1093/nar/gkx1107
26. Wong N, Wang X. miRDB: An Online Resource for microRNA Target Prediction and Functional Annotations. Nucleic Acids Res (2015) 43:D146–52. doi: 10.1093/nar/gku1104
27. Das S, Bedja D, Campbell N, Dunkerly B, Chenna V, Maitra A, et al. miR-181c Regulates the Mitochondrial Genome, Bioenergetics, and Propensity for Heart Failure In Vivo. PloS One (2014) 9:e96820. doi: 10.1371/journal.pone.0096820
28. Agarwal V, Bell GW, Nam JW, Bartel DP. Predicting Effective microRNA Target Sites in Mammalian Mrnas. Elife (2015) 4:e05005. doi: 10.7554/eLife.05005
29. Poliseno L, Salmena L, Zhang J, Carver B, Haveman WJ, Pandolfi PP. A Coding-Independent Function of Gene and Pseudogene mRNAs Regulates Tumour Biology. Nature (2010) 465:1033–8. doi: 10.1038/nature09144
30. Yoon JH, Abdelmohsen K, Gorospe M. Functional Interactions Among microRNAs and Long Noncoding Rnas. Semin Cell Dev Biol (2014) 34:9–14. doi: 10.1016/j.semcdb.2014.05.015
Keywords: long noncoding RNA, mitochondria, hypoxia, function, microRNA, breast cancer
Citation: Cheng Y-C, Su L-Y, Chen L-H, Lu T-P, Chuang EY, Tsai M-H, Chuang L-L and Lai L-C (2021) Regulatory Mechanisms and Functional Roles of Hypoxia-Induced Long Non-Coding RNA MTORT1 in Breast Cancer Cells. Front. Oncol. 11:663114. doi: 10.3389/fonc.2021.663114
Received: 02 February 2021; Accepted: 04 May 2021;
Published: 01 June 2021.
Edited by:
Aamir Ahmad, University of Alabama at Birmingham, United StatesReviewed by:
Gaofeng Liang, Henan University of Science and Technology, ChinaPeng-Chan Lin, National Cheng Kung University, Taiwan
Copyright © 2021 Cheng, Su, Chen, Lu, Chuang, Tsai, Chuang and Lai. This is an open-access article distributed under the terms of the Creative Commons Attribution License (CC BY). The use, distribution or reproduction in other forums is permitted, provided the original author(s) and the copyright owner(s) are credited and that the original publication in this journal is cited, in accordance with accepted academic practice. No use, distribution or reproduction is permitted which does not comply with these terms.
*Correspondence: Liang-Chuan Lai, llai@ntu.edu.tw; Li-Ling Chuang, lchuang@gap.cgu.edu.tw