 Mauricio Rocha Dourado1†
 Amr Elseragy2†
 Bruno Cesar da Costa1
 Fábio Haach Téo1Gustavo Narvaes Guimarães3
 Renato Assis Machado1,4
 Maija Risteli2Wafa Wahbi5
 Clarissa Araujo Gurgel Rocha6,7,8Lívia Máris Ribeiro Paranaíba9
 Wilfredo Alejandro González-Arriagada10Sabrina Daniela da Silva11Ana Lucia Carrinho Ayroza Rangel12
 Marcelo Rocha Marques3
 Carlos Rossa Junior13
 Tuula Salo2,5,14
 Ricardo D. Coletta1*
- 1Department of Oral Diagnosis, and Graduate Program in Oral Biology, Piracicaba Dental School, University of Campinas, Piracicaba, São Paulo, Brazil
- 2Cancer and Translational Medicine Research Unit, Faculty of Medicine, and Medical Research Center, Oulu University Hospital, University of Oulu, Oulu, Finland
- 3Department of Biosciences and Graduate Program in Oral Biology, Piracicaba Dental School, University of Campinas, Piracicaba, São Paulo, Brazil
- 4Hospital for Rehabilitation of Craniofacial Anomalies, University of São Paulo (HRAC/USP), Bauru, São Paulo, Brazil
- 5Department of Oral and Maxillofacial Diseases, Helsinki University Central Hospital, and Translational Immunology Research Program (TRIMM), University of Helsinki, Helsinki, Finland
- 6Gonçalo Moniz Institute, Oswaldo Cruz Foundation, Salvador, Bahia, Brazil
- 7Federal University of Bahia, Salvador, Bahia, Brazil
- 8Center for Biotechnology and Cell Therapy, D’Or Institute for Research and Education (IDOR), Salvador, Brazil
- 9Department of Pathology and Parasitology, Institute of Biomedical Sciences, Federal University of Alfenas, Alfenas, Minas Gerais, Brazil
- 10Facultad de Odontología, and Centro de Investigación e Innovación Biomédica (CIIB), Universidad de los Andes, Santiago, Chile
- 11Lady Davis Institute for Medical Research and Segal Cancer Center, Jewish General Hospital, and Department of Otolaryngology-Head and Neck Surgery, McGill University, Montreal, QC, Canada
- 12Department of Oral Pathology and Oral Medicine, Dental School, Western Paranaí State University, Cascavel, Paraná, Brazil
- 13Department of Diagnosis and Surgery, School of Dentistry at Araraquara, São Paulo State University (UNESP), Araraquara, São Paulo, Brazil
- 14HUSLAB, Department of Pathology, Helsinki University Central Hospital, University of Helsinki, Helsinki, Finland
Objective: Although there have been remarkable achievements in the molecular landscape of oral squamous cell carcinoma (OSCC) in recent years, bringing advances in the understanding of its pathogenesis, development and progression, little has been applied in the prognosis and choosing the optimal treatment. In this study, we explored the influence of the stress induced phosphoprotein 1 (STIP1), which is frequently reported to be highly expressed in many cancers, in OSCCs.
Methods: STIP1 expression was assessed in the TCGA database and in two independent cohorts by immunohistochemistry. Knockdown strategy was applied in OSCC cell lines to determine the impact of STIP1 on viability, proliferation, migration and invasion. The zebrafish model was applied for studying tumor formation and metastasis in vivo. The association of STIP1 and miR-218-5p was explored by bioinformatics and mimics transfection.
Results: STIP1 was highly expressed in OSCCs and significantly associated with shortened survival and higher risk of recurrence. STIP1 down-regulation decreased proliferation, migration and invasion of tumor cells, and reduced the number of metastases in the Zebrafish model. STIP1 and miR-218-5p were inversely expressed, and the transfection of miR-218-5p mimics into OSCC cells decreased STIP1 levels as well as proliferation, migration and invasion.
Conclusion: Our findings show that STIP1 overexpression, which is inversely associated with miR-218-5p levels, contributes to OSCC aggressiveness by controlling proliferation, migration and invasion and is a determinant of poor prognosis.
Introduction
Oral squamous cell carcinoma (OSCC) is the most common malignant head and neck tumor, with high prevalence worldwide (1). Despite advancements in multidisciplinary therapy, there has not been significant improvement in the survival of OSCC patients in the last decades. Epidemiologic data shows that OSCC patients have less than a 50% survival rate within 5 years, which is worsen in advanced cases (2, 3). Besides its heterogeneous and aggressive behavior, the lack of accurate tumor markers for choosing the optimal therapy and predicting the risk of recurrence and survival contribute to a high mortality rate (4). In recent years, large-scale studies have compiled a comprehensive catalog of the main cancer-related alterations to overcome those drawbacks, and accurately classify and define more effective therapies.
In two previous studies we have integrated laser capture microdissection and mass spectrometry analysis to characterize the proteome of OSCC cells. In the first study, the proteome of OSCC cells was compared with normal oral epithelial cells (5), whereas in the second we explored the expression profile of OSCC cells during the invasive process (6). Among many misexpressed proteins was the stress induced phosphoprotein 1 (STIP1), also known as HSP70/HSP90 organizing protein (HOP). STIP1 acts in combination with HSP70 and HSP90 proteins as a chaperone that assist the folding and assembling of nascent polypeptides, and the holding, folding or degradation of damaged proteins (7). The 62 kDa protein (543 amino acids) is composed of five major domains, including three tetratricopeptide repeat domains and two domains rich in aspartate and proline, which are capable of interacting with HSP90 and HSP70 during chaperone machine activation (8, 9). Although STIP1 is mainly found in the cytoplasm of the cells in most tissues, it has been detected in extracellular vesicles released by both normal and tumor cells (10–12). Aside from its canonical role of controlling protein folding, the studies are revealing that STIP1 influences numerous other cellular processes including proliferation, apoptosis and invasion (13–15), and STIP1 expression is correlated with chemoresistance (16) and poor outcome of patients with different types of cancers, including breast, liver and ovarian cancer (17–19). Mechanistically, it was showed that STIP1 may activate distinct signaling pathways in the context of the specific cell type and cancer biology, including PI3K/Akt (14), Wnt/β-catenin (20, 21), ERK1/2 (22), JAK2/STAT3 (16, 23) and ALK2-SMAD1/5 (11). The impact of STIP1 in different types of cancers and the pathways activated by its overexpression were extensively revised in a recent study (7). Little is known about the biological regulation of STIP1 in head and neck cancers. High STIP1 expression was associated with shorter overall survival in patients with papillary thyroid carcinoma (24), and STIP1 serological autoantibodies were correlated with early-stage esophageal squamous cell carcinomas (25, 26). Here, we found that STIP1 is overexpressed in OSCCs compared to non-tumor tissues, and its overexpression is an independent prognostic marker for poor outcomes, making it an attractive therapeutic target. We also show that knockdown of STIP1 levels causes decreased proliferation, migration and invasion of OSCC cells, and further demonstrate that miR-218-5p levels is closely correlated to STIP1 and its forced overexpression decreases STIP1 and the phenotypes-related to STIP1 overexpression.
Material and methods
Ethics approval and consent to participate
For the research using the human specimens, approval from the ethics review board of each of the hospitals affiliated with the collaborative study was obtained, and the study was approved by Human Research Ethics Committee of the School of Dentistry, University of Campinas (CAAE: 55927322.0.0000.5418). Written informed consent was obtained from participants in compliance with the World Medical Association Declaration of Helsinki, Ethical Principles for Medical Research Involving Human Subjects. Approval for the Zebrafish experiments was granted by the University of Helsinki under the ethical permission (ESAVI/13139/04.10.05/2017) given by the regional state administrative agency.
Analyses of the cancer genome atlas data and bioinformatics
In the TCGA RNA-Seq data from 314 primary OSCCs and 44 normal adjacent tissues (non-tumor), the levels of STIP1 expression between tumor and non-tumor samples were initially compared. In addition, Kaplan-Meier curves for overall survival (OS), cancer-specific survival (CSS) and disease-free survival (DFS) were constructed based on STIP1 expression levels and patients’ data, and compared applying log-rank test. Using the OSCC samples only, microRNAs in an inverse expression correlation with STIP1 were searched, followed by comparison of the microRNA expression in the tumors and non-tumors. The target prediction programs, miRTarBase (27), TargetScan (28) and miRWalk (29), were used to confirm the microRNAs targeting STIP1 mRNA.
Patients and clinicopathological data
The cohorts used in this study were recently described by Dourado et al. (30). The cohort 1 was composed of 85 primary OSCCs and matched nonmalignant oral epithelial tissues, and 17 lymph node metastases, included in a tissue microarray (TMA), from patients treated at the Jewish General Hospital, Montreal (Canada), and the cohort 2 was composed of whole tumor sections derived from surgical specimens of 262 primary OSCCs diagnosed and treated in hospitals in Brazil, Chile and Finland. The main clinicopathological characteristics of the patients included in both cohorts are depicted in Supplementary Table 1.
Immunohistochemistry and staining assessment
The immunohistochemical expression of STIP1 was assessed after the methods of Ferreira do Carmo et al. (31), using the rabbit anti-STIP1 antibody (1:3000, HPA039291, Sigma-Aldrich, USA). The reactions were scored by two pathologists, previous calibrated and assessed for inter-observer agreement (Cohen’s Kappa agreement rate of 0.80), using percentage of positive tumor cells (0, 1: 1%–25%, 2: 26%–50%, 3: 51%–75%, and 4:76%–100% staining) and intensity of the staining (0: negative, 1: weak, 2: moderate and 3: strong staining). The samples were categorized in two groups as low expression (<4 points) or high expression (≥4 points).
Cell lines
The human OSCC cell lines SCC4 (CRL-1624), SCC9 (CRL-1629), SCC15 (CRL-1623), SCC25 (CRL-1628), CAL27 (CRL-2095) (ATCC, Manassas, VA, USA) and HSC3 (JCRB 0623; Osaka National Institute of Health Sciences, Japan) were cultured in DMEM/F12 medium (1:1 mixture of Dulbecco’s modified Eagle’s medium and Ham’s F12 medium, Invitrogen, USA) supplemented with 10% fetal bovine serum (FBS), 400 ng/ml hydrocortisone (Sigma-Aldrich, USA) and a mixture of antibiotic-antimycotic (Invitrogen, USA). The normal human gingival keratinocyte cell line (HGK) was cultured in serum-free and low calcium media containing specific supplements and antibiotics (Gibco’s Keratinocyte-SFM, Invitrogen, USA). The cells were growth at 37°C in a humidified atmosphere of 5% CO2. Cells were regularly tested for mycoplasma contamination (MycoAlert® Mycoplasma Detection Kit, Lonza, Switzerland).
Quantitative reverse transcription-PCR
Total RNA extracted from cell lines using Trizol reagent (Invitrogen, USA) were subjected to first-strand cDNA synthesis with a reverse transcriptase kit (SuperScript™ IV First-Strand Synthesis System, Invitrogen, USA). Expression levels of STIP1 were determined using specific primers and SYBR® Green PCR master mix (Applied Biosystems, USA) in the StepOnePlus Real Time PCR (Applied Biosystems, USA). The primers used for amplification were: STIP1 forward 5’CTGCAAGACTGTCGACCTAAA3’ and reverse 5’TAGGTTCGCTTGGCTTCTTC3’, and cyclophilin A (PPIA) forward 5’GCTTTGGGTCCAGGAATGG3’ and reverse 5’GTTGTCCACAGTCAGCAATGGT3’. The 2-ΔΔCt quantification method was used, with the housekeeping PPIA (cyclophilin A) as the reference gene for data normalization.
Western blot
After extraction in a lysis buffer containing 10% sucrose, 1% NP-40, 20 mM Tris-HCl (pH 8.0), 137 mM NaCl, 10% glycerol, 2 mM EDTA and a protease inhibitor cocktail (Roche Diagnosis, USA), 20 µg of total protein were resolved in a 10% sodium dodecyl sulphate polyacrylamide gel electrophoresis (SDS-PAGE) under reducing conditions, and then transferred to nitrocellulose membranes. The membranes were incubated with antibodies against STIP1 (1:5000, HPA039291, Sigma-Aldrich, USA) or β-actin (1:50000, clone AC-15; Sigma-Aldrich, USA) for 2 h. After incubating with anti-rabbit (for STIP1) or anti-mouse (for β-actin) peroxidase-conjugated secondary antibodies, the protein bands were detected using enhanced chemiluminescence (ECL) Western Blotting System (GE Healthcare, USA) and signals captured with an Alliance 9.7 instrument (UVITEC, UK).
Immunofluorescence
Cells cultured in an 8-well culture chamber glass slide were fixed in 70% ethanol for 30 min and incubated for 1 h with anti-STIP1 antibody diluted 1:3000, followed by incubation with secondary anti-IgG conjugated with fluorescein dye (Vector Labs, Burlingame, CA, USA) at dilution 1:100. Cells were mounted with a fluorescent mounting media containing DAPI (Vectashield, Vector Labs) and examined under a photomicroscope equipped with epifluorescence (Leica Microsystems, Wetzlar, Germany). Cells untreated with primary antibodies were used as negative controls.
STIP1 stable knockdown
HSC3 and SCC9 cells were incubated with control (MISSION® pLKO.1-puro non-Mammalian shRNA Control Transduction Particles, Sigma-Aldrich, USA) or STIP1 (MISSION shRNA Lentiviral Transduction Particles, TCRN0000243096 and TCRN0000243099, Sigma-Aldrich, USA) shRNA lentiviral particles at multiplicity of infection of 2 in culture medium containing 8 μg/ml of polybrene (Sigma-Aldrich, USA) for 8 h. After washing with PBS, cells were cultured in fresh medium for 15 days in the presence of puromycin dihydrochloride (Sigma-Aldrich, USA) to select resistant cells (2 μg/ml for HSC3 cells and 1 μg/ml for SCC9 cells). The efficacy of knockdown was determined by RT-qPCR and western blot.
Cell viability and apoptosis assay
Viability of cells cultured in 96-well plates at a density of 3,000 cells/well was measured after 24 h with a CellTiter 96® AQueous One Solution Cell Proliferation Assay (Promega, USA) according to manufacturer’s protocol. In independent experiments, cell death was induced with 125 µM hydrogen peroxide for 1 h, followed by assessment of cell viability.
The cells were labeled with annexin V and 7-AAD (BD Biosciences, USA), and analyzed on a flow cytometer equipped with an argon laser (BD Biosciences, USA) for a minimum of 10,000 events for each sample for apoptosis assessment. Apoptotic cells were quantified as the number of annexin V-PE positive and 7-AAD negative cells divided by the total number of cells.
Proliferation assays
Proliferation assays were based on growth curves and on measuring bromodeoxyuridine (BrdU) incorporation into DNA using a BrdU cell proliferation ELISA kit (Roche Applied Science, USA). For the growth curves, cells were seeded in 96-well plate at 1,000 cells/well, and proliferation was determined every 24 h, up to 96 h, with the CellTiter 96® AQueous One Solution Cell Proliferation Assay (Promega, USA).
Colony formation assay
Cells (500 cells for HSC3 clones and 1,000 cells for SCC9 clones) were plated in 6-well plates and cultured for 10 days for HSC3 cells and 14 days for SCC9 cells. The medium was replaced every 2 days. The cells in colonies were fixed with 4% paraformaldehyde, stained with 1% toluidine blue and quantified using the ImageJ software (NIH, USA).
Migration assay
Vertical migration assay was performed in 6.5 nm transwell chambers with 8 µm pores (Corning, NY, USA). Briefly, serum starved cells (8x10⁴ cells/well) were plated to the upper chamber in 200 µl of serum-free DMEM/F12, whereas the lower chamber was filled with 500 µl of DMEM/F12 supplemented with 10% FBS. After incubation of 24 h, nonmigratory cells in the upper chamber were gently removed with a cotton swab and cells that migrated to the bottom of the membrane were fixed and stained with a solution of 1% toluidine blue. After elution with 1% SDS solution, absorbance was measured at 650 nm in an ELISA reader (Bio-Rad Laboratories, USA).
Invasion assays
Invasion assays were based in transwells covered with myogel (32), in the human myoma organotypic culture (33), and in a 3D spheroid assay. For myoma assay, 700,000 cells were added on the top of the myoma disc and cultured for 20 days. The paraffin sections were prepared for immunohistochemistry with monoclonal pan-cytokeratin AE1/AE3 antibody (Dako). Images were acquired with a DM4000B photo microscope connected to a DFC-320 camera using QWin V3 software (Leica Microsystems, Wetzlar, Germany), and quantified using the ImageJ software (NIH, USA).
For the 3D spheroid assay, spheroids (30,000 cells) were constructed by magnetic bioprinting following the manufacturer’s recommendations (NanoShuttle, n3D Biosciences Inc., Greiner Bio-One). Myogel (3 mg/ml) and type I bovine collagen (1 mg/ml, BD Biosciences, USA) were mixed together and 100 µl of solution were gently dispensed into wells of a 96-well plate. After solidification for 4 h at 37°C, the spheroids were collected in 50 µl of the myogel/collagen solution and plated on the top of previous solidified gel. After another 4 h at 37°C, 100 µl of serum-free medium was added, and replaced by fresh one after 48 h. Images of the spheroids were taken immediately and after 5 days of culture. Cancer cell invasion was calculated in each spheroid by the mean of 16 hotspots of invasion, represented by the farthest distance of the cancer cells from the center of the tumor spheroid.
Cisplatin treatment
Cells cultured in 96-well plates (3,000 cells/well) were incubated with cisplatin (Sigma-Aldrich, USA) diluted directly in the culture medium in concentrations varying from 2.5 to 40 µM. After 24 and 48 h, cell viability was determined with MTS assay (CellTiter 96® Aqueous Solution Cell Proliferation Assay kit, Promega, USA) according to manufacturer’s protocol.
Zebrafish larvae micro-injection
Two day-old fishes, grown at 28.5°C in an embryonic medium (5 mM NaCl, 0.17 mM KCl, 0.33 mM CaCl2 and 0.33 mM MgSO4), were dechorionated, anesthetized with 0.04% tricaine, and injected into the perivitelline space with 1,000 cells labeled with CellTrace™ Far Red (Thermo Fisher Scientific, USA). The larvae were then transferred to a 24-well plate with 1 ml fresh embryonic medium and kept at 34°C for 72 h. Dead larvae were excluded, and alive ones were fixed with 10% paraformaldehyde and mounted in Slowfade Gold Antifade Reagent (Thermo Fisher Scientific) on glass slides for imaging. Fish were imaged using a Nikon Perfect Focus System (PFS3) (Nikon, Tokyo, Japan) with 10x magnification from Eclipse Ti-E inverted widefield microscope and the tumor area was measured using ImageJ software (NIH, USA).
Quantification of miR-218-5p
RNA isolated from HGK, HSC3 and SCC9 cells with the mirVana miRNA isolation kit (Ambion, USA) was converted into specific cDNA derived from mature microRNAs using TaqMan microRNA Reverse Transcription Kit (Applied Biosystems, USA) and quantified using the TaqMan microRNA assay (assay ID 000521, Assay-on-Demand, Applied Biosystems, USA). The small nucleolar RNA RNU48 was used as endogenous control (assay ID Hs04931161_g1, Applied Biosystems, USA). The microRNA relative expression was normalized against endogenous control and HGK cells.
Transfection of miR-218-5p mimics
Both HSC3 and SCC9 cells were transfected with miR-218-5p mimics (assay ID MC10328) using the RNAiMAX reagent (Invitrogen, USA) as per the manufacturer’s instructions. As control, cells were transfected with an unspecific scramble sequence (Pre-miR Negative Control #1-miR-1, Life Technologies, USA). After 30 h, cells were harvested and subjected to RT-qPCR and western blot for quantification of STIP1 or assessed for proliferation, migration and invasion, as described above.
Statistical analysis
Chi-squared test was used to analyze the association of STIP1 expression and clinicopathological features, and survival analyses were carried out with both univariate and multivariate Cox regression. In the multivariate analysis, the stepwise approach taking in consideration both clinical and pathological features of tumors was applied. The difference in the STIP1 expression between tumor and non-tumor samples from TCGA was analyzed using the Mann-Whitney U test, whereas the STIP1 immunohistochemical expression among normal, primary and lymph node metastasis was compared with the Kruskal-Wallis test. The receiver operating characteristic (ROC) curve was applied to determine the sensitivity and specificity of STIP1 levels in the discrimination of poor outcome.
All in vitro assays were performed at least three times. Mann-Whitney U test or one-way analysis of variance (ANOVA) with post-hoc comparisons based on the Tukey’s multiple comparisons test were applied. Correlation analyses were performed using Spearman’s rank test. The level of significance was settled at 5% (p ≤ 0.05).
Results
STIP1 is overexpressed in OSCCs and its expression is associated with outcome of patients
We initially evaluated the expression of STIP1 in oral cancer and normal oral mucosa (non-tumor) samples from the TCGA database. This analysis revealed that STIP1 mRNA is significantly more expressed in OSCCs compared to non-tumors (p<0.0001, Figure 1A). Kaplan-Meier curves based on TCGA-OSCC sample divided by STIP1 levels (with fpkm median value being applied to split the samples in low and high expression levels) revealed a statistically poorer OS (p=0.01) and CSS (p=0.001) and a strong tendency to shortened DFS (p=0.07) for patients classified with high STIP1 expression (Figures 1B–D).
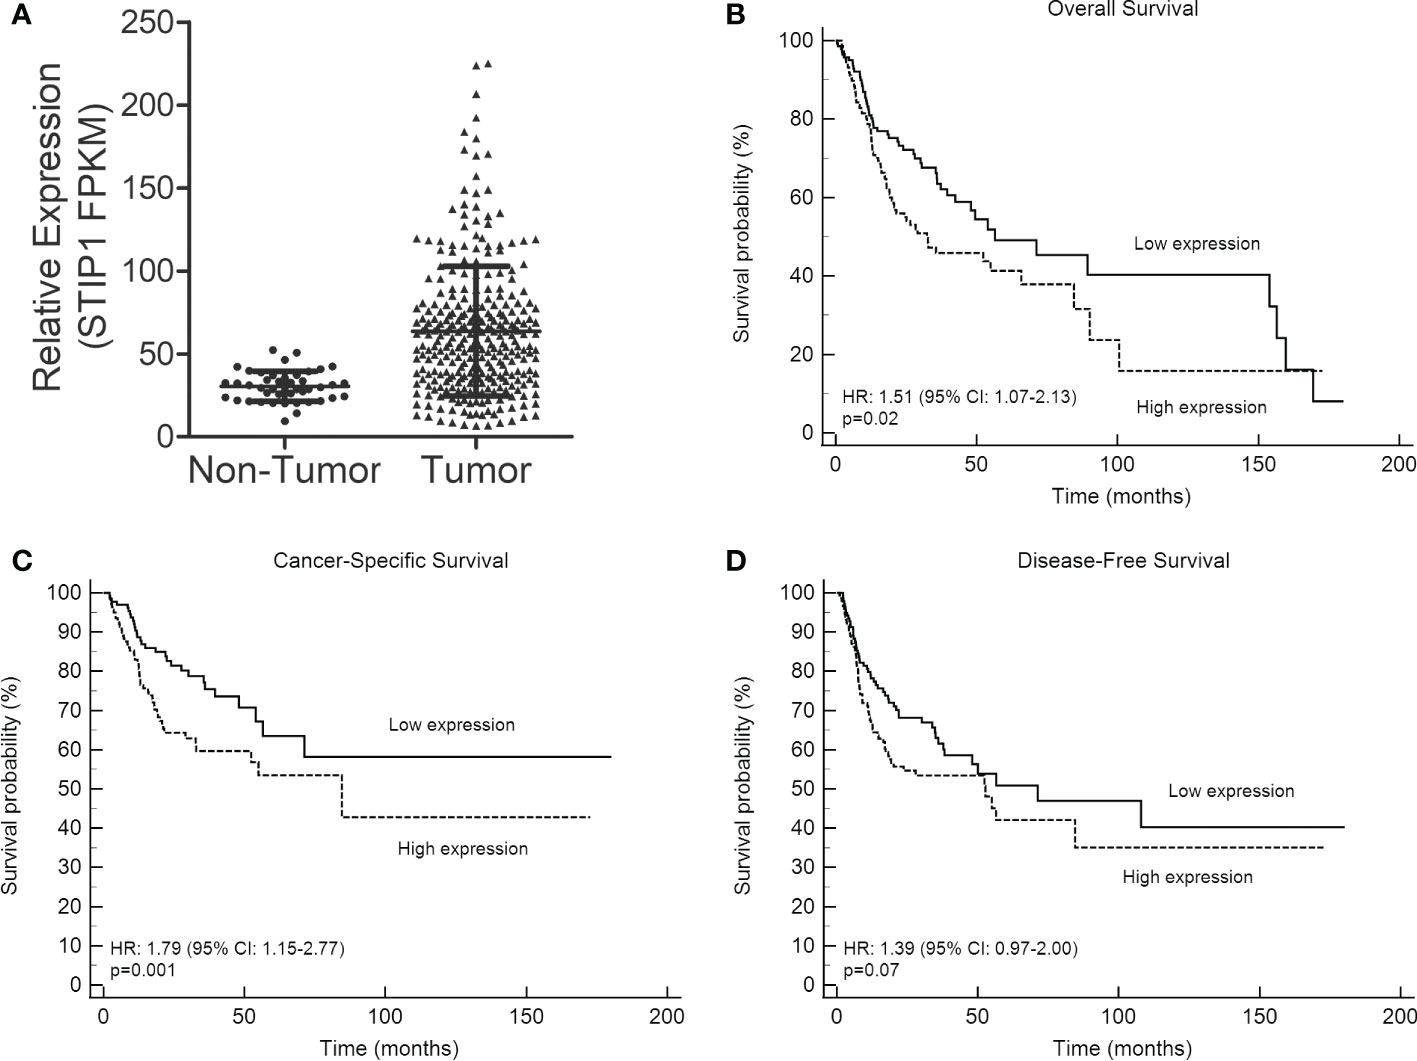
Figure 1 STIP1 is overexpressed in OSCC and its expression levels is associated with outcome. (A) Levels of STIP1 in OSCCs and controls (non-tumor) were compared in the RNA-Seq data from the TCGA database, revealing a significantly higher expression in OSCCs (p<0.0001). The impact of STIP1 mRNA levels on overall survival (B), cancer-specific survival (C) and disease-free survival (D) were assessed based on Kaplan-Meier curves and log-rank test using the TCGA-OSCC cohort.
Next, using a TMA containing normal oral mucosa, primary OSCCs and OSCC-lymph node metastases (cohort 1), we explored the immunohistochemical expression of STIP1. Immunostaining for STIP1 showed a cytoplasmic pattern, with weak staining restricted to the lower layers of the normal epithelium, whereas tumor cells, in both primary lesions and lymph node metastases, showed variable distribution and intensity (Supplementary Figure 1). Quantification of the immunostaining showed higher STIP1 expression in primary tumors (p<0.001) and lymph node metastases (p<0.001) compared to in normal tissues (Supplementary Figure 1). Using the data from the 85 OSCC patients included in this cohort, we assessed the association between STIP1 expression and outcome of patients. Kaplan-Meier curves for both CSS and DFS are depicted on Supplementary Figure 2. The high immunoreactivity for STIP1 was a marker of reduced CSS with a 5-year survival of 72.1% for the patients with low positivity for STIP1 compared with 52.9% for those with high STIP1 expression, yielding a HR of 2.10 (95% CI: 1.03-4.27, p=0.04) (Table 1). As in this cohort clinical stage was also associated with CSS (HR: 2.46, 95% CI: 1.23-4.92, p=0.01) and high STIP1 expression was more frequently detected in patients with advanced clinical stage (p=0.025, Supplementary Table 2), we performed multivariate analysis. This analysis revealed that high STIP1 immunopositivity with a HR of 2.56 (95% IC: 1.23-5.36, p=0.012) remained as an independent prognostic factor for OSCC patients, as well clinical stage (HR: 2.14, 95% CI: 1.14-3.99, p=0.017). High STIP1 immunoreactivity showed a tendency towards association with poor DFS in this cohort (p=0.056, Table 1).
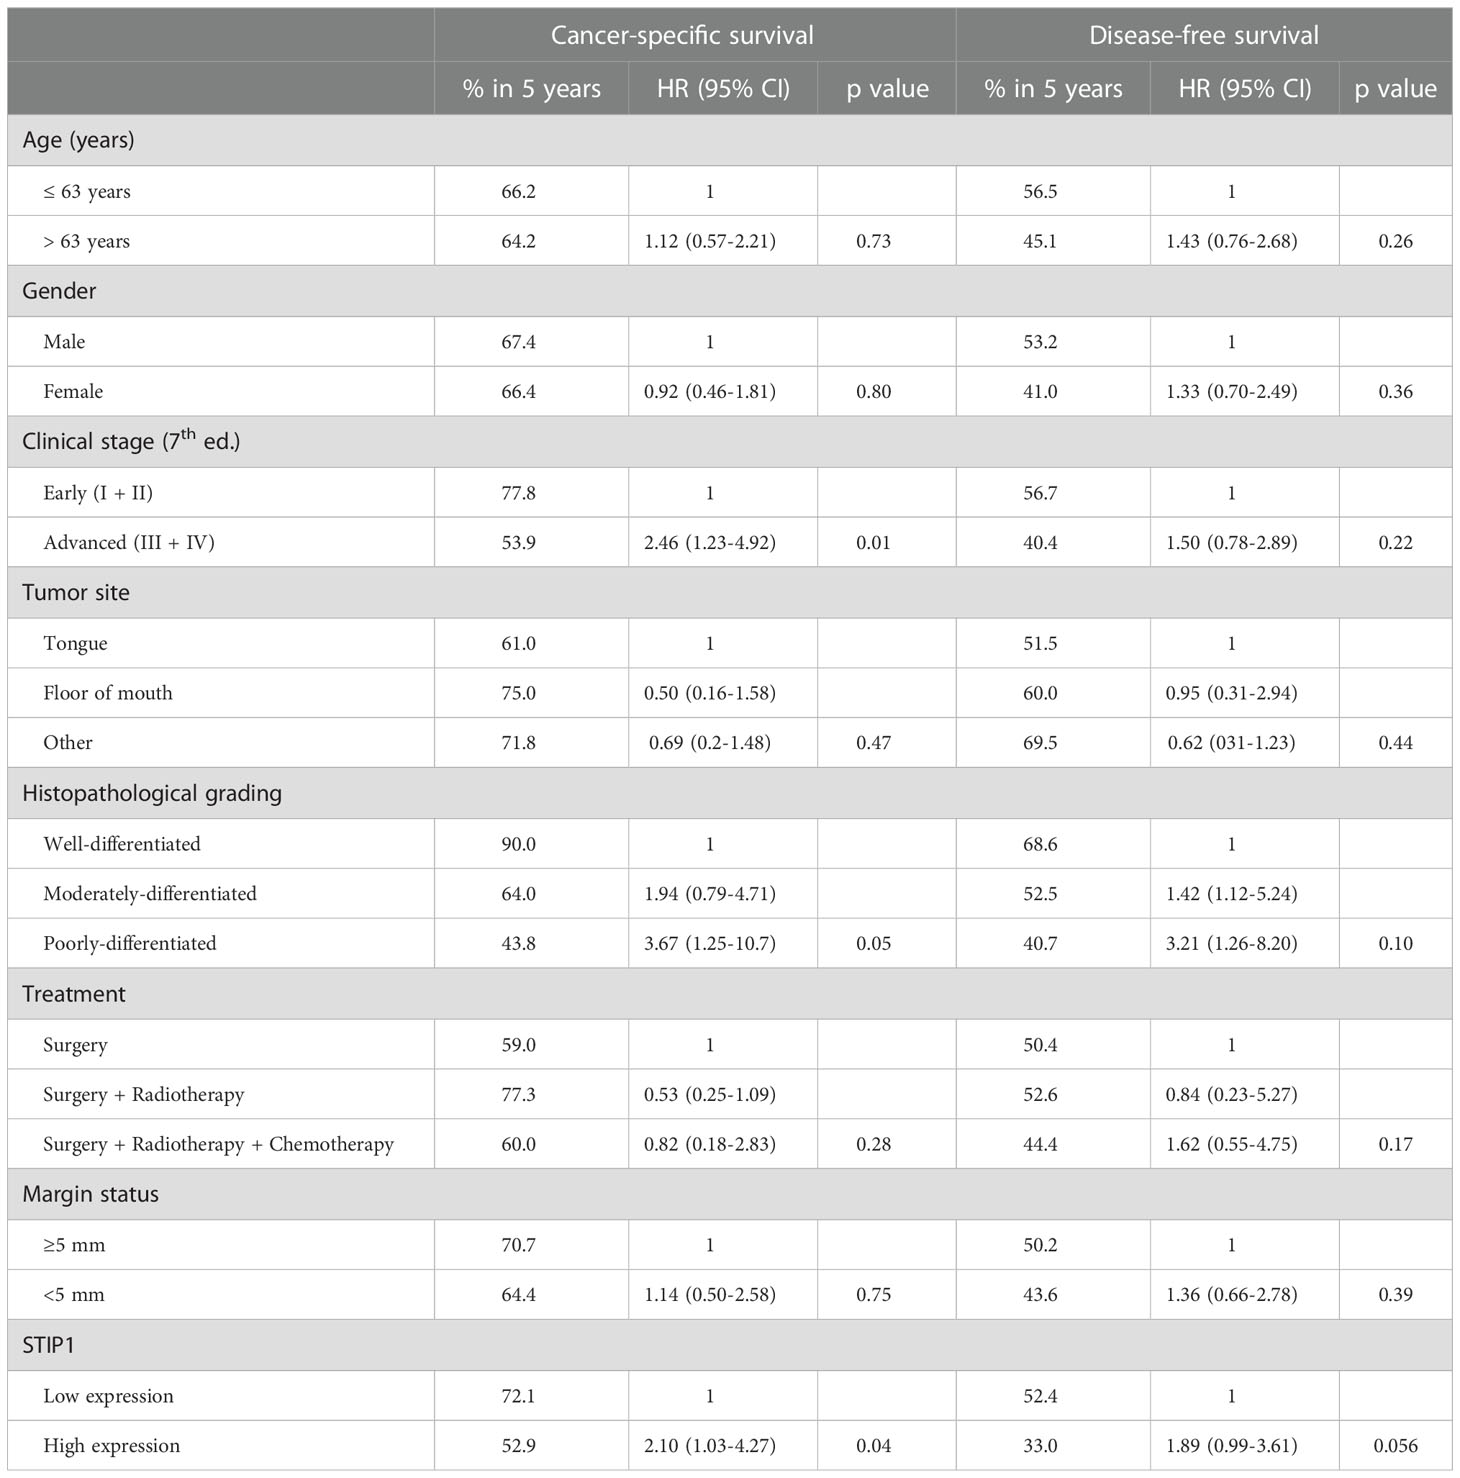
Table 1 Cancer-specific survival and disease-free survival of 85 cases of oral squamous cell carcinoma (cohort 1) based on univariate analysis.
To strength STIP1 prognostic role in outcomes of patients, we explored the immunoexpression of STIP1 in a larger and multicenter sample composed of 262 patients with OSCC (cohort 2). The pattern of STIP1 staining was quite similar to that performed in the TMA, and representative images for STIP1 in tumors classified as having low and high expression are illustrated in Supplementary Figure 3. The Kaplan-Meier curves for CSS and DFS in this cohort is displayed in Supplementary Figure 4. High expression of STIP1 was significantly associated with poor CSS (HR: 3.07, 95% CI: 2.04-4.64, p<0.0001) and DFS (HR: 2.19, 95% CI: 1.36-3.53, p=0.003) (Table 2). As shown in Supplementary Table 3, the high level of STIP1 in OSCCs was significantly associated with age, clinical stage, localization, status of the surgical margins and recurrence. Multivariate analysis was applied to further evaluate the independency of STIP1 expression on the outcomes, revealing STIP1 as an independent marker for both CSS (HR: 3.08, 95% CI: 2.06-4.60, p<0.0001) and DFS (HR: 1.93, 95% CI: 1.27-2.93, p=0.02).
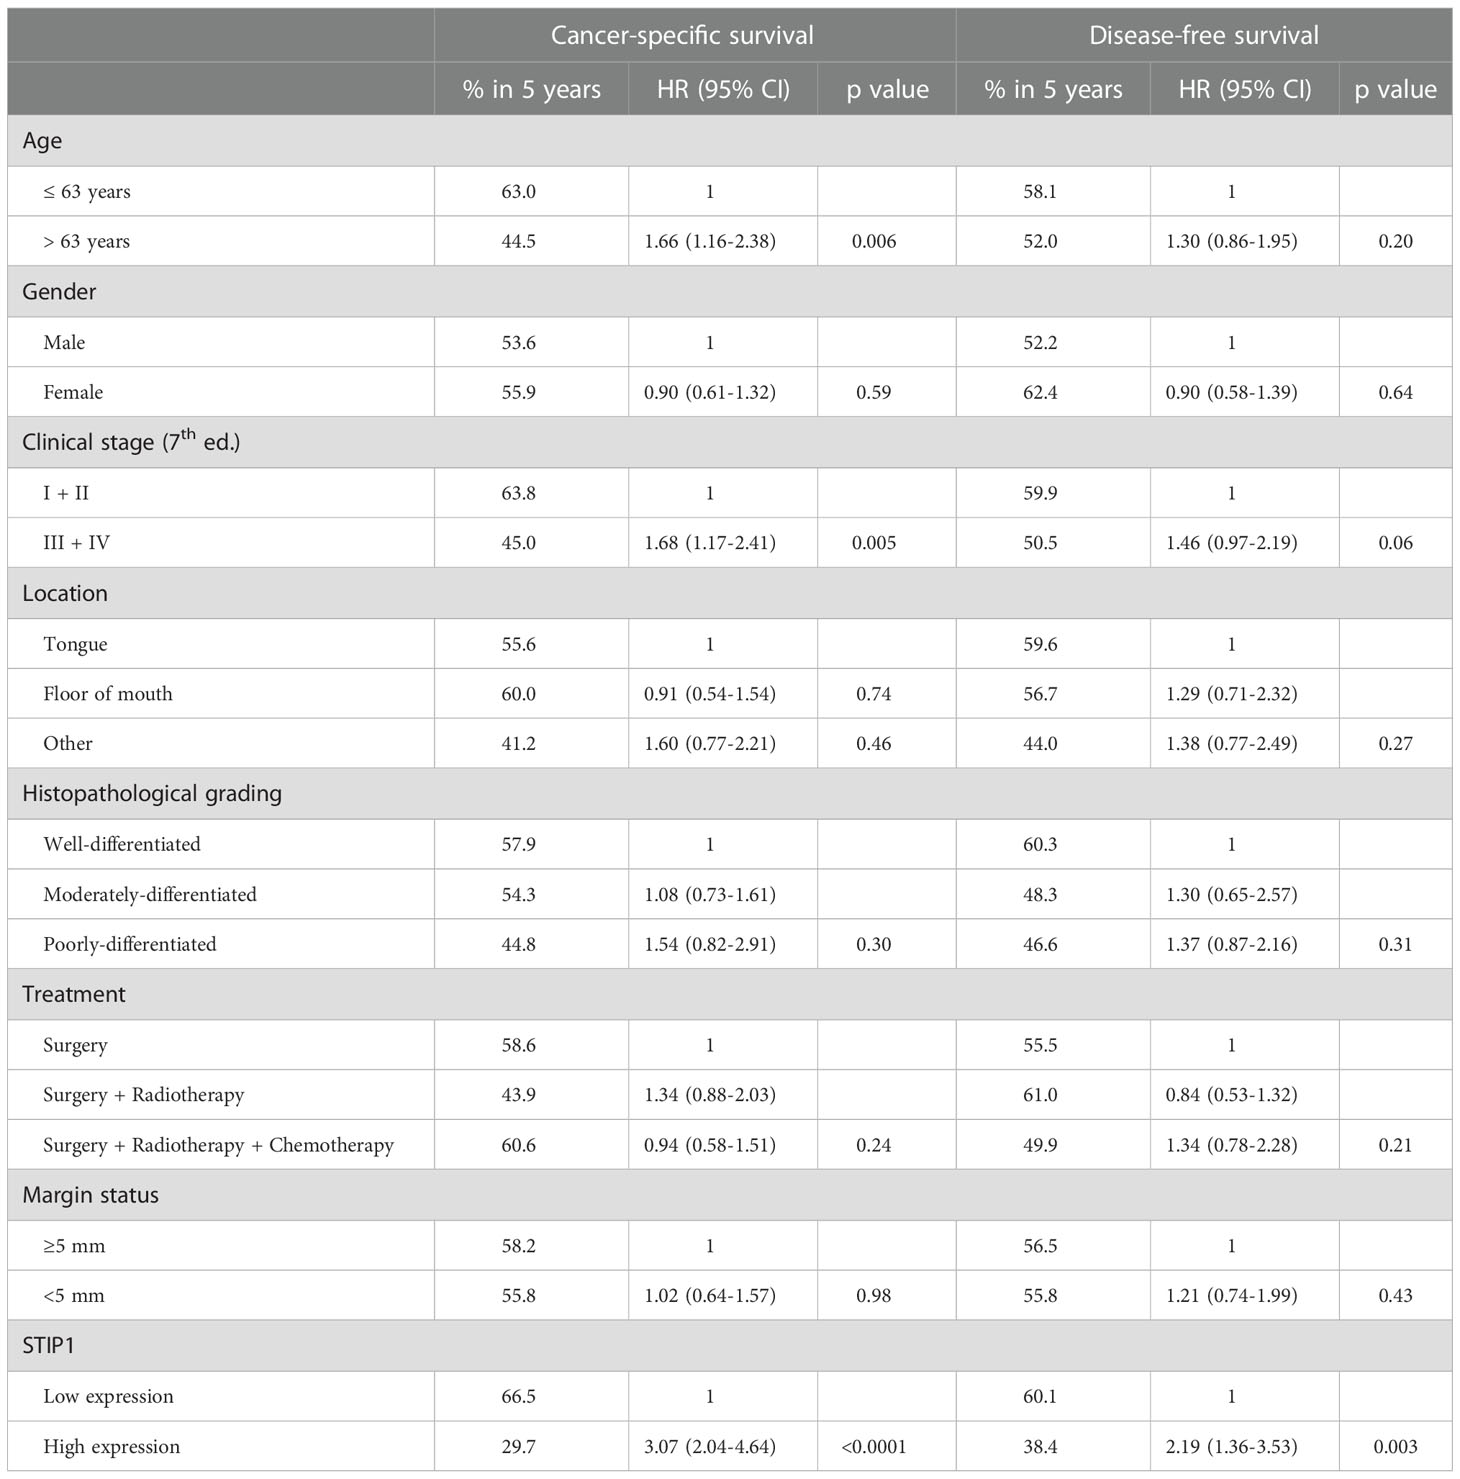
Table 2 Univariate analysis for cancer-specific survival and disease-free survival of the patients with oral squamous cell carcinoma of cohort 2 (n=262).
Taking the diagnosis of OSCC as a classification variable and the whole sample (85 controls from cohort 1, and 347 OSCCs from cohorts 1 and 2), the immunoexpression of STIP1 showed a diagnosis potential for OSCC, with an area under the ROC curve of 0.890 (95% CI: 0.832-0.934, p<0.0001) (Supplementary Figure 5).
STIP1 knockdown controls proliferation, migration, invasion and metastasis
To select OSCC cell lines with high expression of STIP1, RT-qPCR was performed in a series of oral cancer cells. The levels of STIP1 mRNA were significantly higher in HSC3 (p<0.0001), SCC4 (p<0.01), SCC9 (p<0.0001), SCC15 (p<0.01) and SCC25 (p<0.0001) cells than in HGK cells (Figure 2A). The high levels of STIP1 in both HSC3 and SCC9 were confirmed by western blot (Figure 2B) and immunofluorescence (Figure 2C), and these cells were then selected by STIP1 knockdown. As expected, cells transduced with lentivirus carrying the specific shRNA sequences targeted to the STIP1 transcript demonstrated a significant reduction in both STIP1 mRNA (Figure 2D) and protein (Figure 2E) levels in comparison with cells transduced with the non-targeting sequence (control).
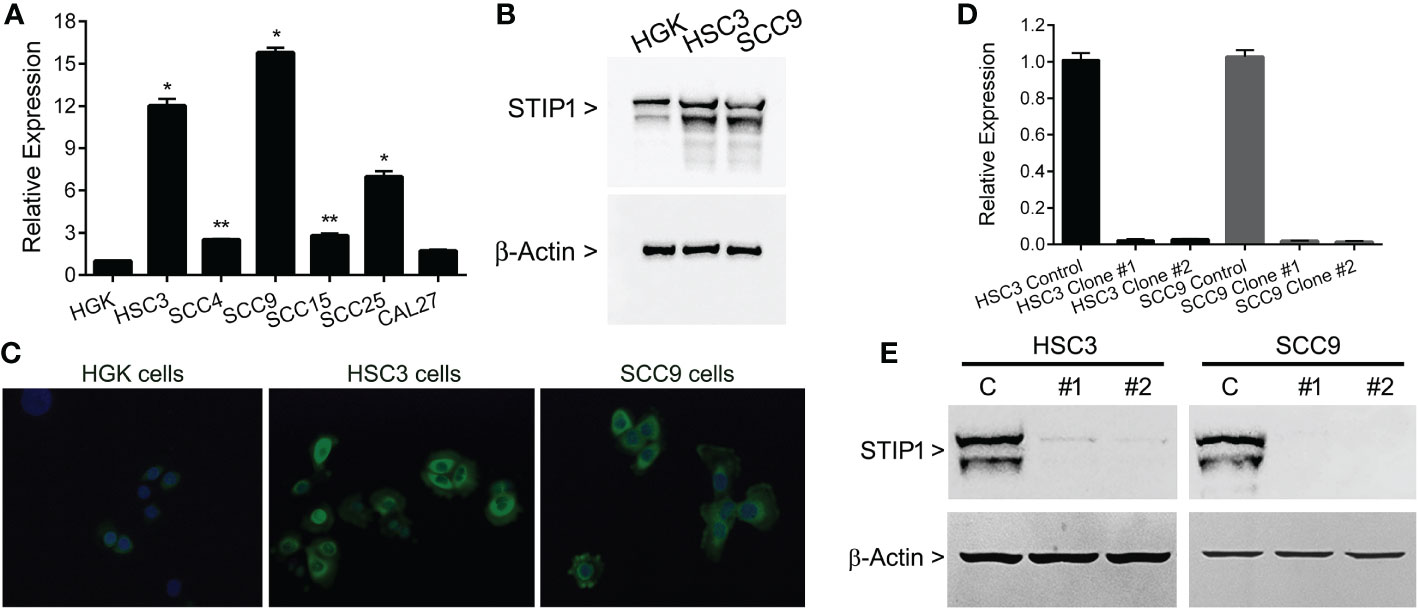
Figure 2 STIP1 is overexpressed in OSCC-derived cell lines. (A) Total RNA from the normal human gingival keratinocyte cell line (HGK) and 6 human OSCC cell lines (SCC4, SCC9, SCC15, SCC25, HSC3 and CAL27) were converted in cDNA and subjected to qPCR. The STIP1 mRNA levels were significantly higher in OSCC cells lines than in HGK, with exception of CAL27. (B) The overexpression of STIP1 was confirmed with western blot applying specific antibodies against STIP1 and the housekeeping control β-actin. (C) Immunofluorescence analysis revealed an intense staining for STIP1 in OSCC cells, which was mainly found in the perinuclear area. STIP1 knockdown efficiency in HSC3 and SCC9 cells after transduced with lentivirus expressing shRNA sequences against STIP1 (clones #1 and #2) and control as outlined in the methods. A marked reduction in both mRNA (D) and protein (E) levels when compared with control cells was observed. The values represent the average ± SD of three separate experiments. In figures (B, C, E) a representative image is shown. *p<0.01, **p<0.0001.
Cell viability and apoptotic rates were not altered after STIP1 silencing (Supplementary Figure 6). However, when the cells were exposed to hydrogen peroxide to promote oxidative stress-induced cell death, a significant reduction in cell viability in STIP1-silencing clones for both HSC3 and SCC9 cells was detected (Supplementary Figure 6). STIP1 knockdown did not influence the sensibility of the cells to cisplatin treatment (Supplementary Figure 6).
Reduced levels of STIP1 significantly decreased HSC3 and SCC9 proliferation as revealed by BrdU incorporation assay (Figure 3A), growth curves (Figures 3B, C) and colony formation assay (Figure 3D). Repression of STIP1 expression significantly inhibited migration (Figure 3E) and invasion of OSCC cells, as depicted in the transwell invasion assay (Figure 3F). This invasion effect was also verified in the organotypic myoma (Figure 3G) and the 3D spheroid assays (Figure 3H) as reduced depth/distance of invasion. In the myoma assay, invasion area and island size were significantly smaller in both STIP1-silenced SCC9 cells than in the control cells (Supplementary Figure 7). The impacts of STIP1 silencing on tumor growth and metastasis in vivo were explored with HSC3 clone #1 and SCC9 clones #1 in a zebrafish model (Supplementary Figure 8). The sizes of primary tumors were slightly larger; however, the difference was not statistically significant (Figure 3I). The number of metastases was obviously lower in STIP1 silenced cells, reaching significance for SCC9 cells (Figure 3J).
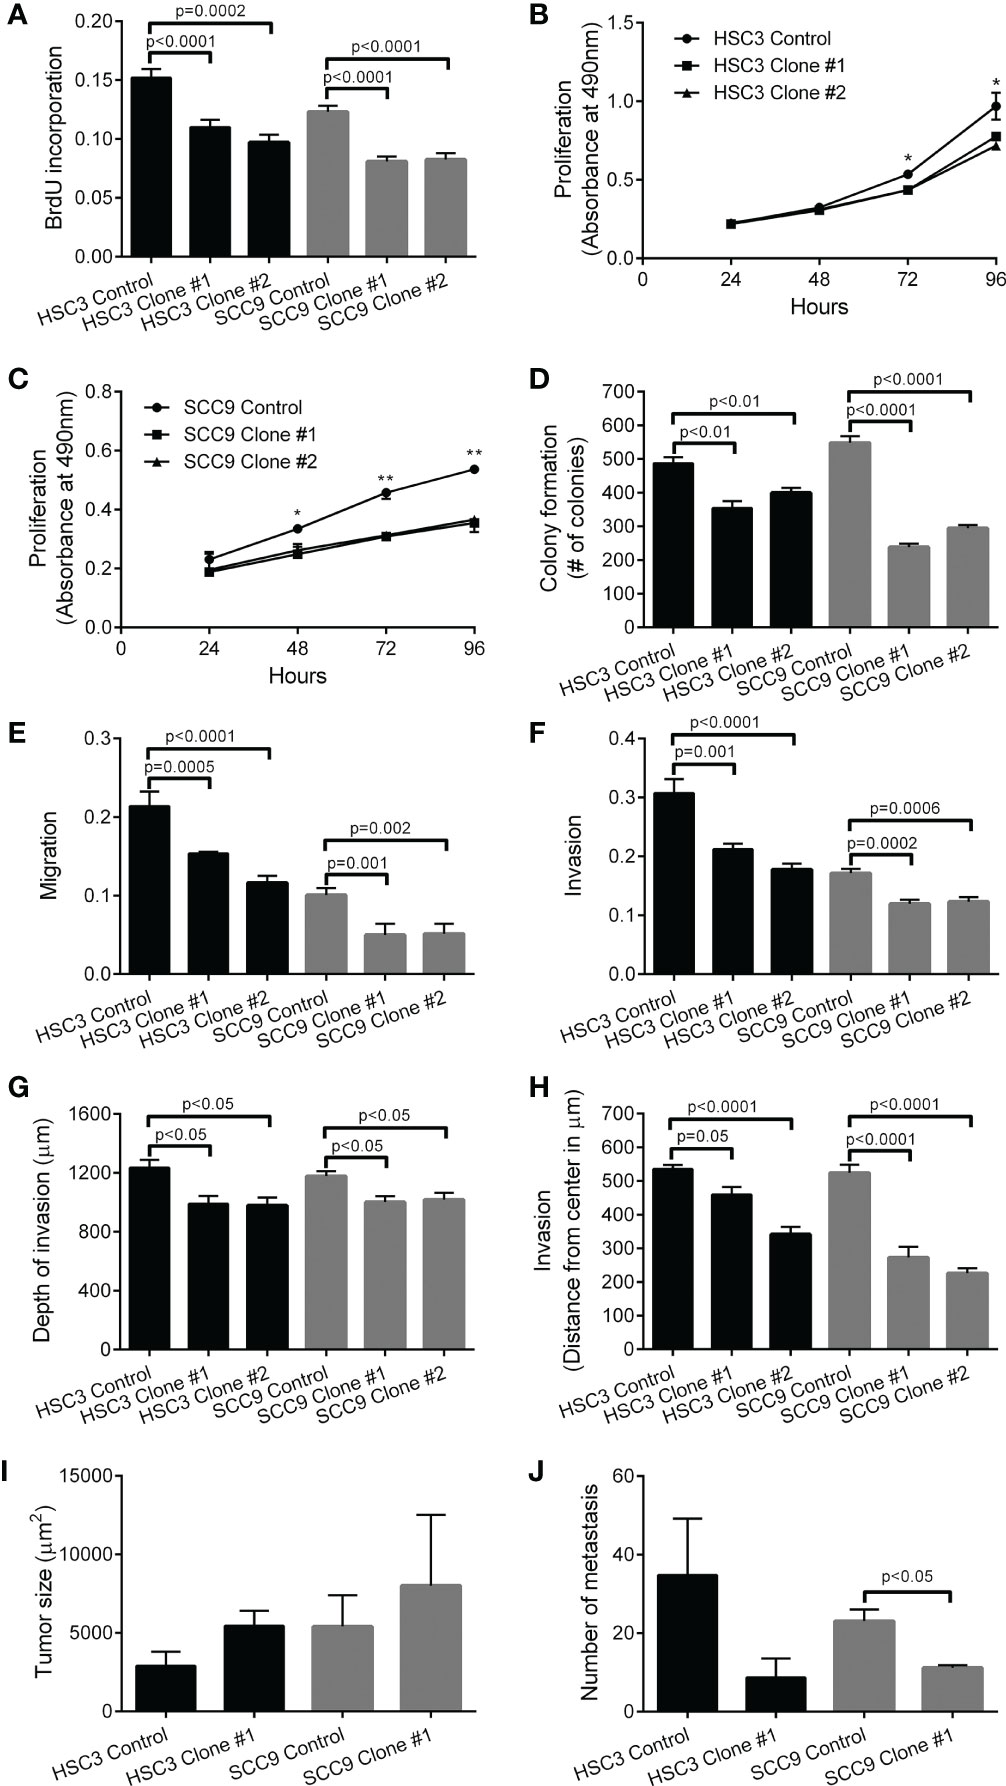
Figure 3 Knockdown of STIP1 controls proliferation, migration, invasion and metastasis. Downregulation of STIP1 significantly inhibited the proliferative potential of HSC3 and SCC9 cells, as revealed BrdU incorporation index (A), growth curves (B, C) and number of colonies in the colony formation assay (D). Migration (E) and Invasion (F) of HSC3 and SCC9 cells were significantly decreased by STIP1-specific shRNAs, as revealed by transwell-based assays. The impaired invasion of both HSC3 and SCC9 cells after STIP1 knockdown was observed in the organotypic myoma assay (G), represented by low depth of invasion, and in the 3D spheroid assays (H). In the zebrafish model, no significant differences in volume of tumors formed by HSC3 and SCC9 cells with STIP1 knockdown or controls were observed (I), but the number of metastatic foci were decreased in STIP1 silenced cells, reaching significant levels for SCC9 cells (J). The values represent the average ± SD of three separate experiments. In the organotypic myoma assay, three deepest islands were measured in four microscopic fields of six myomas. In a zebrafish model, n=16-21 in three independent experiments. *p<0.05, **p<0.001.
STIP1 is regulated by miR-218-5p in OSCCs
In the OSCC sample of the TCGA database, miR-218-5p was identified as one of the STIP1 inversely correlated microRNAs (rs=0.216, p=0.02, Figure 4A), and in silico target analyses revealed a conserved miR-138-5p-binding site within STIP1 mRNA. Compared with non-tumor samples, miR-218-5p showed significantly lower expression level in OSCCs (p<0.0001, Figure 4B), and its level was significantly higher in HGK than in HSC3 (p<0.0001) and SCC9 (p<0.005) cells (Figure 4C). In both HSC3 and SCC9 cell lines, STIP1 expression was inversely correlated with miR-218-5p. HSC3 and SCC9 cells transfected with miR-218-5p mimics resulted in a clear decrease in STIP1 mRNA (Figure 4D) and protein (Figure 4E). Up-regulation of miR-218-5p also restrained proliferation (Figure 4F), migration (Figure 4G) and invasion (Figure 4H) ability of HSC3 and SCC9 cells.
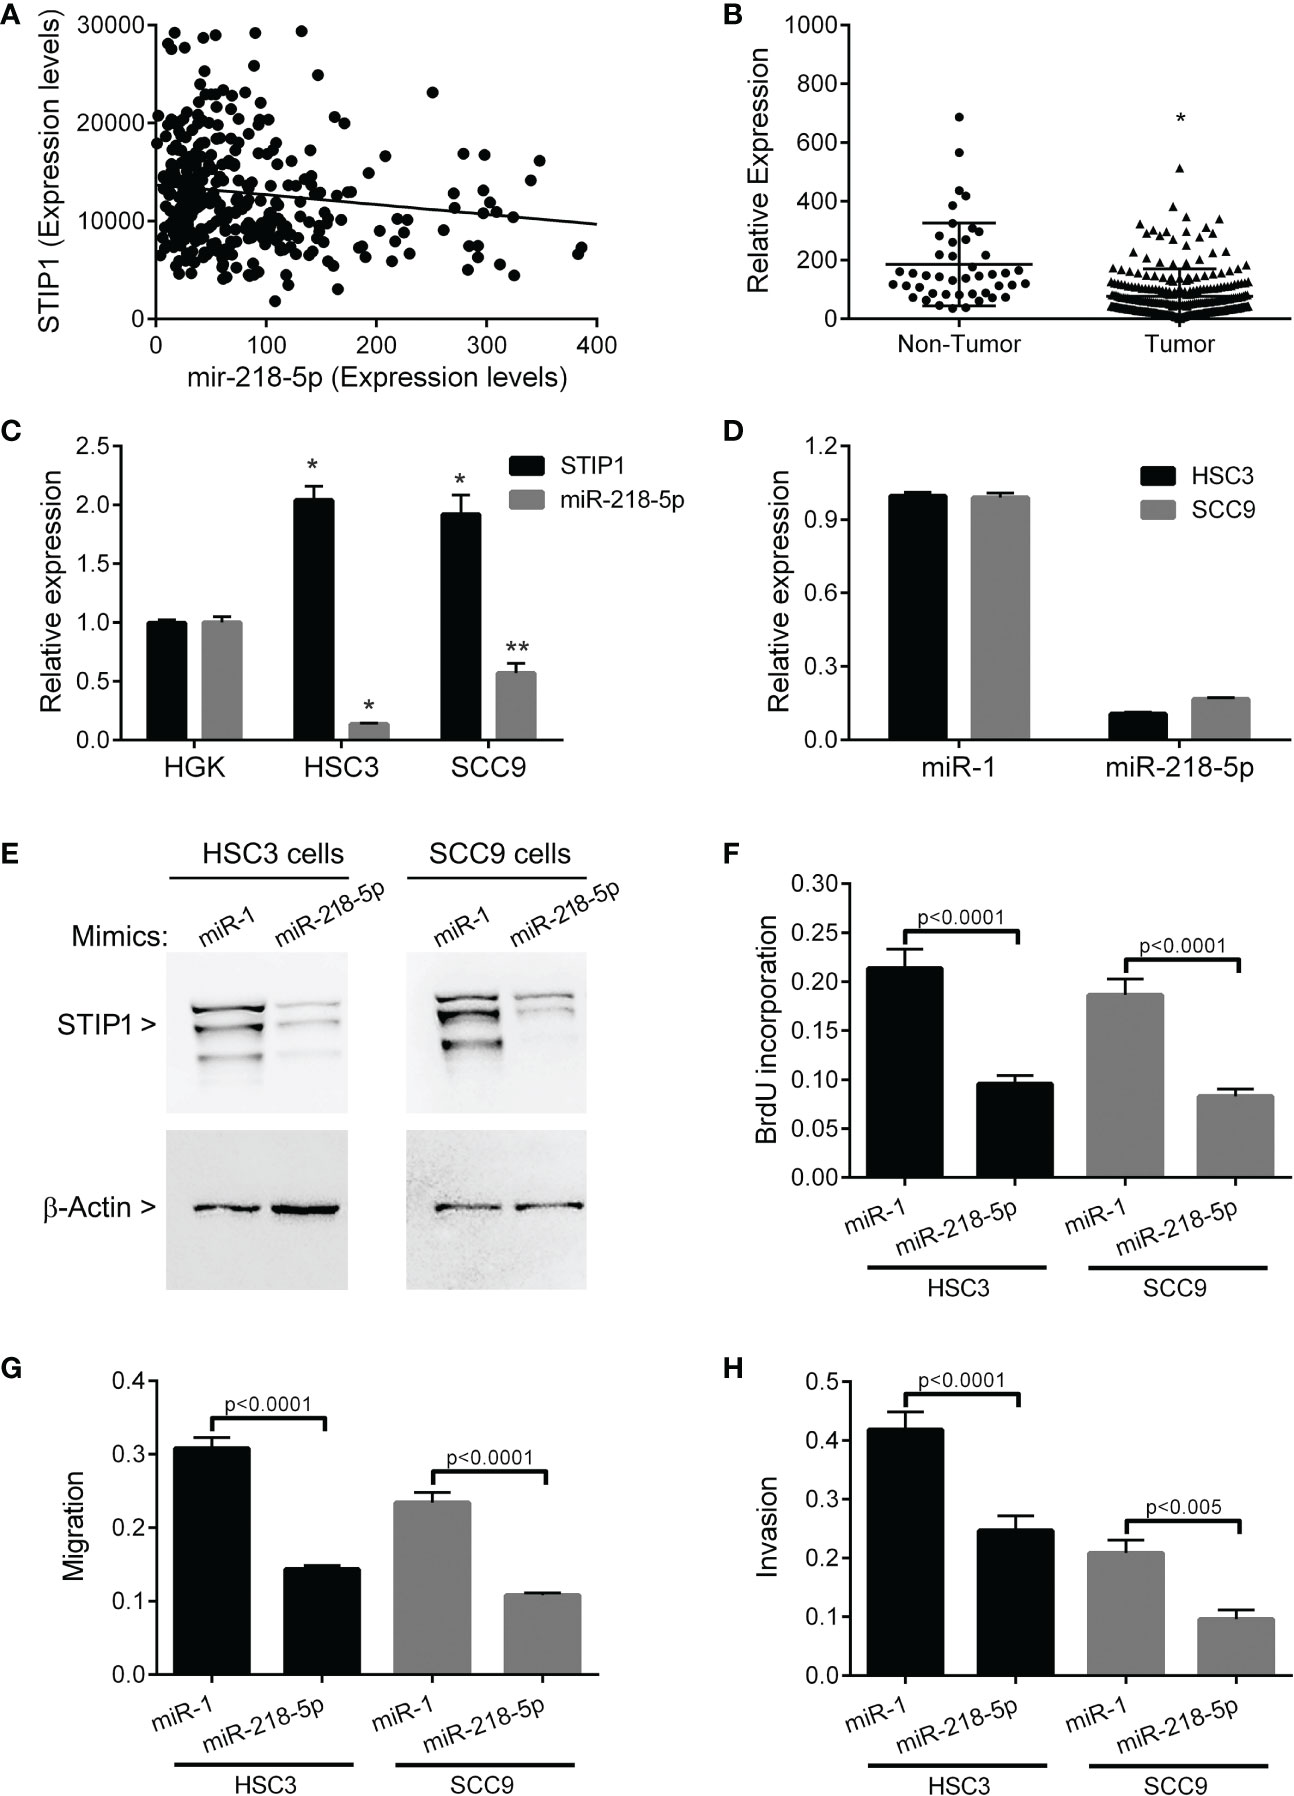
Figure 4 STIP1 and miR-218-5p in OSCC. (A) Expression of STIP1 is inversely correlated with miR-218-5p in OSCC samples from TCGA (rs=0.216, p=0.02). (B) The levels of miR-218-5p are down-regulated in OSCCs compared to control (non-tumor samples) (*p<0.0001). (C) There is a clear inverse correlation between STIP1 and miR-218-5p in the HSC3 and SCC9 cell lines (*p<0.0001, **p<0.005). Levels of STIP1 mRNA (D) and protein (E) were clearly decreased after transfection of miR-218-5p mimics, demonstrating that miR-218-5p regulates STIP1 mRNA levels. Forced overexpression of miR-218-5p significantly inhibited the proliferation (F), migration (G) and invasion (H) of HSC3 and SCC9 cells. The values represent the average ± SD of three separate experiments. In figure (E) a representative image is shown.
Discussion
OSCC is frequently life-threatening, especially if not diagnosed and treated early. Contributing to this poor behavior are its intrinsic aggressiveness with an increased tendency to invasion and metastasis, the diagnosis frequently at advanced stage, and the lack of robust indicators for clinical applications, such as responsiveness to treatment, therapeutic targets, prognosis and post-therapeutic monitoring (34). Thereafter, it is essential to identify reliable biomarkers to effectively assess the aggressiveness of tumors and choose the optimal therapeutic strategy, making OSCC treatment more effective and predictable.
STIP1 is described as playing a significant role in tumor progression. A recent meta-analysis suggests that high STIP1 expression is significantly associated with shorter overall survival, early lymph node metastasis and more advanced clinical stage compared with low STIP1 expression in six studied cancer types (35). To date, the expression of STIP1 in OSCC tissues and its association with clinical features and survival of the patient have not been examined. Therefore, the aim of this study was to quantify STIP1 in OSCCs samples compared to non-tumor tissues and evaluate its prognostic value. We also studied the effects of STIP1 silencing on OSCC cell behavior and revealed a microRNA molecule regulating STIP1.
This study shows that STIP1 is a prognostic biomarker for OSCC. STIP1 is overexpressed at both mRNA and protein levels in OSCC samples compared with normal tissues, similar as, for example, in gliomas (13), colorectal cancers (15), hepatocellular carcinoma (18), gastric cancers (20), cervical carcinomas (21), lung cancers (23), pancreatic cancers (36) and breast cancers (37). Furthermore, our findings demonstrate that higher levels of STIP1 were significantly and independently associated with reduced CSS and poor DFS compared with low STIP1 expression. These findings are in line with previous studied with other cancers showing poor overall survival and/or advanced cancer stage (15, 19, 23, 36–38). Supported by the results with other cancers, our data suggest that STIP1 overexpression is an independent prognostic marker associated with OSCC patient outcome.
The strategy of reducing STIP1 levels has been successfully applied in several cancer cell lines. In the current study, silencing of STIP1 impaired proliferation, migration and invasion ability of OSCC cell lines in vitro, while cell viability and apoptotic rate were not affected. However, under hydrogen peroxide-induced oxidative stress, the viability of the STIP1 knockdown cells was significantly reduced, supporting a protective effect under specific conditions. These STIP1 effects have been reported in a number of physiological and pathophysiological conditions. For example, STIP1 knockdown also inhibited proliferation and motility of colorectal (15), breast (19), lung (23), glioma (13), and gastric (20) cancer cell lines, emphasizing that high expression of STIP1 is linked to cancer progression. In cervical carcinoma (21), breast cancer (19), and lung cancer (23) cells, STIP1 knockdown induced apoptosis without any stress condition, which differs from our results with OSCC cells and suggests differential regulation of apoptotic process by STIP1, which can be related to the observed dysregulation of the autocrine effects of cytokines and/or growth factors. In the zebrafish model, the size of primary tumors was slightly larger, however, silenced cells were less metastatic than control cells. In mouse metastatic models with STIP1 silenced in gastric cancer cells (20) and in hepatocellular carcinoma cells (39), metastatic lung nodules were inhibited. Taken together, we suggest that proliferation, motility and metastatic ability of OSCC cells are related to STIP1 overexpression, which induces a more aggressive behavior, as observed in the cohorts of patients with OSCC. Although we were unable to connect STIP1 overexpression and response to cisplatin, it was previously reported that STIP1 can be a predictor of cisplatin-resistance in bladder cancer patients, which are candidates to immunotherapy (40). Further studies exploring STIP1 overexpression and chemoresistance, and STIP1 levels with PD1 or CTLA4 could be interesting.
The studies reported here also revealed that STIP1 and miR-218-5p are inversely correlated, and the transfection of OSCC cell lines with miR-218-5p mimics downregulated STIP1 which was followed by inhibition of proliferation, motility and invasiveness, similarly as seen with STIP1 silencing. Recently, miR-218-5p was reported to be downregulated in several cancers, including gastric, colorectal, ovarian, prostate, cervical and lung adenocarcinoma (41–46) and have different protein targets affecting cancer progression. Downregulation of miR-218-5p promoted OSCC invasion via activating CD44-ROCK signaling (47). A recent study demonstrated the relationship between long non-coding RNA HOXA-AS3 and miR-218-5p (48). While HOXA-AS3 is upregulated in OSCCs, miR-218-5p is downregulated in comparison with para-cancerous tissues. Moreover, HOXA-AS3 impaired proliferation induced by forced overexpression of miR-218-5p. Nevertheless, our study has an important limitation, because we did not carry out assays to demonstrate that STIP1 is a direct target of miR-218-5p. Thereafter, the interaction and regulation between miR-218-5p and STIP1 expression should be further investigated.
In the last decade, the adoption of many targeted drugs for cancer therapy has improved the outcome of patients with different types of cancer. However, the advances are more limited for oral cancer. Cetuximab, an antibody targeting the extracellular domain of epidermal growth factor receptor (EGFR), applied in combination with radiotherapy for advanced or recurrent cases, is the only targeted-drug approved for OSCC (49). In this sense, the identification of new potential targets, such as STIP1, is essential and urgent. However, it is important to consider important limitations, including an effective delivery system, because most STIP1 is found in the cytosol in intime contact with the Golgi complex, and different grades of toxicity due to disruption of normal cellular function are expected, because STIP1 is also expressed in normal cells.
Although heat-shock proteins and their associated proteins are not mutated in cancers, they are traditionally overexpressed as an adaptive mechanism to counteract the adverse effects and to bring advantages to the tumor. Here, we demonstrate that STIP1 is overexpressed in OSCCs, which is at least in part caused by downregulation of miR-218-5p, and its high levels are significantly associated with shorter survival and high risk for recurrence. Moreover, the in vitro and in vivo results confirmed that high STIP1 expression affects proliferation, migration, invasion and metastatic potential of the OSCC cells. A better understanding and knowledge of the biological events of specific players in OSCCs, such as STIP1, and following studies precede the clinical adoption of a biomarker, which can improve the treatment and increase the survival rates of patients with OSCC.
Data availability statement
The original contributions presented in the study are included in the article/Supplementary Material. Further inquiries can be directed to the corresponding author.
Ethics statement
The studies involving human participants were reviewed and approved by Approval from the ethics review board of each of the hospitals affiliated with the collaborative study was obtained, and the study was approved by Human Research Ethics Committee of the School of Dentistry, University of Campinas (CAAE: 55927322.0.0000.5418). Written informed consent was obtained from participants in compliance with the World Medical Association Declaration of Helsinki, Ethical Principles for Medical Research Involving Human Subjects. The patients/participants provided their written informed consent to participate in this study. The animal study was reviewed and approved by University of Helsinki under the ethical permission (ESAVI/13139/04.10.05/2017) given by the regional state administrative agency.
Author contributions
All authors have made a substantial, direct and intellectual contribution to the work and approved it for publication.
Funding
This work was supported by grants from Fundação de Amparo à Pesquisa do Estado de São Paulo (FAPESP, 2018/16077-6 to RC), and from Conselho Nacional de Desenvolvimento Científico e Tecnológico (CNPq, 407814/2018-3 and 407814/2018-3 to RC). MD (2021/13595-9) and BC (2021/08943-8) were research fellows supported by FAPESP. AE, MR, WW and TS were funded by Universities of Oulu and Helsinki, the Sigrid Juselius Foundation, and Oulu and Helsinki University Hospital special state support for research.
Conflict of interest
The authors declare that the research was conducted in the absence of any commercial or financial relationships that could be construed as a potential conflict of interest..
Publisher’s note
All claims expressed in this article are solely those of the authors and do not necessarily represent those of their affiliated organizations, or those of the publisher, the editors and the reviewers. Any product that may be evaluated in this article, or claim that may be made by its manufacturer, is not guaranteed or endorsed by the publisher.
Supplementary material
The Supplementary Material for this article can be found online at: https://www.frontiersin.org/articles/10.3389/fonc.2022.1085917/full#supplementary-material
Supplementary Figure 1 | Immunohistochemistry analysis of STIP1 performed in the tissues disposed of in a tissue microarray (cohort 1). Representative images of the STIP1 immunostaining in a normal mucosa tissue (A), primary OSCC (B) and lymph node metastasis (C). (Original magnification x100) (D) Quantification of the staining revealed a significant higher expression of STIP1 in both primary tumors and lymph node metastases compared to normal mucosa tissues. *p<0.0001
Supplementary Figure 2 | Kaplan-Meier survival curves for patients of cohort 1. (A) Cancer-specific survival and (B) disease-free survival.
Supplementary Figure 3 | Representative immunohistochemical images of the STIP1 stain in the whole sections belonging to cohort 2. A clear cytoplasmic staining for STIP1 was observed, which was quite similar to that observed in the cohort 1. (A) Representative samples classified with low STIP1 expression and (B) representative sample with high expression of STIP1. (Original magnification x200)
Supplementary Figure 4 | Expression of STIP1 is associated with shortened survival of patients with OSCC. The cancer-specific survival (A) and disease-free survival (B) according to the Kaplan-Meier method.
Supplementary Figure 5 | Receiver operating characteristic (ROC) curve with area under the curve (AUC) comparing STIP1 staining between OSCC samples and normal tissues (non-tumor samples). The diagnostic potential of STIP1 is clearly observed.
Supplementary Figure 6 | Downregulation of STIP1 affects viability of HSC3 and SCC9 cells just under stress conditions. Knockdown of STIP1 did not affect the viability (A) and apoptotic rate (B) of the cells cultured under normal conditions. (C) A significant reduction in the viability of the HSC3 and SCC9 silenced cells was observed after treatment with 125 µM hydrogen peroxide for 1 h. (D, E) The knockdown of STIP1 did not modulate the sensibility of the cells to cisplatin. The values represent the average ± SD of three separate experiments.
Supplementary Figure 7 | Quantification of the invasion area (A) and island size (B) in the myoma organotypic model for 14 days. The invasion area and island size were significantly reduced in SCC9 knockdown cells compared to control, but no effects on invasion area was observed HSC3 cell. Interesting, the island sizes were slightly higher in HSC3 clones #1 and #2 compared to control HSC3 cells. The values represent the average ± SD of six myomas each analyzed from four microscopic fields.
Supplementary Figure 8 | Representative images of the Zebrafish xenograft model. Tumor cells (red) were xenotransplanted into two day-old fishes, and tumor area (arrow) and number of metastatic foci (arrowhead) were determined after 72 h. Representative fishes xenotransplanted with HSC3 control (A), HSC3 clone #1 (B), SCC9 control (C) and SCC9 clone #1 (D) are shown.
References
1. Sung H, Ferlay J, Siegel RL, Laversanne M, Soerjomataram I, Jemal A, et al. Global cancer statistics 2020: GLOBOCAN estimates of incidence and mortality worldwide for 36 cancers in 185 countries. CA Cancer J Clin (2021) 71:209–49. doi: 10.3322/caac.21660
2. Chinn SB, Myers JN. Oral cavity carcinoma: current management, controversies, and future directions. J Clin Oncol (2015) 33:3269–76. doi: 10.1200/JCO.2015.61.2929
3. Ferreira AK, Carvalho SH, Granville-Garcia AF, Sarmento DJ, Agripino GG, Abreu MH, et al. Survival and prognostic factors in patients with oral squamous cell carcinoma. Med Oral Patol Oral Cir Bucal (2021) 26:e387–e92. doi: 10.4317/medoral.24242
4. Almangush A, Heikkinen I, Mäkitie AA, Coletta RD, Läärä E, Leivo I, et al. Prognostic biomarkers for oral tongue squamous cell carcinoma: a systematic review and meta-analysis. Br J Cancer (2017) 117:856–66. doi: 10.1038/bjc.2017.244
5. Flores IL, Kawahara R, Miguel MC, Granato DC, Domingues RR, Macedo CC, et al. EEF1D modulates proliferation and epithelial-mesenchymal transition in oral squamous cell carcinoma. Clin Sci (Lond) (2016) 130:785–99. doi: 10.1042/CS20150646
6. Korvala J, Jee K, Porkola E, Almangush A, Mosakhani N, Bitu C, et al. MicroRNA and protein profiles in invasive versus non-invasive oral tongue squamous cell carcinoma cells. vitro. Exp Cell Res (2017) 350:9–18. doi: 10.1016/j.yexcr.2016.10.015
7. da Fonseca ACC, Matias D, Geraldo LHM, Leser FS, Pagnoncelli I, Garcia C, et al. The multiple functions of the co-chaperone stress inducible protein 1. Cytokine Growth Factor Rev (2021) 57:73–84. doi: 10.1016/j.cytogfr.2020.06.003
8. Baindur-Hudson S, Edkins AL, Blatch GL. Hsp70/Hsp90 organising protein (hop): beyond interactions with chaperones and prion proteins. Subcell Biochem (2015) 78:69–90. doi: 10.1007/978-3-319-11731-7_3
9. Bhattacharya K, Picard D. The Hsp70-Hsp90 go-between Hop/Stip1/Sti1 is a proteostatic switch and may be a drug target in cancer and neurodegeneration. Cell Mol Life Sci (2021) 78:7257–73. doi: 10.1007/s00018-021-03962-z
10. Hajj GN, Arantes CP, Dias MV, Roffé M, Costa-Silva B, Lopes MH, et al. The unconventional secretion of stress-inducible protein 1 by a heterogeneous population of extracellular vesicles. Cell Mol Life Sci (2013) 70:3211–27. doi: 10.1007/s00018-013-1328-y
11. Tsai CL, Tsai CN, Lin CY, Chen HW, Lee YS, Chao A, et al. Secreted stress-induced phosphoprotein 1 activates the ALK2-SMAD signaling pathways and promotes cell proliferation of ovarian cancer cells. Cell Rep (2012) 2:283–93. doi: 10.1016/j.celrep.2012.07.002
12. Wang J, You H, Qi J, Yang C, Ren Y, Cheng H. Autocrine and paracrine STIP1 signaling promote osteolytic bone metastasis in renal cell carcinoma. Oncotarget (2017) 8:17012–26. doi: 10.18632/oncotarget.15222
13. Yin H, Deng Z, Li X, Li Y, Yin W, Zhao G, et al. Down-regulation of STIP1 regulate apoptosis and invasion of glioma cells via TRAP1/AKT signaling pathway. Cancer Genet (2019) 237:1–9. doi: 10.1016/j.cancergen.2019.05.006
14. Wang JH, Gong C, Guo FJ, Zhou X, Zhang MS, Qiu H, et al. Knockdown of STIP1 inhibits the invasion of CD133-positive cancer stem-like cells of the osteosarcoma MG63 cell line via the PI3K/Akt and ERK1/2 pathways. Int J Mol Med (2020) 46(6):2251–9. doi: 10.3892/ijmm.2020.4764
15. Xia Y, Chen J, Liu G, Huang W, Wei X, Wei Z, et al. STIP1 knockdown suppresses colorectal cancer cell proliferation, migration and invasion by inhibiting STAT3 pathway. Chem Biol Interact (2021) 341:109446. doi: 10.1016/j.cbi.2021.109446
16. Chao A, Liao MJ, Chen SH, Lee YS, Tsai CN, Lin CY, et al. JAK2-mediated phosphorylation of stress-induced phosphoprotein-1 (STIP1) in human cells. Int J Mol Sci (2022) 23:2420. doi: 10.3390/ijms23052420
17. Cho H, Kim S, Shin HY, Chung EJ, Kitano H, Hyon Park J, et al. Expression of stress-induced phosphoprotein1 (STIP1) is associated with tumor progression and poor prognosis in epithelial ovarian cancer. Genes Chromosomes Cancer (2014) 53:277–88. doi: 10.1002/gcc.22136
18. Chen Z, Xu L, Su T, Ke Z, Peng Z, Zhang N, et al. Autocrine STIP1 signaling promotes tumor growth and is associated with disease outcome in hepatocellular carcinoma. Biochem Biophys Res Commun (2017) 493:365–72. doi: 10.1016/j.bbrc.2017.09.016
19. Lin L, Wen J, Lin B, Xia E, Zheng C, Ye L, et al. Stress-induced phosphoprotein 1 facilitates breast cancer cell progression and indicates poor prognosis for breast cancer patients. Hum Cell (2021) 34:901–17. doi: 10.1007/s13577-021-00507-1
20. Huang L, Zhai E, Cai S, Lin Y, Liao J, Jin H, et al. Stress-inducible protein-1 promotes metastasis of gastric cancer via wnt/β-catenin signaling pathway. J Exp Clin Cancer Res (2018) 37:6. doi: 10.1186/s13046-018-0676-8
21. Li R, Li P, Wang J, Liu J. STIP1 down-regulation inhibits glycolysis by suppressing PKM2 and LDHA and inactivating the wnt/β-catenin pathway in cervical carcinoma cells. Life Sci (2020) 258:118190. doi: 10.1016/j.lfs.2020.118190
22. Wang TH, Chao A, Tsai CL, Chang CL, Chen SH, Lee YS, et al. Stress-induced phosphoprotein 1 as a secreted biomarker for human ovarian cancer promotes cancer cell proliferation. Mol Cell Proteomics (2010) 9:1873–84. doi: 10.1074/mcp.M110.000802
23. Guo X, Yan Z, Zhang G, Wang X, Pan Y, Huang M. STIP1 regulates proliferation and migration of lung adenocarcinoma through JAK2/STAT3 signaling pathway. Cancer Manag Res (2019) 11:10061–72. doi: 10.2147/CMAR.S233758
24. Yuan MH, Zhou RS, She B, Xu HF, Wang JY, Wei LX. Expression and clinical significance of STIP1 in papillary thyroid carcinoma. Tumour Biol (2014) 35:2391–5. doi: 10.1007/s13277-013-1316-8
25. Xu YW, Liu CT, Huang XY, Huang LS, Luo YH, Hong CQ, et al. Serum autoantibodies against STIP1as a potential biomarker in the diagnosis of esophageal squamous cell carcinoma. Dis Markers (2017) 2017:5384091. doi: 10.1155/2017/5384091
26. Wang M, Liu F, Pan Y, Xu R, Li F, Liu A, et al. Tumor-associated autoantibodies in ESCC screening: Detecting prevalent early-stage malignancy or predicting future cancer risk? EBioMedicine (2021) 73:103674. doi: 10.1016/j.ebiom.2021.103674
27. Huang H-Y, Lin Y-C-D, Cui S, Huang Y, Tang Y, Xu J. miRTarBase update 2022: an informative resource for experimentally validated miRNA-target interactions. Nucleic Acids Res (2022) 50:D222–30. doi: 10.1093/nar/gkab1079
28. McGeary SE, Lin KS, Shi CY, Pham TM, Bisaria N, Kelley GM, et al. The biochemical basis of microRNA targeting efficacy. Science (2019) 366:eaav1741. doi: 10.1126/science.aav1741
29. Sticht C, de la Torre C, Parveen A, Gretz N. miRWalk: An online resource for prediction of microRNA binding sites. PloS One (2018) 13:e0206239. doi: 10.1371/journal.pone.0206239
30. Dourado MR, Machado RA, Paranaíba LMR, González-Arriagada WA, da Silva SD, Sawazaki-Calone Í, et al. Trophoblast cell surface antigen 2 expression predicts outcome in oral squamous cell carcinomas. Oral Dis (2022) 28:1085–93. doi: 10.1111/odi.13809
31. Ferreira do Carmo A, Dourado MR, Ervolino de Oliveira C, Bastos DC, Domingueti CB, Ribeiro Paranaíba LM, et al. Stanniocalcin 2 contributes to aggressiveness and is a prognostic marker for oral squamous cell carcinoma. Exp Cell Res (2020) 393:112092. doi: 10.1016/j.yexcr.2020.112092
32. Salo T, Sutinen M, Hoque Apu E, Sundquist E, Cervigne NK, de Oliveira CE, et al. A novel human leiomyoma tissue derived matrix for cell culture studies. BMC Cancer (2015) 15:981. doi: 10.1186/s12885-015-1944-z
33. Nurmenniemi S, Sinikumpu T, Alahuhta I, Salo S, Sutinen M, Santala M, et al. A novel organotypic model mimics the tumor microenvironment. Am J Pathol (2009) 175:1281–91. doi: 10.2353/ajpath.2009.081110
34. Coletta RD, Yeudall WA, Salo T. Grand Challenges in Oral Cancers. Front Oral Health (2020) 9:1–3. doi: 10.3389/froh.2020.00003
35. Zhang S, Shao J, Su F. Prognostic significance of STIP1 expression in human cancer: A meta-analysis. Clin Chim Acta (2018) 486:168–76. doi: 10.1016/j.cca.2018.07.037
36. Jing Y, Liang W, Liu J, Zhang L, Wei J, Zhu Y, et al. Stress-induced phosphoprotein 1 promotes pancreatic cancer progression through activation of the FAK/AKT/MMP signaling axis. Pathol Res Pract (2019) 215(11):152564. doi: 10.1016/j.prp.2019.152564
37. Wu R, Liu F, Peng P, Qiu H, Xiong H, Yu S, et al. Tumor stress-induced phosphoprotein 1 as a prognostic biomarker for breast cancer. Ann Transl Med (2018) 6(15):302. doi: 10.21037/atm.2018.06.46
38. Chao A, Lai CH, Tsai CL, Hsueh S, Hsueh C, Lin CY, et al. Tumor stress-induced phosphoprotein1 (STIP1) as a prognostic biomarker in ovarian cancer. PloS One (2013) 8:e57084. doi: 10.1371/journal.pone.0057084
39. Su T, Liao J, Dai Z, Xu L, Chen S, Wang Y, et al. Stress-induced phosphoprotein 1 mediates hepatocellular carcinoma metastasis after insufficient radiofrequency ablation. Oncogene (2018) 37:3514–27. doi: 10.1038/s41388-018-0169-4
40. Krafft U, Tschirdewahn S, Hess J, Harke NN, Hadaschik BA. Nyirády,P. STIP1 Tissue Expression is associated survival chemotherapy-treated bladder Cancer patients. Pathol Oncol Res (2020) 26:1243–9. doi: 10.1007/s12253-019-00689-y
41. Feng Z, Li L, Zeng Q, Zhang Y, Tu Y, Chen W, et al. Silencing inhibits the proliferation and metastasis of gastric cancer. J Cancer (2022) 13:565–78. doi: 10.7150/jca.62033
42. Pu Y, Wei J, Wu Y, Zhao K, Wu Y, Wu S, et al. THUMPD3-AS1 facilitates cell growth and aggressiveness by the miR-218-5p/SKAP1 axis in colorectal cancer. Cell Biochem Biophys (2022) 80:483–94. doi: 10.1007/s12013-022-01074-4
43. Stasiak P, Kaźmierczak D, Jopek K, Nowicki M, Rucinski M, Januchowski R. The profile of microRNA expression and potential role in the regulation of drug-resistant genes in doxorubicin and topotecan resistant ovarian cancer cell lines. Int J Mol Sci (2022) 23:5846. doi: 10.3390/ijms23105846
44. Li W, Xu W, Sun K, Wang F, Wong TW, Kong AN. Identification of novel biomarkers in prostate cancer diagnosis and prognosis. J Biochem Mol Toxicol (2022) 36:e23137. doi: 10.1002/jbt.23137
45. Cruz-De la Rosa MI, Jiménez-Wences H, Alarcón-Millán J, Romero-López MJ, Castañón-Sánchez CA, Salmerón-Bárcenas EG, et al. miR-218-5p/RUNX2 axis positively regulates proliferation and is associated with poor prognosis in cervical cancer. Int J Mol Sci (2022) 23:6993. doi: 10.3390/ijms23136993
46. Wang Y, Mei X, Song W, Wang C, Qiu X. LncRNA LINC00511 promotes COL1A1-mediated proliferation and metastasis by sponging miR-126-5p/miR-218-5p in lung adenocarcinoma. BMC Pulm Med (2022) 22(1):272. doi: 10.1186/s12890-022-02070-3
47. Li X, He J, Shao M, Cui B, Peng F, Li J, et al. Downregulation of miR-218-5p promotes invasion of oral squamous cell carcinoma cells via activation of CD44-ROCK signaling. BioMed Pharmacother (2018) 106:646–54. doi: 10.1016/j.biopha.2018.06.151
48. Zhao Y, Yao R. Long non-coding RNA HOXA-AS3 promotes cell proliferation of oral squamous cell carcinoma through sponging microRNA miR-218-5p. Bioengineered (2021) 12:8724–37. doi: 10.1080/21655979.2021.1978196
Keywords: oral cancer, STIP1, prognosis, proliferation, invasion, MIR-218-5p
Citation: Dourado MR, Elseragy A, da Costa BC, Téo FH, Guimarães GN, Machado RA, Risteli M, Wahbi W, Gurgel Rocha CA, Paranaíba LMR, González-Arriagada WA, da Silva SD, Rangel ALCA, Marques MR, Rossa Junior C, Salo T and Coletta RD (2023) Stress induced phosphoprotein 1 overexpression controls proliferation, migration and invasion and is associated with poor survival in oral squamous cell carcinoma. Front. Oncol. 12:1085917. doi: 10.3389/fonc.2022.1085917
Received: 31 October 2022; Accepted: 22 December 2022;
Published: 11 January 2023.
Edited by:
Anna Lee, University of Texas MD Anderson Cancer Center, United StatesReviewed by:
Devivasha Bordoloi, Wistar Institute, United StatesFranz Rödel, University Hospital Frankfurt, Germany
Copyright © 2023 Dourado, Elseragy, da Costa, Téo, Guimarães, Machado, Risteli, Wahbi, Gurgel Rocha, Paranaíba, González-Arriagada, da Silva, Rangel, Marques, Rossa Junior, Salo and Coletta. This is an open-access article distributed under the terms of the Creative Commons Attribution License (CC BY). The use, distribution or reproduction in other forums is permitted, provided the original author(s) and the copyright owner(s) are credited and that the original publication in this journal is cited, in accordance with accepted academic practice. No use, distribution or reproduction is permitted which does not comply with these terms.
*Correspondence: Ricardo D. Coletta, coletta@fop.unicamp.br
†These authors have contributed equally to this work