 Xitong Zhao
 Pan Liang1
 Jianbo Gao
- 1Department of Radiology, The First Affiliated Hospital of Zhengzhou University, Zhengzhou, China
- 2Scientific Research Department, Huiying Medical Technology Co., Ltd, Beijing, China
Objectives: To investigate the feasibility of computer-aided discriminative diagnosis among hepatocellular carcinoma (HCC), hepatic metastasis, hepatic hemangioma, hepatic cysts, hepatic adenoma, and hepatic focal nodular hyperplasia, based on radiomics analysis of unenhanced CT images.
Methods: 452 patients with 77 with HCC, 104 with hepatic metastases, 126 with hepatic hemangioma, 99 with hepatic cysts, 24 with FNH, 22 with HA, who underwent CT examination from 2016 to 2018, were included. Radcloud Platform was used to extract radiomics features from manual delineation on unenhanced CT images. Most relevant radiomic features were selected from 1409 via LASSO (least absolute shrinkage and selection operator). The whole dataset was divided into training and testing set with the ratio of 8:2 using computer-generated random numbers. Support Vector Machine (SVM) was used to establish the classifier.
Results: The computer-aided diagnosis model was established based on radiomic features of unenhanced CT images. 27 optimal discriminative features were selected to distinguish the six different histopathological types of all lesions. The classifiers had good diagnostic performance, with the area under curve (AUC) values greater than 0.900 in training and validation groups. The overall accuracy of the training and testing set about differentiating the six different histopathological types of all lesions was 0.88 and 0.76 respectively. 34 optimal discriminative were selected to distinguish the benign and malignant tumors. The overall accuracy in the training and testing set was 0.89and 0.84 respectively.
Conclusions: The computer-aided discriminative diagnosis model based on unenhanced CT images has good clinical potential in distinguishing focal hepatic lesions with noninvasive radiomic features.
Introduction
In recent years, the incidence of focal hepatic lesions has gradually increased. Among them, the hepatic cyst is the most common benign liver tumor followed by hepatic hemangioma. Although ninety percent of malignant primary liver tumors are primary hepatocellular carcinoma (HCC), hepatic metastasis from various primaries occur 20 times more common than HCC and are often multifocal (1). Hepatic imaging is essential for preoperative diagnosis of patients with focal hepatic lesions, which is critical to the choice of proper treatment and patient prognosis (1–3). However, preoperative imaging diagnosis of benign and malignant focal hepatic lesions is difficult, and sometimes impossible, especially for atypical or multiple lesions (4, 5). Computed Tomography (CT) is the most commonly used method for diagnosing focal hepatic lesions (6). However, its diagnostic accuracy cannot be compared with pathological examinations, especially for lesions with similar imaging features (7). Conventional CT examinations still have certain limitations, such as allergic reactions to contrast agents and certain radiation damage.
Radiomics is a newly emerging image analysis technology in recent years. Data research based on computer-aided diagnosis and texture analysis technology can construct corresponding disease models through tumor heterogeneity, and achieve accurate tumor diagnosis, curative effect and prognostic evaluation (8–10). Many kinds of literature have been published about the application of radiomics in the study of focal hepatic lesions (11–13), but there are few reports on the application of radiomics in the diagnosis of focal hepatic lesions based on unenhanced CT images. In this study, we aimed to develop and validate a computer-aided discriminative diagnosis model to distinguish HCC, hepatic metastasis, hepatic hemangioma, hepatic cyst, hepatic adenoma (HA), and hepatic focal nodular hyperplasia (FNH) using noninvasive radiomic features, based on unenhanced CT images, which facilitate patient-orientated treatment and surgery.
Materials and Methods
Patients
The present study was approved by the Institutional Review Board of Zhengzhou University and waived the requirement for informed consent due to its retrospective nature. 522 patients with HCC, hepatic metastases, hepatic hemangioma, hepatic cysts, FNH, HA, underwent CT examination at the First Affiliated Hospital of Zhengzhou University from 2016 to 2018, were included.
The following inclusion criteria were used: (1) HCC, hepatic metastases, FNH, and HA are histopathologically confirmed by surgery or liver percutaneous needle biopsy; (2) enhanced CT scan was performed 30 days before surgery or biopsy; (3) liver occupying lesions number was <= 3. The exclusion criteria were as follows: (1) insufficient quality of CT imaging; (2) lesions less than 1.0 cm (to avoid the impact of small volume effect of the lesion); (3) patients with multisource cancer; (4) patients with hepatitis B, cirrhosis, liver injury or liver surgery found on non-contrast CTs. Seventy patients were excluded, which finally resulted in the enrollment of 452 patients: 77 with HCC, 104 with liver metastases, 126 with hepatic hemangioma, 99 with hepatic cysts, 24 with FNH, 22 with HA. All these lesions were included in the test group.
Reference Standards
Hepatic hemangioma, hepatic cysts were confirmed by referencing radiologic reports by experienced radiologists and adhering to the following criteria (14): hepatic hemangioma (enhanced nodules around the arterial phase, increased centripetal filling during the venous phase, uniform enhancement during the arterial phase, or continuous enhancement during venous phase); hepatic cyst (close to the CT value of water and no apparent contrast enhancement).
Control group: 452 lesions were diagnosed on unenhanced CT images by an attending physician who worked for 5 years and a chief physician who worked for more than 10 years without knowing the histopathological examination results. The diagnostic accuracy was evaluated with histopathological examination results (HCC, hepatic metastases, FNH, HA) and radiologic reports (hepatic hemangioma, hepatic cyst) as the gold standard.
In addition, six kinds of focal hepatic lesions were divided into benign and malignant groups. The benign group included hepatic hemangioma, hepatic cyst, FNH and HA; the malignant group included HCC and hepatic metastases.
CT Examination
All examinations were acquired on spectral CT scanners (first generation of Discovery CT750 HD scanner; the second generation of the Discovery CT scanner; both from GE Medical Systems). The following specific scanning parameters were adopted: tube voltage of 120 kV, tube current of 240–300 mA, and layer thickness of 5 mm. Enhanced scanning was performed by injecting a non-ionic contrast agent (iodine content 320 g/L) into the cubital vein at 2.5–4.0 mL/s; the total dose calculated was 1.5 mL/kg. After the contrast agent was injected, the arterial phase was scanned 25–30 s, the venous phase was scanned in 60s, and the delayed phase was scanned after 180 s.
Tumor Segmentation
Original Digital Imaging and Communications in Medicine (DICOM) images were imported to the Radcloud platform (Huiying Medical Technology Co., Ltd., Beijing, China) for radiomic features extraction and analysis (15). One focal hepatic lesion (not adjacent to the inferior vena cava, caudate lobe, the great hepatic vein, artery, and bile duct) was selected for each patient. Two radiologists manually delineated the region of interest (ROI) along the edge of the lesion, layer by layer, on unenhanced CT images. The volume of interest (VOI) of the lesion was automatically generated by the computer. Another senior radiologist examined the outline results. During the segmentation, corresponding enhanced CT images were referred to determine tumor boundary. Interclass correlation coefficients (ICCs) were used to assessed the interobserver agreement of feature extraction in order to validate the stability of the radiomics features (16). An ICC of greater than 0.75 was considered acceptable. The procedure of radiomics method is illustrated in Figure 1.
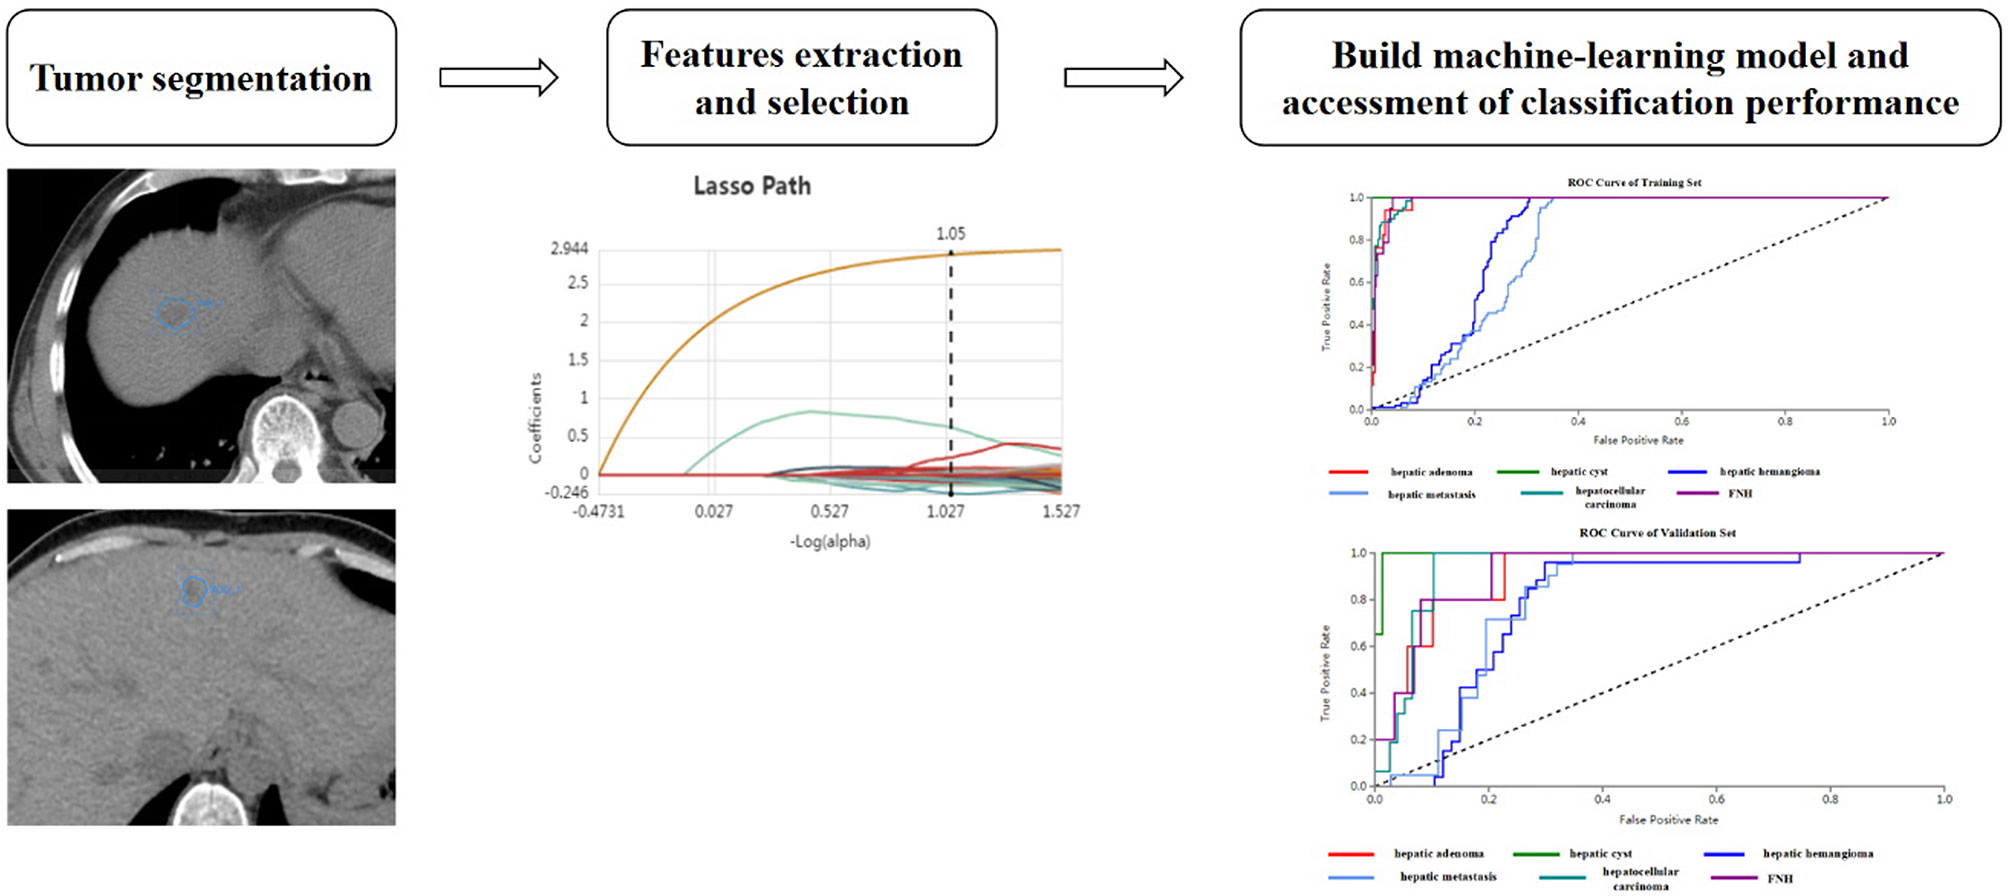
Figure 1 Basic flow chart showing the radiomics method devised for the differential diagnosis of focal hepatic lesions.
Radiomic Features Extraction and Selection
A total number of 1409 quantitative imaging features were extracted from CT images on the Radcloud platform. These features were grouped into four groups. Group 1 (first-order statistics) consisted of 18 descriptors that quantitatively delineated the distribution of the voxel intensities for CT images through commonly used basic metrics. Group 2 (shape- and size-based features) contained 14 three-dimensional features that reflect the shape and size of the region. Calculated from grey-level run-length and grey level co-occurrence texture matrices, 75 textural features that could quantify the region heterogeneity differences were classified into group 3 (texture features). Finally, group 4 (higher-order statistics features) included the first-order statistics, and texture features were derived from wavelet transformation of the original image. We used seven types of filters that included a total number of 14 filters: exponential, gradient, square, square root, logarithm, lbp-2D, and wavelet (wavelet-LLL, wavelet-HHH, wavelet-HLL, wavelet-HHL, wavelet-LLH, wavelet-HLH, wavelet-LHL, and wavelet-LHH).
To explore the generalization performance of the model, training and testing set were split based on a ratio of 8:2 using computer-generated random numbers. All radiomic features were standardized using the Standard Scaler function by removing the mean value, followed by division by its standard deviation and transformation into feature values with zero as the mean and one as the standard deviation.
LASSO is a regression analysis method that can perform both variable selection and regularization to improve the identification accuracy and interpretability of the model. For example, it has a tuning parameter to control the penalty of the linear model, which guarantees the minimum penalty when obtaining a model with a smaller number of features, where the penalty is mean square error (MSE). In addition, another parameter controls the correlation of features, making the selected features less relevant. L1 regularization was used as the cost function, the error value of cross validation was 5, and the maximum number of iterations was 1000. The optimization goal of LASSO is:
Where X is the radioactivity characteristic matrix, y is the sample vector marker, n is the sample number, w is the coefficient vector regression model, alpha∗║w║ is the lasso punishment.
Model Building Using Support Vector Machine Classifiers
In this study, we used Support Vector Machine (SVM) classifiers on the Radcloud platform to establish radiomic-based models based on the extracted optimal features. The basic principle of SVM, is to find an optimal hyperplane that produces a better generalization of the dataset. It develops a model that predicts whether a new sample falls into one of the categories or not. Let’s given a training data set S = {(x1, y1),…,(xn, yn)} where xi ∈ Rn and y i ϵ{+1,−1}.
The xi represents the transferred input vector and yi is the target value. SVM is a binary classifier in which the class labels contain only two values + 1 or −1. From the inputs, SVM draws an optimal hyper-plane H that separates the data into different classes and the hyper-plane H can be defined as:
The algorithm is based on finding the hyper-plane which gives the maximum distance of separation between training samples using the following function.
For the problem of multiclass learning, SVM solved it as a single multi-class problem further it is modified into multiple binary problems. Hence, the optimal hyper-plane can be combined by the inequality.
So, the optimization problem can be written.
Notice that the output value of the SVM is either -1 or 1. When the output value of a subimage of suspicious tumor region is 1, the system will classify the tumor in the CT image as a certain category. Conversely, when the output value is -1, the hepatic tumor will be diagnosed as other.
Statistical Analysis
All statistical analysis were performed with Python 2.7 for Linux. Support vector machine (SVM) were employed based on the optimal discriminative features. Further, the model classification performance was evaluated by AUC (Area Under Curve), accuracy, overall accuracy ((true positives+ true negatives)/(true positives+ false positives+ false negatives+ true negatives)), precision (true positives/(true positives+ false positives)), recall (true positives/(true positives+ false negatives)), f1-score (precision *recall* 2/(precision + recall)), and support (total number in a test set). The formula of confidence interval was as follows:
If
If
Results
Patients
A retrospective analysis of 452 patients (299 men and 153 women; mean age, 53 ± 14.58 years; range, 3-89 years) was included. The relevant lesions studied included 77 with HCC, 104 with hepatic metastases (40 were lung cancer with hepatic metastasis, 34 were gastric cancer with hepatic metastasis, 30 were colorectal cancer with hepatic metastasis), 126 with hepatic hemangioma, 99 with hepatic cysts, 24 with FNH, 22 with HA.
Control group: The diagnostic accuracy based on unenhanced CT images of the two radiologists was 0.51(231/452) and 0.69 (311/452) respectively.
Radiomic Features Extraction and Selection
Our feature stability analysis showed that the ICC for most of radiomics feature was high (Supplementary Tables 4, 5). Therefore, all outcomes were based on the measurements of the first radiologist. In the present study, 1409 texture parameters were obtained from each patient. The LASSO algorithm (Figure 2) was used to evaluate the correlations between each pair of texture parameters and reduce the dimensionality of the above high-dimensional features based on the optimal λ parameters, and the optimal discriminative features were screened. The final optimal discriminative feature set was comprised of 6 first-order statistics, 1 shape, 8 texture, and 11 higher-order statistics features, a total number of 27 (Table 1).
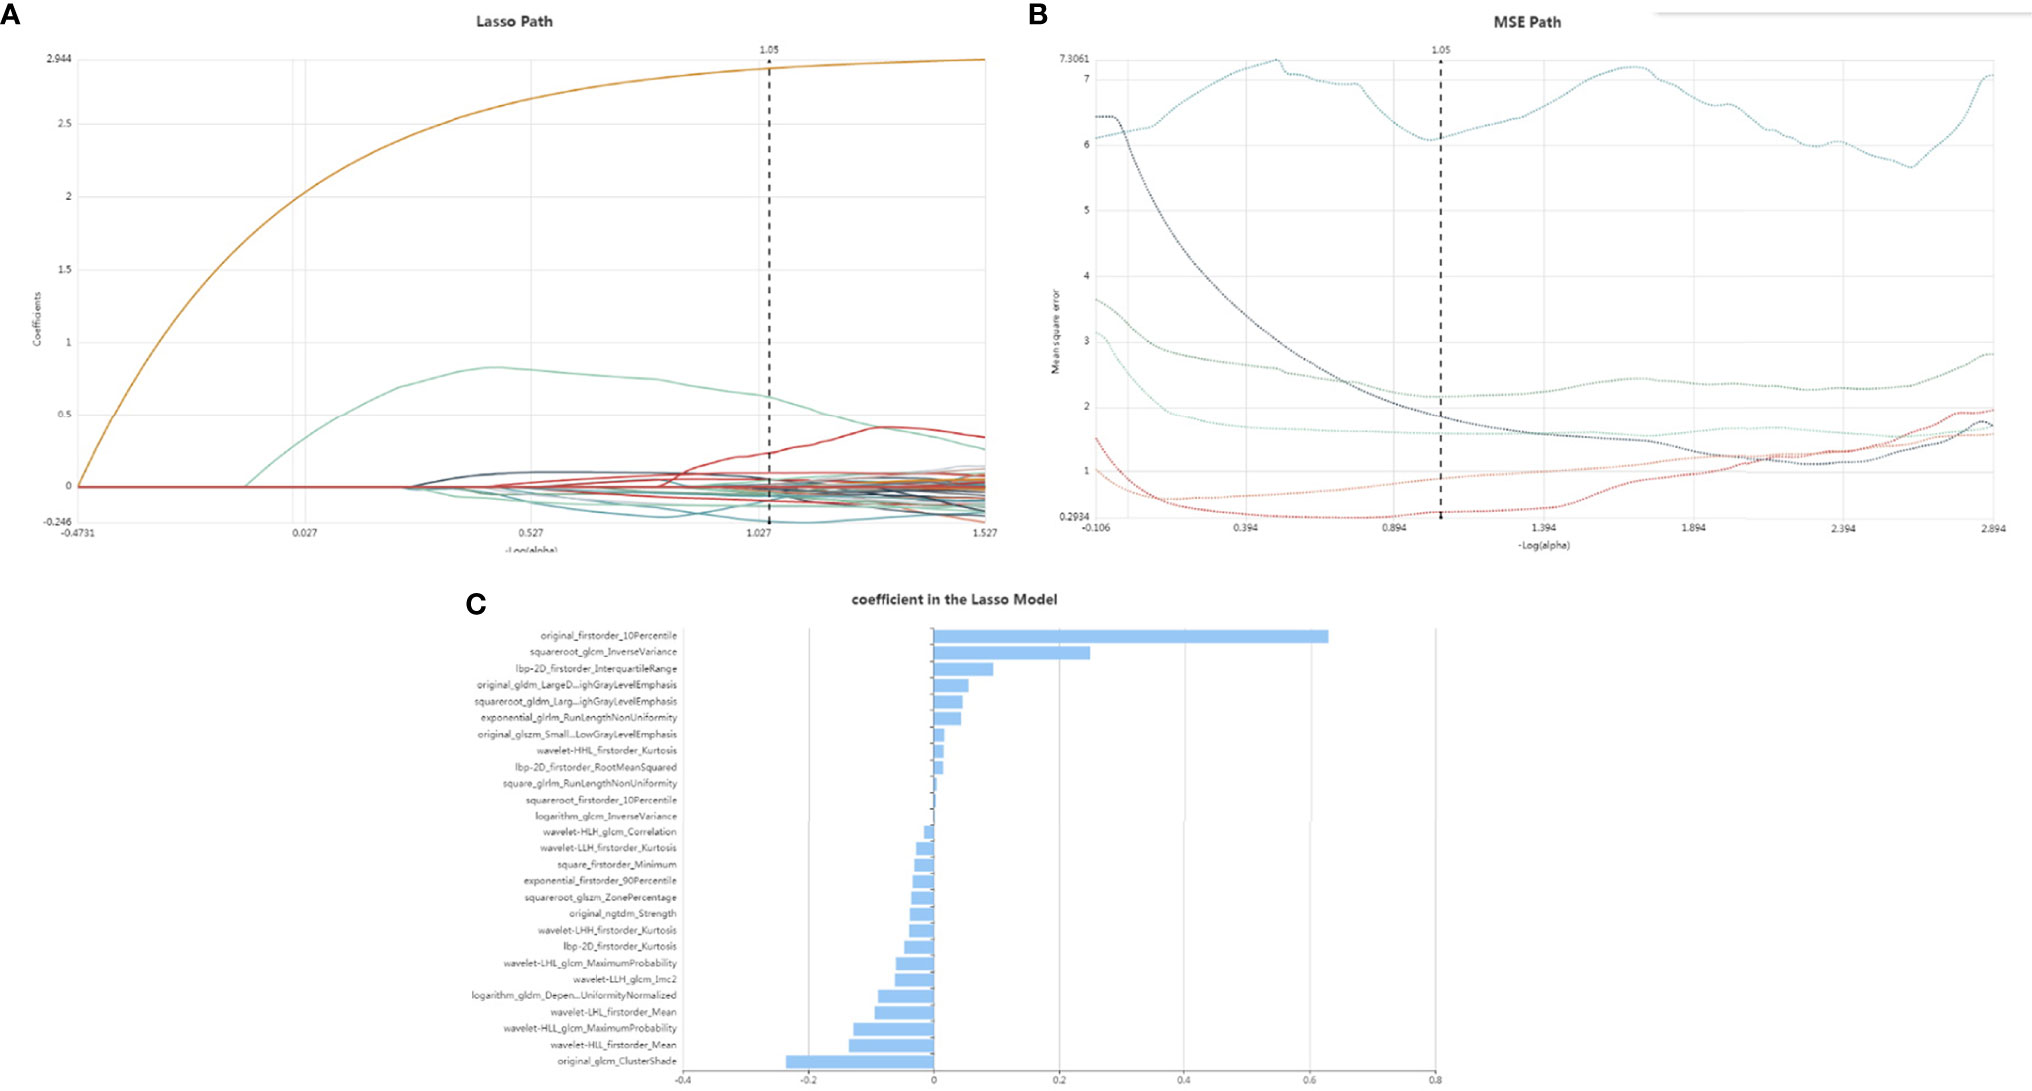
Figure 2 Lasso althorithm on feature selection. (A) Lasso path; (B) MSE path; (C) coefficients in Lasso model. With Lasso model, 27 features were selected according to the optimal alpha.
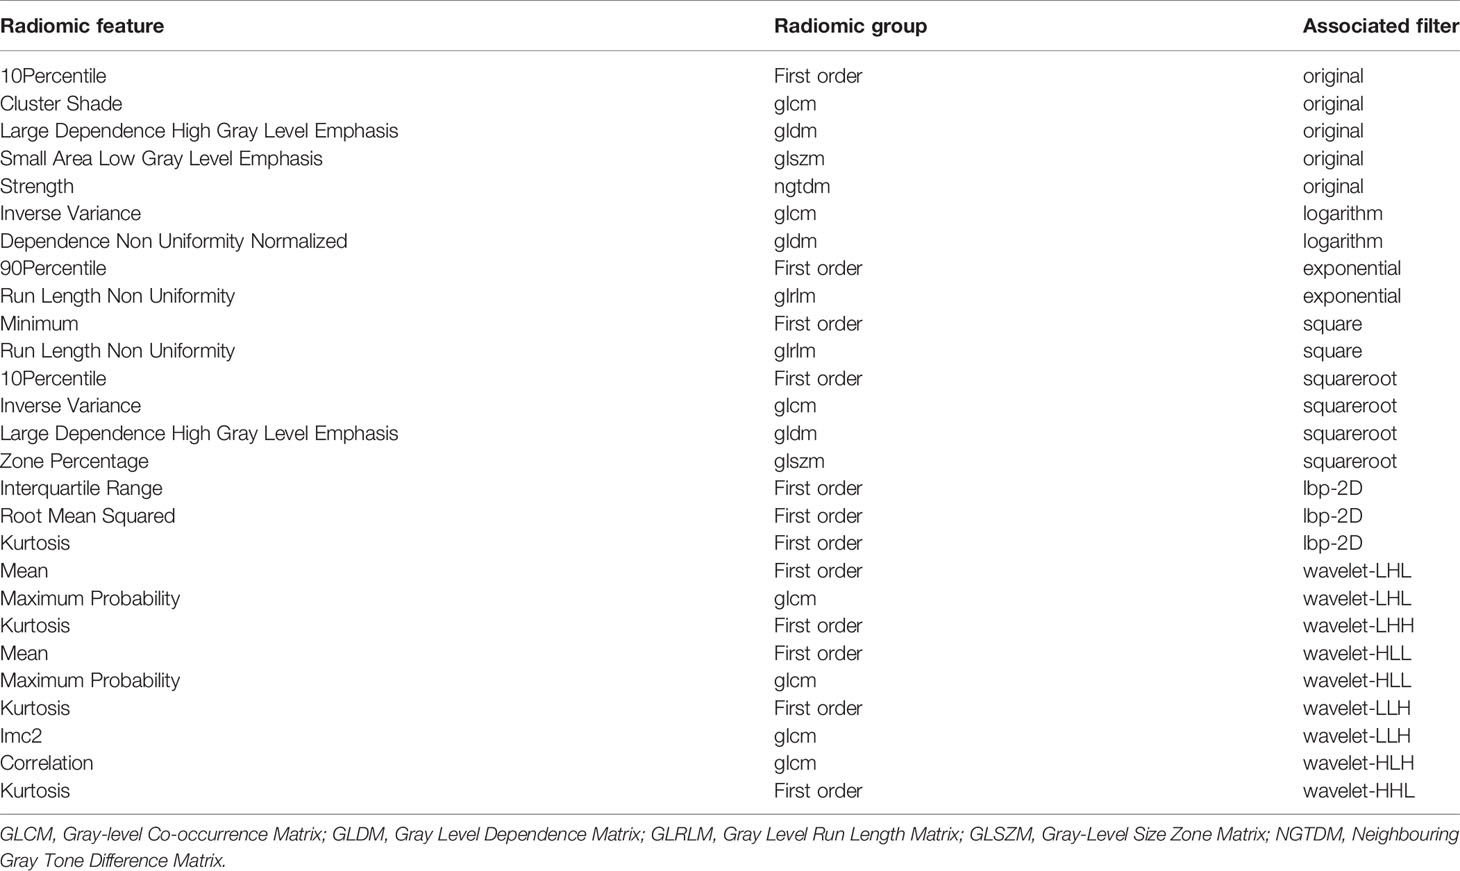
Table 1 Description of the selected radiomic features with their associated feature group and filter.
Diagnostic Performance of Radiomics Models Among Six Focal Hepatic Lesions
The diagnostic efficacies of SVM for the training set and testing set are presented in Table 2. Generally, SVM attained a satisfactory classification performance with an AUC range within 0.942∼1 in the training set and 0.897∼0.995 in the testing set (Figure 3). The overall accuracy in the training and testing set were 0.88 and 0.76 (Table 2, Figure 4), respectively. The other four indicators (precision, recall, f1-score, and support) are summarized in Supplementary Table 1 for the training set and in Supplementary Table 2 for the testing set.
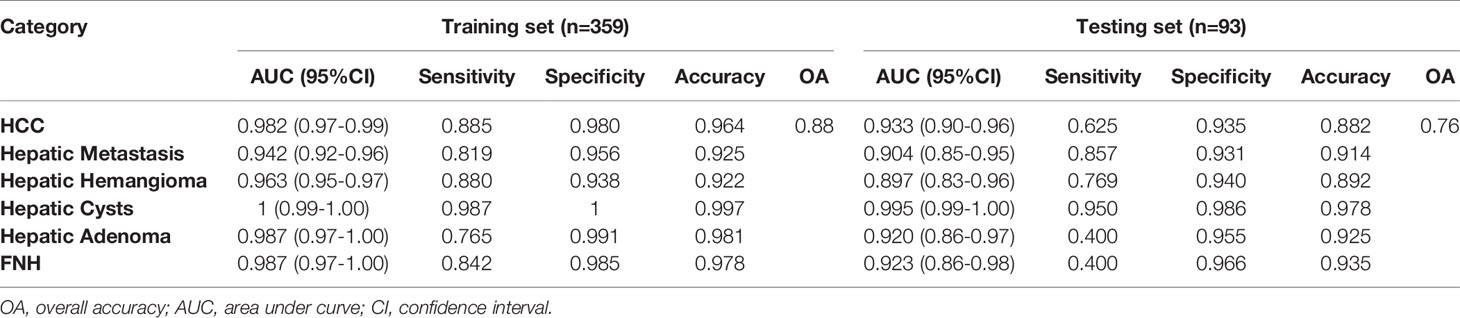
Table 2 Diagnostic performance of radiomics models among six focal hepatic lesions based on unenhanced CT images.
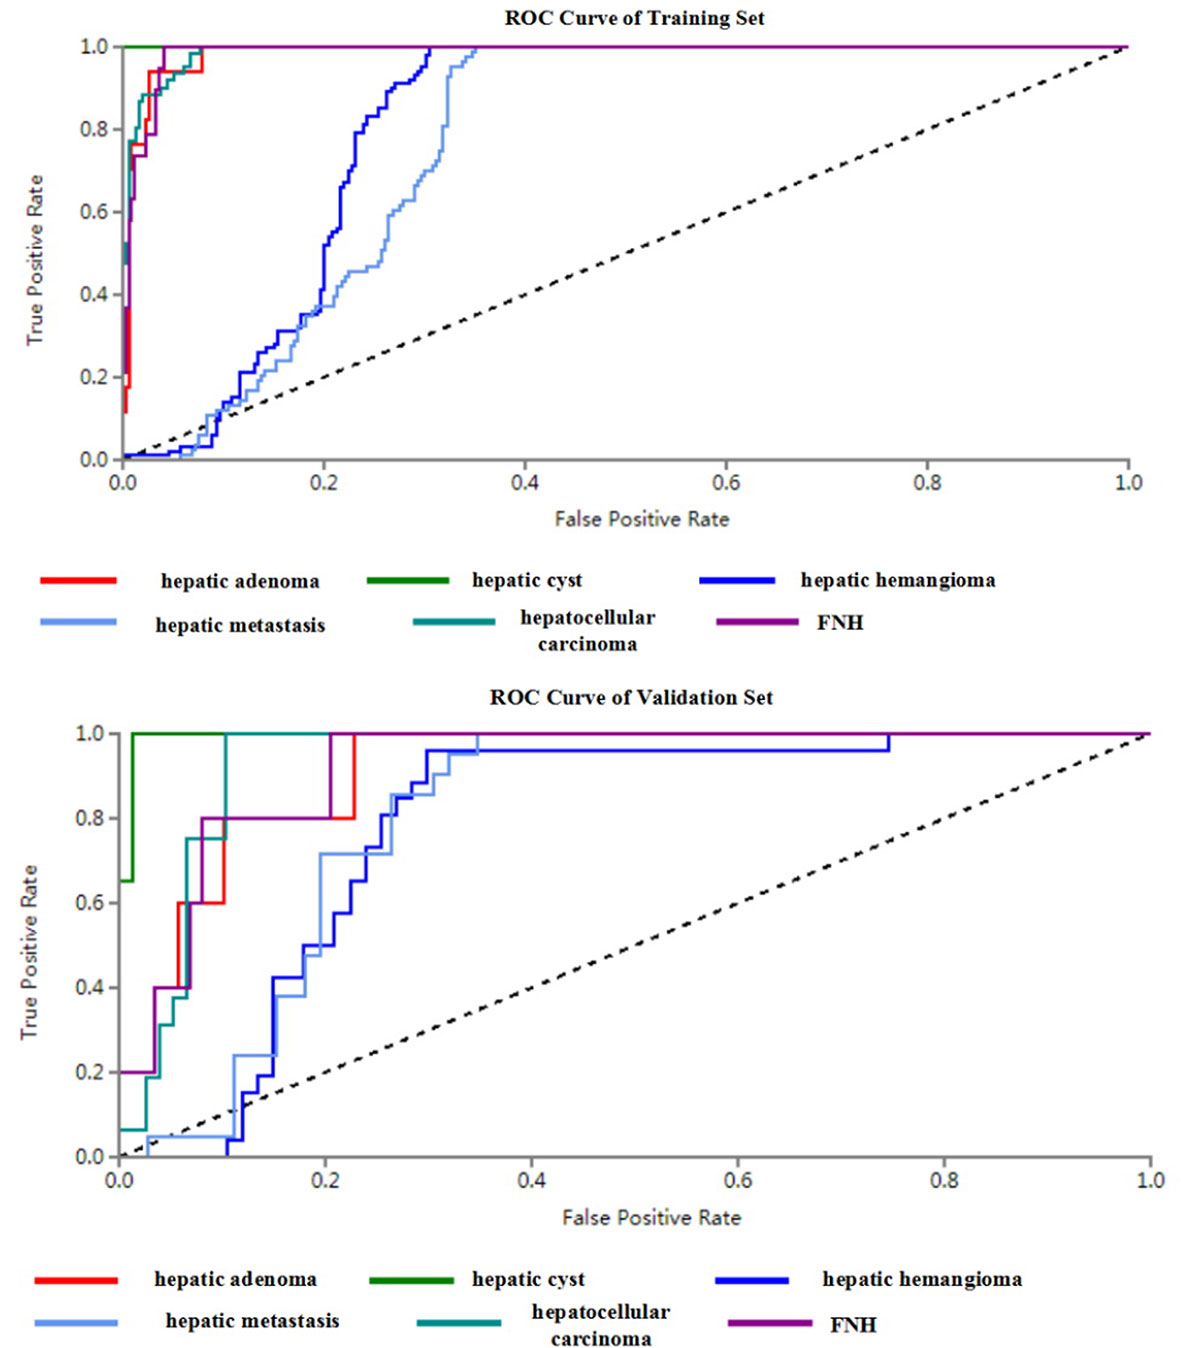
Figure 3 ROC curves of SVM methods to classification (six kinds of focal hepatic lesions).
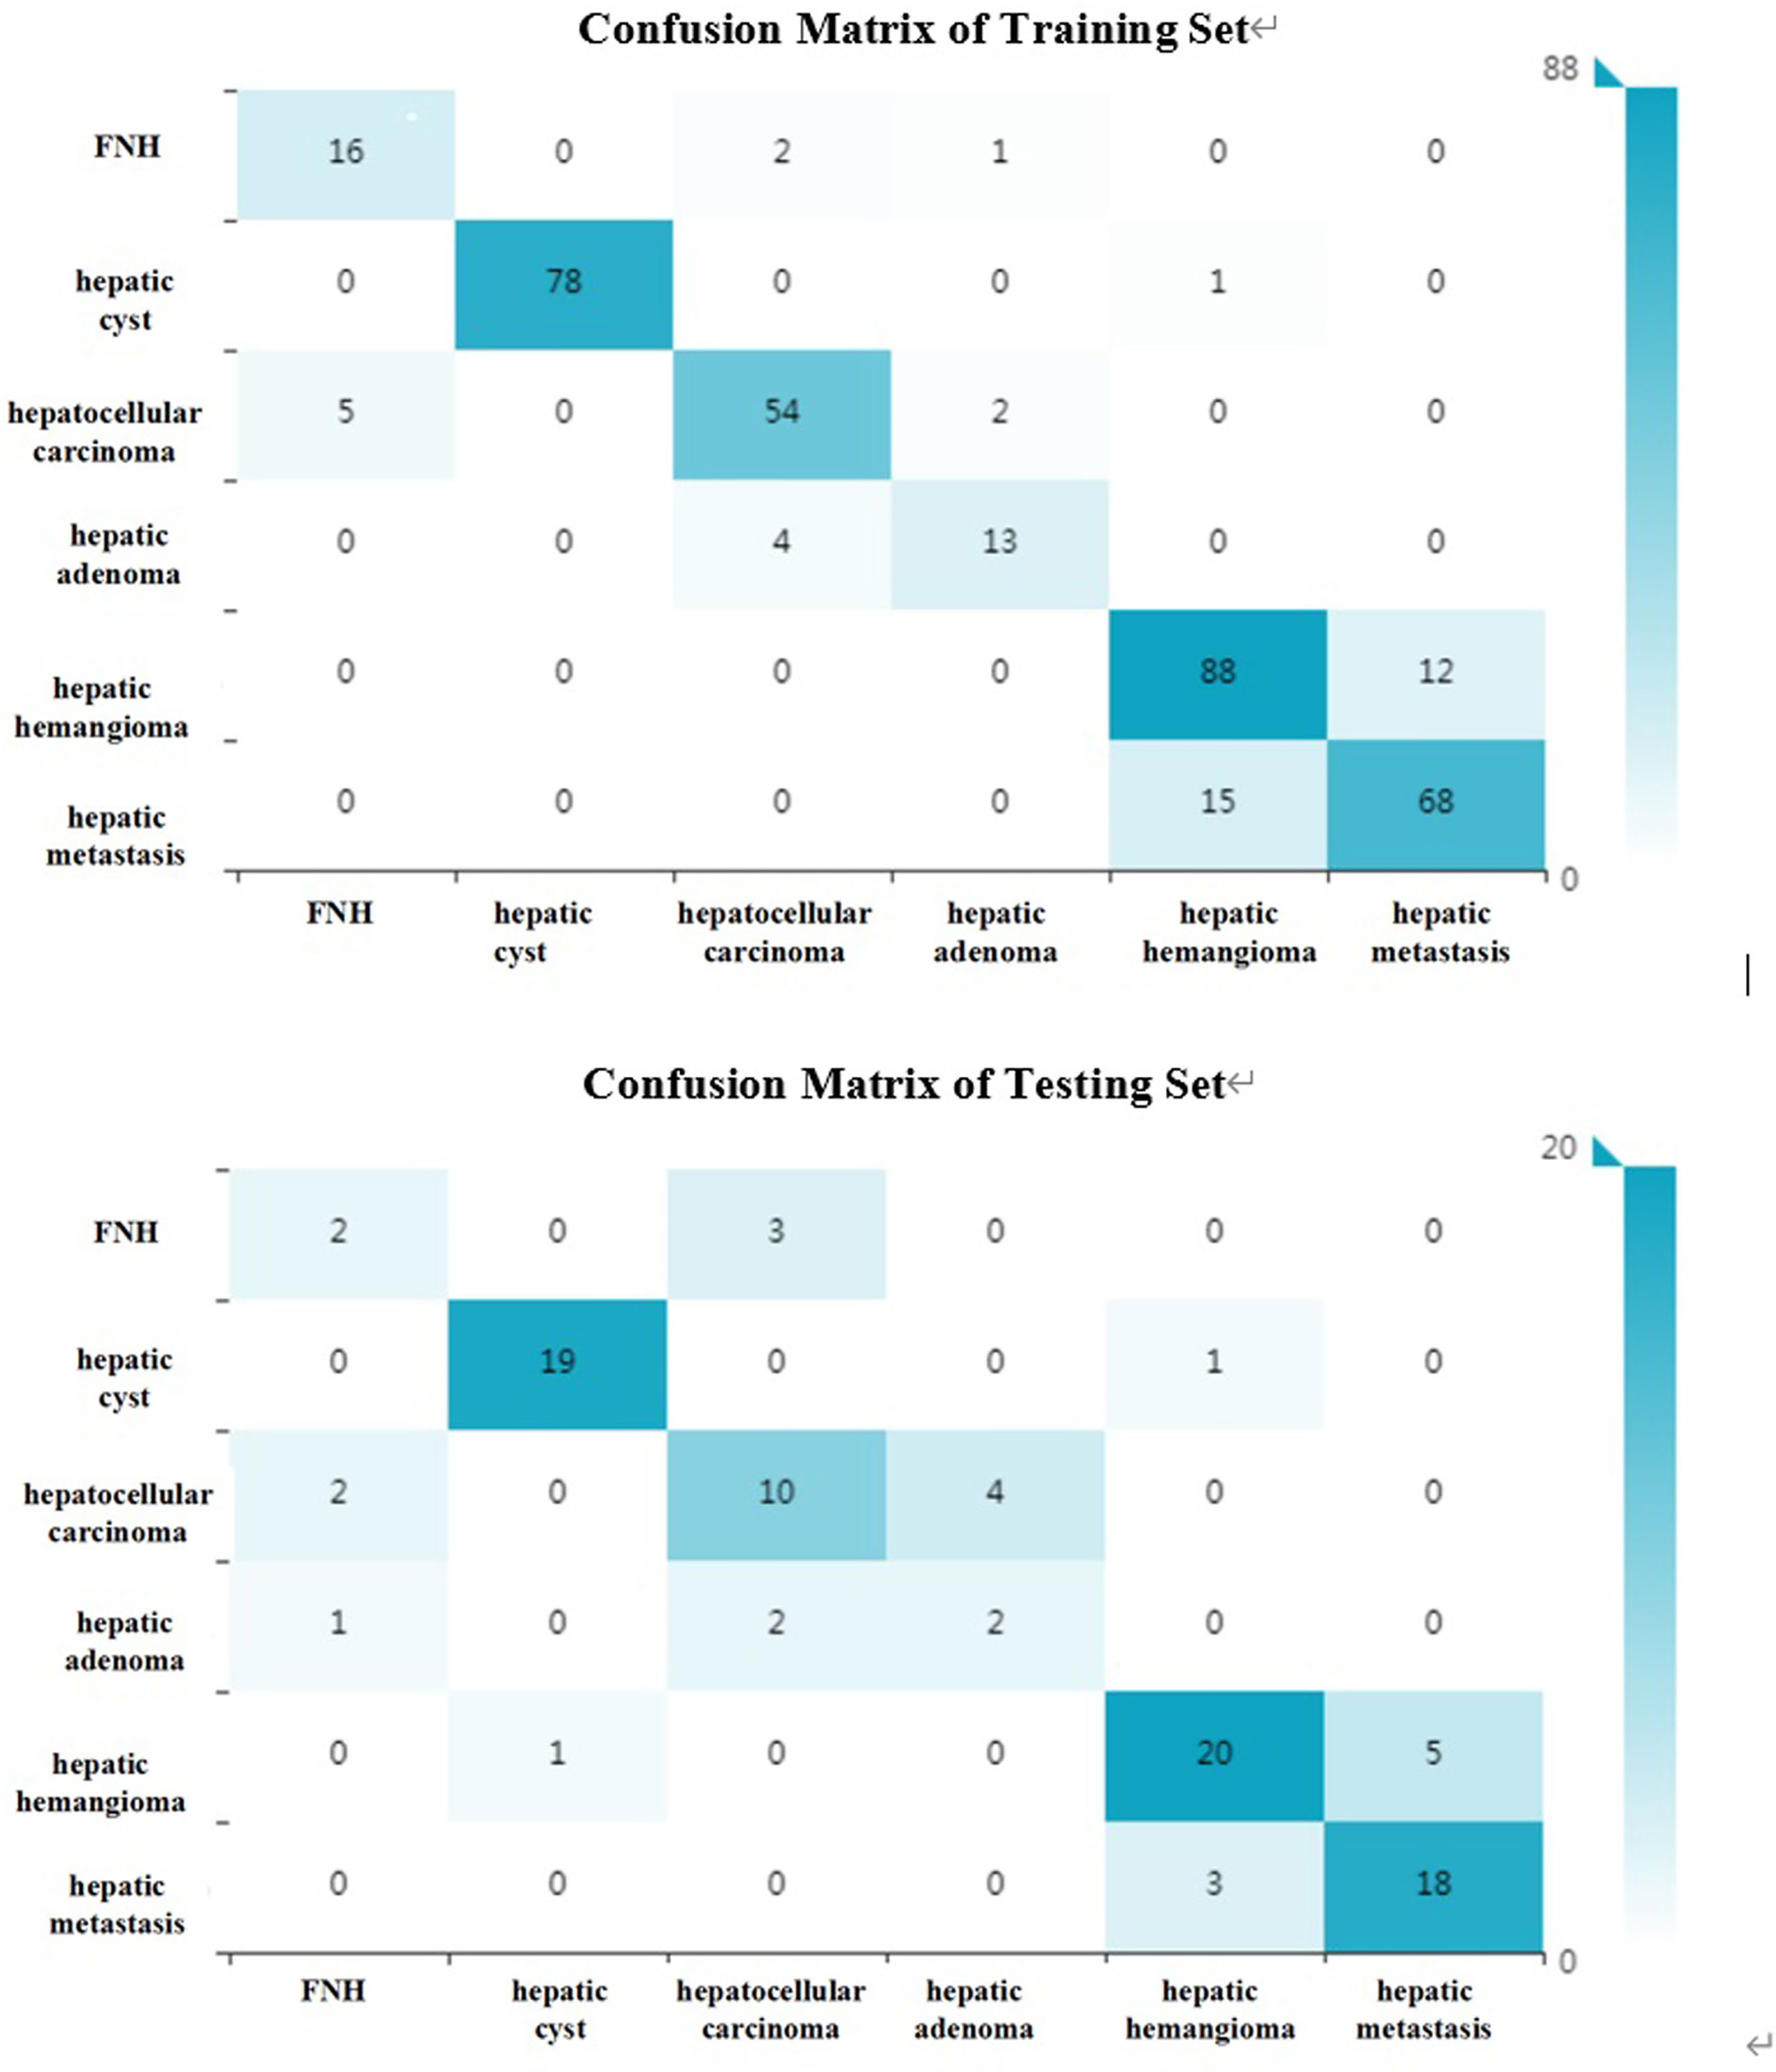
Figure 4 The confusion matrix (six kinds of focal hepatic lesions). Label: overall accuracy (OA) = (true positives+ true negatives)/(true positives+ false positives+ false negatives+ true negatives).
Diagnostic Performance of Radiomics Models Between Benign and Malignant Focal Hepatic Lesions
All included patients were divided into benign group and malignant group. The benign group included hepatic hemangioma, hepatic cyst, FNH and HA (272 patients in total); the malignant group included HCC and hepatic metastases (180 patients in total). 34 optimal discriminative features were selected to distinguish the benign and malignant tumors(Supplementary Table 3, Supplementary Figure 1). Generally, SVM attained a satisfactory classification performance, and the AUC in the training and testing set was 0.951 and 0.899 (Table 3, Figure 5). The overall accuracy in the training and testing set was 0.89 and 0.84 (Table 3, Figure 6), respectively.
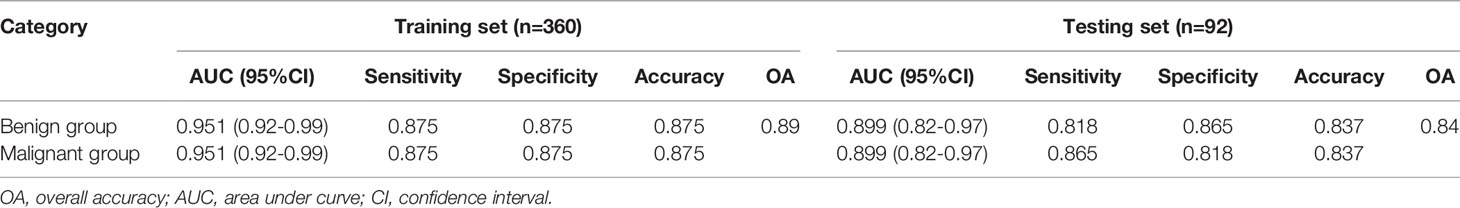
Table 3 Diagnostic performance of radiomics models between benign and malignant focal hepatic lesions.
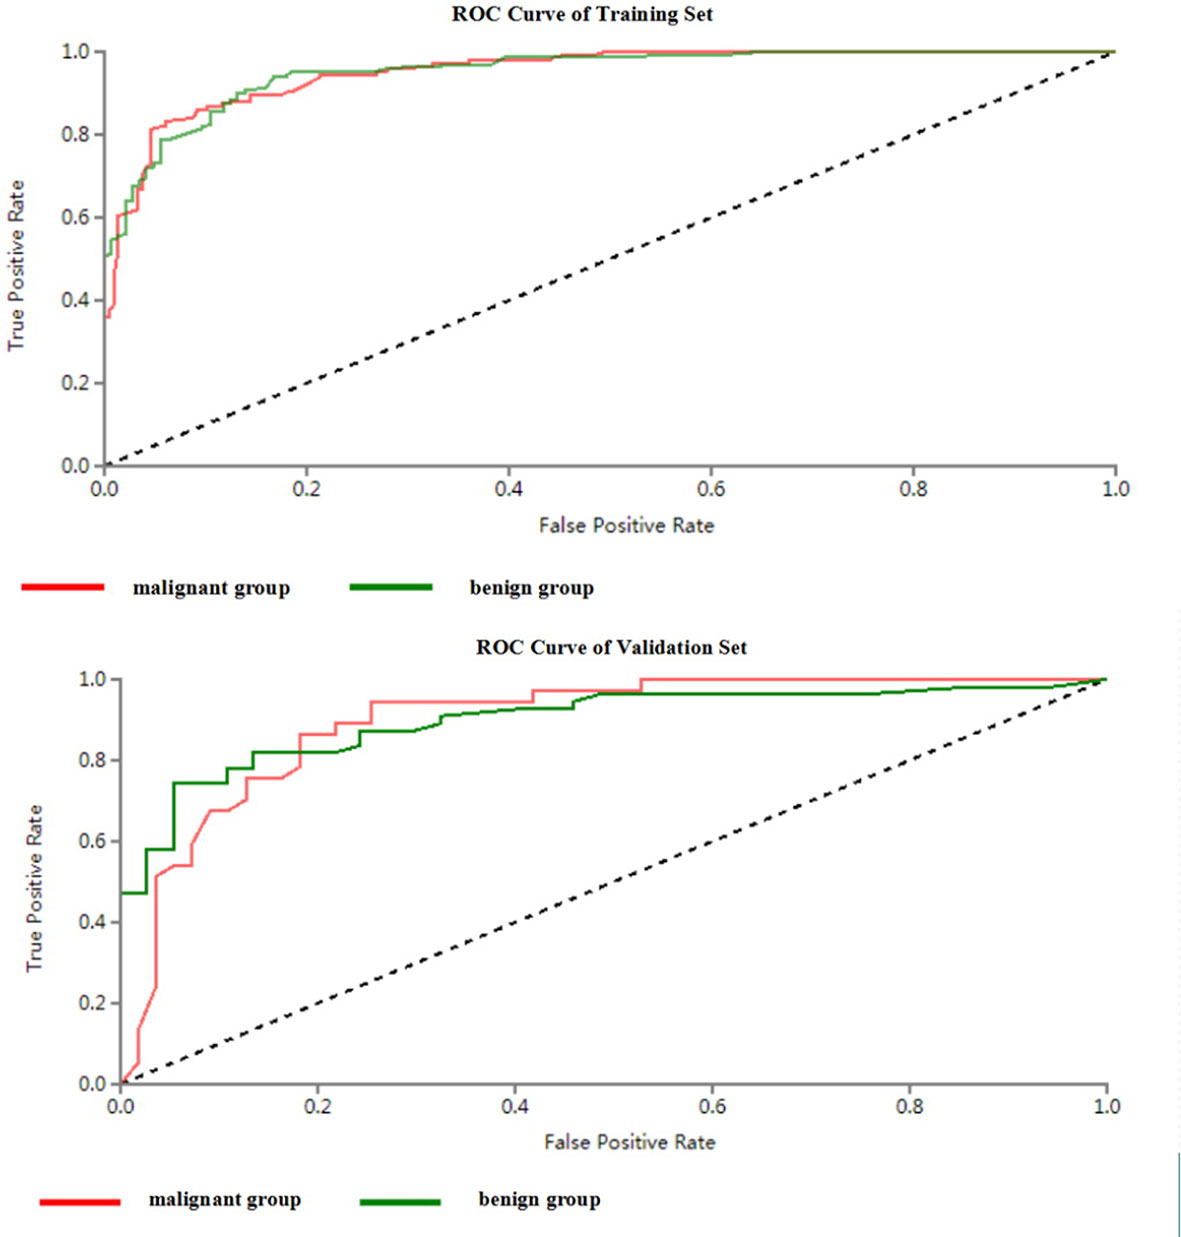
Figure 5 ROC curves of SVM methods to classification (benign and malignant groups).
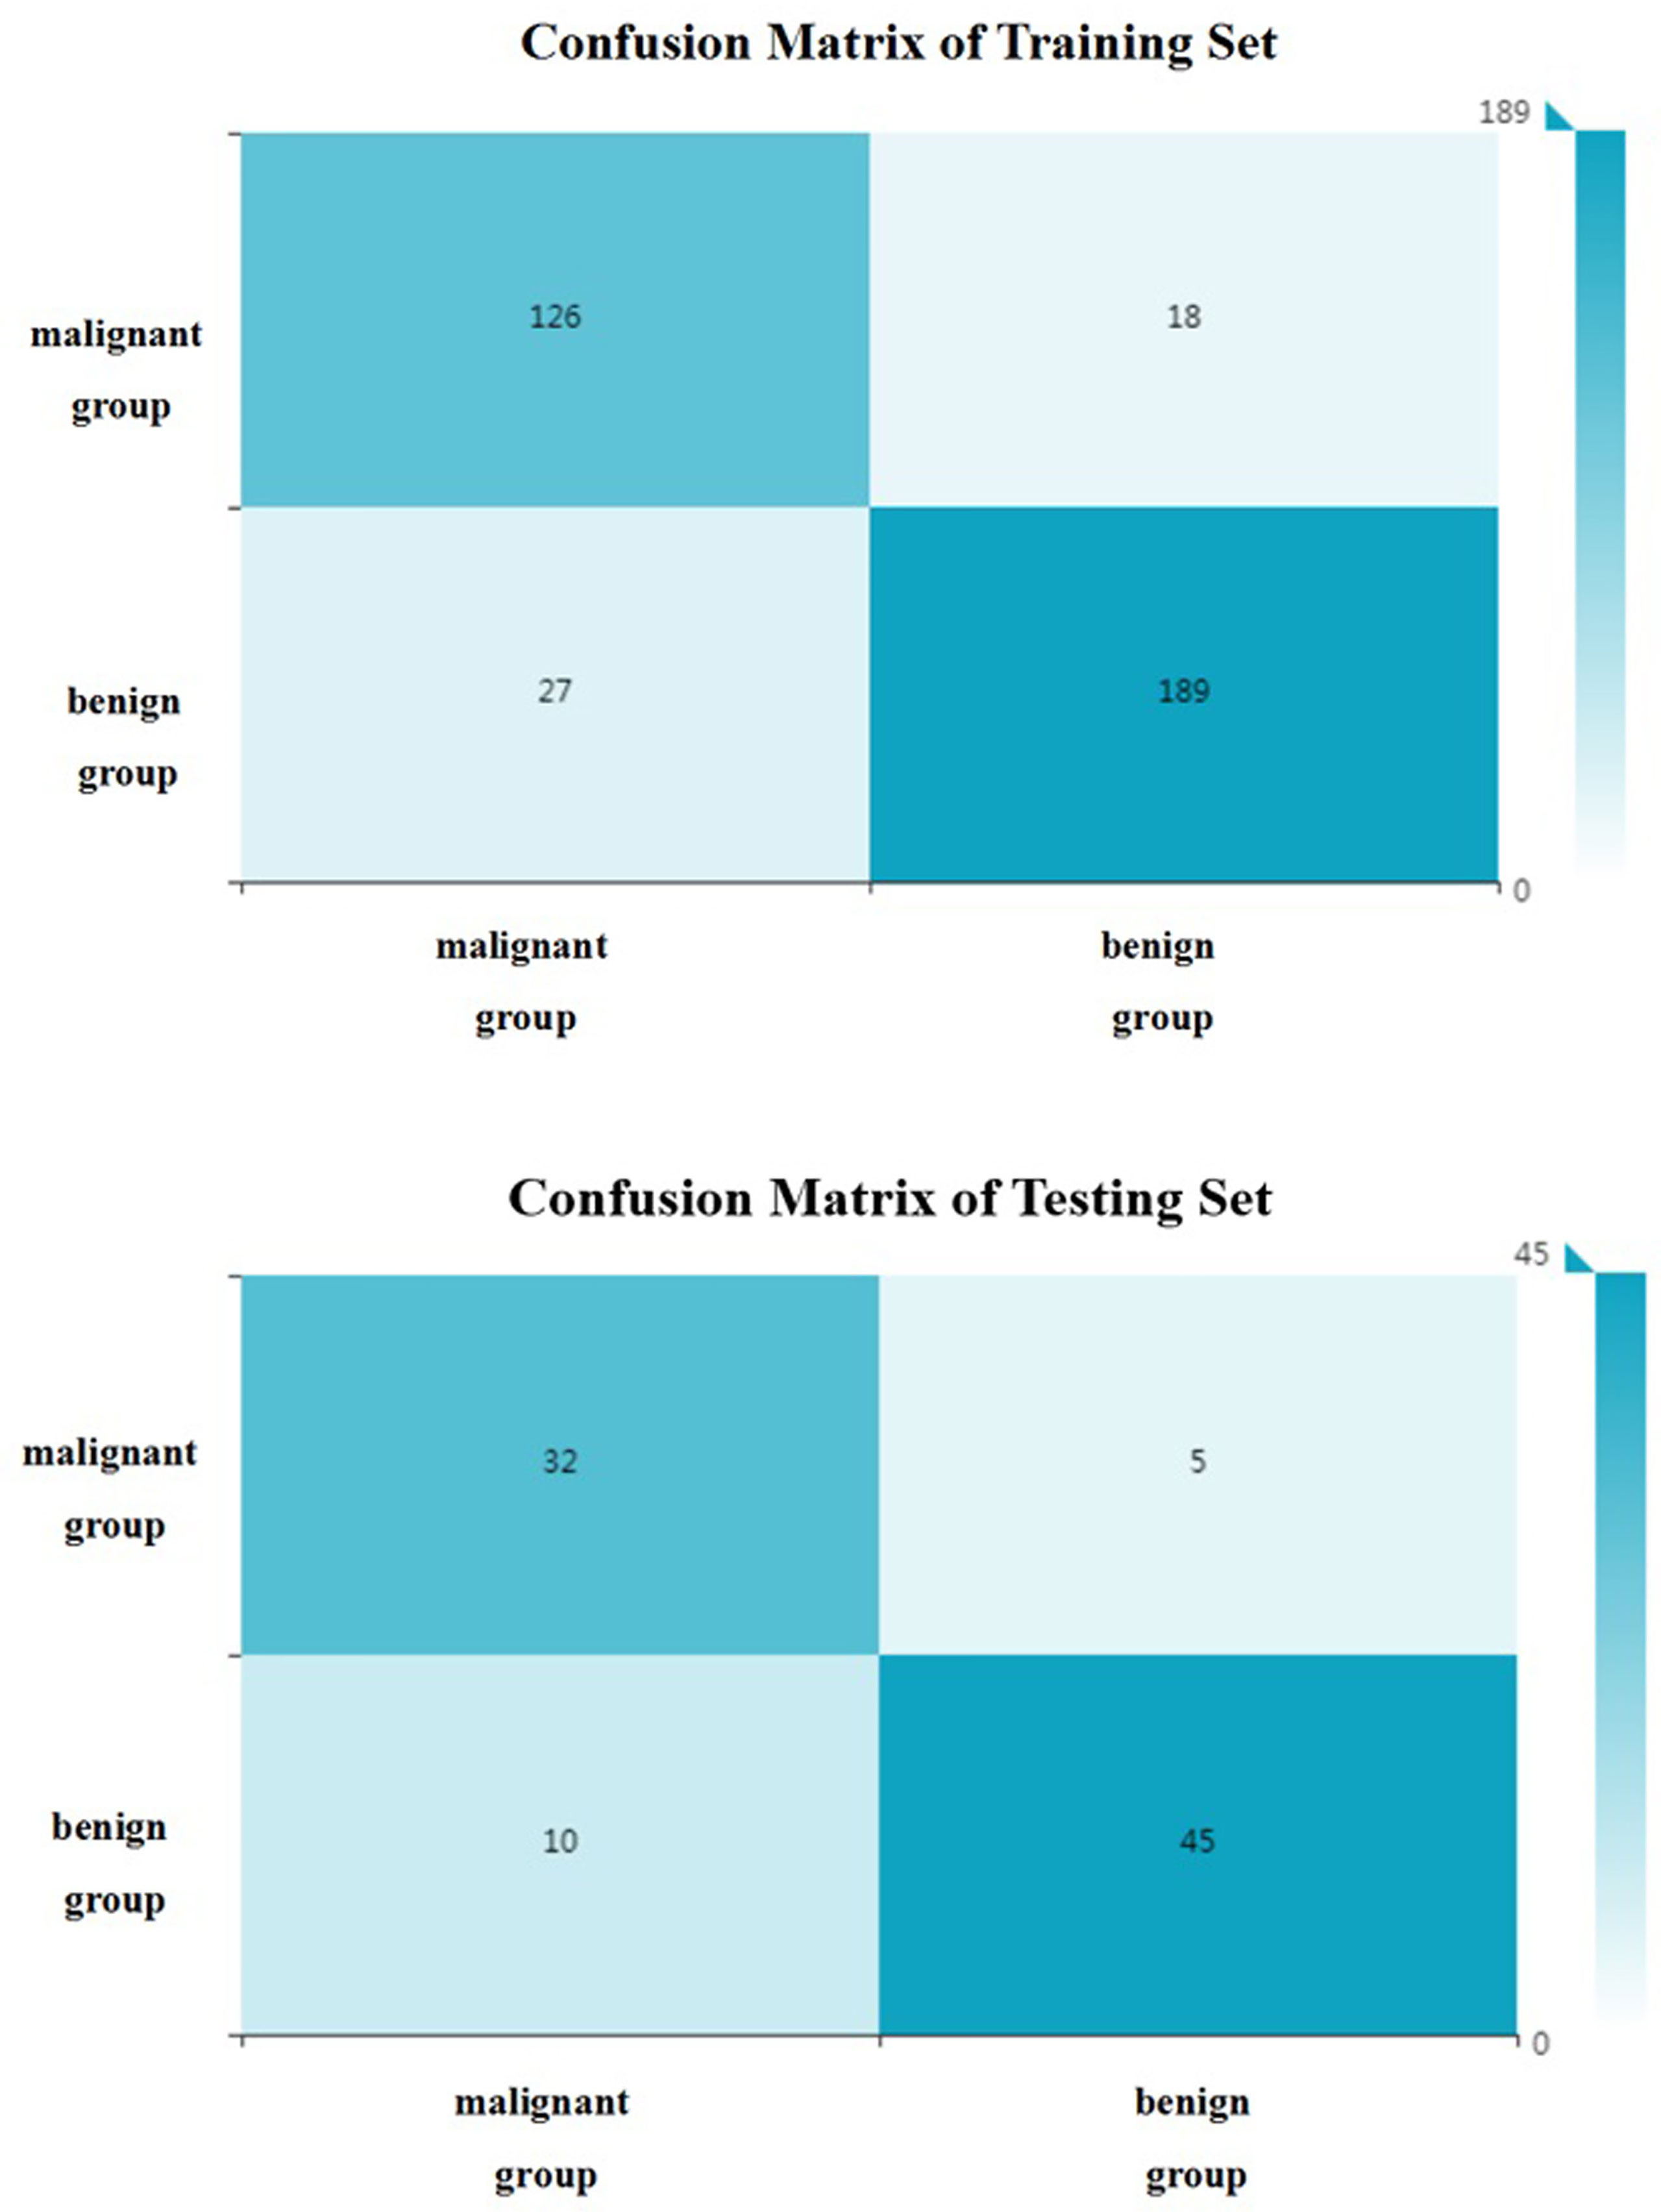
Figure 6 The confusion matrix (benign and malignant groups). Label: overall accuracy (OA) = (true positives+ true negatives)/(true positives+ false positives+ false negatives+ true negatives).
Discussion
In this study, we developed and validated a novel CAD system based on unenhanced CT images for differentiation among HCC, hepatic metastasis, hepatic hemangioma, hepatic cyst, HA, and FNH, and differentiating benign tumors from malignant tumors. The classifiers all had good diagnostic performance, and the overall accuracies of the training and testing sets were 0.88 and 0.76, 0.89 and 0.84 correspondingly.
As the main examination method for the diagnosis of focal hepatic lesions, enhanced CT has been used in the diagnosis of fatty liver, calcification and focal liver lesions (6, 17–19). However, enhanced CT examination is confronted with the problems of adverse effects caused by contrast agents and radiation doses. Related studies had shown that the incidence of adverse reactions of ionic iodine contrast agents was 12.66%, and the nonionic type was 3.13% (20). And the rate of acute adverse events for low-osmolar contrast agents is approximately 0.2%–0.7% and for severe acute reactions, 0.04% (21). Contrast agent allergy can cause adverse reactions such as nausea and vomiting, dizziness, headache, rash, severe blood pressure, convulsions, shock, and even death (22, 23). Intravenous low-osmolality iodinated contrast material brings some potential risks with a stable estimated glomerular filtration rate less than 30 mL/min/1.73 m2, with a trend toward significance at 30–44 mL/min/1.73 m2 (24). In addition, Kostas et al. found that the injection of iodine contrast agent could significantly increase the radiation dose of CT irradiation on tissues (25). Therefore, in this study, unenhanced CT images were selected to differentiate focal hepatic lesions, to avoid the disadvantages of contrast agents and to reduce the economic cost.
Radiomics can easily extract high-throughput features from medical images and convert them into quantitative indicators to realize the process transformation from image to data (26). Texture features can not only reflect the morphological features of the lesion visible to the naked eye, but also reflect the microscopic features of the lesion that cannot be observed with the naked eye. It can be more accurate to reflect the heterogeneity of the tumor. Huang et al. used computer-aided diagnosis methods to distinguish liver malignant tumors and liver hemangioma through unenhanced CT images, with an accuracy of 0.817 (27). In the present study, the benign and malignant hepatic diseases were subdivided. Based on unenhanced CT images, the method of texture analysis was used to distinguish HCC, hepatic metastases, hepatic hemangioma, hepatic cyst, hepatic focal nodular hyperplasia, and hepatic adenomas. The overall accuracy of the training set can reach 0.88. And the accuracies of these six kinds of focal hepatic lesions were over 0.85(Table 2). The main reason is that this research uses the voxel (VOI) model to extract high-level texture features (1409 in total), which is better than the 2D low-level texture feature model based on the region of interest (ROI). According to the confusion matrix (Figure 4), there were 19 focal nodular hyperplasia lesions in the training group; 16 lesions were correctly diagnosed; 2 were misdiagnosed as hepatocellular carcinoma; 1 was misdiagnosed as hepatic adenoma. There was 61 hepatocellular carcinoma; 54 were correctly diagnosed; 5 were misdiagnosed as hepatic focal nodular hyperplasia; 2 were misdiagnosed as hepatic adenomas. There were 17 hepatic adenomas; 13 were correctly diagnosed; 4 were misdiagnosed as liver cancer. Therefore, it is difficult to differentiate atypical focal hepatic nodular hyperplasia, hepatic adenoma and HCC. That might be related to hemorrhagic necrosis (28). The overall accuracy of the testing set was 0.76, lower than the training set, which might be related to the fewer cases of FNH and hepatic adenoma.
The overall accuracy of the training and testing sets in this study is higher than two radiologists. Currently, CT texture analysis studies are undergoing, aimed to facilitate diagnosis by radiologists and help clinicians to make the right therapeutic choice. Although this is only a preliminary study, and a small number of samples of different types of lesions were collected, the results showed that CT texture analysis in combination with appropriate statistical models can be effectively used to identify different lesions.
Differentiation of benign and malignant liver diseases through texture analysis can avoid unnecessary invasive examination and treatment (29). Song et al. selected the arterial phase and used texture analysis to distinguish benign and malignant liver masses (11). the area under the ROC curve can reach 0.927. In the present study, the benign and malignant liver masses were distinguished based on unenhanced CT images. And the area under the ROC curve can reach 0.95 in the training group and 0.90 in the testing set. And according the confusion matrix, the overall accuracy to distinguish the benign and malignant hepatic masses can reach 0.88 and 0.84 separately in the training and testing set. This shows that CT texture analysis has high accuracy in the identification of benign and malignant hepatic masses. Kamel et al. showed that the AUC of dual-source CT in the differential diagnosis of hepatic masses by three experienced radiologists were 0.84, 0.83 and 0.85 respectively (30), which were lower than the results of this study. This shows that texture analysis has better performance in diagnosis. And in the present study, unenhanced CT images were selected to differentiate focal liver lesions, to avoid the disadvantages of contrast agent and reduce the economic cost, so that we can provide another choice for patients who are allergic to contrast agents or can not afford the price of enhanced CT examinations. It makes clinicians have more choices for different patients.
Several limitations of the present study should be acknowledged. Firstly, the sample size is small, especially for focal nodular hyperplasia and hepatic adenoma. In the follow-up study, more new cases should be included and the sample size should be increased; secondly, because of their typical imaging manifestations, patients with hepatic hemangioma and hepatic cyst have not been confirmed by pathology; thirdly, the CT equipment was not uniform. Although 5-mm axial images were selected, the results were compromised due to the different scanning equipment. Fourthly, this is a retrospective single-center study. Further independent prospective multicenter validation cohort and large-scale data are needed to verify the stability of our model; fifthly, patients with hepatitis B, cirrhosis, liver injury or liver surgery found on non-contrast CTs were excluded. Therefore, in these cases, the proposed method can not be applied.
In conclusion, we present a novel tool for potentially distinguishing focal hepatic lesions with noninvasive radiomic features using a computer-aided discriminative diagnosis model based on unenhanced CT images. While our initial results are encouraging, future studies are needed to determine the clinical applications.
Data Availability Statement
The original contributions presented in the study are included in the article/Supplementary Material. Further inquiries can be directed to the corresponding author.
Ethics Statement
The present study was approved by the Institutional Review Board of Zhengzhou University. Written informed consent to participate in this study was provided by the participants’ legal guardian/next of kin.
Author Contributions
Study concept and design, XZ, PL, and JG. Imaging data collection, XZ. Imaging preliminary valuation, XZ. Imaging final valuation, PL. Statistical analysis, LY and YJ. Manuscript preparation, XZ. All authors contributed to the article and approved the submitted version.
Funding
This study has received funding by National Natural and Science Fund of China (NO. 81671682).
Conflict of Interest
Author YJ was employed by the company Huiying Medical Technology Co., Ltd.
The remaining authors declare that the research was conducted in the absence of any commercial or financial relationships that could be construed as a potential conflict of interest.
Publisher’s Note
All claims expressed in this article are solely those of the authors and do not necessarily represent those of their affiliated organizations, or those of the publisher, the editors and the reviewers. Any product that may be evaluated in this article, or claim that may be made by its manufacturer, is not guaranteed or endorsed by the publisher.
Acknowledgments
The study was supported by the Department of Radiology of the First Affiliated Hospital of Zhengzhou University.
Supplementary Material
The Supplementary Material for this article can be found online at: https://www.frontiersin.org/articles/10.3389/fonc.2022.650797/full#supplementary-material
References
1. Salem S, Houseni M, Zidan L, Kandil A. The Added Value of PET/Ce-CT/DW-MRI Fusion in Assessment of Hepatic Focal Lesions: PET/Ce-CT/DW-MRI Fusion in Hepatic Focal Lesion. Nucl Med Biol (2015) 42(7):637–42. doi: 10.1016/j.nucmedbio.2015.03.010
2. Braga HJ, Choti MA, Lee VS, Paulson EK, Siegelman ES, Bluemke DA. Liver Lesions: Manganese-Enhanced MR and Dual-Phase Helical CT for Preoperative Detection and Characterization Comparison With Receiver Operating Characteristic Analysis. Radiology (2002) 223(2):525–31. doi: 10.1148/radiol.2232010908
3. Reimer P, Jähnke N, Fiebich M, Schima W, Deckers F, Marx C, et al. Hepatic Lesion Detection and Characterization: Value of Nonenhanced MR Imaging, Superparamagnetic Iron Oxide-Enhanced MR Imaging, and Spiral CT-ROC Analysis. Radiology (2000) 217(1):152–8. doi: 10.1148/radiology.217.1.r00oc31152
4. Li T, Qin LX, Ji Y, Sun HC, Ye QH, Wang L, et al. Atypical Hepatic Focal Nodular Hyperplasia Presenting as Acute Abdomen and Misdiagnosed as Hepatocellular Carcinoma. Hepatol Res (2007) 37(12):1100–5. doi: 10.1111/j.1872-034X.2007.00164.x
5. Hussain SM, Terkivatan T, Zondervan PE, Lanjouw E, de Rave S, Ijzermans JN, et al. Focal Nodular Hyperplasia: Findings at State-Of-the-Art MR Imaging, US, CT, and Pathologic Analysis. Radiographics (2004) 24(1):3–17. doi: 10.1148/rg.241035050
6. Nino-Murcia M, Olcott EW, Jeffrey RB Jr, Lamm RL, Beaulieu CF, Jain KA. Focal Liver Lesions: Pattern-Based Classification Scheme for Enhancement at Arterial Phase Ct. Radiology (2000) 215(3):746–51. doi: 10.1148/radiology.215.3.r00jn03746
7. Wang N, Ju Y, Wu J, Liu A, Chen A, Liu J, et al. Differentiation of Liver Abscess From Liver Metastasis Using Dual-Energy Spectral CT Quantitative Parameters. Eur J Radiol (2019) 113:204–8. doi: 10.1016/j.ejrad.2019.02.024
8. Gillies RJ, Kinahan PE, Hricak H. Radiomics: Images Are More Than Pictures, They Are Data. Radiology (2016) 278(2):563–77. doi: 10.1148/radiol.2015151169
9. Lambin P, Rios-Velazquez E, Leijenaar R, Carvalho S, van Stiphout RG, Granton P, et al. Radiomics: Extracting More Information From Medical Images Using Advanced Feature Analysis. Eur J Cancer (2012) 48(4):441–6. doi: 10.1016/j.ejca.2011.11.036
10. Kumar V, Gu Y, Basu S, Berglund A, Eschrich SA, Schabath MB, et al. Radiomics: The Process and the Challenges. Magn Reson Imaging (2012) 30(9):1234–48. doi: 10.1016/j.mri.2012.06.010
11. Song S, Li Z, Niu L, Zhou X, Wang G, Gao Y, et al. Hypervascular Hepatic Focal Lesions on Dynamic Contrast-Enhanced CT: Preliminary Data From Arterial Phase Scans Texture Analysis for Classification. Clin Radiol (2019) 74(8):653.e11–653.e18. doi: 10.1016/j.crad.2019.05.010
12. Gourtsoyianni S, Papanikolaou N, Yarmenitis S, Maris T, Karantanas A, Gourtsoyiannis N. Respiratory Gated Diffusion-Weighted Imaging of the Liver: Value of Apparent Diffusion Coefficient Measurements in the Differentiation Between Most Commonly Encountered Benign and Malignant Focal Liver Lesions. Eur Radiol (2008) 18(3):486–92. doi: 10.1007/s00330-007-0798-4
13. Nicolau C, Vilana R, Catalá V, Bianchi L, Gilabert R, García A, et al. Importance of Evaluating All Vascular Phases on Contrast-Enhanced Sonography in the Differentiation of Benign From Malignant Focal Liver Lesions. AJR Am J Roentgenol (2006) 186(1):158–67. doi: 10.2214/AJR.04.1009
14. Yasaka K, Akai H, Abe O, Kiryu S. Deep Learning With Convolutional Neural Network for Differentiation of Liver Masses at Dynamic Contrast-Enhanced CT: A Preliminary Study. Radiology (2018) 286(3):887–96. doi: 10.1148/radiol.2017170706
15. Geng Y, Zhang F, Zhang R, Chen Y, Yuwei X, Wang F, et al. RadCloud—An Artificial Intelligence-Based Research Platform Integrating Machine Learning-Based Radiomics, Deep Learning, and Data Management. J Artif Intell Med Sci (2021) 2(1–2):97–102. doi: 10.2991/jaims.d.210617.001
16. Li W, Zhang L, Tian C, Song H, Fang M, Hu C, et al. Prognostic Value of Computed Tomography Radiomics Features in Patients With Gastric Cancer Following Curative Resection. Eur Radiol (2019) 29(6):3079–89. doi: 10.1007/s00330-018-5861-9
17. Van Hoe L, Baert AL, Gryspeerdt S, Vandenbosh G, Nevens F, Van Steenbergen W, et al. Dual-Phase Helical CT of the Liver: Value of an Early-Phase Acquisition in the Differential Diagnosis of Noncystic Focal Lesions. AJR Am J Roentgenol (1997) 168(5):1185–92. doi: 10.2214/ajr.168.5.9129409
18. van Leeuwen MS, Noordzij J, Feldberg MA, Hennipman AH, Doornewaard H. Focal Liver Lesions: Characterization With Triphasic Spiral Ct. Radiology (1996) 201(2):327–36. doi: 10.1148/radiology.201.2.8888219
19. Itai Y, Ohtomo K, Kokubo T, Yamauchi T, Minami M, Yashiro N, et al. CT of Hepatic Masses: Significance of Prolonged and Delayed Enhancement. AJR Am J Roentgenol (1986) 146(4):729–33. doi: 10.2214/ajr.146.4.729
20. Morzycki A, Bhatia A, Murphy KJ. Adverse Reactions to Contrast Material: A Canadian Update. Can Assoc Radiol J (2017) 68(2):187–93. doi: 10.1016/j.carj.2016.05.006
21. Beckett KR, Moriarity AK, Langer JM. Safe Use of Contrast Media: What the Radiologist Needs to Know. Radiographics (2015) 35(6):1738–50. doi: 10.1148/rg.2015150033
22. Loh S, Bagheri S, Katzberg RW, Fung MA, Li CS. Delayed Adverse Reaction to Contrast-Enhanced CT: A Prospective Single-Center Study Comparison to Control Group Without Enhancement. Radiology (2010) 255(3):764–71. doi: 10.1148/radiol.10091848
23. Webb JA, Stacul F, Thomsen HS, Morcos SK. Members Of The Contrast Media Safety Committee Of The European Society Of Urogenital RadiologyLate Adverse Reactions to Intravascular Iodinated Contrast Media. Eur Radiol (2003) 13(1):181–4. doi: 10.1007/s00330-002-1650-5
24. Davenport MS, Perazella MA, Yee J, Dillman JR, Fine D, McDonald RJ, et al. Use of Intravenous Iodinated Contrast Media in Patients With Kidney Disease: Consensus Statements From the American College of Radiology and the National Kidney Foundation. Radiology (2020) 294(3):660–8. doi: 10.1148/radiol.2019192094
25. Perisinakis K, Tzedakis A, Spanakis K, Papadakis AE, Hatzidakis A, Damilakis J. The Effect of Iodine Uptake on Radiation Dose Absorbed by Patient Tissues in Contrast Enhanced CT Imaging: Implications for CT Dosimetry. Eur Radiol (2018) 28(1):151–8. doi: 10.1007/s00330-017-4970-1
26. Li Y, Huang X, Xia Y, Long L. Value of Radiomics in Differential Diagnosis of Chromophobe Renal Cell Carcinoma and Renal Oncocytoma. Abdom Radiol (NY) (2020) 45(10):3193–201. doi: 10.1007/s00261-019-02269-9
27. Huang YL, Chen JH, Shen WC. Diagnosis of Hepatic Tumors With Texture Analysis in Nonenhanced Computed Tomography Images. Acad Radiol (2006) 13(6):713–20. doi: 10.1016/j.acra.2005.07.014
28. Bioulac-Sage P, Balabaud C, Wanless IR. Diagnosis of Focal Nodular Hyperplasia: Not So Easy. Am J Surg Pathol (2001) 25(10):1322–5. doi: 10.1097/00000478-200110000-00015
29. Taylor HM, Ros PR. Hepatic Imaging: An Overview. Radiol Clin N Am (1998) 36(2):237e45. doi: 10.1016/S0033-8389(05)70019-1
Keywords: liver neoplasms, multidetector computed tomography, diagnosis, computer-aided design, radiomics, medical oncology
Citation: Zhao X, Liang P, Yong L, Jia Y and Gao J (2022) Radiomics Study for Differentiating Focal Hepatic Lesions Based on Unenhanced CT Images. Front. Oncol. 12:650797. doi: 10.3389/fonc.2022.650797
Received: 08 January 2021; Accepted: 30 March 2022;
Published: 27 April 2022.
Edited by:
Yi Dong, Fudan University, ChinaReviewed by:
Spencer Behr, University of California, San Francisco, United StatesQian Zhou, The First Affiliated Hospital of Sun Yat-sen University, China
Copyright © 2022 Zhao, Liang, Yong, Jia and Gao. This is an open-access article distributed under the terms of the Creative Commons Attribution License (CC BY). The use, distribution or reproduction in other forums is permitted, provided the original author(s) and the copyright owner(s) are credited and that the original publication in this journal is cited, in accordance with accepted academic practice. No use, distribution or reproduction is permitted which does not comply with these terms.
*Correspondence: Jianbo Gao, gaojianbo0307@163.com